Author Contributions
Conceptualization, D.R., S.A. and A.L.; data curation, R.L. and J.G.; formal analysis, D.R., R.L. and J.G.; funding acquisition, D.R., S.A. and A.L.; investigation, D.R. and M.O.; methodology, D.R., M.O., S.A., R.L., J.G. and A.L.; project administration, D.R. and A.L.; resources, S.A., S.K., G.S. and A.L.; software, R.L. and J.G.; supervision, D.R., S.A., S.K., G.S. and A.L.; validation, D.R. and A.L.; visualization, D.R.; writing—original draft preparation, D.R.; writing—review and editing, S.A. and A.L. All authors have read and agreed to the published version of the manuscript.
Figure 1.
Model predicting mealworm larvae mortality based on the percentage of carrot pomace in the substrate (remainder is wheat bran). Values in red are potato, green is carrot, and blue is carrot pomace. Since there was no significant difference (p > 0.05) between the moisture sources, the blue line represented in the figure is the model fit representing the relationship between the mealworm larvae mortality and % carrot pomace in the substrate.
Figure 2.
Model predicting mealworm larvae days to pupation based on the percentage of carrot pomace in the substrate (remainder is wheat bran) and the moisture source (potato in red, carrot in green, carrot pomace in blue). The red, green, and blue lines are the independent model fits for the results of potato, carrot, and carrot pomace moisture sources, respectively.
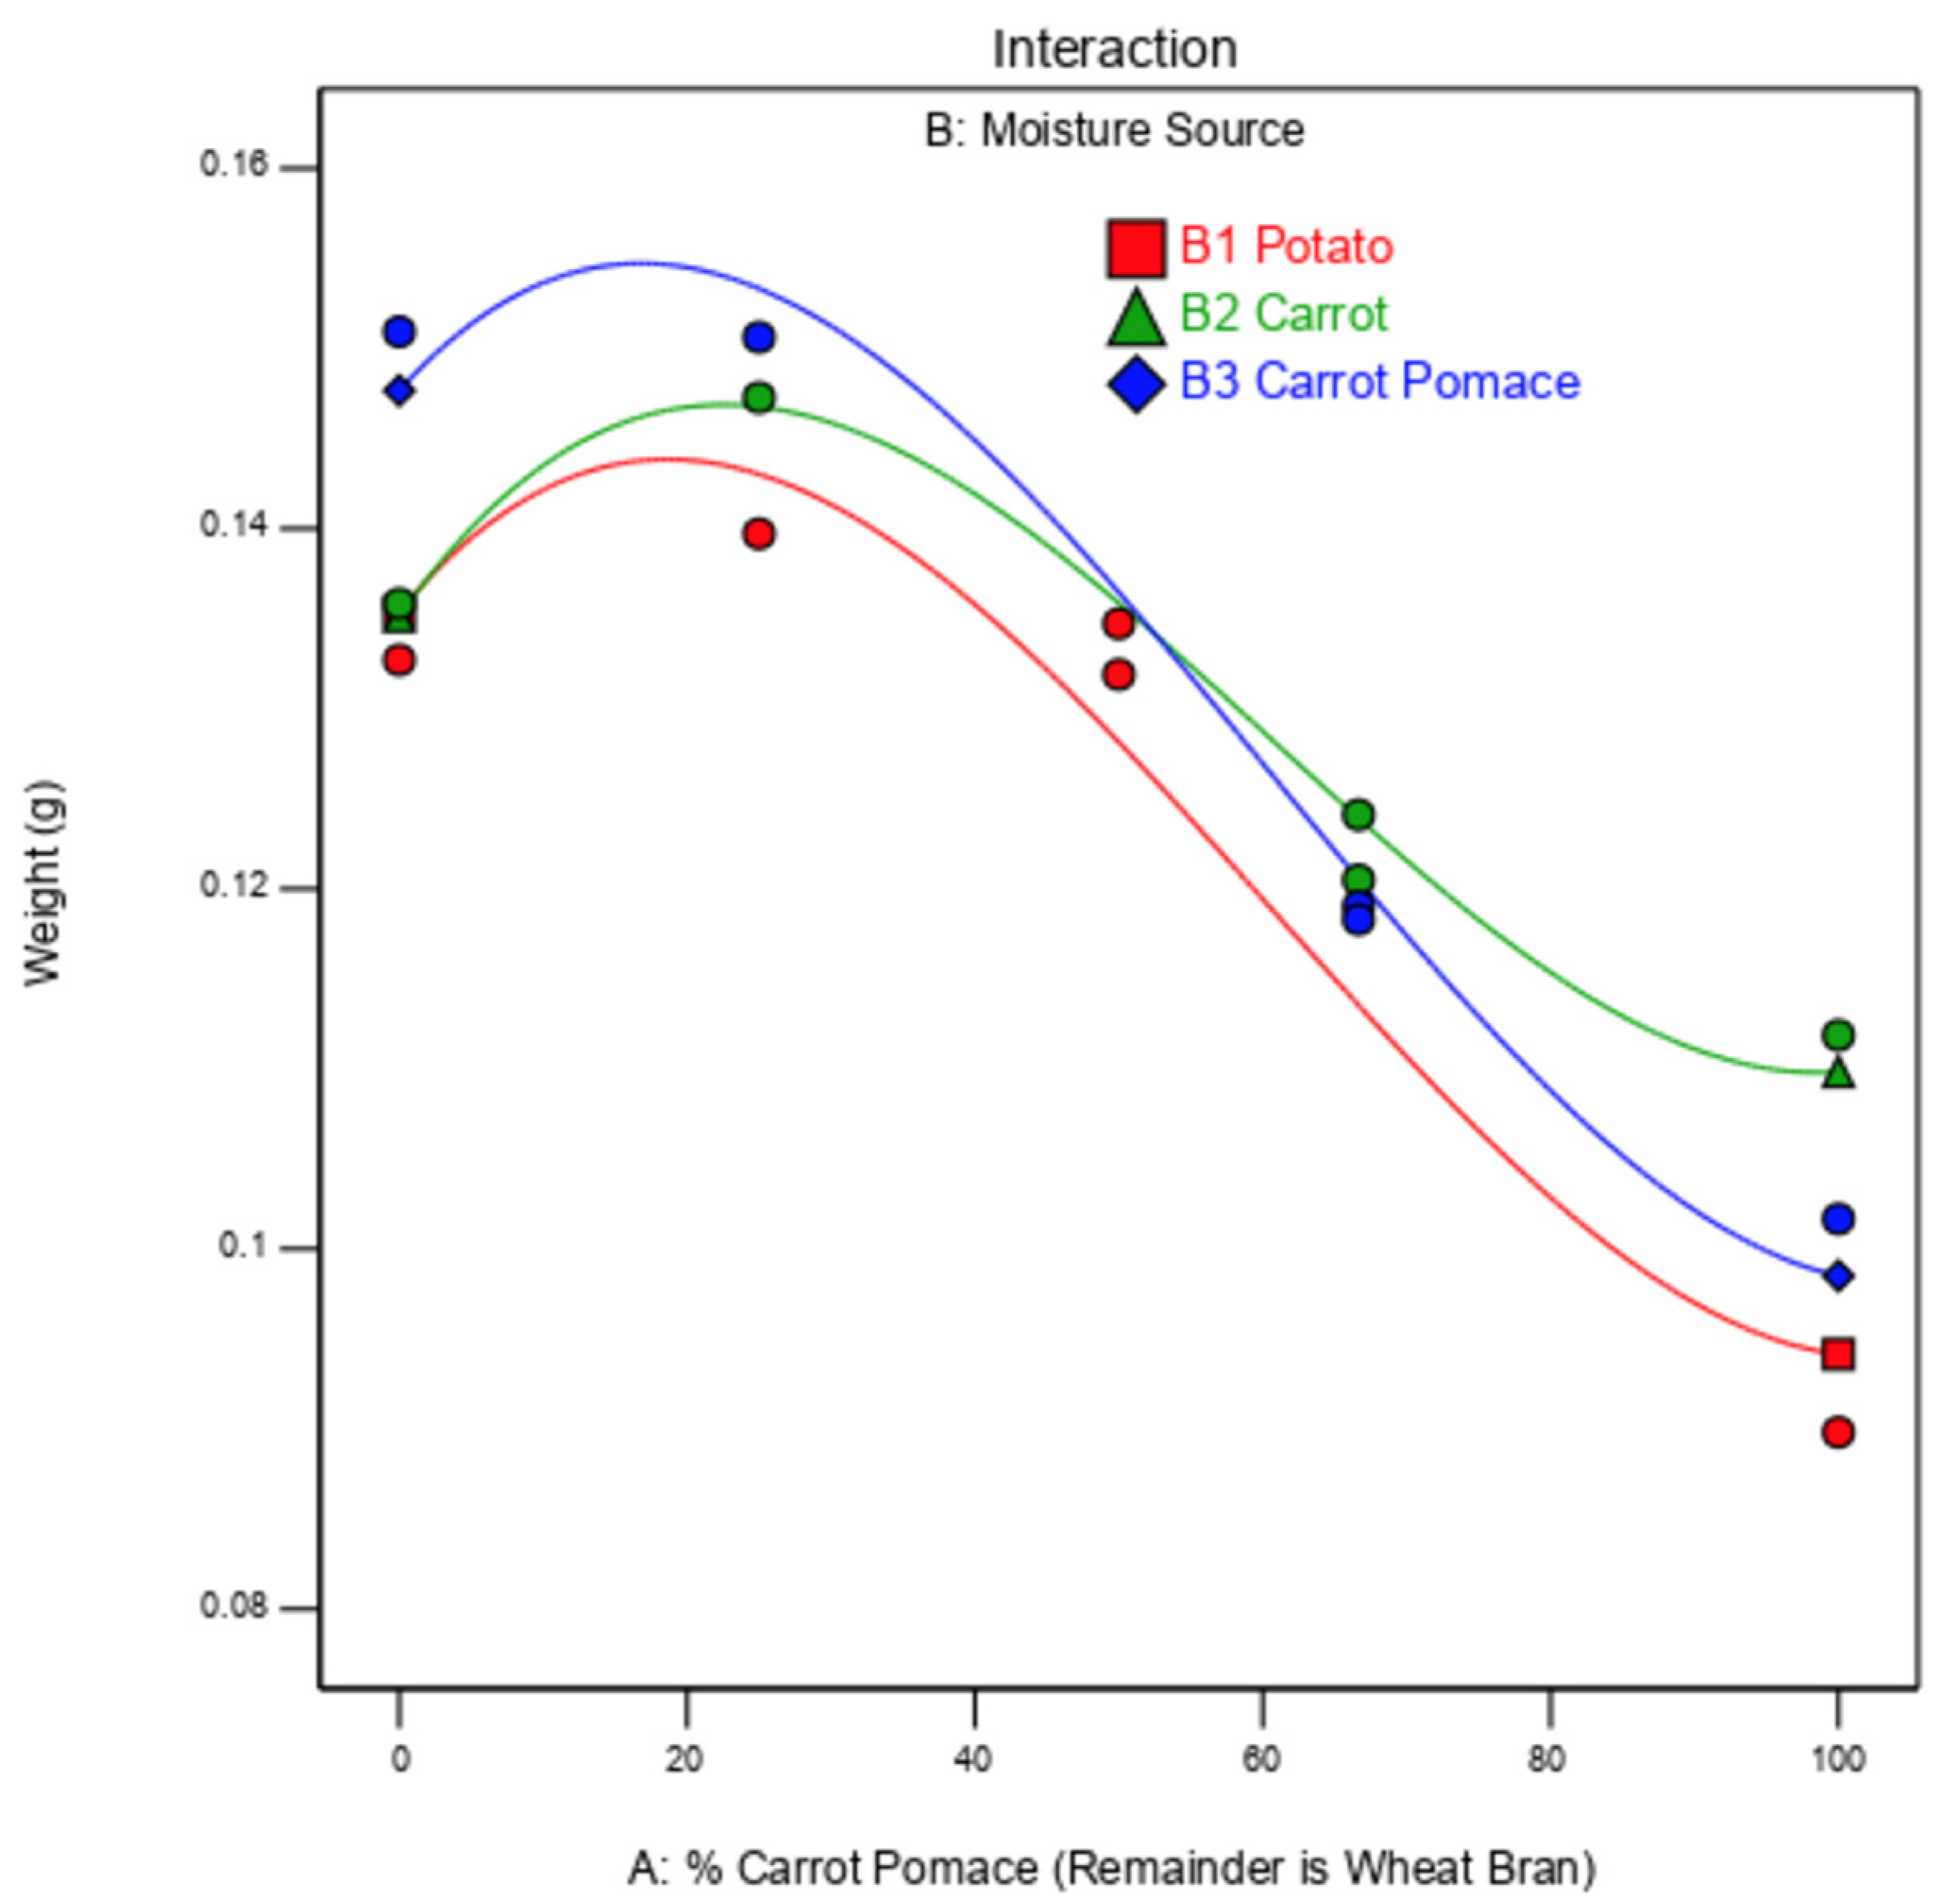
Figure 3.
Model predicting mealworm larvae weight based on the percentage of carrot pomace in the substrate (remainder is wheat bran) and the moisture source (potato in red, carrot in green, carrot pomace in blue). The red, green, and blue lines are the independent model fits for the results of potato, carrot, and carrot pomace moisture sources, respectively.
Figure 4.
Model predicting mealworm larvae moisture content based on the percentage of carrot pomace in the substrate (remainder is wheat bran) and the moisture source (potato in red, carrot in green, carrot pomace in blue). The red, green, and blue lines are the independent model fits for the results of potato, carrot, and carrot pomace moisture sources, respectively.
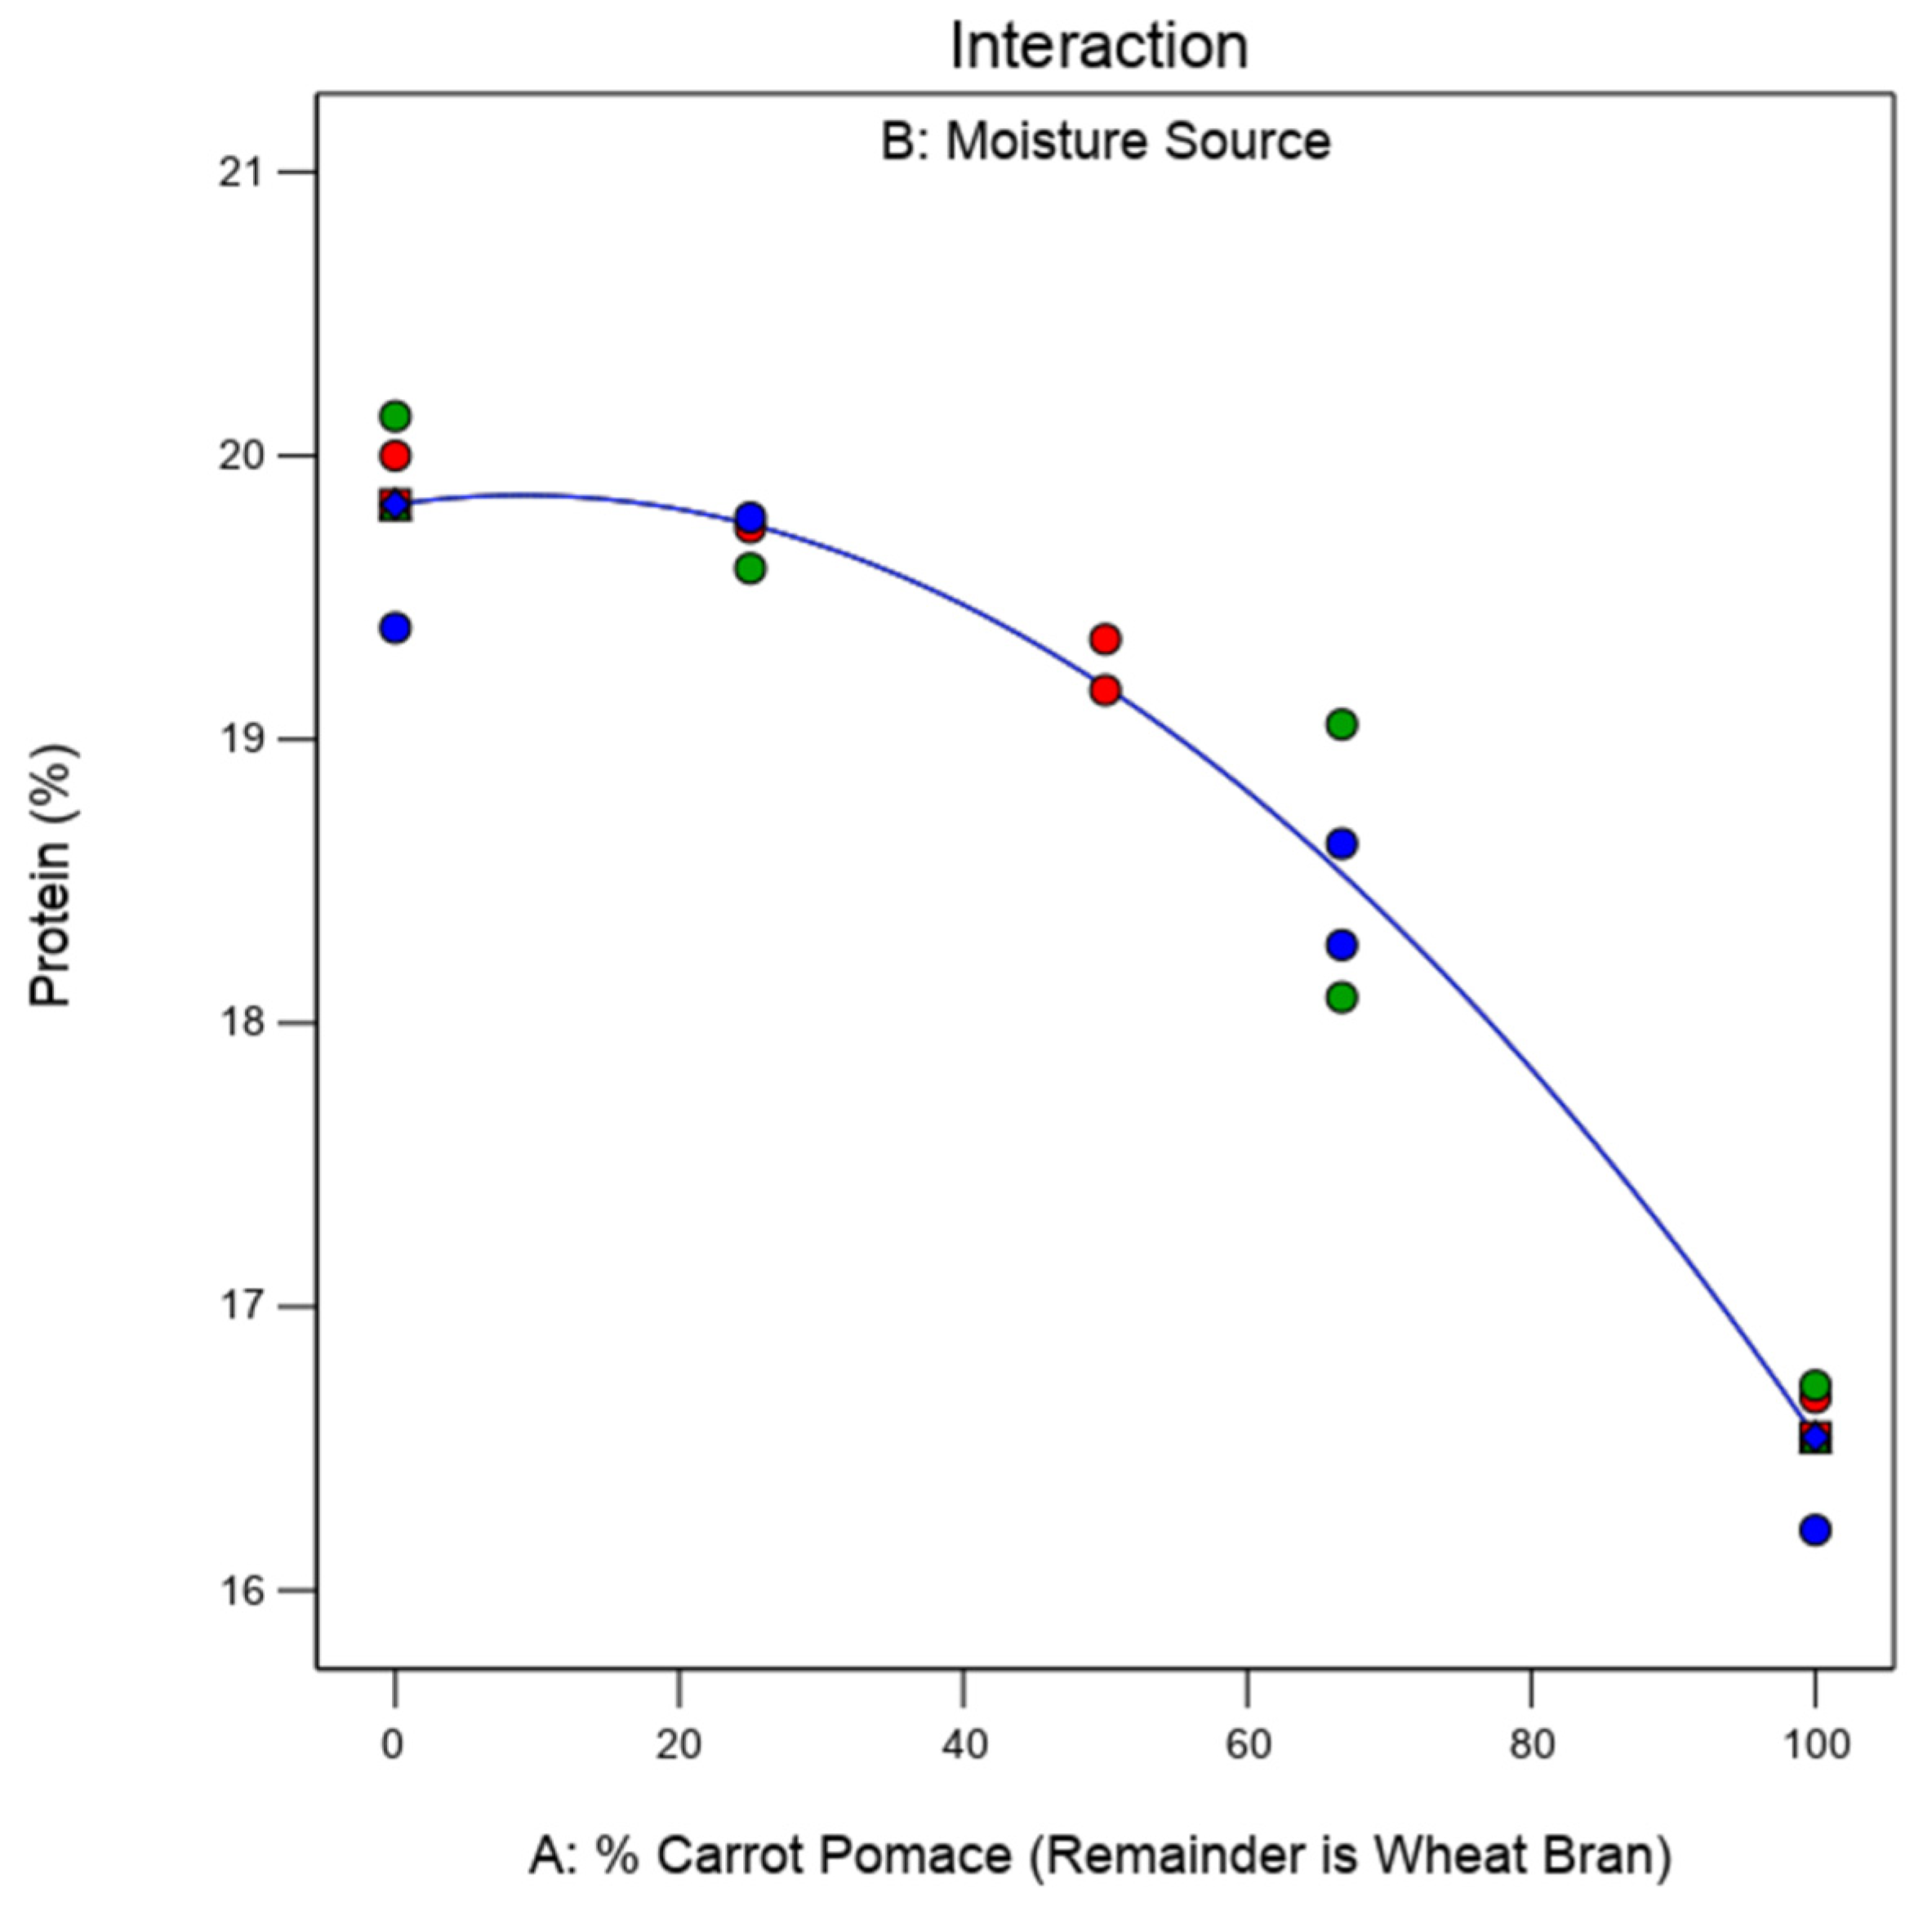
Figure 5.
Model predicting mealworm larvae protein content based on the percentage of carrot pomace in the substrate (remainder is wheat bran). Values in red are potato, green is carrot, and blue is carrot pomace. Since there was no significant difference (p > 0.05) between the moisture sources, the blue line represented in the figure is the model fit representing the relationship between the % protein and % carrot pomace in the substrate.
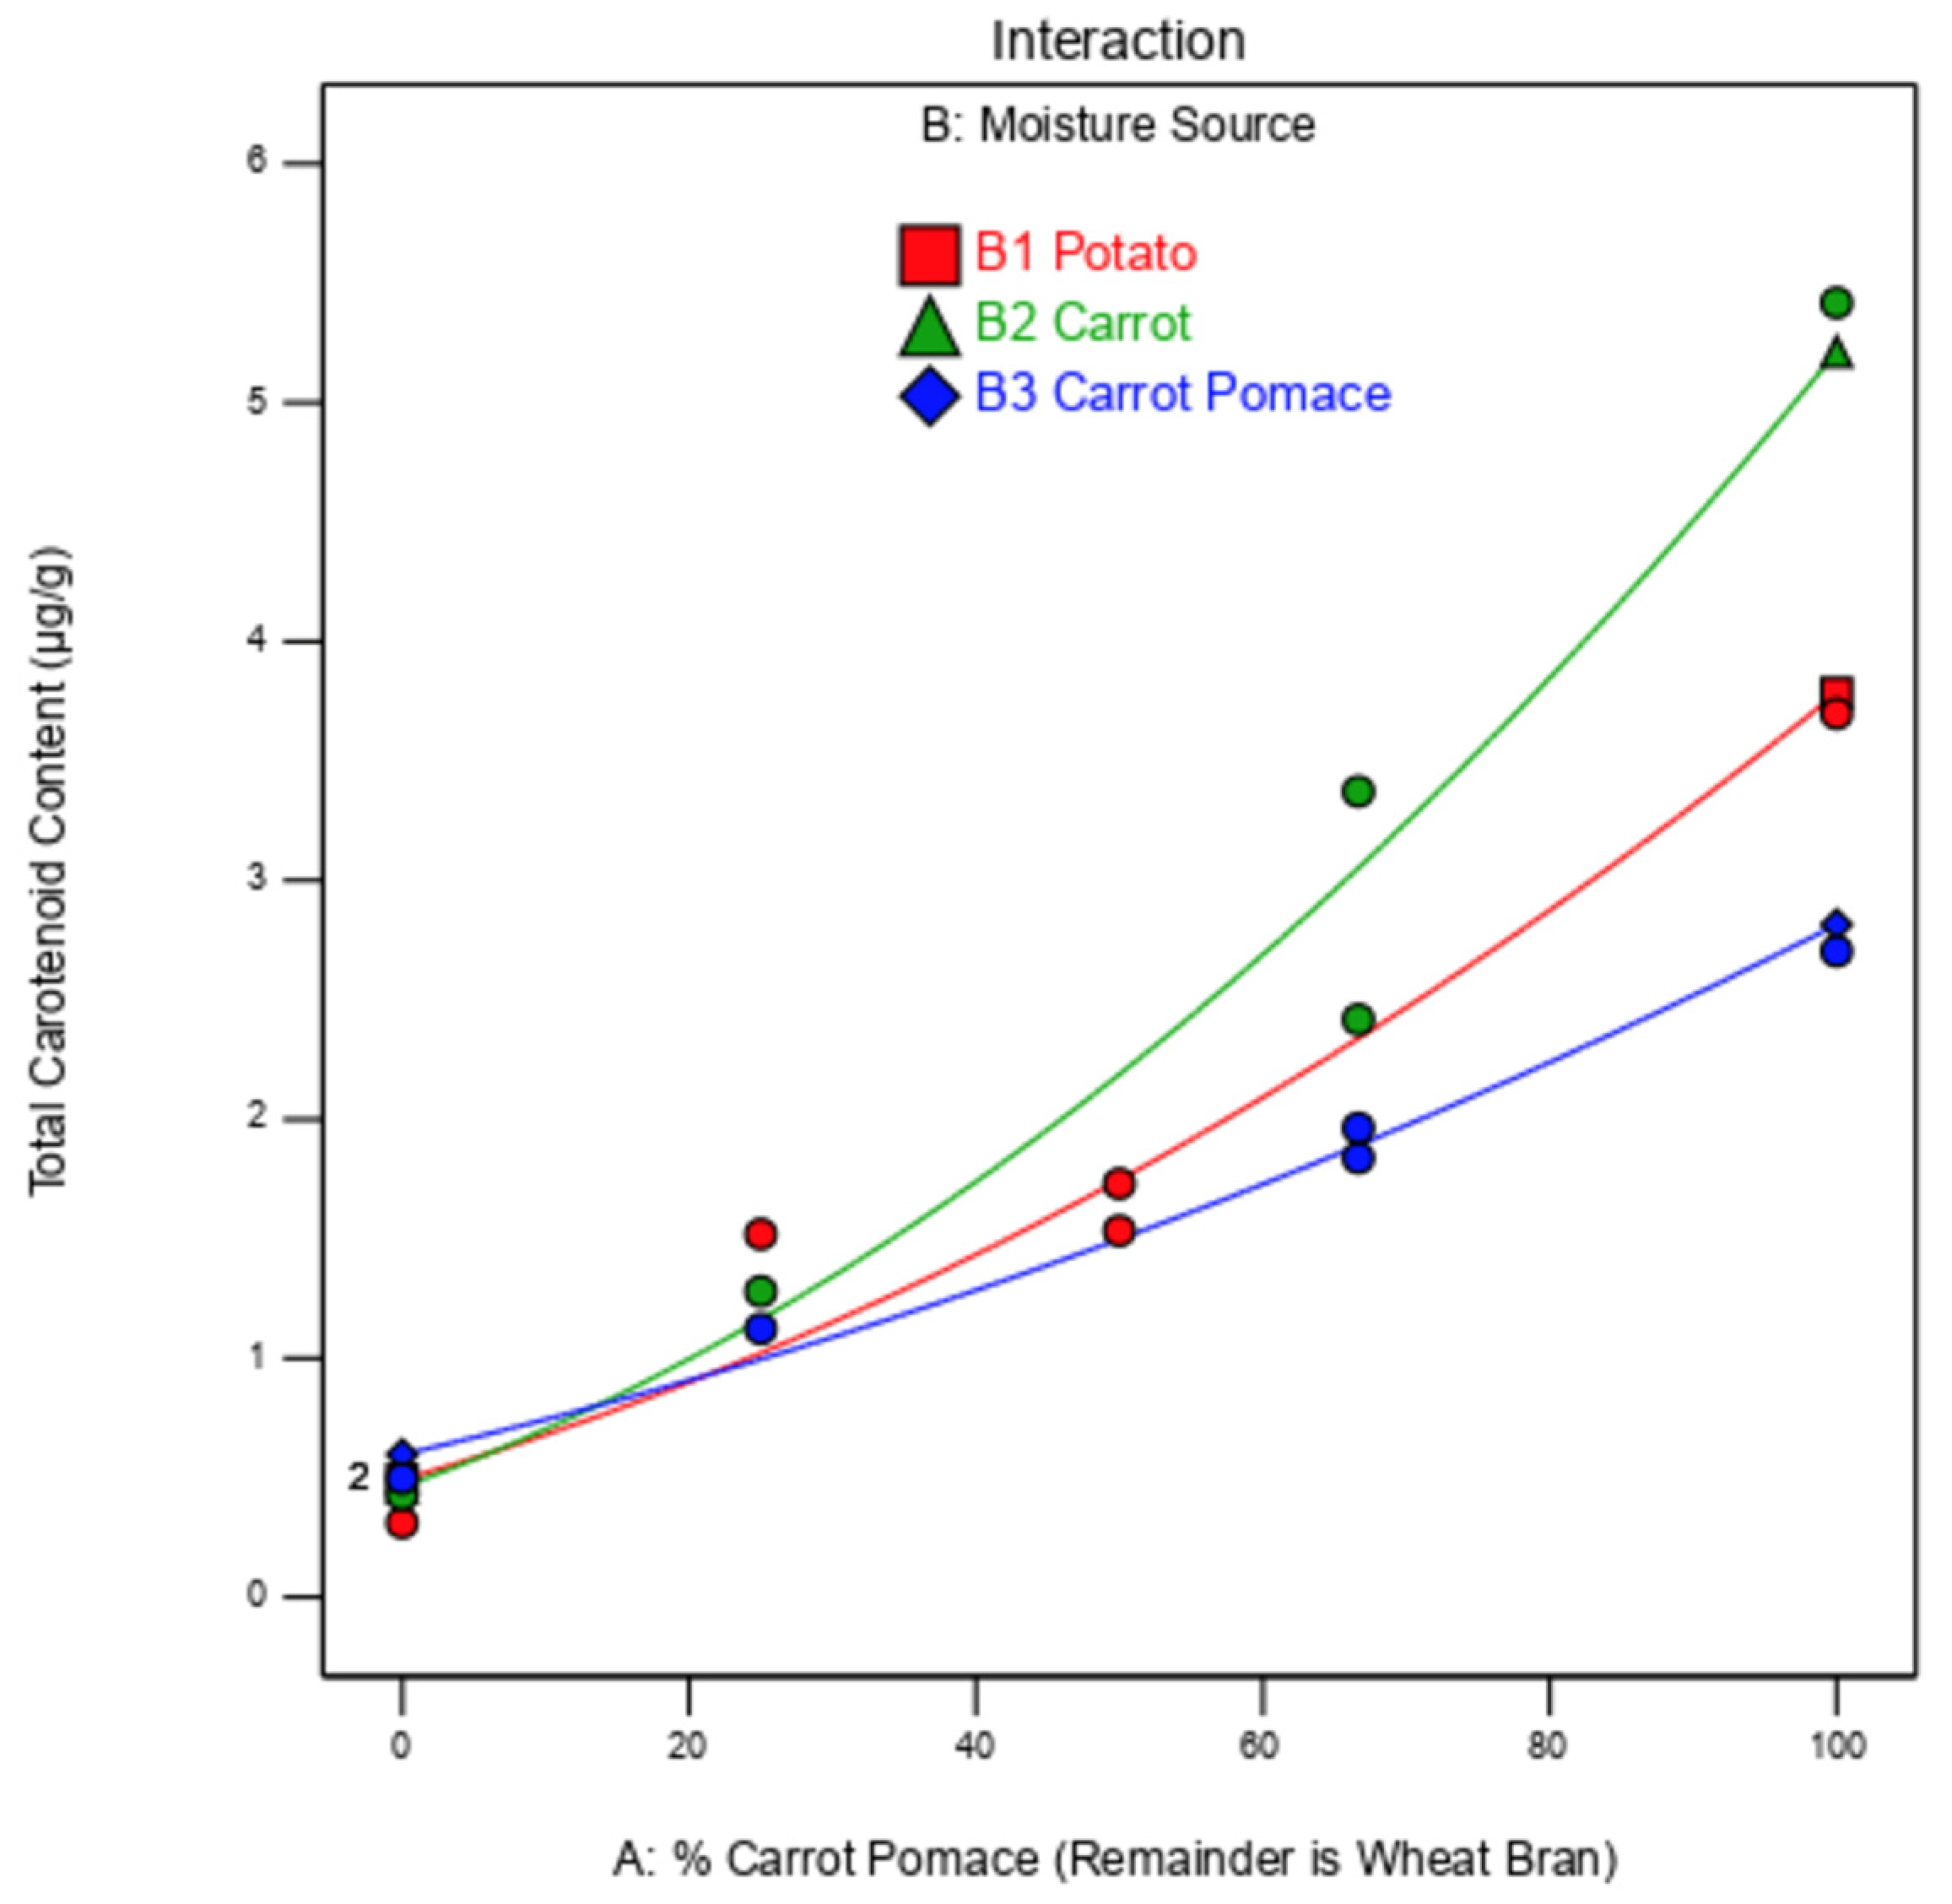
Figure 6.
Model predicting mealworm larvae total carotenoid content based on the percentage of carrot pomace in the substrate (remainder is wheat bran) and the moisture source (potato in red, carrot in green, carrot pomace in blue). The red, green, and blue lines are the independent model fits for the results of potato, carrot, and carrot pomace, respectively.
Table 1.
Mealworm growing experimental design.
Table 1.
Mealworm growing experimental design.
| Treatment | Percent Dried Carrot Pomace (Balance with Wheat Bran) | Moisture Source |
|---|
| 1 | 25 | Carrot Pomace |
| 2 | 100 | Carrot |
| 3 | 25 | Potato |
| 4 | 50 | Potato |
| 5 | 50 | Potato |
| 6 | 67 | Carrot |
| 7 | 67 | Carrot Pomace |
| 8 | 0 | Potato |
| 9 | 100 | Carrot Pomace |
| 10 | 0 | Carrot |
| 11 | 67 | Carrot Pomace |
| 12 | 25 | Carrot |
| 13 | 0 | Carrot Pomace |
| 14 | 100 | Potato |
| 15 | 67 | Carrot |
Table 2.
Dependent variable transformations used for statistical analysis.
Table 2.
Dependent variable transformations used for statistical analysis.
| Dependent Variable | Transformation |
|---|
| Mortality (% initial population) | Inverse square root |
| Days to 5% pupation | None |
| Mealworm larvae weight (g) | None |
| Total carotenoid content (μg/g) | Square root |
| Moisture (%) | None |
| Ash (%) | None |
| Protein (%) | None |
| Fat (%) | None |
Table 3.
Composition of substrate and moisture sources used for mealworm larvae growing (on a wet basis). Different letters within a column indicate significant differences.
Table 3.
Composition of substrate and moisture sources used for mealworm larvae growing (on a wet basis). Different letters within a column indicate significant differences.
| Feed | Type | Moisture (%) | Ash (%) | Protein (%) | Fat (%) | Carbohydrates (%) | Total Carotenoids (μg/g) |
|---|
| Wheat bran | Substrate | 6.47 D | 4.12 B | 15.92 A | 2.34 A | 71.15 B | 1.48 C |
| Carrot pomace (dried) | Substrate | 1.63 E | 6.10 A | 7.95 B | 1.31 B | 83.01 A | 1109.46 A |
| Potato | Moisture | 78.51 C | 1.18 C | 2.02 C | 0.03 C | 18.26 C | 0.49 C |
| Carrot | Moisture | 85.24 B | 1.13 C | 1.16 D | 0.04 C | 12.43 D | 127.09 B |
| Carrot pomace (wet) | Moisture | 90.36 A | 0.60 D | 1.09 D | 0.05 C | 7.90 E | 144.64 B |
Table 4.
ANOVA table and fit statistics for mealworm larvae mortality.
Table 4.
ANOVA table and fit statistics for mealworm larvae mortality.
| Source | Sum of Squares | df | Mean Square | F-Value | p-Value | | Fit Statistics | |
|---|
| Model | 0.0918 | 1 | 0.0918 | 10.5 | 0.0064 | significant | R2 | 0.4469 |
| A-% Carrot Pomace (Remainder is Wheat Bran) | 0.0918 | 1 | 0.0918 | 10.5 | 0.0064 | | Adjusted R2 | 0.4044 |
| Residual | 0.1137 | 13 | 0.0087 | | | | Predicted R2 | 0.2704 |
| Lack of Fit | 0.0816 | 10 | 0.0082 | 0.7633 | 0.6753 | not significant | Adeq Precision | 6.619 |
| Pure Error | 0.0321 | 3 | 0.0107 | | | | | |
| Cor Total | 0.2055 | 14 | | | | | | |
Table 5.
ANOVA table and fit statistics for days to pupation.
Table 5.
ANOVA table and fit statistics for days to pupation.
| Source | Sum of Squares | df | Mean Square | F-Value | p-Value | | Fit Statistics |
|---|
| Model | 4778.14 | 7 | 682.59 | 218.53 | <0.0001 | significant | R2 | 0.9954 |
| A-% Carrot Pomace (Remainder is Wheat Bran) | 2341.3 | 1 | 2341.3 | 749.58 | <0.0001 | | Adjusted R2 | 0.9909 |
| B-Moisture Source | 157.09 | 2 | 78.54 | 25.15 | 0.0006 | | Predicted R2 | 0.9746 |
| AB | 62.96 | 2 | 31.48 | 10.08 | 0.0087 | | Adeq Precision | 42.8089 |
| A2 | 1990.36 | 1 | 1990.36 | 637.22 | <0.0001 | | | |
| A3 | 196.13 | 1 | 196.13 | 62.79 | <0.0001 | | | |
| Residual | 21.86 | 7 | 3.12 | | | | | |
| Lack of Fit | 14.86 | 4 | 3.72 | 1.59 | 0.3659 | not significant | | |
| Pure Error | 7 | 3 | 2.33 | | | | | |
| Cor Total | 4800 | 14 | | | | | | |
Table 6.
ANOVA table and fit statistics for mealworm larvae weight.
Table 6.
ANOVA table and fit statistics for mealworm larvae weight.
| Source | Sum of Squares | df | Mean Square | F-Value | p-Value | | Fit Statistics |
|---|
| Model | 0.0042 | 7 | 0.0006 | 28.72 | 0.0001 | significant | R2 | 0.9663 |
| A-% Carrot Pomace (Remainder is Wheat Bran) | 0.0033 | 1 | 0.0033 | 159.51 | <0.0001 | | Adjusted R2 | 0.9327 |
| B-Moisture Source | 0.0002 | 2 | 0.0001 | 4.61 | 0.0527 | | Predicted R2 | 0.6652 |
| AB | 0.0002 | 2 | 0.0001 | 4.35 | 0.0592 | | Adeq Precision | 17.7392 |
| A2 | 0.0004 | 1 | 0.0004 | 19.51 | 0.0031 | | | |
| A3 | 0.0003 | 1 | 0.0003 | 12.61 | 0.0093 | | | |
| Residual | 0.0001 | 7 | 0 | | | | | |
| Lack of Fit | 0.0001 | 4 | 0 | 9.39 | 0.0481 | significant | | |
| Pure Error | 0 | 3 | 3.6x10⁻⁶ | | | | | |
| Cor Total | 0.0043 | 14 | | | | | | |
Table 7.
ANOVA and fit statistics for mealworm moisture content.
Table 7.
ANOVA and fit statistics for mealworm moisture content.
| Source | Sum of Squares | df | Mean Square | F-Value | p-Value | | Fit Statistics |
|---|
| Model | 33.66 | 5 | 6.73 | 29.75 | <0.0001 | significant | R2 | 0.9429 |
| A-% Carrot Pomace (Remainder is Wheat Bran) | 20.58 | 1 | 20.58 | 90.92 | <0.0001 | | Adjusted R2 | 0.9112 |
| B-Moisture Source | 3.8 | 2 | 1.9 | 8.39 | 0.0088 | | Predicted R2 | 0.8374 |
| A2 | 3.23 | 1 | 3.23 | 14.25 | 0.0044 | | Adeq Precision | 17.6815 |
| A3 | 5.81 | 1 | 5.81 | 25.65 | 0.0007 | | | |
| Residual | 2.04 | 9 | 0.2263 | | | | | |
| Lack of Fit | 1.56 | 6 | 0.2606 | 1.65 | 0.3648 | not significant | | |
| Pure Error | 0.4735 | 3 | 0.1578 | | | | | |
| Cor Total | 35.7 | 14 | | | | | | |
Table 8.
ANOVA table and fit statistics for mealworm larvae protein content.
Table 8.
ANOVA table and fit statistics for mealworm larvae protein content.
| Source | Sum of Squares | df | Mean Square | F-Value | p-Value | | Fit Statistics |
|---|
| Model | 21.75 | 2 | 10.88 | 122.04 | <0.0001 | significant | R2 | 0.9531 |
| A-% Carrot Pomace (Remainder is Wheat Bran) | 19.42 | 1 | 19.42 | 217.91 | <0.0001 | | Adjusted R2 | 0.9453 |
| A2 | 2.79 | 1 | 2.79 | 31.33 | 0.0001 | | Predicted R2 | 0.923 |
| Residual | 1.07 | 12 | 0.0891 | | | | Adeq Precision | 24.6286 |
| Lack of Fit | 0.527 | 9 | 0.0586 | 0.3238 | 0.9174 | not significant | | |
| Pure Error | 0.5425 | 3 | 0.1808 | | | | | |
| Cor Total | 22.82 | 14 | | | | | | |
Table 9.
ANOVA table and fit statistics for mealworm larvae carotenoid content.
Table 9.
ANOVA table and fit statistics for mealworm larvae carotenoid content.
| Source | Sum of Squares | df | Mean Square | F-Value | p-Value | | Fit Statistics |
|---|
| Model | 3.2 | 5 | 0.6392 | 42.02 | <0.0001 | significant | R2 | 0.9589 |
| A-% Carrot Pomace (Remainder is Wheat Bran) | 2.82 | 1 | 2.82 | 185.52 | <0.0001 | | Adjusted R2 | 0.9361 |
| B-Moisture Source | 0.1823 | 2 | 0.0912 | 5.99 | 0.0221 | | Predicted R2 | 0.8954 |
| AB | 0.1515 | 2 | 0.0758 | 4.98 | 0.035 | | Adeq Precision | 20.6605 |
| Residual | 0.1369 | 9 | 0.0152 | | | | | |
| Lack of Fit | 0.0933 | 6 | 0.0155 | 1.07 | 0.52 | not significant | | |
| Pure Error | 0.0436 | 3 | 0.0145 | | | | | |
| Cor Total | 3.33 | 14 | | | | | | |
Table 10.
Predicted growth and composition of mealworm larvae fed optimum diet—36% carrot pomace and carrot pomace moisture source.
Table 10.
Predicted growth and composition of mealworm larvae fed optimum diet—36% carrot pomace and carrot pomace moisture source.
| Factor | Level |
|---|
| Mortality (% initial population dead) | 1.91 |
| Days to 5% pupation | 37 |
| Weight (g) | 0.148 |
| Total carotenoid content (μg/g) | 1.20 |
| Moisture (%) | 62.24 |
| Protein (%) | 19.57 |


 ,
, 


