Article

Current (2020) and Long-Term (2035 and 2050) Sustainable Potentials of Wood Fuel in Switzerland

Federal Institute for Forest, Snow and Landscape Research (WSL), Zürcherstrasse 111, CH-8903 Birmensdorf, Switzerland
*
Author to whom correspondence should be addressed.
Sustainability 2020, 12(22), 9749; https://doi.org/10.3390/su12229749
Submission received: 28 September 2020 / Revised: 10 November 2020 / Accepted: 12 November 2020 / Published: 23 November 2020
(This article belongs to the Special Issue Bioenergy and Biofuels)

Abstract

:
Wood fuel has become central in environmental policy and decision-making processes in cross-sectoral areas. Proper consideration of different types of woody biomass is fundamental in forming energy transition and decarbonization strategies. We quantified the development of theoretical (TPs) and sustainable (SPs) potentials of wood fuel from forests, trees outside forests, wood residues and waste wood in Switzerland for 2020, 2035 and 2050. Ecological and economic restrictions, timber market situations and drivers of future developments (area size, tree growth, wood characteristics, population growth, exporting/importing (waste wood)) were considered. We estimated a SP of wood fuel between 26.5 and 77.8 PJ/a during the three time points. Results demonstrate that the SP of wood fuel could be significantly increased already in the short term. This, as a moderate stock reduction (MSR) strategy in forests, can lead to large surpluses in SPs compared to the wood fuel already used today (~36 PJ/a), with values higher by 51% (+18.2 PJ) in 2020 and by 59% (+21.3 PJ) in 2035. To implement these surpluses (e.g., with a cascade approach), a more circular economy with sufficient processing capacities of the subsequent timber industries and the energy plants to convert the resources is required.

Graphical Abstract

1. Introduction

In several European countries, an interest in using natural renewable resources to support the transition to clean energy has risen [1] (e.g., [2,3,4]). Biomass, in particular, is seen as a promising source for renewable energy and its use could cover a significant share of the primary energy consumption by 2050 [5,6], thus contributing to the achievement of European decarbonization goals. Consequently, the use of woody biomass has received attention but also raised several concerns [7]. While some of these concerns are related to the low energy density and conversion efficiency of wood fuel compared to fossil energies, as well as externalities such as the impact on air quality (with effects on human health) [7,8], the issue of possible conflicts among the multiple goods and services provided by forests that an augmented demand of wood for bioenergy may cause is central.
Forests provide a wide range of goods and services and are relevant for policy and decision-making processes in cross-sectoral areas [9], and are under pressure due to biotic and abiotic agents, whose action is exacerbated by events related to climate change, such as the 2018 megadrought (e.g., [10]). Therefore, some tension exists between “demands for more intensive management of biomass from forests and the contributions made by the same biomass in situ to soil fertility, biodiversity and protective functions” [7]. Sustainable and climate-smart forest management (e.g., [11,12]), and the cascade use of wood in long-lived products combined with end utilization for energy production [13,14,15], represent two necessary prerequisites for any sustainable and climate-friendly use of woody biomass as bioenergy (hereafter referred to as wood fuel). Thus, wood may only be used for energy production at the end of its life cycle or when it is not suitable for further material processing.
Switzerland has a long tradition of sustainable forest management [16], with forest areas and growing stocks continuously increasing over the past 40 years [17]. In this context, the sustainable use of wood fuel from forests can further help in reducing carbon dioxide (CO2) emissions. It offers good opportunities to substitute energy and emission-intensive energy carriers and materials [18]. Moreover, it may support energy security and decarbonization strategies, while at the same time addressing multiple societal issues, e.g., solutions for the transportation sector and independence from imports [19,20]. Substituted products could be used for important high-end applications, such as the clean energy transition [21,22], urgent medicine, and the cosmetics, textile, and hardware industries.
Since wood fuel is intended to favor decarbonization processes, it is important that the interaction of forests with climate change is considered properly. Although younger, faster-growing forests usually have a higher rate of carbon uptake, it is the older forests with long-rotation periods and protected old-growth forests that have the highest carbon stocks. A key point for the sustainable use of wood fuel from forests is therefore the “payback time”, i.e., the number of years it takes to offset the carbon emissions generated by harvesting the forest and the emissions caused if used for bioenergy. From this perspective, by regulating stand density and the age of forests, forest management has a substantial role in ensuring sustainable and climate-smart use of forest wood resources. In order to balance out society’s manifold demands on forestry [23,24], any estimates of biomass availability should consider not only the theoretical potential, i.e., the upper limit of a given type of woody biomass available at a certain point in time, but also the sustainable potential, i.e., the share of the theoretical potential that can actually be used when other constraints (e.g. ecological) on management approaches are accounted for [20].
Many Central European countries refrain from full-tree use and have restricted the removal of small cutting volumes (non-commercial wood, e.g., slash, leaves and needles) in order to maintain nutrient cycles, soil quality as well as biodiversity. Forming technical projections and aspirational goals for future bioenergy can be difficult [23] but they are necessary, as stakeholders need reliable data on the development of woody biomass in order to plan infrastructures required for implementing the use of woody and non-woody biomass for energy [25]. In multiple studies, regional [26], national [20,27,28,29,30] and international [5,6,31,32] potentials of woody and non-woody biomass for energy use have been estimated. Results show that its use could be significantly increased in many countries already in the short term [20,33] and will most likely result in multiple advantages (e.g., [15,34,35,36,37]). However, as the availability of woody resources is limited [1,6], especially for energy purposes [20], knowledge is urgently needed on their (current and projected) availability in quantitative terms as well as the environmental and economic consequences of their use for bioenergy. While future estimates for non-woody biomass types exist [38,39], available estimates of wood fuel biomass potentials refer to specific types of woody biomass only, e.g., the biomass potential from short rotation coppices [40,41,42], from forests and other landscapes in urbanized regions [42], as well as biogenic waste and residues [43]. Estimates of the future availability of all woody biomass types at the country level is still missing.
With this study, we aim to investigate the availability of woody biomass feedstock resources originating from forests, trees from outside forests, residues and waste wood that can be used for wood fuel today (2020) and in the long term (2035; 2050). For all woody biomass types, we describe the time horizons and methods (frame), the connections between different wood types, their use, the uncertainty and its effects on the potentials, and the influence of different key drivers (i.e., factors that may drive the future availability of a given biomass type) on future estimates. The following specific research questions are addressed:
(i)
What sustainable potential of woody biomass feedstocks can be used for wood fuel today (2020) in the long term (2035; 2050), and what is the impact on the key drivers to predict future amount of wood fuel?
(ii)
What are realistic ranges of wood fuel predictions under different (a) forest management strategies, (b) ecological restrictions (e.g., protected areas, harvest losses), (c) wood markets (material use, recycling/upcycling) and (d) costs?
(iii)
What are the consequences of additional wood fuel use (e.g., effects of different costs)?
We focus on Switzerland as a case study, using data from the Swiss National Forest Inventory (NFI) [17] and models for future harvesting, forest management and wood fluxes. Additionally, the established framework of the Swiss Competence Center for Bioenergy Research (SCCER BIOSWEET) provided valuable results on the use of biomass for energy. Bridging and extending these activities was a chance to assess the development of all woody biomass types for energy use with a nationwide methodologically identical approach.

2. Materials and Methods

We applied a conceptual framework that explicitly incorporates the upper limit of annual wood fuel use, resulting in the theoretical (TP) and the sustainable potential (SP). Both are determined by ecological and socio-economic restrictions and assessed for four woody biomass types (wood fuel from forests, trees from outside forests, wood residues, waste wood; cf. Section 2.2).

2.1. Derivation of Wood Fuel Potentials

To estimate the wood fuel potentials (i), we considered (ii) three forest management strategies and (iii) three scenarios with different intensities of wood fuel use. Due to the influence of wood markets on the share of harvested wood allocated to material use, the classification into assortments was determined using (iv) two wood market situations. Finally, the consideration of (v) biomass-specific key drivers enabled the estimation of wood fuel potentials not only for today (2020) but also for future points in time (2035 and 2050) (Figure 1). In detail:
(i)
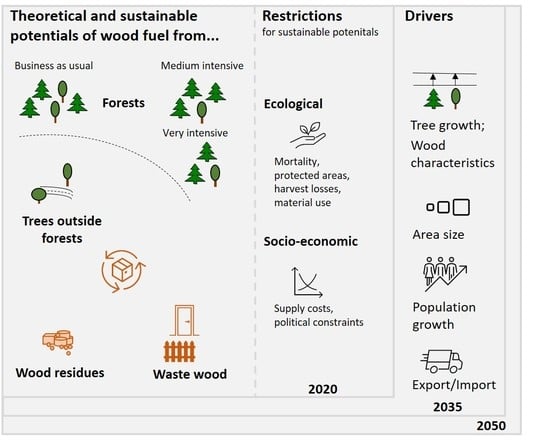
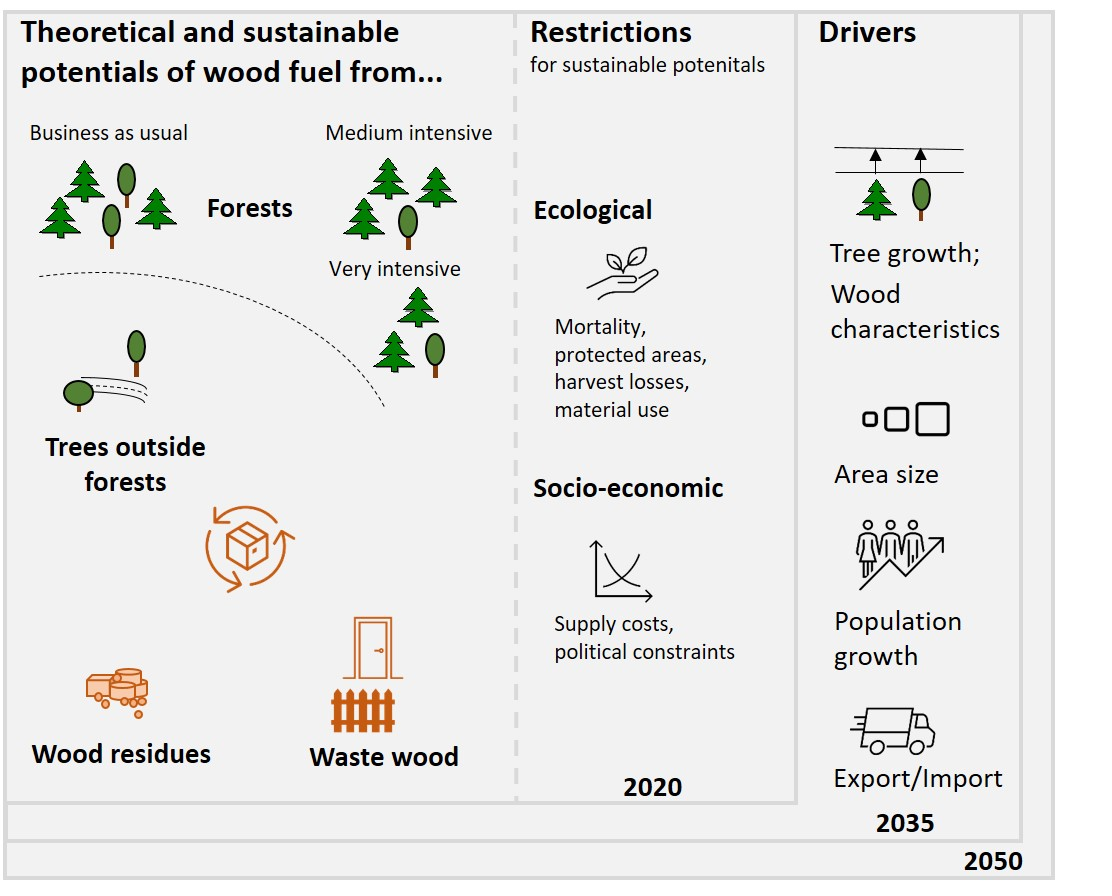
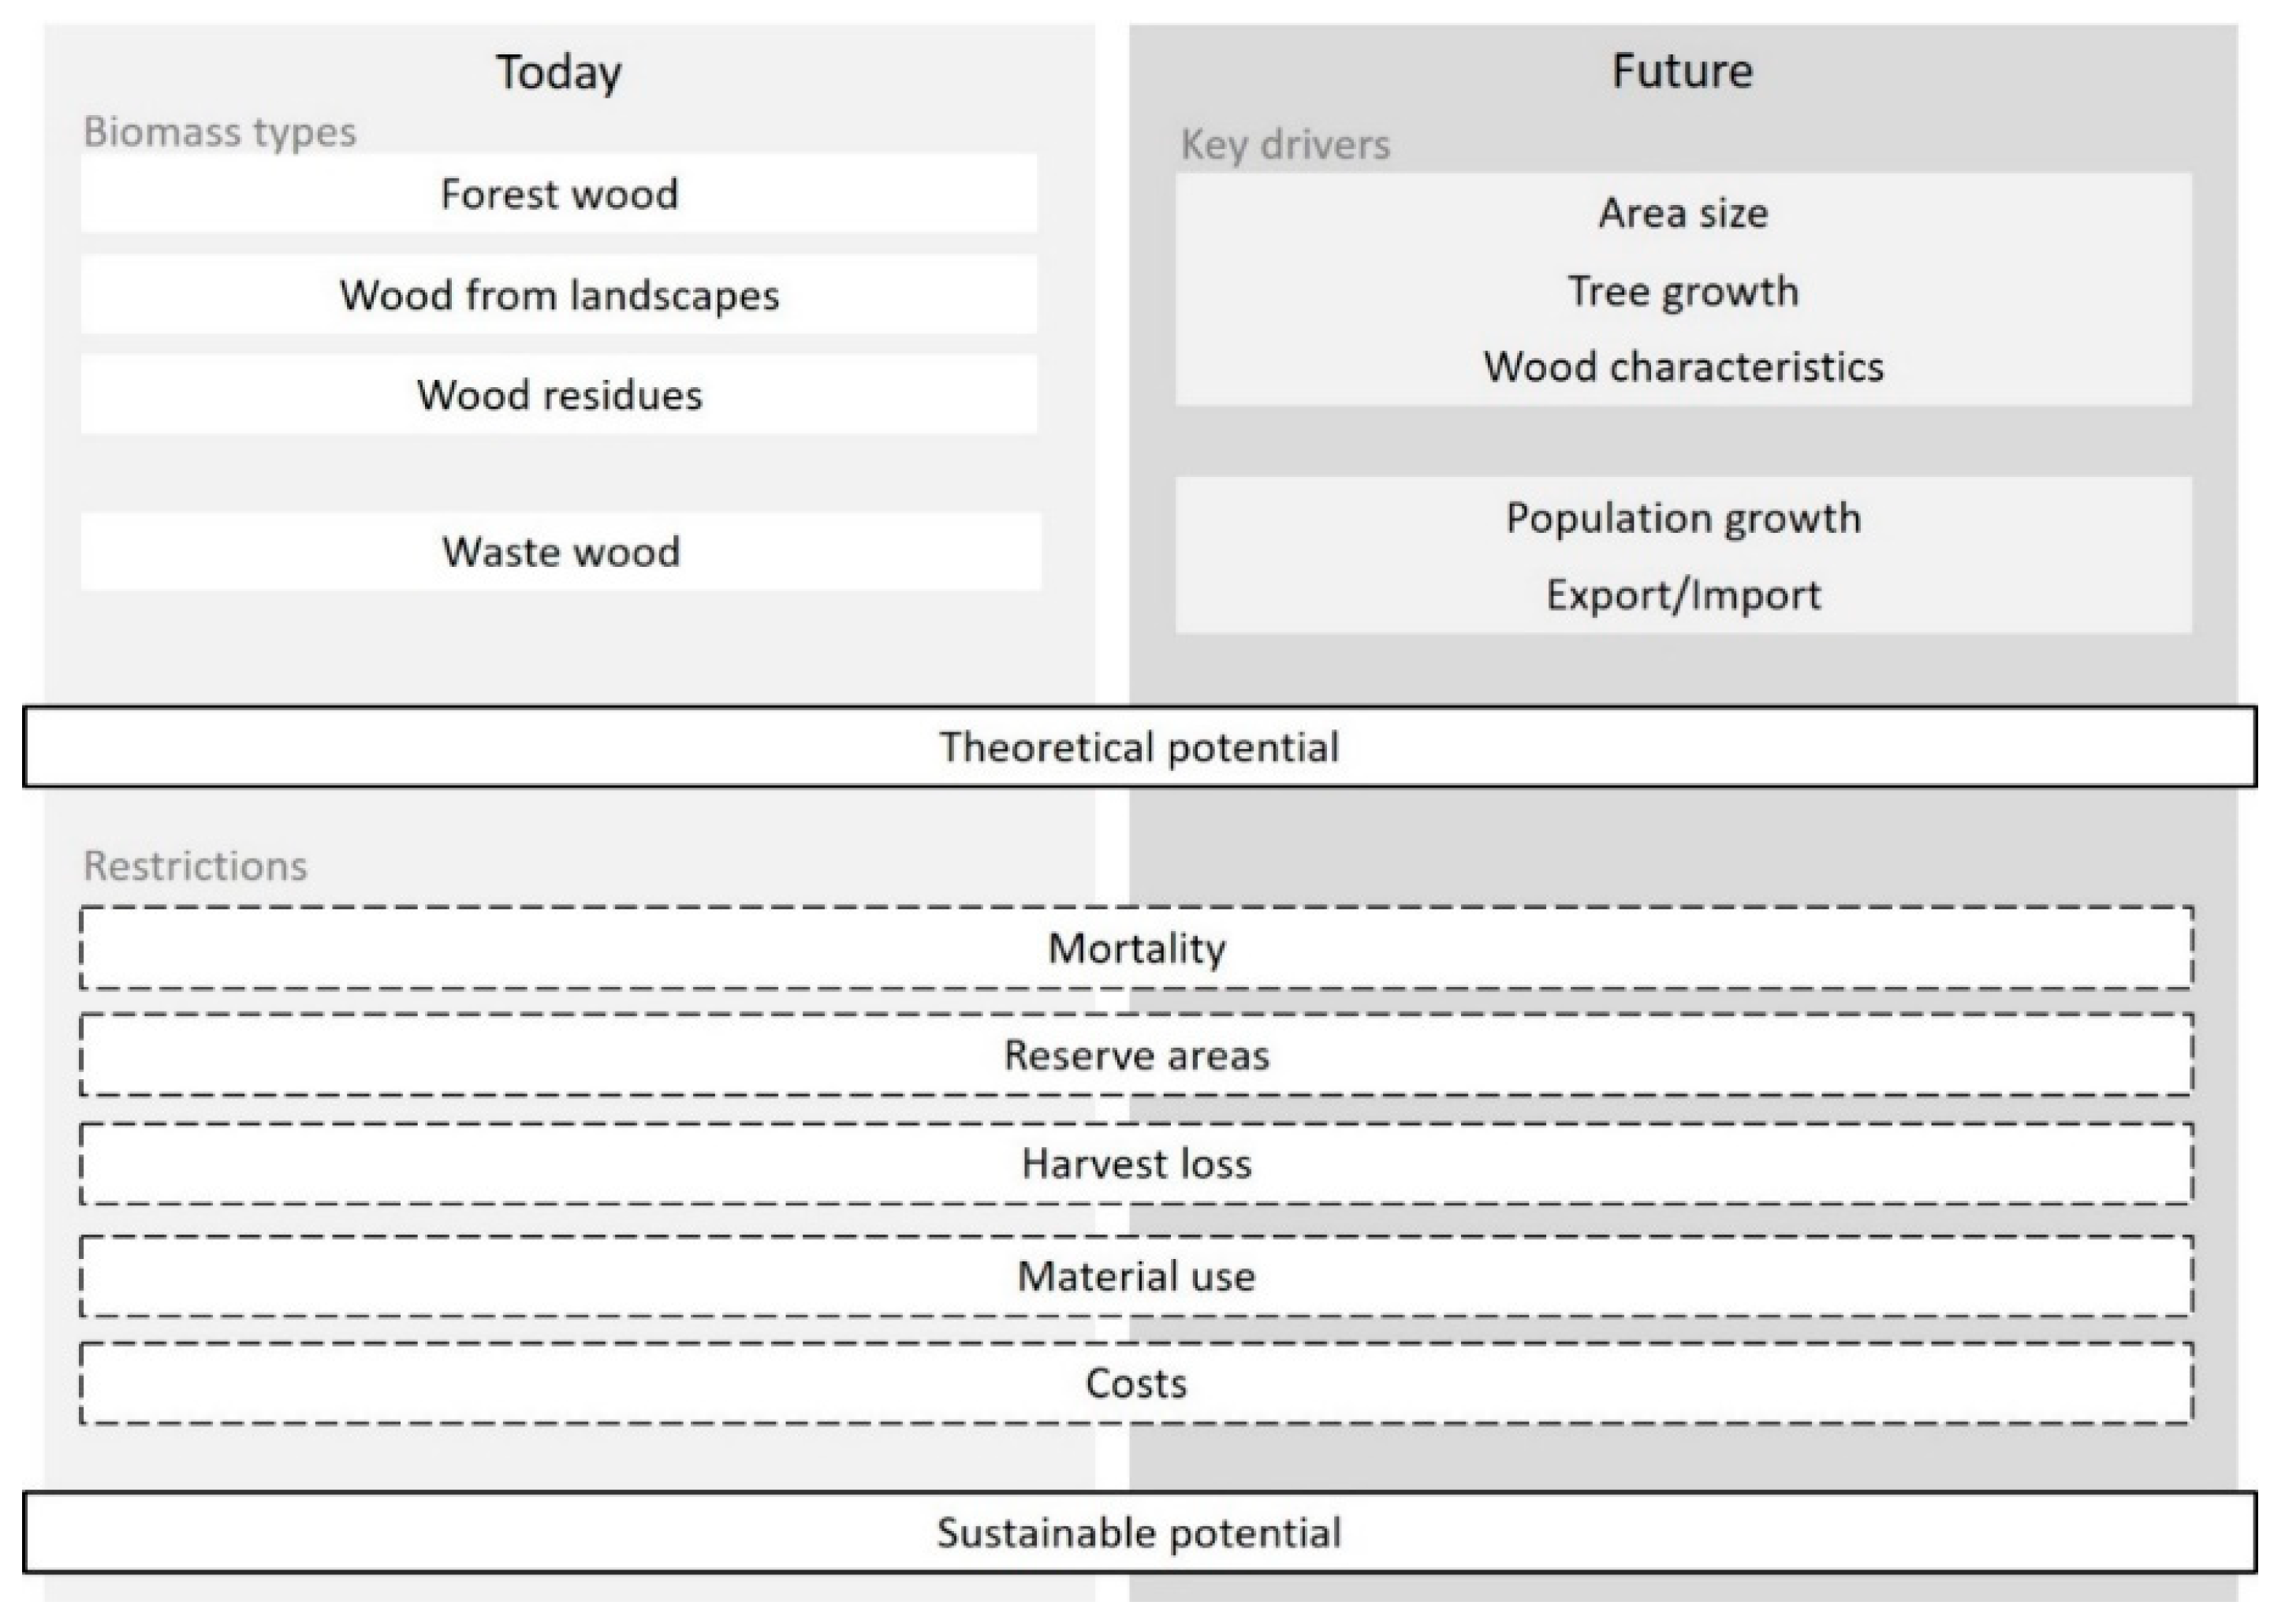
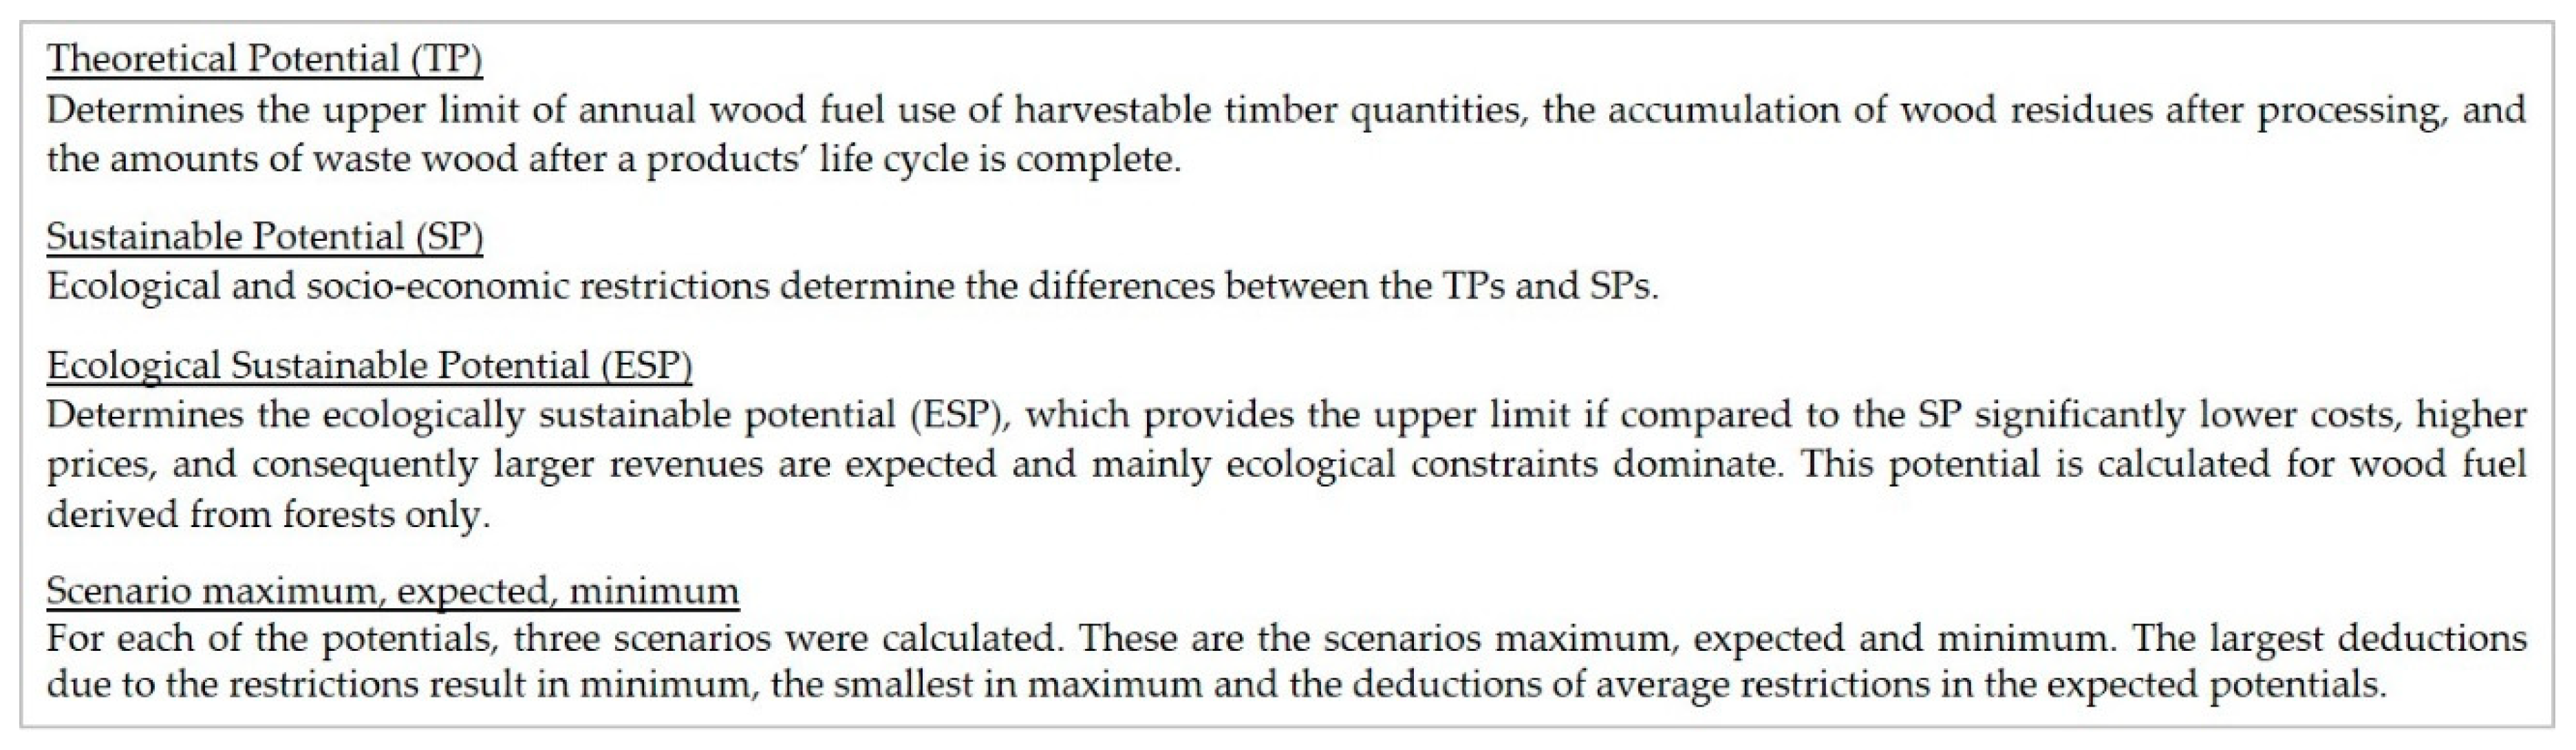
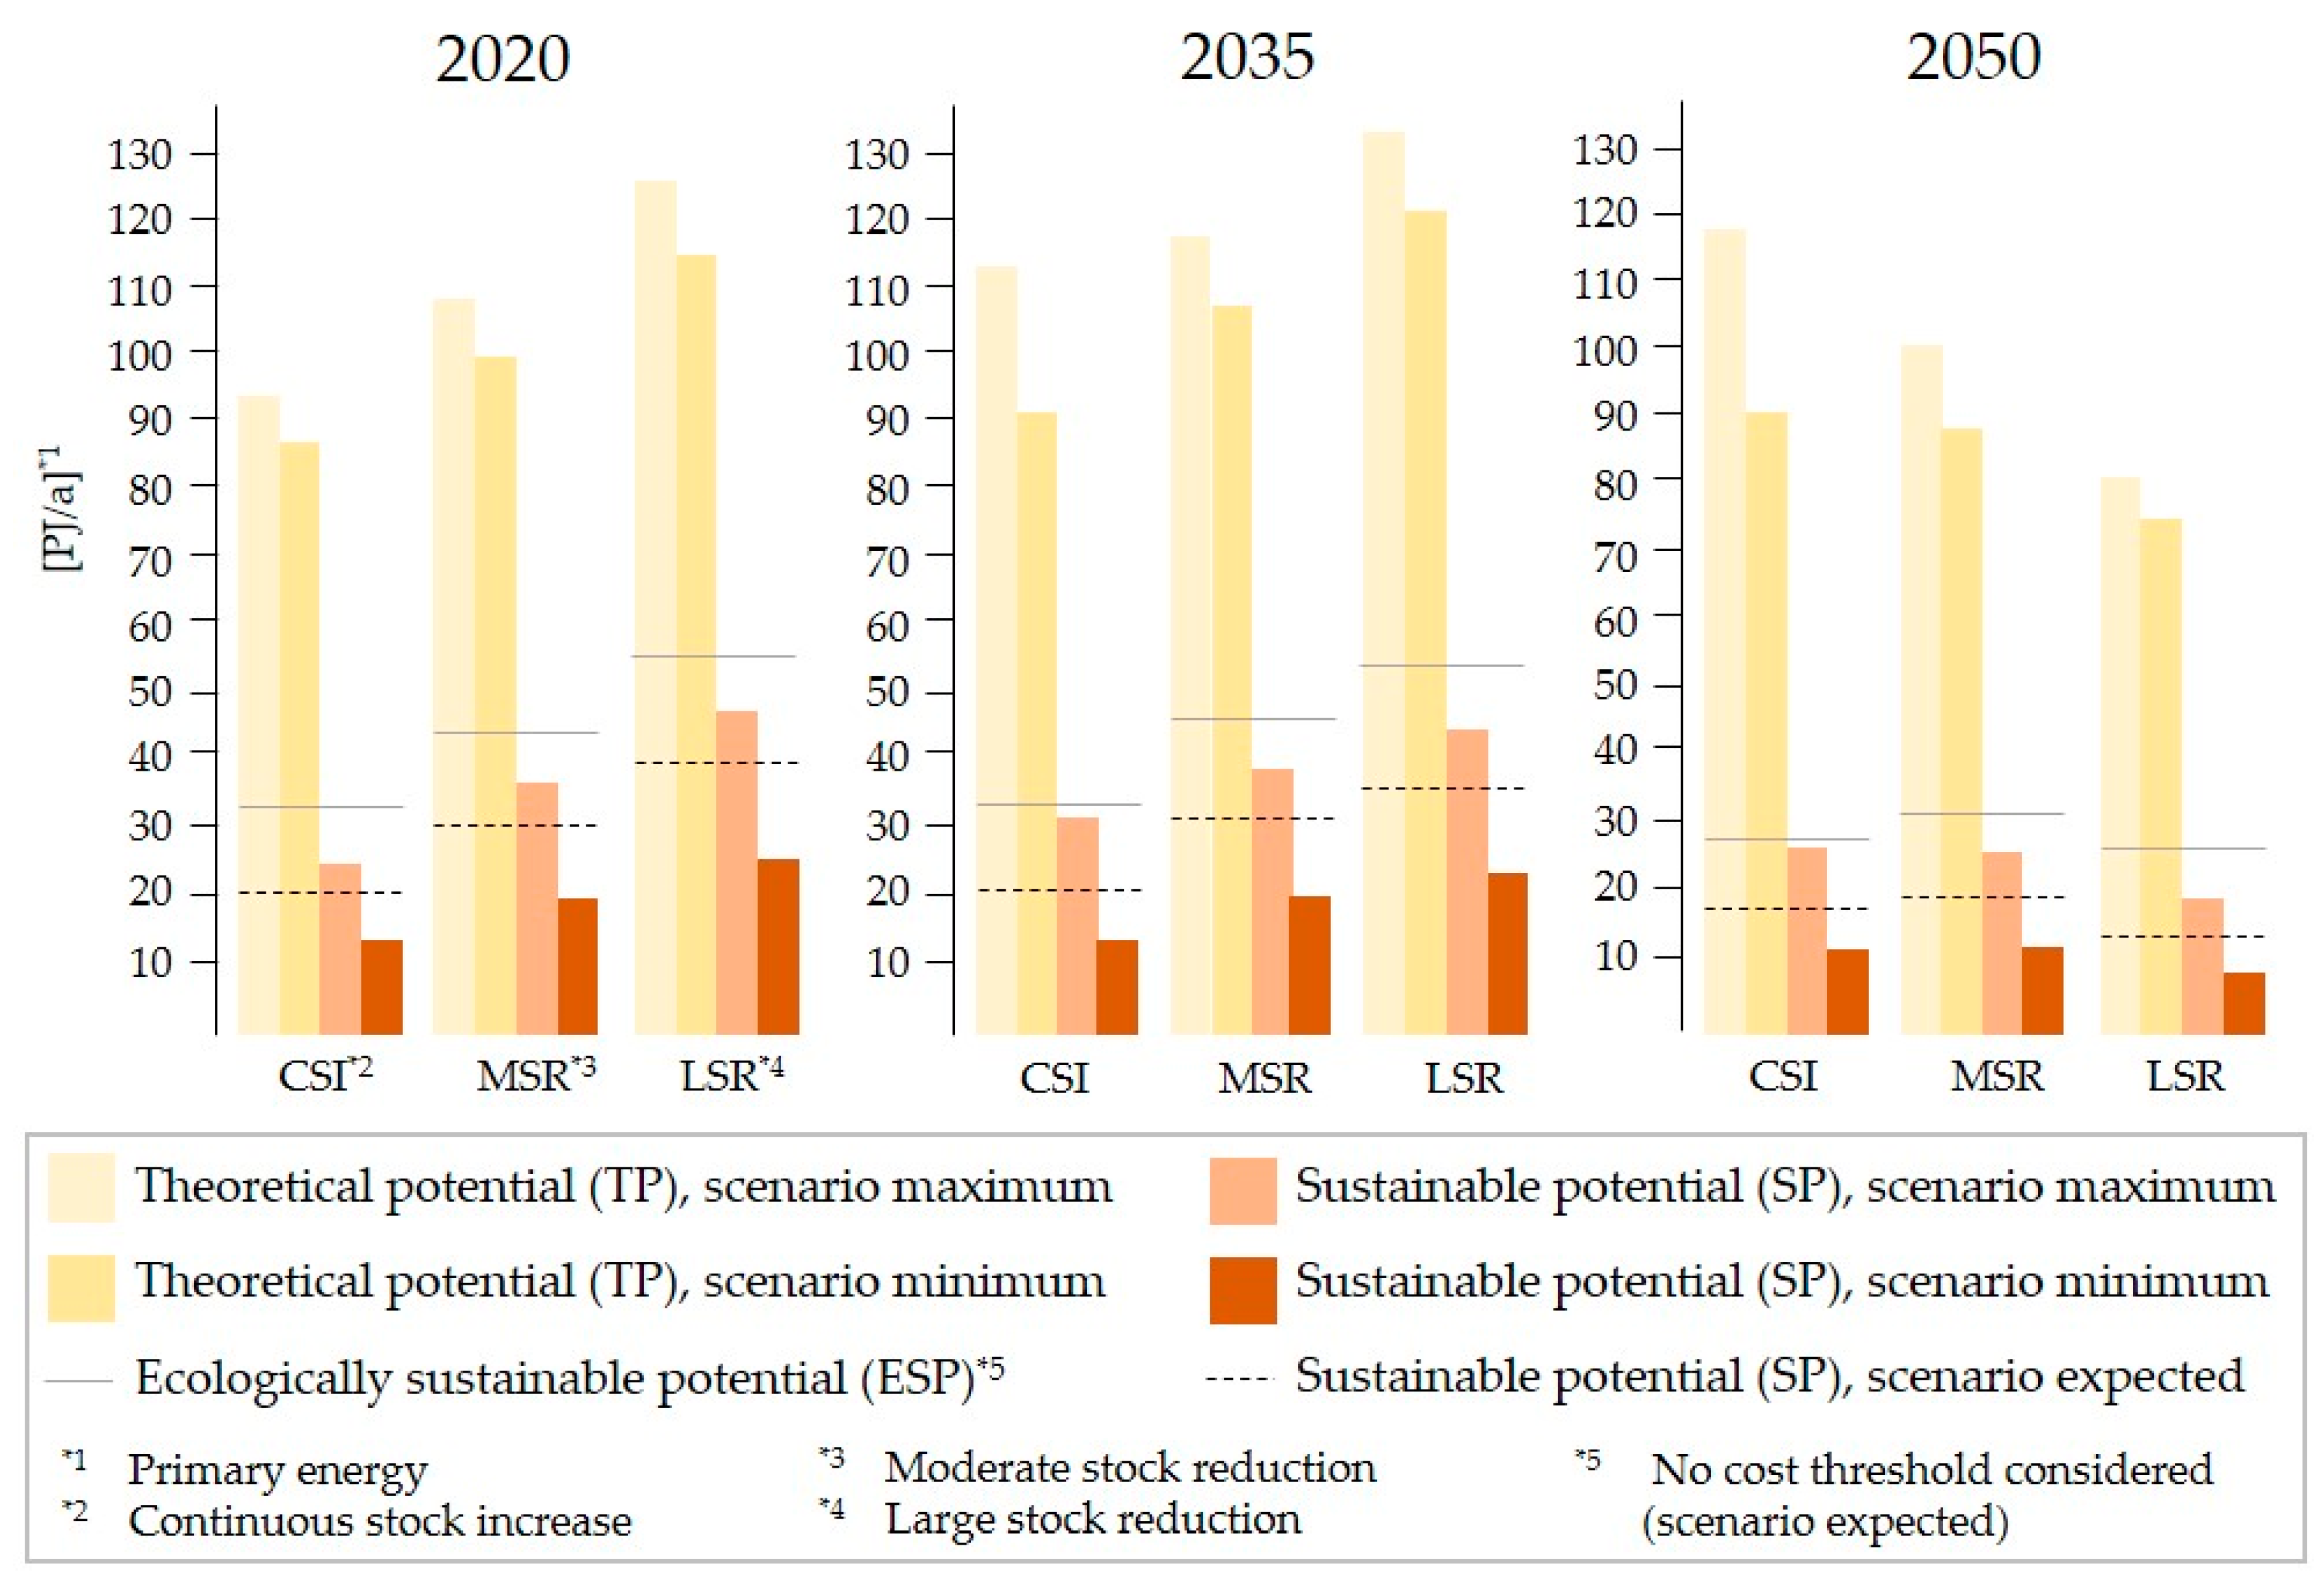
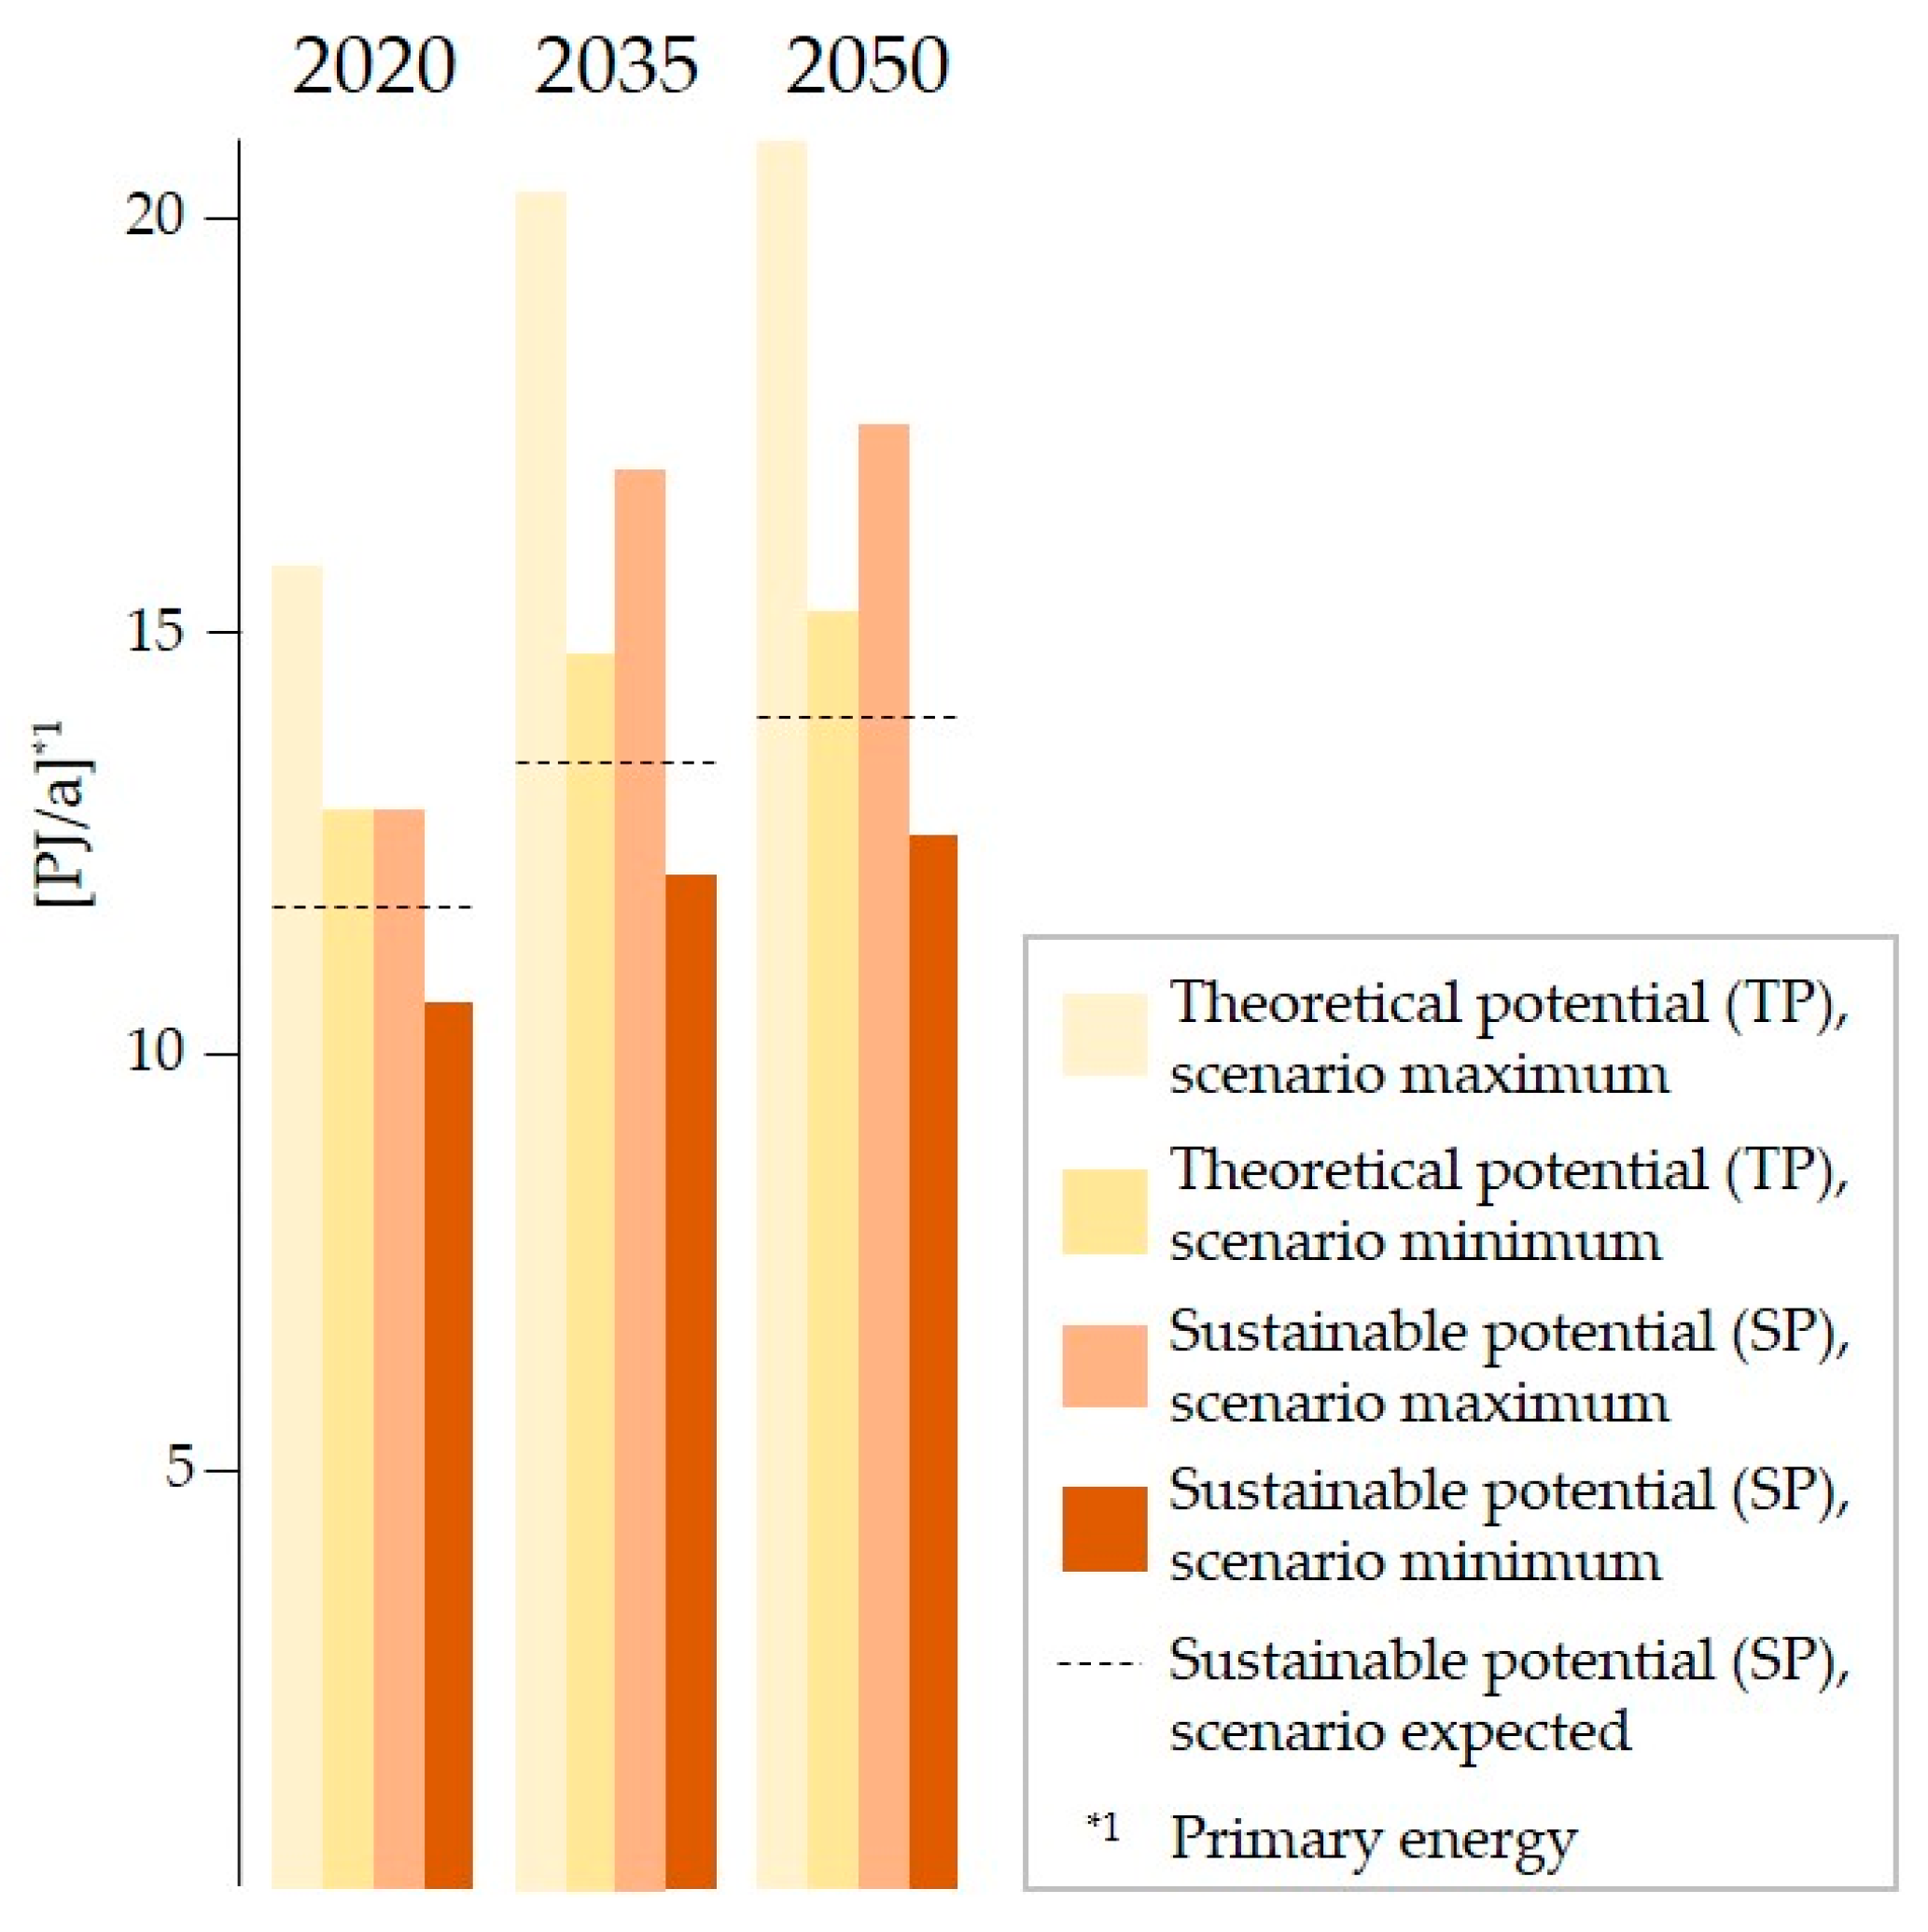
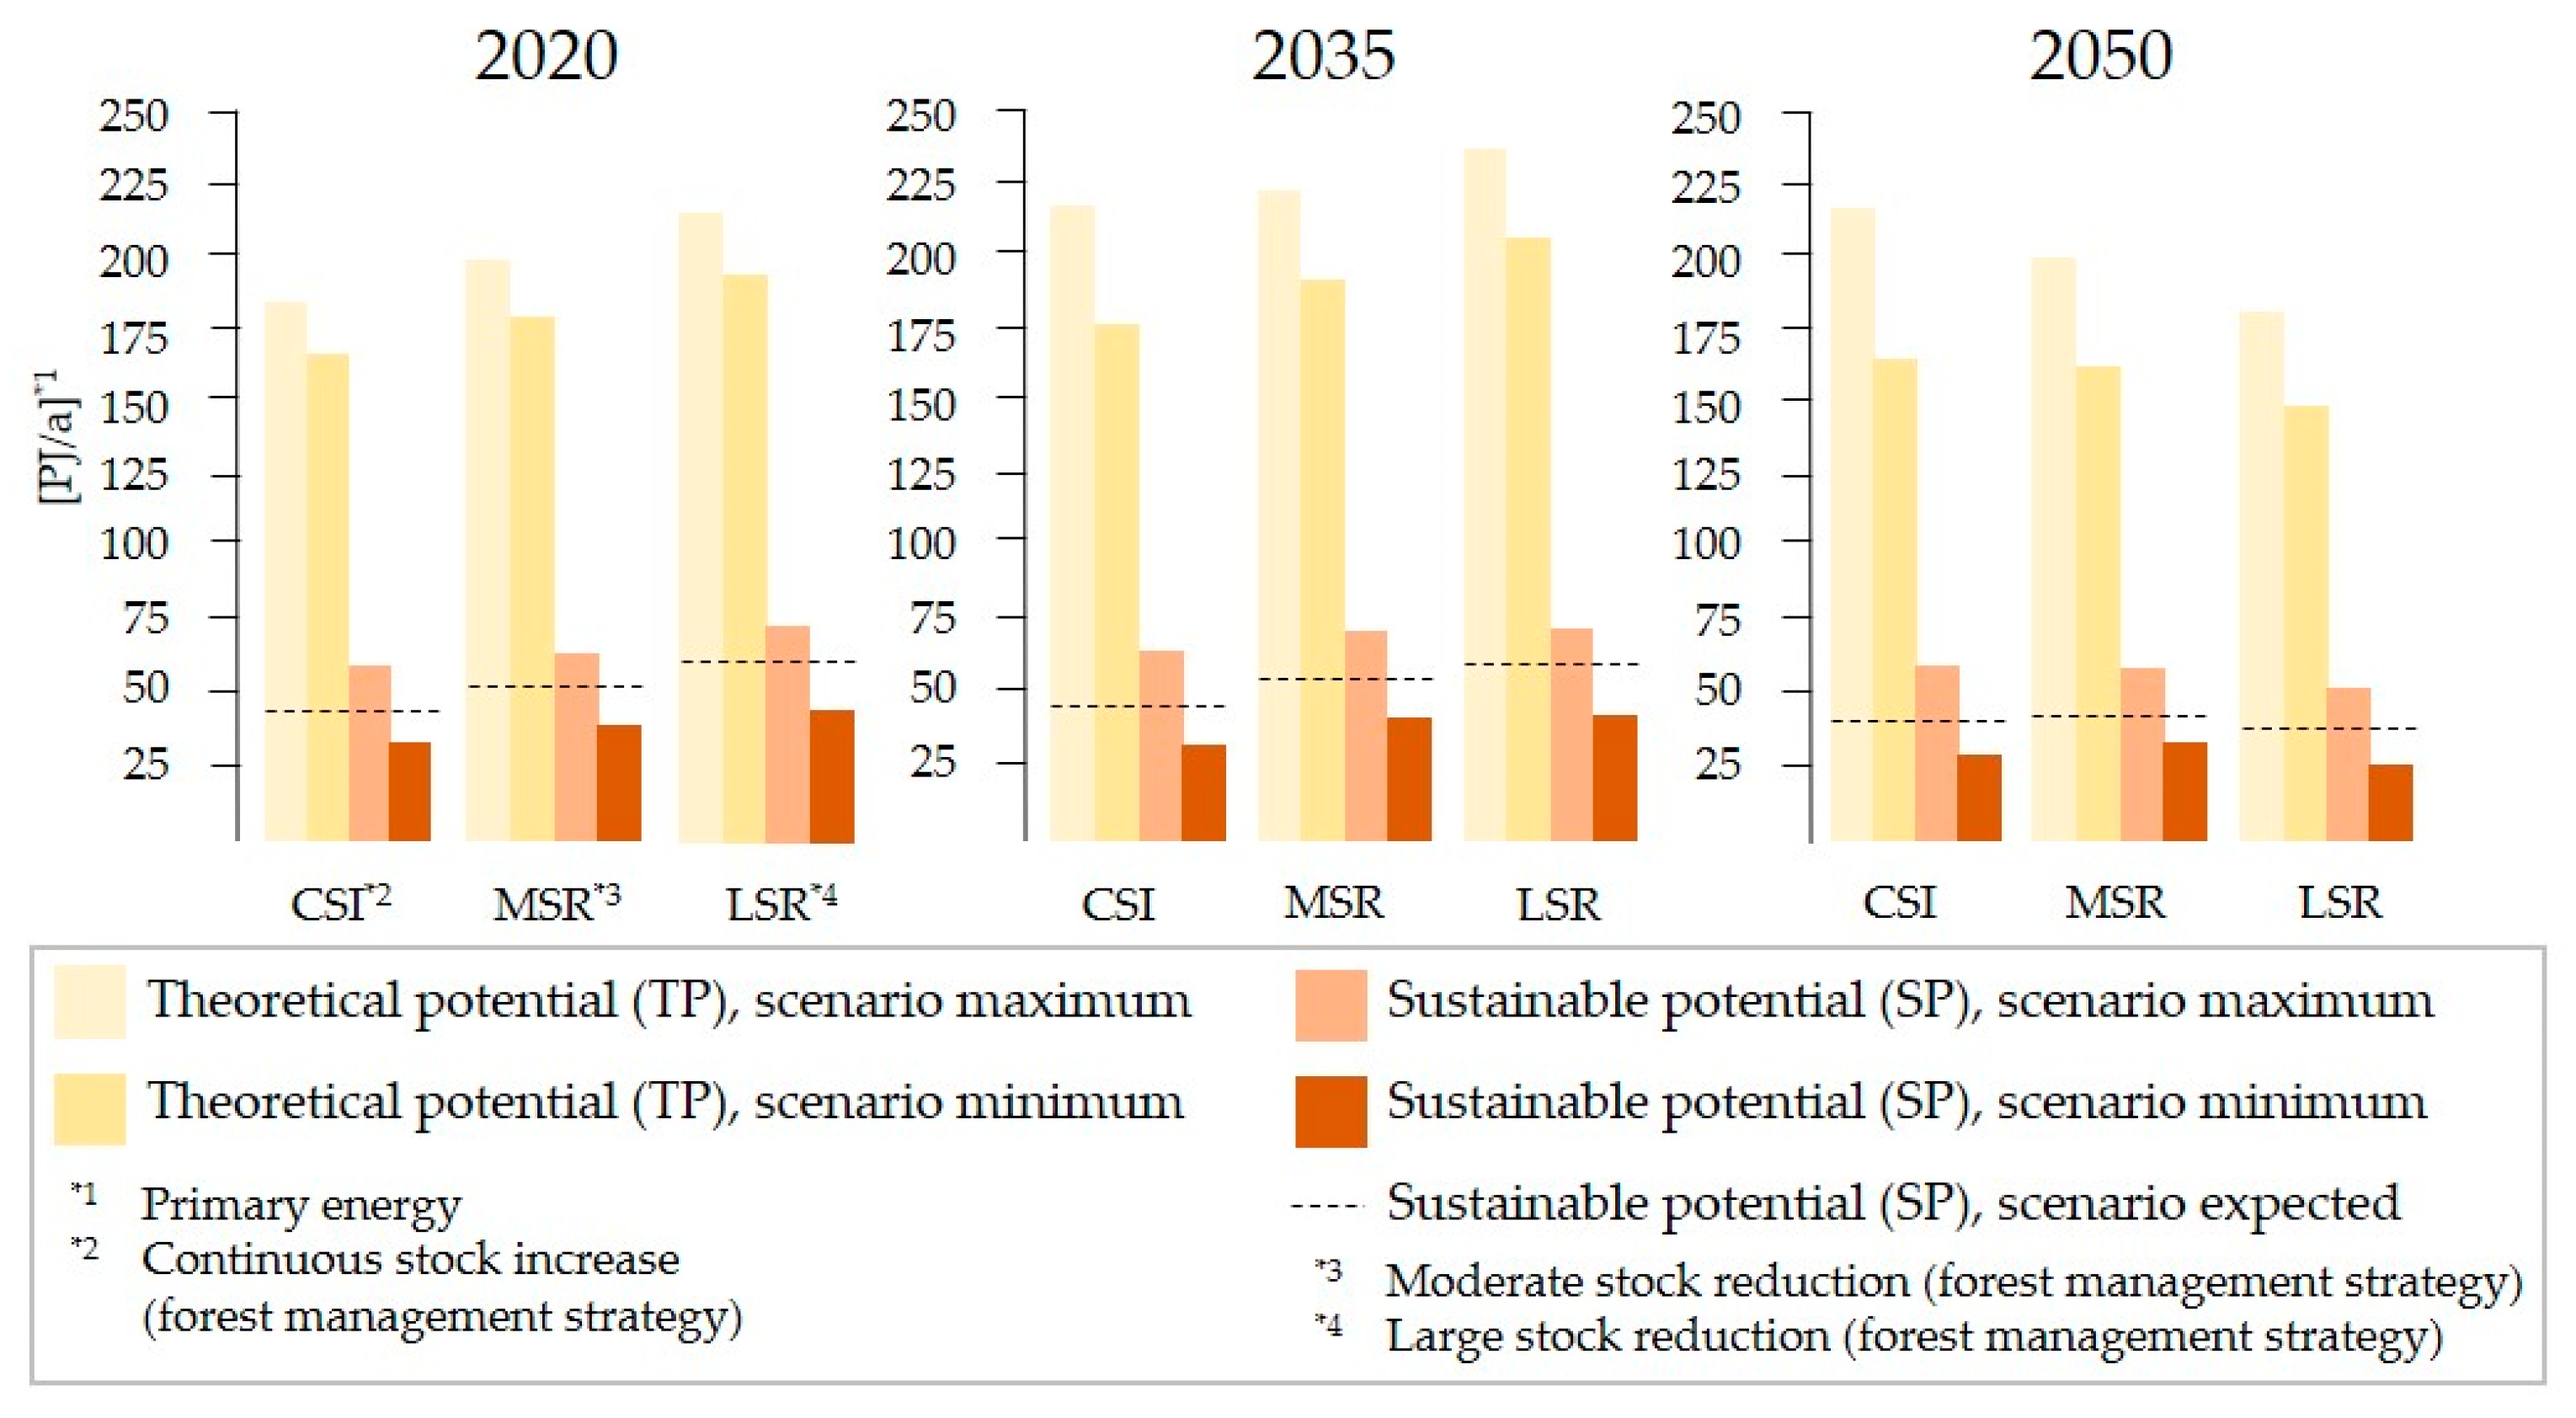
Theoretical and sustainable wood fuel potentials. Biophysical constraints and forest management strategies largely regulate the increment and possible stock reductions in forests and other landscapes, resulting in the theoretical potentials (TPs), and thereby determine the upper limit of annual wood fuel use. By subtracting relevant ecological and socio-economic restrictions, the amounts of biomass available for wood fuel are reduced, resulting in the sustainable potentials (SPs). SP provides a more realistic estimation of the amount of wood fuel produced annually and is the consequence of balancing societies’ multifunctional forestry mandates [20,23,44]. However, some restrictions have only indirect effects on wood residues and waste wood as they occur after timber harvesting (dashed line in Figure 1). For both TPs and SPs, the specific assumptions made for each woody biomass type are described in the respective sections. In the case of wood fuel derived from forests, we additionally determined the ecologically sustainable potential (ESP), which provides the upper limit if significantly lower costs, higher prices and consequently larger revenues are expected and mainly ecological constraints dominate (cf. Figure 2).
(ii)
Forest management strategies. Three forest management strategies were simulated by using MASSIMO [45], a management scenario simulation model to project growth, harvests and carbon dynamics of Swiss forests. It is based on empirical models that have been fitted with data from the Swiss NFI [46], and it includes HeProMo [47,48], a model that can estimate potential timber harvesting productivities and costs. Thus, it was possible to estimate the harvesting cost for each NFI plot based on the amount of harvested timber, harvesting methods and transport distance to the nearest forest road. It was initialized on 5086 NFI sample plots with productive forests, based on NFI2 (1983–1985) and NFI3 (2004–2006) surveys. As MASSIMO includes random components, we replicated the simulations 20 times. The version applied (NFI2/NFI3) does not take into account climate change but includes random components for storm damage, harvesting and single tree mortality [45], thereby taking into account climate-induced extreme events that can cause major damage and further impact the wood-processing industries and trades [49]. The following forest management strategies were calculated:
  • Business as usual, representing a continuous growing stock increase (CSI). It reflects the current harvesting and management practices in Switzerland and therefore can be seen as a reference scenario. It leads to increasing growing stocks in all Swiss regions except for the Swiss Plateau.
  • Medium-intensity management, representing a moderate stock reduction (MSR). It targets growing stocks of 300–310 m3/ha until 2046 and is intended to accelerate growth by reducing the stock of the forests.
  • High-intensity management, representing a large stock reduction (LSR). It accounts for a high demand for wood fuel from forests until 2046, leading to more frequent thinning and 40% shorter rotations, with target growing stocks of 250 m3/ha and a range of 200–300 m3/ha.
(iii)
Level of wood fuel consumption. Three scenarios of wood fuel use were applied to estimate realistic ranges of TPs and SPs. They were calculated for all analyzed types of biomass and covered the minimum, maximum and expected levels of wood fuel consumption. The largest deductions due to the restrictions (i) result in the minimum, the smallest in the maximum and the deductions of average restrictions in the expected potentials. Thereby, the approach accounts for uncertainties and diverse viewpoints regarding the potentials use (cf. Figure 2).
(iv)
Timber market situations. Two timber market situations were considered, wood energy oriented (EO+) and less wood energy oriented (EO−). They differ in the sorting of the assortments and include the differentiation between wood for energy and for material uses (Supplementary Information S1, Table S5). The market situation EO+ represents a more energy-intensive use directly after harvesting. In contrast, EO− represents a more cascade-oriented market, where a greater share of wood is directed towards a preliminary material use and is available for energy as wood residues or waste wood at the end of the life cycle. Both EO− and EO+ were defined in coordination with the Swiss forestry and timber industry associations [50].
(v)
Key drivers. The consideration of biomass-specific key drivers serves to project the wood fuel potentials of all analyzed woody biomass types by using them as development indicators of TP. We subtracted the relevant biomass-specific restrictions from future TPs to determine SPs. Detailed information on the biomass-specific drivers is given in the corresponding Section 2.2.1, Section 2.2.2, Section 2.2.3 and Section 2.2.4. In some cases, information on the possible development of the present SPs was also available and was applied directly.

2.2. Assessment of Woody Biomass Types

Considering multiple utilization paths, the following four woody biomass types were considered relevant for wood fuel in Switzerland [30,51]:
(i)
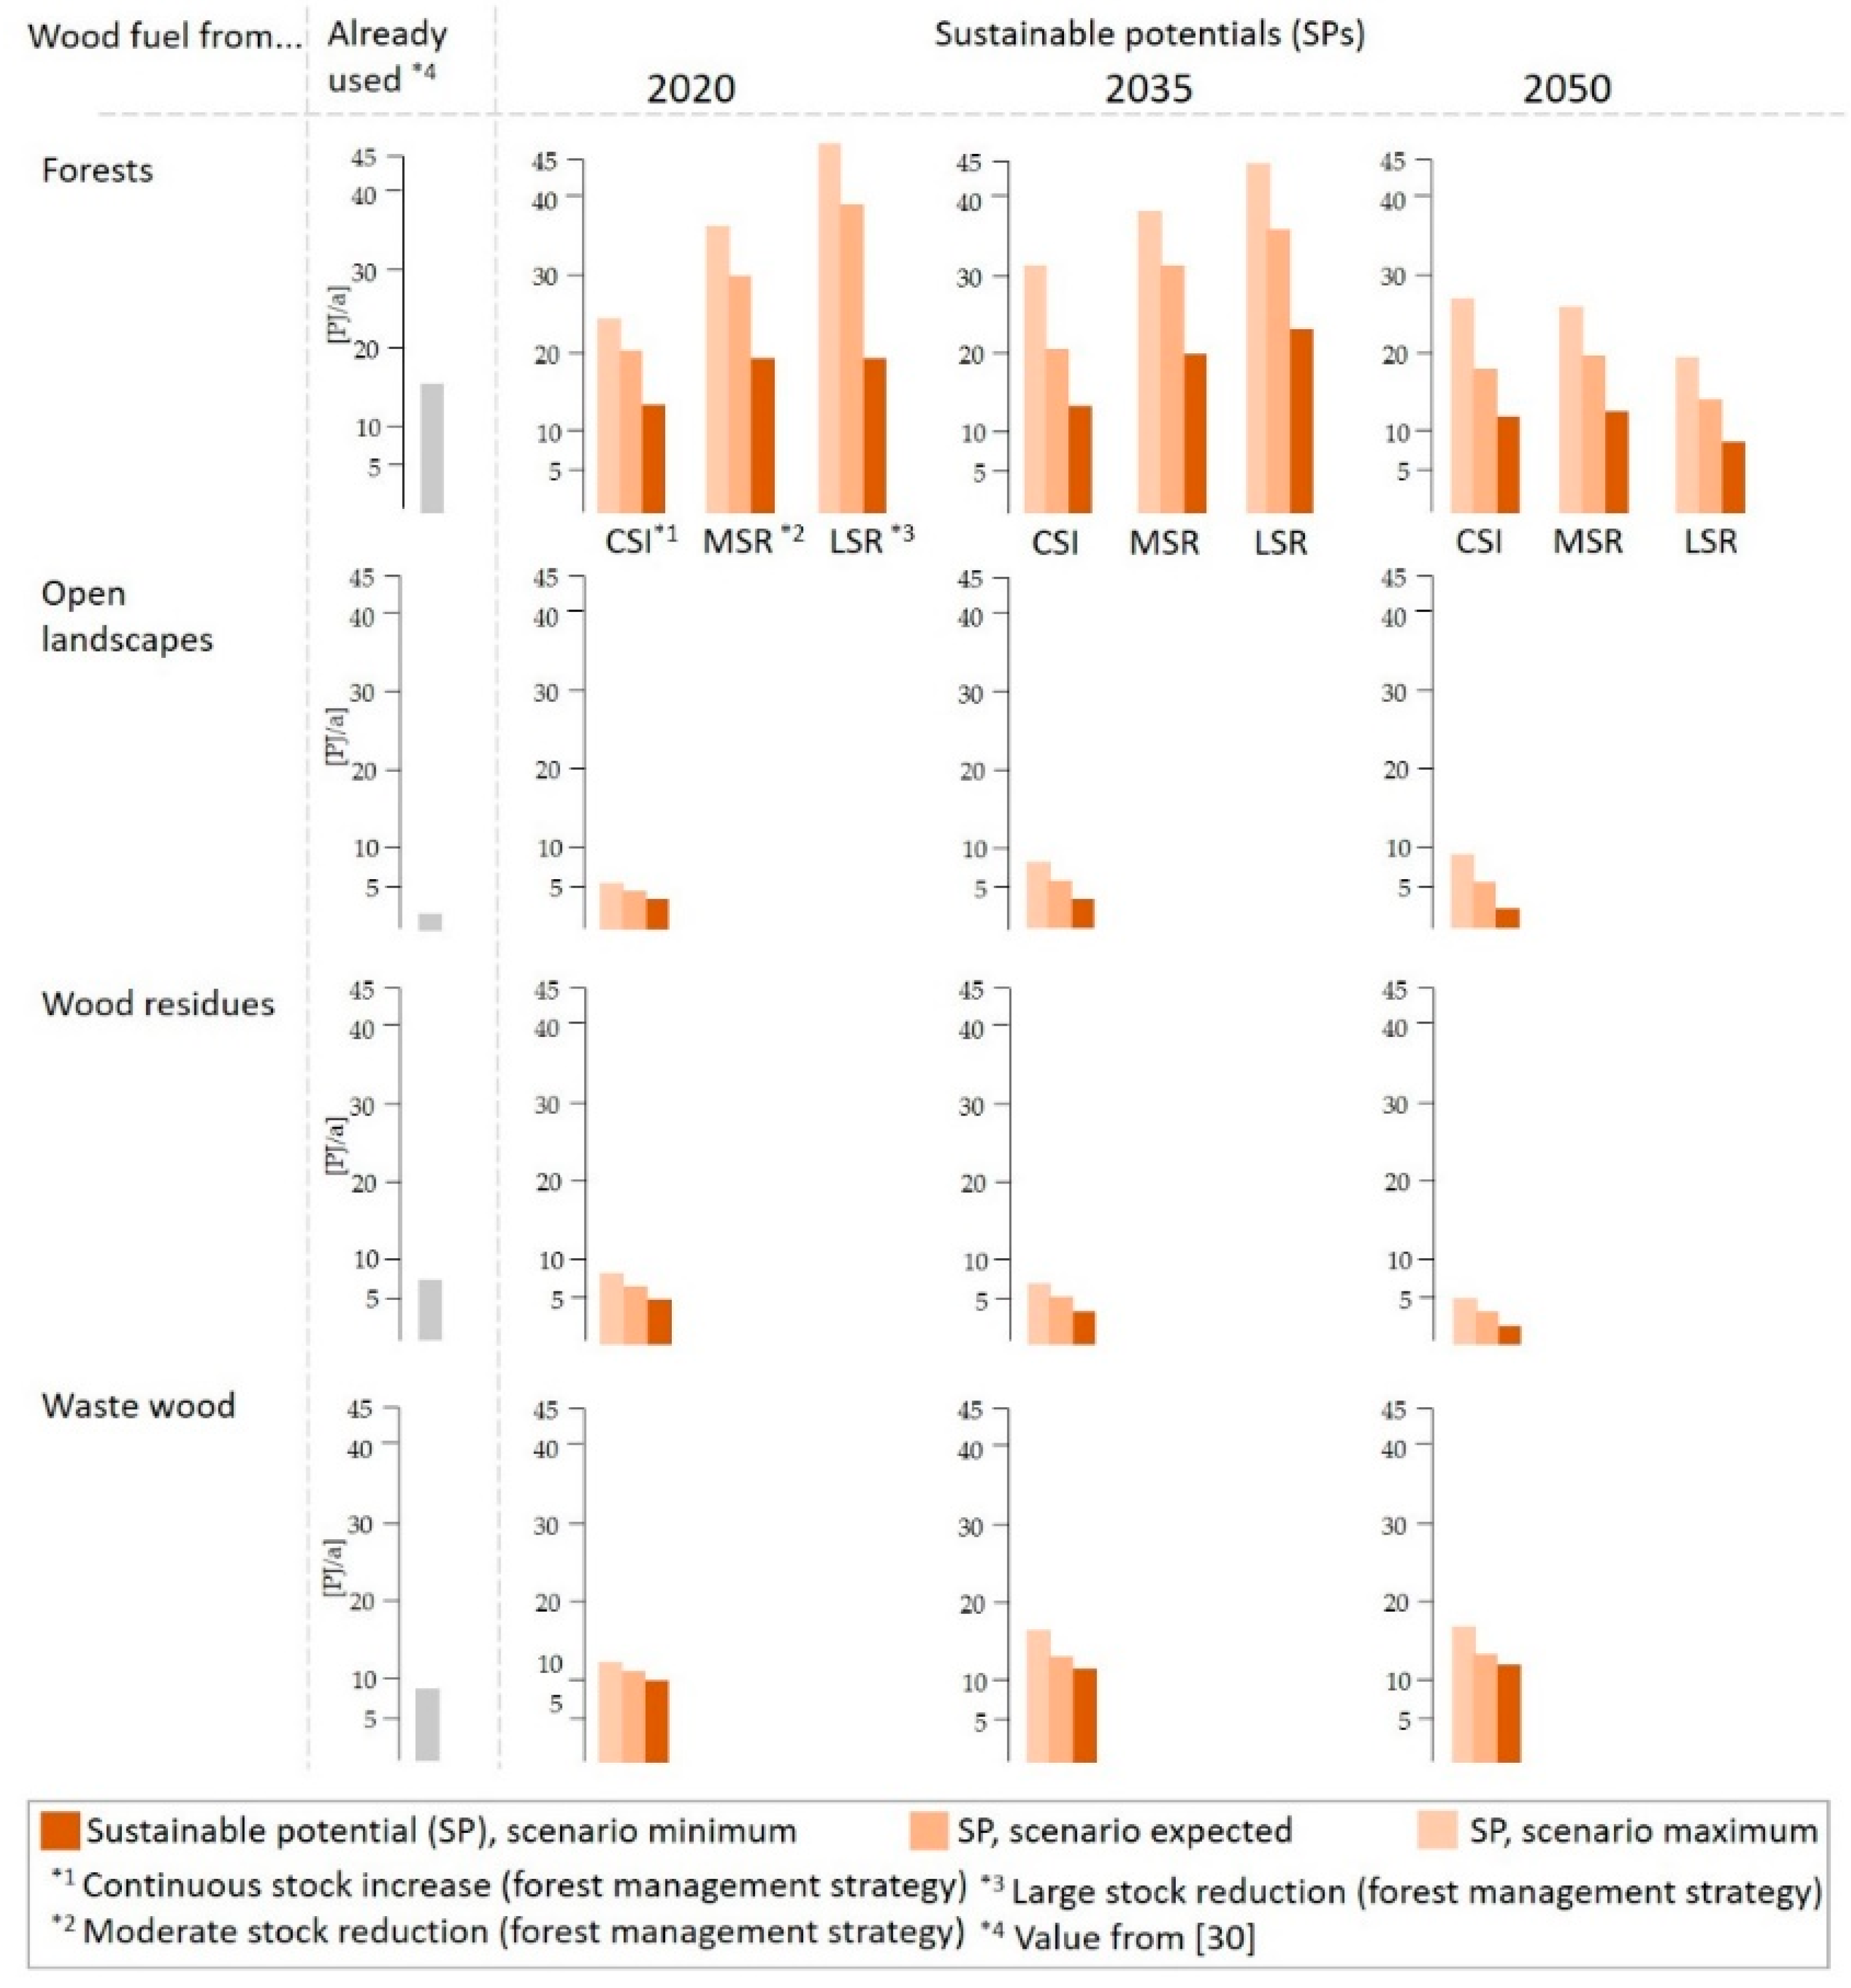
Wood fuel from forests, which is extracted from forests and used directly for energy purposes.
(ii)
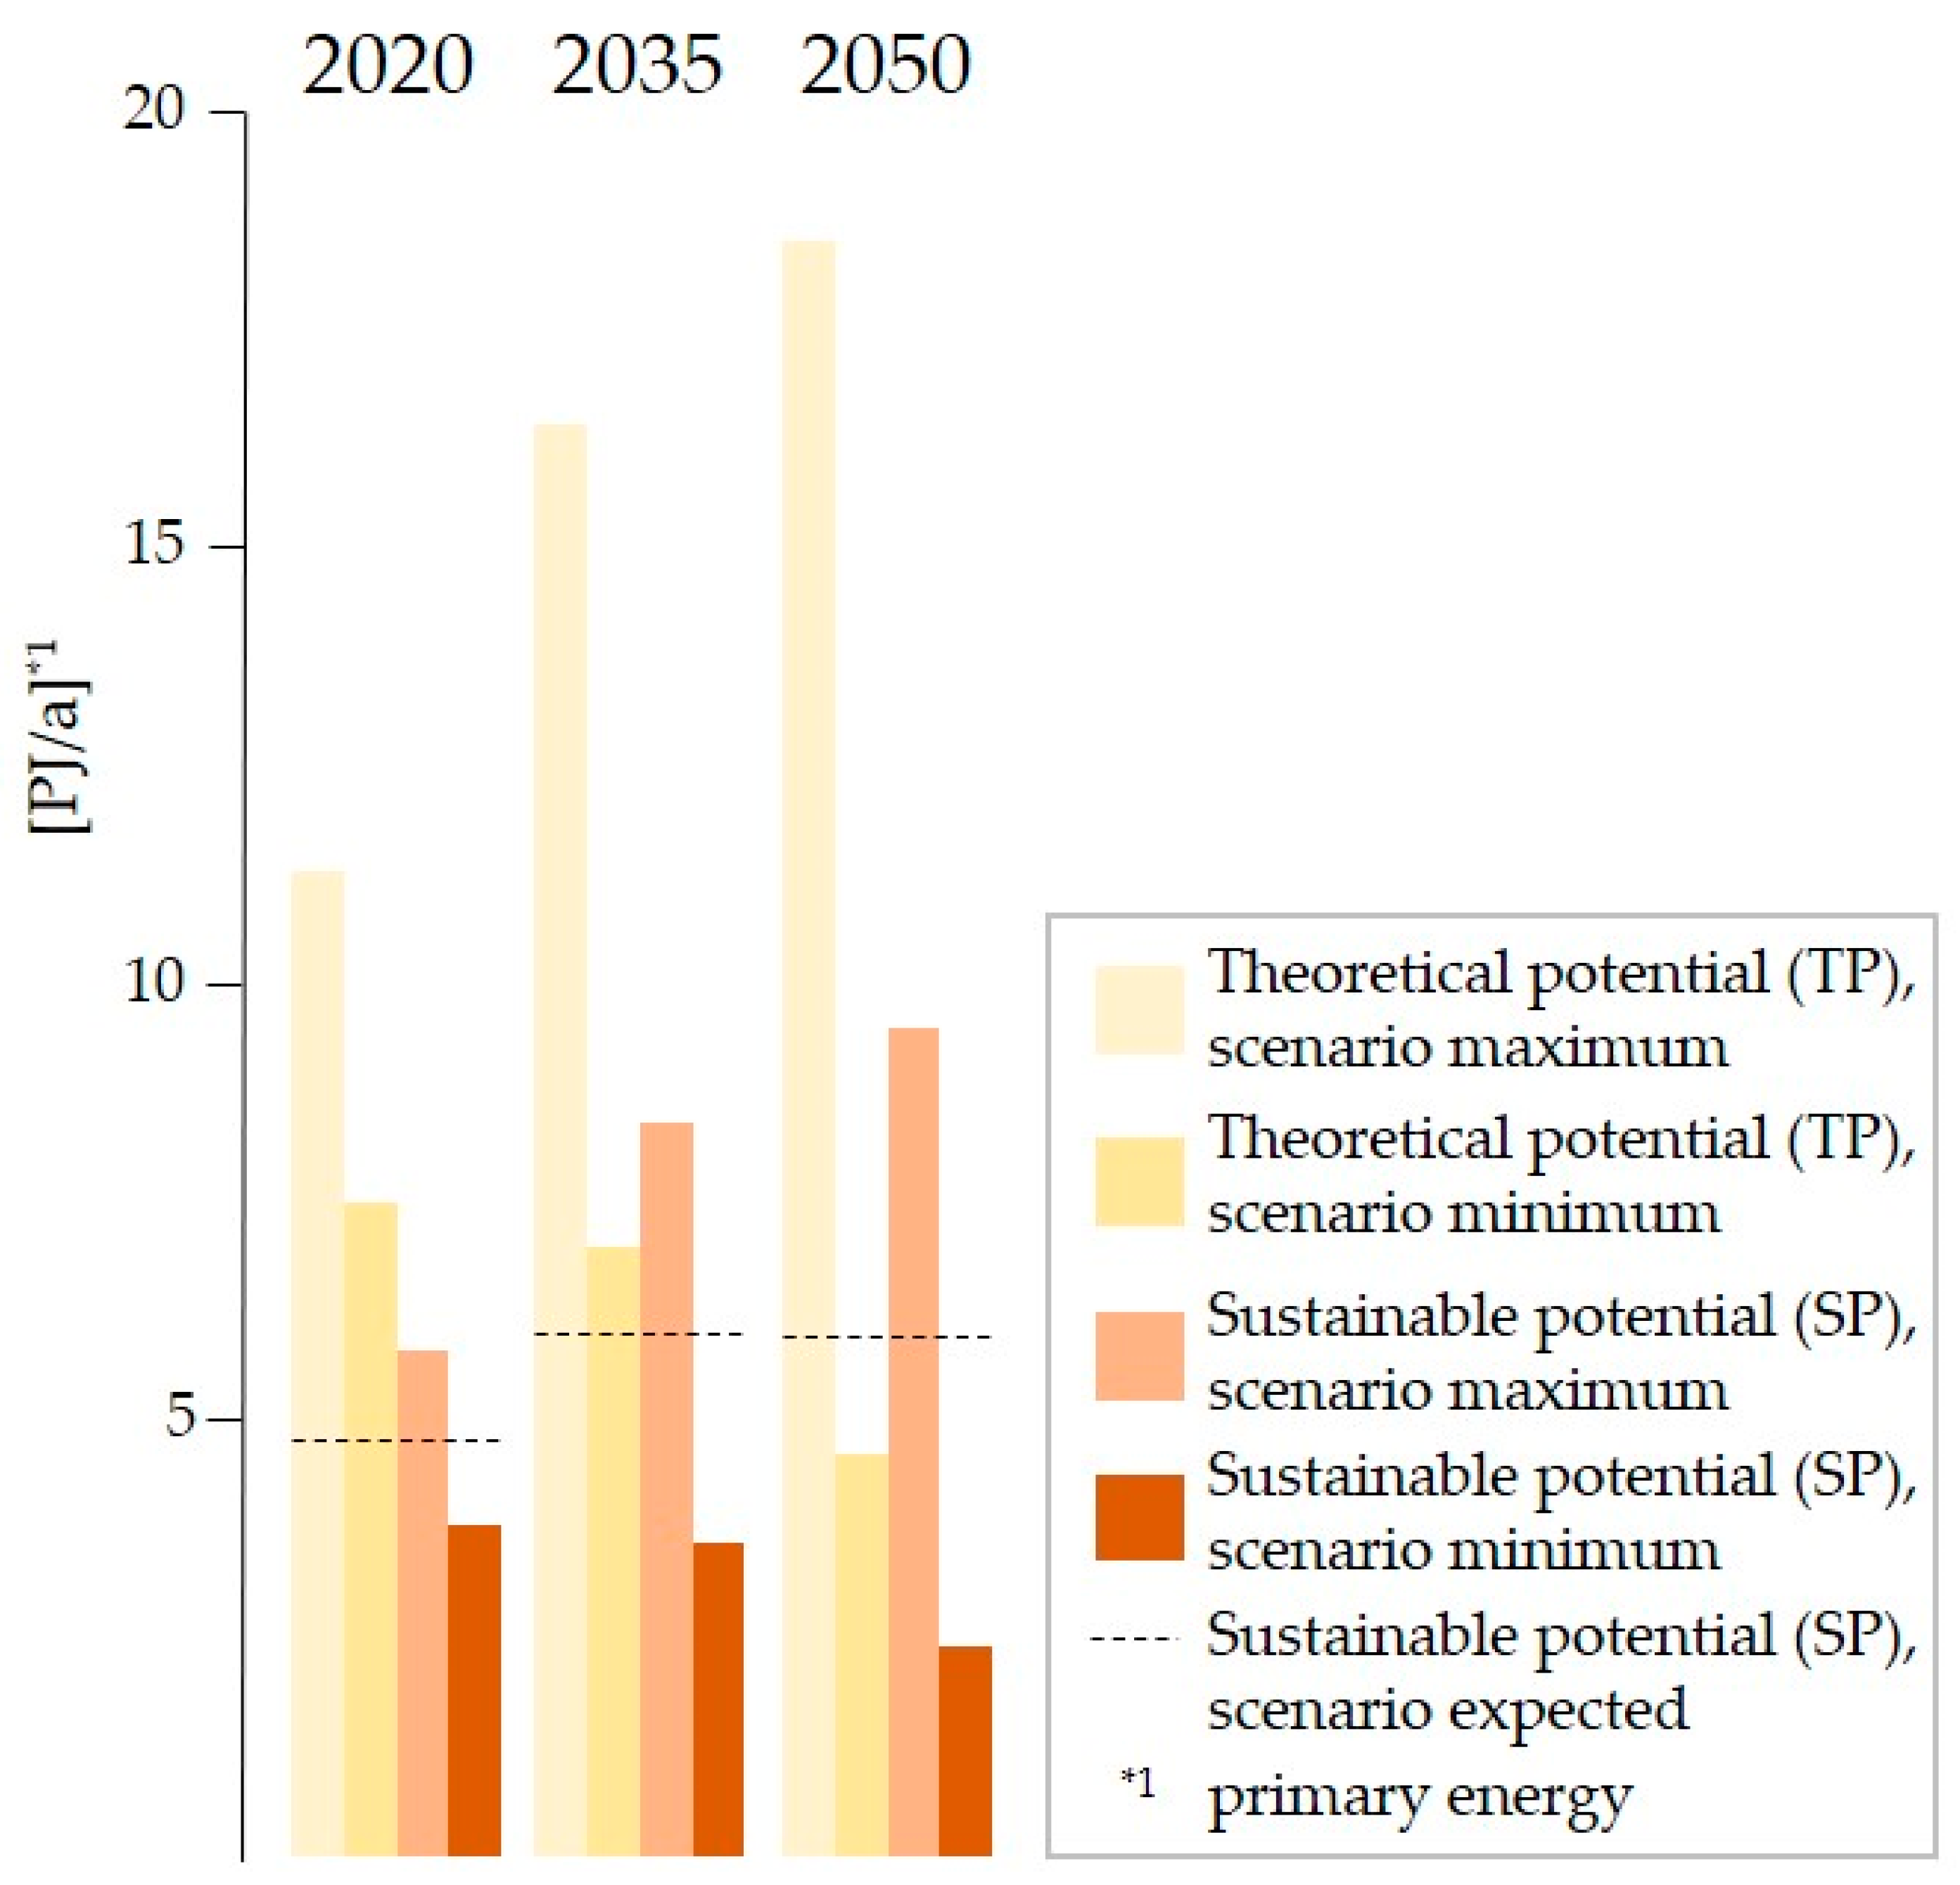
Wood fuel from trees outside forests, which is from trees and shrubs cut and pruned on landscapes or settlement areas outside forests.
(iii)
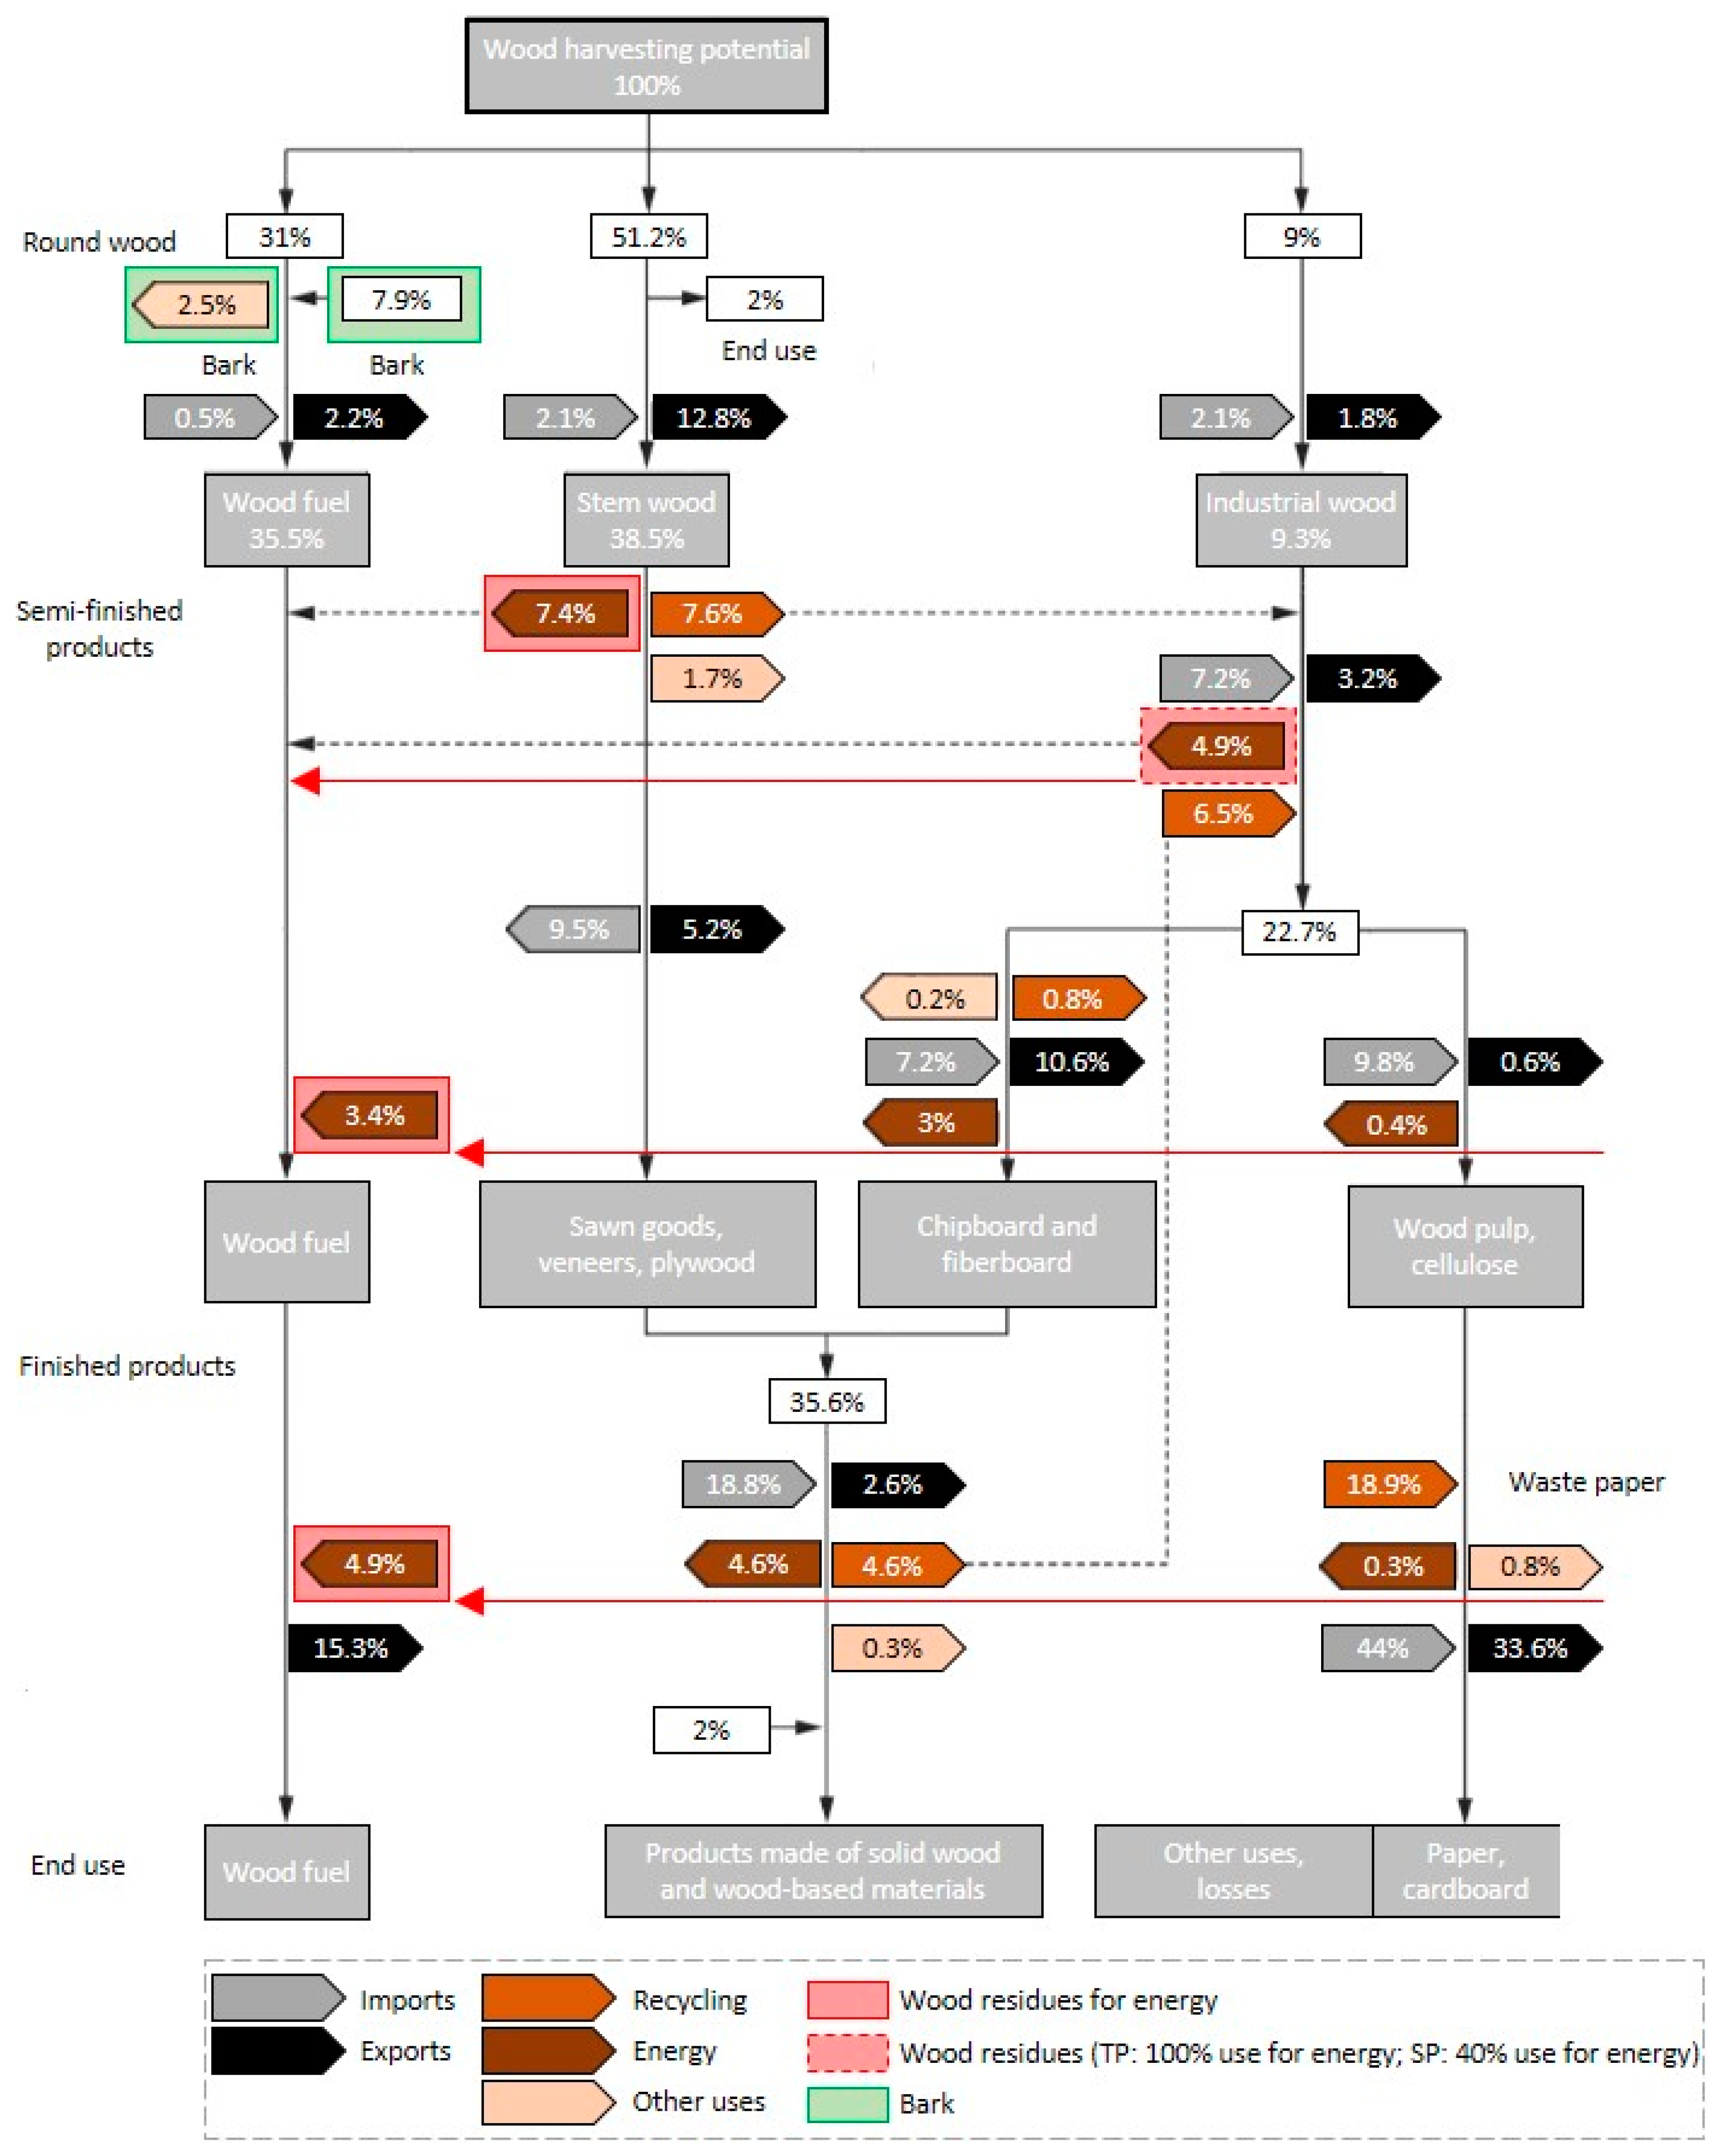
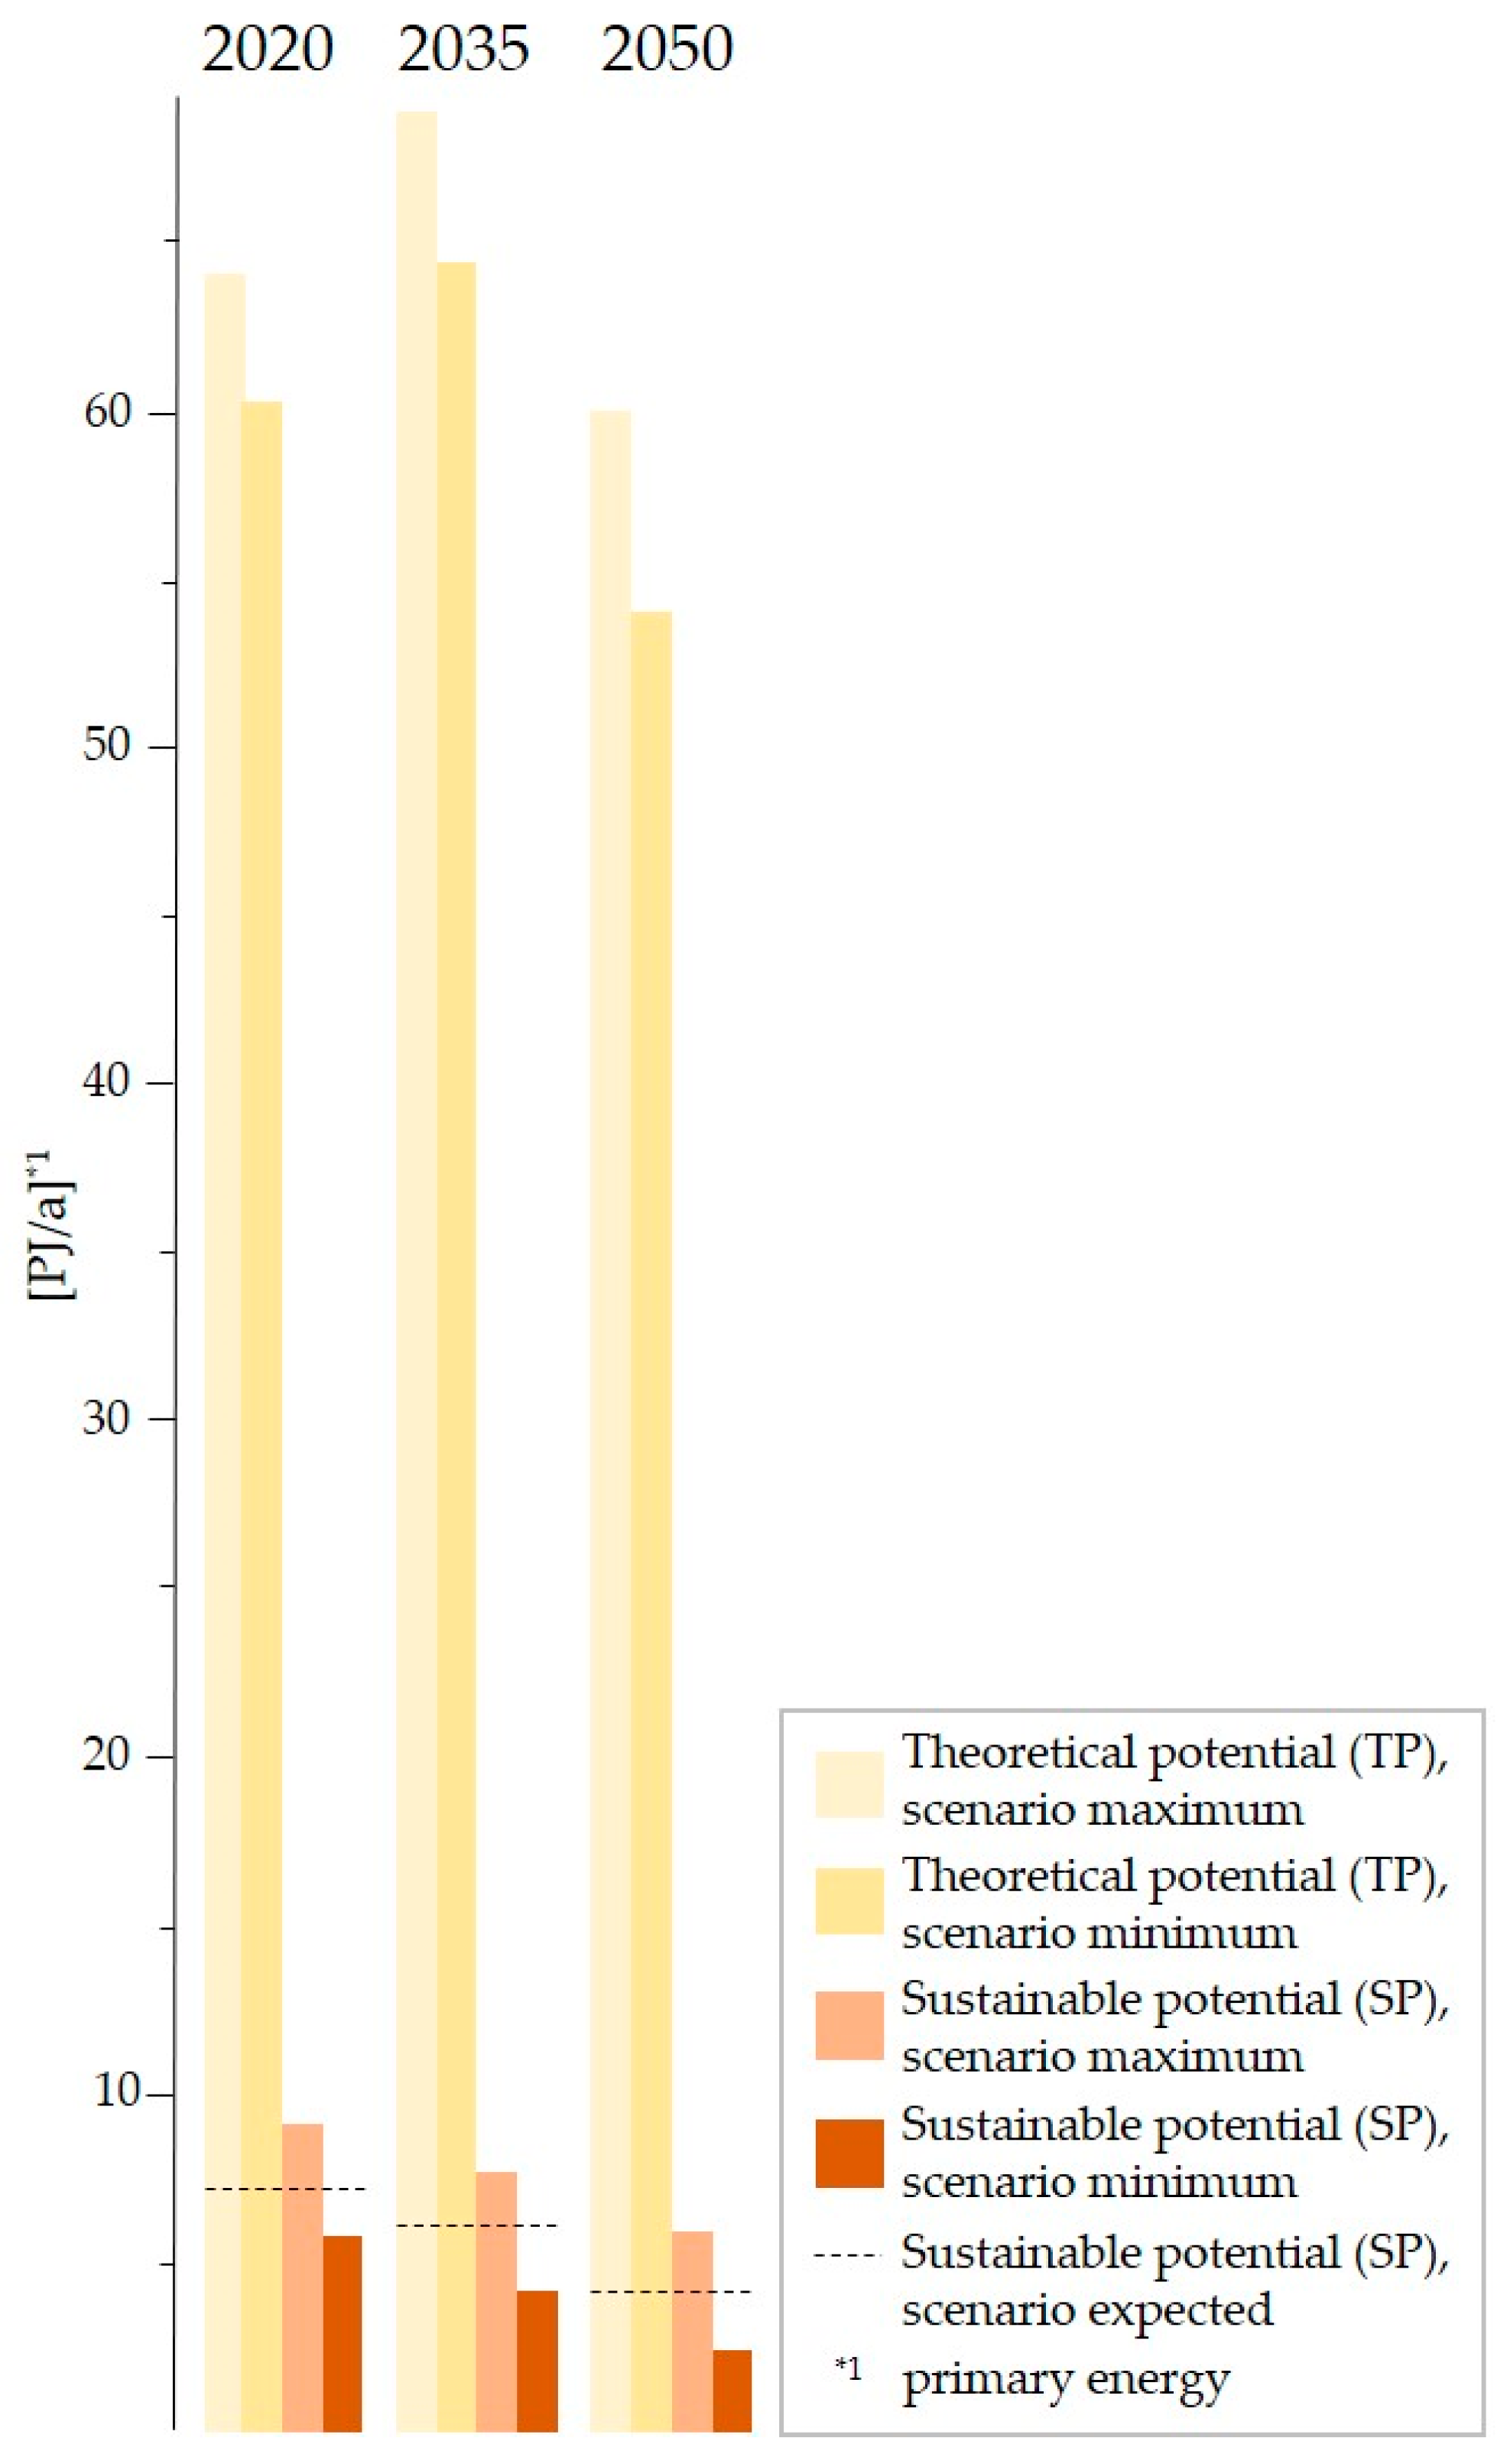
Wood fuel from wood residues, which includes slabs, cuttings, sawdust and wood shavings that arise in the wood product manufacturing and processing industries [52]. These residues are mainly a by-product of saw-, planing- and gluing mills, carpentries and joineries within the woodworking industry. The potentials depend on (i) the amount of wood harvested in forests, and (ii) its assortments, which has the advantage of framing the potentials in relation to their original source.
(iv)
Wood fuel from waste wood, which is defined as waste (after the material use of a wooden product) [53] and includes packaging made of wood, waste wood from building sites, demolitions, renovations and conversions, and shredded wood, including sieve overflow.

2.2.1. Wood Fuel from Forests

Applied models. By using MASSIMO [45] and the integrated HeProMo model [47,48], forest development, future growth, costs and harvesting potentials were simulated with time steps of 10 years, taking random storm damage, harvesting and single tree mortality into account (e.g., [45,54,55]).
Considered forest management strategies. All forest management strategies (CSI, MSR, LSR) and cost categories were described and applied according to Section 2.1.
Calculation of theoretical potentials. The TPs (TP2020, TP2035, TP2050) correspond to the annual increments including the amounts of stock reductions. To consider the range of the potentials for each management strategy, the standard errors of the MASSIMO outputs for increment and the eventual stock reduction were applied (Table 1). The future TPs were based on the MASSIMO results for the periods 2027–2036 (TP2035) and 2047–2056 (TP2050). As MASSIMO assumes mortality rates of 15% for CSI and MSR and 10% for LSR, mortality rates were re-added for the TP because trees that died could have been used for energy before decomposition.
Key drivers considered in the future TPs. We used MASSIMO’s standard implementations with a storm periodicity of 15 years, as well as the key drivers forest area size, forest growth and wood characteristics, all identified by literature review. Forest area size: Based on [56,57], we assumed a forest area increase of 0.19% per year, which resulted in a summed up forest area increase of almost 3% for TP2035 and 6% for TP2050 compared to TP2020. Forest growth: While factors such as climate change and N deposition may negatively impact tree growth in the lowlands [58,59], gross growth may increase at higher altitude [60,61]. Based on [49,62] and the higher forest cover in the Alps than in the lowlands, we assumed that both effects result in an increasing TP of 11% for TP2035 and 10% for TP2050 compared to TP2020 (7.9 m3/ha [63]). Wood characteristics: MASSIMO outputs result in different proportions of broadleaves and conifers over time. This shift in species influences the calorific value and thus the energy content of the wood. In MASSIMO, the growth of small trees (below the calliper threshold) is assumed to follow the same tree species-specific growth models as trees beyond the calliper threshold of 12 cm diameter at breast height. This assumption facilitates the simulation of fast-growing and shade-tolerant species in the regeneration, slightly tending to an overestimation of conifers [55] (for more details on regeneration in MASSSIMO, cf. [45]).
Calculation of sustainable potentials. To determine the SPs of wood fuel from forests, we considered restrictions with respect to mortality, reserve areas, harvest losses, material use and costs in the named order [20]. Mortality: The share of mortality was subtracted according to the assumptions made in the respective management strategies (CSI, MSR: 15% of increment; LSR: 10%). Reserve areas: Based on [64], we considered todays forest reserve areas (4.8%) when estimating SP2020. To reflect the minimum that policy aims for [65], we doubled the extend of reserve areas (~10%) for both SP2035 and SP2050. Harvest losses: Based on data from [26], we calculated standard errors of harvest losses and estimated the minimum SPs by subtracting the largest possible harvest losses and the maximum potential, respectively (Table 2). Material uses: Based on [20], we applied the two wood market situations “less wood energy oriented” (EO−) and “wood energy oriented” (EO+) for the sorting of assortments into energy and material wood use (Supplementary Information S1, Table S5). Costs: In addition to the harvesting costs divided into 25 CHF cost classes, costs for chipping and transportation were considered (40 CHF/m3). For SP2020, the threshold for economically acceptable harvesting, chipping and transportation costs was set, based on [20], at today’s market price of 120 CHF/m3 for wood production areas and 190 CHF/m3 for protection forest areas, accounting for subsidies given for the management of protection forests. To account for the minimum and maximum potentials we assumed ±10 CHF/m3 of the total costs.
Calculation of ecologically sustainable potentials (ESPs). In addition to TP and SP, we determined the situation of the sustainable potential for wood fuel from forests when costs are neglected. Therefore, cost restrictions were not subtracted from TPs. This results in the ESP, which considers ecological restrictions only and is in line with [20].

2.2.2. Wood Fuel from Trees Outside Forests

Applied models. A model was established based on geographic information systems (GIS), calculating wood growth per surface using a 100 m × 100 m grid of Switzerland [51].
Considered forest management strategies. None, as the procedure estimates wood from trees outside forests.
Calculation of theoretical potentials. To estimate TPs, an increment was assigned to the 28 identified wood-stocked categories outside forests (Supplementary Information S2, Table S6) shown in the areal statistics [66]. Increment accounts for site characteristics, such as precipitation, soil conditions and exposure of the trees [67]. Specifically, we assumed optimal growth of each stocked category based on literature review and expert surveys (Supplementary Information S2, Table S7). In a next step, we corrected optimal growth values with realistic coverage levels (Supplementary Information S2, Table S7, column 6) and applied the dependence of increment on altitude [63] using net growth factors (Supplementary Information S2, Table S8). Therefore, we normalized the net growth. The altitude class with the highest growth value of each region was assigned ”1”, while net growth factors were assigned proportionally smaller values for the others according to the growth measurements of the NFI [63]. Afterwards, net growth factors (Supplementary Information S2, Table S8) were assigned to all of the 4.1 million georeferenced sample points of the areal statistics [66]. The results were then joined with the digital elevation model of Switzerland [68], thereby assigning an altitude to each of the areal statistics sample points. Finally, the combination of the stocked areas outside forests with altitude and the corresponding net growth factors (Supplementary Information S2, Table S8, lower part) made it possible to estimate net growth in [m3/ha*a] for each of the georeferenced sample points of the areal statistics. Thus, we multiplied the growth of realistic coverage levels of the 28 wood-stocked categories (Supplementary Information S2, Table S7) with their net growth factors while also accounting for their location and altitude (Supplementary Information S2, Table S8). When summed over all of Switzerland this equals TP.
Key drivers considered in the future TPs. Increment: For wood from trees outside forests, we made the same assumptions as for wood fuel from forests, i.e., an additional 11% woody biomass available for the TP2035 and 10% for the TP2050 compared to the TP2020 (Section 2.2.1). Wood characteristics: The wood from landscape maintenance was assumed to be 90% broadleaves for the TP2020 [51]. As this percentage is quite high, it was assumed to stay at 90% for TP2035 and TP2050. Areal changes: To quantify the wood-stocked areas outside forests for TP2035 and the TP2050, we linearly extrapolated the past development based on the areal statistics from 1979/1985 and 2004/2009 [66]. The areas increased by approximately 12% between these two periods, which corresponds to an annual average increase of 0.46%. This total increase was distributed equally across all types of wood from trees outside forests until 2035. However, stagnation in the year 2035 was assumed.
Calculation of sustainable potentials. Based on the results from the TPs, restrictions were considered that apply when technical-economic and socio-political requirements were included. In particular, harvesting, chipping, and transportation costs were important, and all of which largely depend on the accessibility of the area. Technical-economic accessibility: The distance of the landscape areas to the road network [69] is important when considering forwarding distances. Therefore, we considered the distances between the wood-stocked areas on landscapes and the nearest road (>2 m width). In cases where the distance was <50 m, 100% of the wood was considered for the TP, whereas 60% of the TP was considered where the distance was 50−150 m and no wood was considered where the distance was >150 m. This is in line with [51,67]. Ecological socio-political accessibility: As harvesting in steep terrain is avoided whenever possible, for worker safety reasons and prevention of erosion, the slope was calculated with the digital elevation model [68]. In general, we assumed that sites with a slope gradient of more than 70% were harvested only if necessary for safety reasons (e.g., better view along roads or in urban areas, Table 3).
Key drivers considered in the future SPs. Areal changes: The annual increase of 0.46% from former areal statistics was applied (cf. key drivers in the future TPs). As for the TPs, we assumed this increase would persist up to the year 2035 (SP2035), resulting in an additional 12% that was distributed equally across on all stocked categories of trees outside forests (Supplementary Information S2, Table S7). Availability: We assumed similar road networks and forwarding distances as for SP2020 for future points in time (SP2035 and SP2050). We also assumed that there were no changes in topography or slopes within these timeframes. Uncertainty: We chose high uncertainty values of 20% for today (2020), 40% for 2035 and 60% for 2050 (for more details on the technical assessment, cf. [51]).

2.2.3. Wood Fuel from Wood Residues

Applied models. Wood harvesting potential. (i) We applied the models MASSIMO and HeProMo (cf. Section 2.1) and used the same approach as for “wood fuel from forests” (Section 2.2.1), neglecting the assortment (market situations; EO−, EO+) because material, wood-processing and energy uses are part of the model “wood fluxes Switzerland”. (ii) This model is based on [70] and includes the quantification of wood residues available for fuel as all wood residues occurring along the value chain of the wood-processing and woodworking industries (Figure 3). The model is divided into three main pillars (wood energy, stem wood and industrial timber). For the determination of wood residues for wood fuel, we summed up wood residues intended for energy use (Figure 3, framed in red). Linkage of the two models. (i), (ii) Wood harvesting SPs and TPs from (i) were used as possible wood harvest (cf. wood harvesting potential, Figure 3) input in model (ii) for each point in time (2020, 2035, and 2050). This combination allowed the distribution of wood harvesting TPs and SPs (i) based on five-year average values of the wood fluxes in Switzerland (ii) (Figure 3) [70].
Considered forest management strategies. The moderate stock reduction (MSR) strategy was used, as it is expected to be favored by the forestry and timber industry [20]. Additionally, it allows temporary surpluses for the SP2035 and SP2050 coming from increased harvests due to stock reductions until 2046, while not undercutting the SP2050 coming from the CSI (business as usual) strategy and still providing compartments for wood processing.
Calculation of theoretical potentials. TPs consider all wood residues to be used directly for energy. This means that parts used for further material production and unidentifiable quantities in terms of energy versus material use (Figure 3, dashed in red) are entirely attributed to the TPs (cf. applied models).
Key drivers considered in the TPs. As TPs of wood fuel from forests (Section 2.2.1) are similar to TPs of wood harvesting potentials (i) (cf. applied models), we considered no further drivers.
Calculation of sustainable potentials. SPs consider all fluxes of wood residues that are no longer used for reprocessing (Figure 3, framed red). Concerning wood harvesting SPs, the restrictions of mortality, reserve areas, harvest losses and costs were considered in line with the procedure used for wood fuel from forests (Table 4, respectively Section 2.2.1).

2.2.4. Wood Fuel from Waste Wood

Applied models. A survey of all waste wood disposal companies and waste wood transporters within Switzerland was conducted [71] to quantify the amount of waste wood and its potentials for energy use. The survey was based on [72] and was adapted and implemented for Switzerland. In total, 295 companies reported about their activities in the transport and disposal of waste wood in 2014. Based on this survey, data for 154 transportation and disposal companies that did not respond were projected. This provided the basis for the estimation of the waste wood energy SPs and TPs (for details, cf. [71]).
Considered forest management strategies. As the estimation of waste wood potentials is based on an actual survey, the situation is comparable to the strategy CSI with a considerable time lag because waste wood occurs at the end of the life cycle. However, as many semi-finished and finished products are imported [73], the domestic production has minor importance.
Calculation of theoretical potentials. The TPs correspond to the total market volume. The market volume reflects the maximum quantity of waste wood available on the market, including both domestic use and export. It contains the quantities used within the country and the quantities sold abroad to end users. Today, 0.3 M t (0.56 M m3) of waste wood, or 31% of the market volume, is exported [71]. This is important because exported waste wood could be used domestically.
Calculation of sustainable potentials. The SPs reflect the cascading (material use) as well as the appropriate disposal of contaminated waste wood inland and abroad. We determined the amount of waste wood already used for energy production in Switzerland and added the amount exported and used for energy production abroad (15% of the market volume or 0.15 M t (~0.28 M m3); [71]).
Key drivers considered in the TPs and SPs. It was assumed that a growing population will increase the demand for wooden products (e.g., furniture) and, consequently, will produce more waste wood. Therefore, we accounted for population growth: based on [74], Switzerland’s population (8.3 M permanent residents) is expected to increase by 19% by 2035 (approx. 1% annually) and by 23% by 2050 (approx. 0.76% annually), with deviations in these scenarios of 5%, and 10%, respectively. As other investigations of the waste wood already used for energy [75,76] show results with variations of 10% for the potential, we added an additional 10% uncertainty to our results.

2.2.5. Calculation of Energy Contents

General remarks. Volume- or weight-based data on wood harvests from forests and landscapes, wood residues, or wood wastes were converted into energy content (E) (Joules [J]). Depending on the biomass type, different values for the energy content per volume or weight were applied. If not indicated otherwise in the respective sections, the following values were used. The energy content of fresh forest wood is 2260 kWh/t for conifers and 2160 kWh/t for broadleaves [77]. For the conversion of kWh/t into J, we used the factor 3.6 × 10⁶ [78]. For fresh wood from forests, we applied volumes of 0.758 t/m3 for conifers and 1.116 t/m3 for broadleaves. For air-dry wood, we applied volumes of 0.52 t/m3 for conifers and 0.74 t/m3 for broadleaves [51].
Wood fuel from forests. The energy content is given for fresh wood of conifers and broadleaves:
E c o n i f e r s [ J ] =   v o l u m e c o n i f e r s [ m 3 ] * 0.758   [ t m 3 ] *   2260 [ k W h t ] * 3.6 * 10 6   [ J k W h ]
E b r o a d l e a v e s [ J ] =   v o l u m e b r o a d l e a v e s [ m 3 ] * 1.116   [ t m 3 ] *   2160 [ k W h t ] * 3.6 * 10 6   [ J k W h ]
Wood fuel from trees outside forests was estimated based on weight. The energy content was given for fresh wood of conifers and broadleaves. The ratio of conifers to broadleaves was assumed to be 1/10 (cf. Section 2.2.2).
E c o n i f e r s [ J ] =   w e i g h t c o n i f e r s [ t ] * 2260   [ k W h t ] *   3.6 * 10 6   [ J k W h ]
E b r o a d l e a v e s [ J ] =   w e i g h t b r o a d l e a v e s [ t ] * 2160   [ k W h t ] *   3.6 * 10 6   [ J k W h ]
Wood fuel from wood residues. The wood used for energy directly after production processes in sawmills or energy plants was assumed to have a high moisture content (50%), whereas residues from further processing were assumed to be air dry. For TPs, 66% of the wood residues are freshly used and 34% are used later on and therefore considered air dry. For SPs, 60% are freshly used, while 40% come from further processing (air dry) (based on Section 2.2.3, model “wood fluxes Switzerland”). The cutting of conifers and broadleaves occurs in a ratio of 20/1 (roundwood cutting ratio, sawmill residues) [79]. This ratio was also used for wood residues from woodworking companies.
For TPs:
E c o n i f e r s [ J ] =   0.66 * v o l u m e c o n i f e r s [ m 3 ] * 0.758   [ t m 3 ] * 2260   [ k W h t ] + 0.34               * v o l u m e c o n i f e r s   [ m 3 ] * 0.52   [ t m 3 ] * 2260   [ k W h t ] * 3.6 * 10 6   [ J k W h ]
E b r o a d l e a v e s [ J ] =   0.66 * v o l u m e b r o a d l e a v e s [ m 3 ] * 1.116   [ t m 3 ] * 2160   [ k W h t ] + 0.34               * v o l u m e b r o a d l e a v e s   [ m 3 ] * 0.74   [ t m 3 ] * 2160   [ k W h t ] * 3.6 * 10 6   [ J k W h ]
For SPs:
E c o n i f e r s [ J ] =   0.60 * v o l u m e c o n i f e r s [ m 3 ] * 0.758   [ t m 3 ] * 2260   [ k W h t ] + 0.40               * v o l u m e c o n i f e r s   [ m 3 ] * 0.52   [ t m 3 ] * 2260   [ k W h t ] * 3.6 * 10 6   [ J k W h ]
E b r o a d l e a v e s [ J ] =   0.60 * v o l u m e b r o a d l e a v e s [ m 3 ] * 1.116   [ t m 3 ] * 2160   [ k W h t ] + 0.40               * v o l u m e b r o a d l e a v e s   [ m 3 ] * 0.74   [ t m 3 ] * 2160   [ k W h t ] * 3.6 * 10 6   [ J k W h ]
Wood fuel from waste wood was estimated based on weight. The primary energy content was calculated with the calorific value for conifers of 4.02 kWh/kg for conifers and 3.86 kWh/kg for broadleaves (moisture content 20%) [77]. Significantly more coniferous wood is used for processing. Therefore, we used a conifer to broadleaf ratio of 5/1 [73].
E c o n i f e r s =   0.8 f o r   p r o p o r t i o n   o f   c o n i f e r s * w e i g h t w a s t e   w o o d [ k g ] * 4.02   [ k W h k g ] * 3.6 * 10 6   [ J k W h ]
E b r o a d l e a v e s =   0.2 f o r   p r o p o r t i o n   o f   b r o a d l e a v e s * w e i g h t w a s t e   w o o d [ k g ] * 3.86   [ k W h k g ] * 3.6 * 10 6   [ J k W h ]

3. Results

3.1. Wood Fuel from Forests

TPs and SPs show large differences in wood fuel from forests. Considering the different forest management strategies, the respective scenarios, and the reference year of the availability, from 10% up to a considerable 45% of SPs are available from TPs for direct energy use only.

3.1.1. Theoretical Potential

The TP of wood fuel from forests is between 75 and 132 PJ/a for the next 30 years, depending on the management strategy and reference year. Today and in 2035, the strategy LSR offers the greatest potential. Between 2035 and 2050, however, the volume is expected to decrease significantly and the potentials of the strategies CSI and MSR will exceed the potential of the strategy LSR in the long term (Figure 4; Supplementary Information S1, Table S1).

3.1.2. Sustainable Potential

The SP of wood fuel from forests is between 9.1 and almost 47.3 PJ/a for the next 30 years, depending on management strategy, timber market situation, the point in time examined and whether deductions are considered for mortality, reserve areas, harvest losses, material uses and wood harvesting, as well as chipping and transportation costs (Figure 4; Supplementary Information S1, Table S2). This represents a wide range of wood fuel that might be available from forests. The management strategy LSR leads to the largest SP in 2020 and 2035. It decreases, however, by 2035 and 2050 (Figure 4). Wood fuel potentials from the management strategies CSI and MSR will exceed those from LSR in the long term (Figure 4; Supplementary Information S1, Table S2; year 2050). The lower boundaries of the potentials are still within the range of those corresponding to LSR (Figure 4; CSI, MSR). This is mainly due to the uncertainty range given by the multiple replications of the scenario calculations (standard error), harvest losses, material uses of the wood (EO+ wood energy oriented vs. EO− less wood energy oriented) and costs or revenues of ±10 CHF/m3 (=9.5 €/m3 or 10.3 USD/m3, actual exchange rate on 13.04.2020).
Neglecting costs results in the ecologically sustainable potential (ESP; cf. Section 2.2.1) leads to considerable surpluses (Figure 4 (grey lines) and Supplementary Information S1, Table S3). Comparing the ESPs of the different forest management strategies with the corresponding SPs (considering costs) of the CSI (business as usual) indicates surpluses between 64% and almost 200% for the minimum, 60% and 212% for the expected, and 32% and 148% for the maximum scenarios (Supplementary Information S1, Table S4).

3.2. Wood Fuel from Trees Outside Forests

Considering the respective scenarios and time points, TPs and SPs of wood fuel from trees outside forests can be expected to have only slightly higher availabilities in the future. Between 50% and 52% of SPs are available from TPs.

3.2.1. Theoretical Potential

The TP of wood fuel from trees outside forests is between 9.4 and 11.7 PJ/a, for the next 30 years until 2050 (Figure 5; Supplementary Information S2, Table S6). The wood fuel potential increases slightly until 2035 and then remains at the same level until 2050. This goes along with the higher growth increments of the individual trees expected due to climate change and the ingrowth of non-woody landscape areas.

3.2.2. Sustainable Potential

The SP of wood fuel from landscapes is between 4.8 and 6.0 PJ/a, for the next 30 years for the expected scenario (Figure 5; Supplementary Information S2, Table S6). The potential increases slightly until 2035 and then remains at the same level until 2050.

3.3. Wood Fuel from Wood Residues

TPs and SPs show very large differences in wood fuel from wood residues. Considering the respective scenarios and the time point of the availability, only 4–14% of SPs are available from TPs for energy use. Along the value chain of wood harvesting, SPs and TPs result in wood residues for energy of 37% (SPs) to 47% (TPs). At the semi-finished product level, wood residues for energy arise from processing industrial wood, mainly by the production of chipboard and fiberboard (SPs: 17%; TPs: 35%). The difference between TP and SP occurs because an optimistic cascade of use is applied to SPs, as recommended by [13,14,15]. Wood residues for fuel resulting from the production of solid wood and wood-based materials have a share of 21% (TPs) to 26% (SPs) and include sawn timber, veneer and plywood. Further, small quantities of wood residues occur as cellulose and wood pulp in the paper and cardboard industry.

3.3.1. Theoretical Potential

The TP of wood fuel from wood residues is between 53.9 and 68.8 PJ/a, for the next 30 years until 2050, depending on the standard error of the forest management strategy MSR, and the reference year (Figure 6; Supplementary Information S3, Table S9) and current wood market conditions (Section 2.2.3). The TP (Figure 6; Supplementary Information S3, Table S9) shows the upper limit of wood residues for energy use, if the total TP of forest wood is exploited for material use.

3.3.2. Sustainable Potential

The SP of wood fuel from wood residues is between 2.4 and 9.1 PJ/a, for the next 30 years until 2050, depending on the forest harvests in reserve areas, costs and the reference year (Figure 6; Supplementary Information S3, Table S9). The SP represents a wide range of wood fuel from forests being available each year, also considering the wood market situation. The SPs of wood residues continuously decrease until 2050 to a minimum of 2.4 PJ/a and a maximum of 5.9 PJ/a. The forest wood harvesting potentials were used as input for the model (cf. “wood fluxes of Switzerland”, Section 2.2.3) and are shown in Supplementary Information S3, Table S10.

3.4. Wood Fuel from Waste Wood

A large share of the TP of waste wood is sustainably available for wood fuel use. Considering the respective strategies and the time point of the availability, a considerable (82–84%) of SPs are available from TPs for energy use.

3.4.1. Theoretical Potential

The TP of wood fuel from waste wood ranges from 12.9 to 20.9 PJ/a, for the next 30 years (Supplementary Information S4, Table S11). At first, TP increases from 14.3 PJ/a (2020) to 16.5 PJ/a (2035) for the expected scenario. However, after 2035, it increases at a slower rate to 17.1 PJ/a until 2050. Compared to today (TP2020, expected scenario), in 2035 the minimum potential is higher by 3.5% and the maximum by 30%. In 2050, the minimum potential is 7% higher, while the maximum is 32% higher. Minimum quantities are 11% lower than the expected scenario and the maximum quantities are 23% higher in both 2035 and 2050 (Figure 7).

3.4.2. Sustainable Potential

The SP of waste wood ranges from 10.6 to 17.5 PJ/a, for the next 30 years until 2050 (Figure 7 and Supplementary Information S4, Table S11). A slight increase in the potentials is expected. Compared to today (SP2020), the minimum potential in 2035 is 3.5% higher, while the maximum potential is 19% higher. In 2050, the minimum potential is 19% higher and the maximal potential is 49% higher. Compared to the expected scenario, the minimum and maximum quantities are initially (in 2020) 10% lower and higher, respectively, the minimum potentials in 2035 and 2050 are 11% lower, and the maximum potentials are 26% higher in 2035 and 25% higher in 2050.

3.5. All Woody Biomass Types

The TP of wood fuel from all biomass sources is between 93.1 and 148.5 PJ/a, for the next 30 years until 2050, depending on the forest management strategy, forest policy implementation, exporting/importing and the reference year (Figure 8 and Supplementary Information S5, Table S12). The TP gives the upper limit of domestic wood for the energy use, not considering any material purposes. As wood residues and waste wood have their origins in forests and other landscapes, only these two primary sources need to be summed up to account for TP.
The SP of wood fuel is between 26.5 and 77.8 PJ/a for the next 30 years until 2050, depending on the forest management strategy, development of costs, harvest losses, forest policy implementation (e.g., reserve areas, use of wood from landscapes), exporting/importing and the reference year (Figure 8, Supplementary Information S5, Table S13).
Compared to the SP2020 for the management strategy CSI, surpluses of 43% to 47% occur when the management strategy MSR is applied, while the implementation of LSR results in surpluses of 84–89% (Supplementary Information S1, Table S3) for 2020. For SP2035, potentials 22% to 49% higher can be expected compared to continuation with the management strategy CSI. The large range can be explained mainly by the different sorting of wood compartments for material and energy use according to the EO− and EO+ market situations, the cost elasticity of 20 CHF/m3, the different assumptions for the minimum and maximum harvest losses, and the larger deductions for reserve areas (cf. Section 2.2.1). For SP2050, the potentials resulting from stock reduction strategies (MSR, LSR) decrease slightly compared to 2035. However, while potentials for MSR are within the same range as those for CSI, the potentials for LSR are lower, especially when considering an EO− market situation (Figure 8; Supplementary Information S5, Table S12).
Overall, the largest amount of wood fuel is provided from forests, but this share decreases continuously in the future. At the same time, the range of the amount of wood fuel from trees outside forests becomes broader. Potentials in the minimum scenario become lower and those in the maximum scenario become higher. Moreover, the share of wood residues decreases during the next 30 years, while the share of waste wood increases at least in the last time step (2035–2050) (Figure 9; Supplementary Information S5, Table S13).

4. Discussion

The current and long-term fuel potentials of woody biomass are compared with the annual gross energy consumption in Switzerland and with all biomass types (including non-woody) (Section 4.1). Since forest wood is the main source of all the woody biomass types, we analyze the potentials with regard to their original source but also to the subsequent timber industries (wood residues) and the final use of wooden products (waste wood) (Section 4.2). We differentiate between levels of wood fuel consumption by comparing the different assortments of wood compartments, which makes it possible to discuss the contribution to a more circular or cascade-oriented wood fuel market (Section 4.3). Finally, the key drivers are put into context of the wood fuel potentials and are discussed critically (Section 4.4).

4.1. Context of Wood Fuel Potentials

Today, the share of wood fuel is 3.8% of the total gross energy consumption in Switzerland (~1100 PJ) [80]. This corresponds closely to the SPs for the CSI (business as usual) strategy in 2020, according to the “expected” level of wood fuel consumption (CSI: 44.7 PJ, Figure 9, Supplementary Information S5, Table S13). In the long-term perspective, the SP of CSI is rather stable (2035, 46.7 PJ; 2050, 42.6 PJ). Estimations for alternative, more intensive forest management strategies (MSR, LSR) show biomass surpluses in the short (2020) and mid-term (2035) compared with values for CSI. With these management strategies, the minimum SPs estimated for the wood consumption (SP2020 and SP2035, MSR: ~40 PJ; LSR: ~45 PJ) are already able to cover the current Swiss wood fuel demand for the next 15 years. Considering the “expected” or the more optimistic “maximum” scenarios the strategies fostering stock reductions (MSR, LSR) offer additional potentials on a temporary basis during the energy transition phase. In contrast to the LSR, however, the MSR does not result in a considerable decline in wood fuel from forests expected in 2050 (Table 5). These alternative strategies could result in larger shares of sustainable woody biomass (SPs) compared to the actual annual gross energy consumption of 3.7–6.5% (MSR) and 4.0–7.1% (LSR) in the next 15 years (2020, 2035).
Burg et al. [39] assessed TPs and SPs of future wet biomass (non-woody) in Switzerland using a similar approach. Starting with the current biomass potentials [30], they estimated future availability and variation of resources by taking into account selected drivers and their projected future development. Combining the results of our study with those form [20,30,39] allowed current and future potentials for all biomass types (woody and non-woody) to be presented in one graph (Supplementary Information S6, Figure S1; Supplementary Information S6, Table S14). The share of sustainable woody biomass compared to all sustainable biomass is 42–64% for the next 15 years and declines to 37–57% by 2050. At the same time, all domestic biomass contributes to the Swiss gross annual energy consumption, with sustainable potentials between 7% (72 PJ) and 11% (122 PJ).

4.2. Alternative Forest Wood Management Strategies

Forest wood and the lower wood fuel potentials of trees outside forests are the source of all domestic woody biomass and its subsequent uses. As forest wood contributes the largest share, the amount available for wood fuel use depends largely on the forest management strategy applied. Among the three strategies examined here, MSR tends to result in faster growth by reducing the share of mature forests without hampering forest resources and future wood potentials [20]. Shorter rotation time results in younger forests, with faster growth, and a significant increase in the amount of wood suitable for energy or material use. This also results in smaller amounts of carbon stocked in the above-ground biomass. Increasing wood turnover in forests may lead to significantly higher carbon sequestration rates, larger harvesting amounts, and additional carbon storage in wooden products if subsequent timber industries are able to process additional wood amounts and emission- and energy-intensive materials and fuel are substituted with wooden material. The coupling of wood harvests from forests with the potential from wood residues (Section 2.2.3) implies, however, the domestic processing of surpluses. We assumed that larger wood harvests under a stock reduction scenario (MSR) can be processed by the industry. Evidence for this assumption at least in the short term is given, for example, by the large wood amounts derived during past storm events such as Kyrill (2007) or Burglind (2018). In the subsequent years, cutting amounts in saw mills significantly increased due to salvage logging [52,81], despite the steady decline of processing companies (N = 958, 1991 vs. N = 347, 2017; [52]). Benefits to decarbonization strategies of the Swiss government [82] and the creation of local and sustainable value-added chains are largely dependent on waste wood processing efficiency, wood storage effects (in the case of biogenic carbon accounting), and available cascading options [15].
To reduce the environmental impacts of wood use, Mehr et al. [15] suggest a high-quality wood cascade of wooden beams as a promising recycling path. Other evidence for an implementation of the MSR strategy is that it is expected to be favored by the forestry and timber industry because it leads to improved stability of forest stands against windthrow, pathogen calamities and forest fires, as well as greater diversity of structures and species, and enhanced flexibility in changing tree species. This is particularly seen as a consequence when MSR is combined with shorter rotation times or in response to climate change [20,83]. Today, the degree of salvage loggings in Switzerland due to severe bark beetle calamities (1.4 M m3 in 2019/2020) [84] points to a more intensive management. Large-scale integration of stock reduction management in Switzerland is difficult due to the small structures of forest enterprises and large number of small private forest owners, as well as a lack of wood demand [85], but this strategy could benefit from Switzerland’s large share of public forest area ownership of 71% [73]. Despite its short-term advantages from the view of the potentials alone, the high-intensity management strategy LSR would result in a significant restructuring of forests due to 40% shorter rotation times [20] and accordingly thinner wood compartments, limiting the substitution of more energy-intensive and environmentally harmful materials such as concrete [86]. In the long term (2050), limited possibilities for the substitution of emission- and energy-intensive materials may also lead to less wood fuel from the wood-processing industries (wood residues) and the end-of-life products (waste wood). Therefore, long-term carbon storage in forests and wooden products and added values from woodworking industries are at risk.
Harvesting transportation and chipping costs largely influence the SPs of the different forest managements [20]. We calculated the ecologically sustainable potential (ESP), which represents a “theoretical” potential where the only limitations considered are those imposed by measures to protect biodiversity (in its legal specifications, such as protected areas; [64]) and dead wood (mortality; [45]), including recommendations on harvest losses ([26]; cf. Section 2.2.1) leading to dead wood for flora and fauna and therefore soil nutrients. In this sense, ESP enables the quantification of an upper limit when costs are not a restriction, or revenues increase. The surpluses of ESPs result compared to the corresponding SPs (forest management strategy, scenario, year) were +32% to +75% for CSI, +39% to +156% for MSR and +17% to +200% for LSR (Supplementary Information S1, Table S4).
As a shift in species influences the calorific value and thus the energy content of the wood. Each additional volume unit of broadleaves instead of coniferous wood results in 40% larger wood fuel per unit if values for broadleaves (1.116 t/m3; 2160 kWh/t) and for conifers (0.758 t/m3; 2260 kWh/t) are applied (references cf. Section 2.2.5). Today, the proportion of wood fuel consists of 31% broadleaves. They account today for 72% of logs and 62% of chips [73]. Over the whole time period (2020−2050) within the three scenarios, the variations in broadleaves and conifer proportions are small (<±1%). However, between the scenarios, broadleaves have a share on the stocks of 39% (CSI), 40% (MSR) and 43% (LSR) and on increment of 45% (CSI), 46% (MSR) and 47% (LSR).
Trees outside forests and shrubs cut can also contribute to wood fuel potentials. Thus, it is worth mentioning that the main reasons for utilization are safety aspects (e.g., visibility along streets), increased biodiversity, biotope conservation or flood protection [51,67]. As no detailed inventory on the growth of Swiss domestic trees outside forests was available, we assumed values of forest trees to account for growth changes with altitude and had to rely on expert interviews for growth on optimal locations, conducted in [67]. This explains the assumption of the high uncertainty ranges for the minimum and maximum potentials of 20% (TP2020) to 60% (TP2050) for wood from trees outside forests (Section 2.2.2). The wide ranges may be of little importance as the share of wood from these landscapes is rather small compared to the amounts of other woody biomass types, but they indicate the high degree of uncertainty given that literature and data availability of the main input parameters in areas outside forests (e.g., annual growth) are extremely limited.

4.3. Level of Wood Fuel Consumption

The assortment of wood compartments on wood markets is highly relevant for the quantity of wood fuel provision, its allocation to material purposes, of use and their added value along the process chain [15,20,50,87]. Today, the allocation of assortments (for energy and material use) is dependent on the demand for material products made from wood and the needs and possibilities for energy production also determine the degree of cascade use and circular economy of wood products. While circular economy focuses on how resources can be kept in the system (minimizing primary resources), the cascade concept places the focus on various (hierarchical) end-of-life utilization options. By focusing on wood and other bio-based resources, a cascade concept could be considered to form a connection between circular economy and the (wood or) bio-economy, fostering an inclusive, circular bio-economic vision in the future [88]. Therefore, the discussion on applying a less wood energy-oriented (EO−) or wood energy-oriented (EO+) market situation, including the subsequent woodworking industries, may offer integration strategies for wood fuel use in cascade and circular concepts.
The EO− market situation assorts larger shares of wood compartments (roundwood) for material processing. This increased use of wood for materials directly after harvests creates additional wood residues from processing but also allows for the reuse and recycling of wood residues and wooden products [15]. The basis for reuse and recycling is given by physical properties of wooden products, such as particle size or the presence of chemicals [89]. In an EO− market, this is 20–30% of the thicker R4–R6 (0.40–>0.60 m) compartments and 15–20% of the thinner R1–R3 (0.10–0.39 m) compartments in the case of conifers and for 30–40% of all roundwood (R2–R6, 0.20–>0.60 m) compartments for broadleaves (Supplementary Information S1, Table S5). No quantities for material use are considered for bark, brushwood and the thinnest class of broadleaves (R1, 0.1–0.19 m) in either market situation [20]. This may overestimate the sustainable wood fuel potentials for energy from forests because small wood parts can currently also be used for material processing [90]. For the other compartments, the EO− market requires (as also surpluses from forest management) the necessary processing capacity of sawmills and the corresponding demand for sawn timber of the subsequent wood-processing companies. In Switzerland today, some processing industries are absent to account for complete regional cascades [13]. In particular, many material-processing companies have closed (e.g., PAVATEX) or moved abroad due to excessively high operating costs, e.g., due to the strong Swiss Franc [91]. These industries are considered important for implementing full concepts and combining circular economy with cascade options including final energy use. However, the price of wood energy has been high for many years and exceeds the price of industrial wood [85], and it is also a consequence of the huge amounts of imported (finished) wood products, as production costs abroad are lower. This may lead to even lower prices for domestic wood materials and construction wood and promote energy use of also thicker wood compartments directly after harvests. In particular, imports are concentrated on the amounts of finished or semi-finished wooden products [92] and therefore reduce the need for domestic wood for material processing. As a result, domestic wood resources are sometimes used too early in the process chain to optimize wood use for energy (e.g., in terms of full carbon storage, added value or substitution). This means wood suitable for material purposes is used for energy instead. Furthermore, large transportation distances hinder sustainable and climate-smart use of wood trading. By exporting the raw timber, coupled wood residues and future wastes occurring within the next processing steps (and their added value) are also lost, as residues and wastes occur abroad in the subsequent timber processing steps [51]. Finally, the importing of semi-finished products, sawn timber, plywood, chipboard, fiberboard, construction and packaging materials, wooden products and furniture (e.g., IKEA) leads—after further processing or at the end of their life cycle—to additional potential wood fuel quantities from abroad. By assessing waste wood directly at the facility sites, our estimates also take into consideration these imported and exported quantities.
From an environmental point of view, waste wood processing efficiencies and available cascade options are decisive for the total environmental impacts [15], as they largely depend on the production structure, environmental circumstances, local policies, regulations and economic resources [37]. It is particularly relevant which other products are substituted during the cascade and how completely and efficiently wood can be used for energy production in the end. In terms of greenhouse gas emissions, wood use is beneficial in most applications. Benefits are particularly high when replacing heat from oil or gas, substituting for energy-intensive products such as primary metals, plastic and concrete in constructions and furniture [92], or functioning in difficult-to-decarbonize sectors such as aviation, heavy transportation (e.g., trucks, forwarders, agricultural machines), and manufacturing [6]. Therefore, it is important to consider what for the substituted, often non-renewable (e.g., fossil) products are used for and whether they are able to support the production and supply security of high value products (e.g., medicines, paints, notebooks, car fittings) and therefore potentially have valuable social benefits.
In implementing the energy use of wood, special requirements regarding the preparation and recycling of already used and treated wood (waste wood) have to be considered [53,93,94,95]. Furthermore, the orientation towards an EO− market would support continuously and significantly larger resource quantities for one or more processing steps. In this way, most of the resource stays available as a storable, regional (depending on the distribution of energy plants and locations of SPs) energy carrier in future, simultaneously increasing the carbon storage in wooden products [96]. However, the use of waste wood and wood residues for energy takes place within a certain timeframe [97]. Therefore, the desired convergence towards a cascade and more circular economy in Switzerland [13] and Europe (e.g., [89,98]) could temporarily lower wood fuel potentials from residues because of better integration of processed and already used wood for product processing in (innovative) cascades, closed loops and recycling, innovative collaborations and products [88,99]. Later on, when wood residues are used more efficiently for materials, a shift in wood fuel from wood residues towards wood fuel potentials from waste wood can be expected. Wood from trees outside forests are mainly thinner compartments from shrubs, trees and hedges, especially along water resources, roads, paths, railway lines and building yards, orchards and vineyards or bush and shrub vegetation. Therefore, the potential for material use is particularly low (e.g., 7% according to [67]).

4.4. Other Key Drivers and Critical Remarks

With our analyses, we aimed to quantify woody biomass potentials and their development with regard to their original source and realistic ranges. However, the different key drivers and the determination of future sustainable potentials were combined with different restrictions relevant for the individual biomass types. This makes it difficult to evaluate the effects of the individual influences on the potentials. Therefore, we concentrated on forest management strategies with different harvesting costs (Section 4.1 and Section 4.2) and material uses with different wood markets (circular or cascading concepts) (Section 4.3). Nonetheless, other drivers and restrictions have an influence. We rely mainly on various literature values (Section 2.2.1, Section 2.2.2, Section 2.2.3 and Section 2.2.4), but their qualitative validation provides confidence in their accuracy.
Climate change influences the growth of forests and timber positively (e.g., temperature) and negatively (e.g., drought) via biotic and abiotic factors. Furthermore, nitrogen deposition, among others, affect the primary growing conditions of forests well below a classical rotation period [100,101,102,103]. In our simulations, we expected site characteristics promoting wood fuel from forests and trees outside forests to be favored in the future due to climate change. Overall, we expect climate change to lead to an additional net growth of 11% in 2035 and 10% in 2050 (cf. Section 2.2.1) [49,62]. This adds additional wood fuel biomass to TPs of 10.4–15.0 PJ in 2035 and 9.4–13.6 PJ in 2050. The lowest additional amounts are based on the forest management of CSI and the largest on LSR. However, the effect of changing site conditions on the potentials of woody biomass from forests may be even greater than the total woody biomass coming from trees outside forests in the long term.
The change in forest area size of +3% (2035) and +6% (2050) is more pronounced in coline and mountainous regions (>12%, [56]). This is particularly true where, e.g., forest limits move upwards due to climate change [104] or where land-use change occurs—for example, the abandoned Alps are less and less cultivated by summering cattle mainly due to more fodder availability on the home farm [105]. Forests will have to adapt not only to changes in mean climate variables but also with a likely increased risk of extreme weather events, such as prolonged drought, storms and floods (e.g., [106]). Especially in northern and western Europe, the increasing atmospheric CO2 content and warmer temperature are expected to result in positive effects on forest growth and wood production, at least in the short–medium term. On contrary, more frequent droughts and disturbance risks will cause adverse effects [107]. For example, ref. [108] shows high vulnerability particularly in the second half of the twenty-first century in the eastern Alps. They indicate a strong decline in productivity, timber and carbon stocks, biodiversity, disturbances, a tree species’ position in fundamental niche space, silvicultural flexibility and cost intensity. Most negatively affected were sites on calcareous bedrock, whereas assessment units at higher altitudes responded predominately positively to an increase in temperature. Such negative impacts may outweigh positive trends [107]. Therefore, a change of disturbance events (e.g., storms or droughts) may consequently change increment and mortality and may outweigh other key drivers of the simulation. Regions with longer drought periods and more frequent and violent thunderstorms, as well as those where reforestations occur for economic reasons, can also be expected to see larger changes in forest area size. Thus, increased productivity of the sward and longer summer farming periods, as well as subsidies, aim to maintaining the current status and increase the ecological quality of pastures [105]. In contrast, in the Swiss Central Plateau, where forest areas remain stable [17], the pressure on forests is constantly increasing, especially as the growth in population is accompanied by a growing demand for settlements and infrastructures. Since the forests in Switzerland are protected by law [109], the changes outside forests mainly occur at the expense of barely cultivated agricultural land. This supports our assumption of a continued increase in stocked areas of trees outside forests due to the extension of settlement areas with yards or greenings (stocked areas). We based our assumption on past development of trees outside forests (Section 2.2.2), which corresponds to a +0.46% stocked area annually. However, as building land reserves are limited and the desired densification of already zoned areas are intended by law [110], the assumption of a stagnation in non-forest landscape area growth in 2035 seems realistic as, for example, no further stocked surroundings of building are expected.
Furthermore, the approach considering wood fuel potentials according to their original sources has the advantage that the volumes of wood residues are determined in accordance with changes in forest management or energy markets, while simultaneously including imported end products of wood occurring with a time lag as waste wood. However, this also means that volumes of wood residues within this study are not directly related to the woodworking and processing companies where they de facto occur. Therefore, wood fuel from wood residues contribute only a very small share of SPs (4–14%) compared to TPs. This is because TPs of wood residues are calculated according to their original forest sources and therefore are related to TPs of harvesting. Related wood residues only occur if wood working companies are able to process these huge amounts. In contrast, SPs of wood fuel from wood residues are calculated with SPs of forest harvesting (Supplementary Information S3, Table S10). They account for restrictions of protected areas, harvest losses, assortments (wood market: EO−) and costs. Additionally, parts of the processed wood (~45%, cf. Figure 3, recycling vs. energy) are used for recycling and occur after several processing steps for energy or as waste wood at the end of the product’s life cycle. On the one hand, the modeled wood market EO− simulates a shift towards the more desired, cascade-oriented wood market (cf. Section 4.3). On the other hand, wood residues are kept in the system with circular economy or cascade use and result in at least a temporary shift of wood fuel from wood residues towards waste wood (Section 4.3). As a consequence of this shift, increased wood fuel amounts from waste wood result (2020, 12.9 to 15.8 PJ; 2050, 15.3 to 20.9 PJ, Supplementary Information S4, Table S11). Furthermore, the driver population growth assumes equal wood consumption per person during the coming years to reach higher SPs and TPs in 2035 and 2050 by approximately 20% (cf. Section 2.2.4).

5. Conclusions

Our analysis indicates that wood fuel potentials can be expected to be stable enough to provide sustainable potentials (SPs) within the next 15 years. This is also the case if the original sources are combined with their subsequent woodworking industries, as wood fuel amounts from a minimum of ~34 PJ/a to a temporary maximum of ~78 PJ/a are available. The moderate stock reduction (MSR) forest management alternative leads to larger amounts of wood resources, especially in the short term, without causing future resource shortages of wood fuel and wood for materials compared to the business as usual (CSI) strategy. Simultaneously, the large stock reduction (LSR) offers higher additional potentials in the short term but will likely lead to smaller amounts available for wood fuel in 2050. Additionally, thinner compartments are expected with LSR, leading to a potential risk for the material wood markets. The shorter rotation times of LSR and MSR may increase flexibility in forest management and could provide a more stable basis for dealing with climate change and extremes while increasing the potential for the energy transition. In particular, with the current forced uses of wood in Switzerland due to drought, bark beetle infestation and windthrow as a consequence of climate change and extreme weather events, the actual harvests come very close to the quantitative estimation obtained with the MSR strategy.
When costs are not a restriction (e.g., due to subsidies and more efficient technologies and processes) or revenues increase significantly (e.g., higher prices for energy), the resulting ecologically sustainable potential (ESP) yields large surpluses of approximately one-fifth up to three-fold more (LSR, 2035, scenario maximum; cf. Section 4.2) compared to the corresponding (scenario and point in time) sustainable potential (SP) of the business as usual strategy (CSI). If the wood market is less energy oriented (EO−), circular economy and cascade uses of wood can be supported, as more wood is assorted towards material uses first but is still available for wood fuel with a time lag and a shift in wood fuel form forests towards wastes occurring during wood processing (as wood residues) or ideally at the end of the product’s life cycle (as waste wood). For implementation, a more circular economy like this requires the necessary processing capacities of the subsequent timber industries, as well as the energy plants for the wood fuel conversion to heat, electricity, liquid fuel or wood gas. The needed infrastructures could be better planned when wood fuel potentials’ development is combined with the desired cascade use and circular economy at a high spatial resolution, enabling more efficient and effective transport of resources from the harvesting locations to the plants. In terms of carbon storage, living biomass as well as storage in subsequent timber products is considered of key importance, particularly if emission- and energy-intensive products are substituted. Shorter rotation periods promoting regrowth and carbon storage in young plants can therefore lead to an increasing carbon stock.

Supplementary Materials

Supplementary Materials are available online at https://www.mdpi.com/2071-1050/12/22/9749/s1.

Author Contributions

Conceptualization, M.E., V.B., O.T. and J.S.; data curation, M.E., O.T. and G.S.; formal analysis, M.E., V.B. and O.T.; funding acquisition, O.T.; investigation, M.E. and O.T.; methodology, M.E., V.B. and O.T.; project administration, O.T.; supervision, O.T. and M.F.; validation, M.E., V.B., L.B., O.T., M.F. and J.S.; visualization, M.E., V.B., L.B., O.T., M.F. and J.S.; writing—original draft, M.E., O.T. and J.S.; writing—review and editing, M.E., V.B., L.B., O.T., M.F., G.S. and J.S. All authors have read and agreed to the published version of the manuscript.

Funding

This research project is part of the Swiss Competence Center for Energy Research—Biomass for Swiss Energy Future (SCCER BIOSWEET), which is financially supported by the lnnosuisse—Swiss Innovation Agency.

Acknowledgments

We thank Melissa Dawes and Colm Kelly for supporting the writing process, with English editing and helpful ideas. Furthermore, we thank Gillianne Bowman for her valuable support with figures and illustrations.

Conflicts of Interest

The authors declare no conflict of interest. The funders had no role in the design of the study; in the collection, analyses, or interpretation of data; in the writing of the manuscript, or in the decision to publish the results.

References

  1. George, G.; Schillebeeckx, S.J.D.; Liak, T.L. The Management of Natural Resources: An Overview and Research Agenda. Acad. Manag. J. 2015, 58, 1595–1613. [Google Scholar]
  2. Kirchner, A.; Bredow, F.; Grebel, T.; Hofer, P.; Kemmler, A.; Ley, A.; Piégsa, A.; Schütz, N.; Strassburg SStruwe, J. Die Energieperspektiven für die Schweiz bis 2050, Energienachfrage und Elektrizitätsangebot in der Schweiz 2000–2050; Prognos AG: Basel, Switzerland, 2012; p. 842. [Google Scholar]
  3. Long, H.; Li, X.; Wang, H.; Jia, J. Biomass resources and their bioenergy potential estimation: A review. Renew. Sustain. Energy Rev. 2013, 26, 344–352. [Google Scholar]
  4. Li, Y.; Rezgui, Y.; Zhu, H. District heating and cooling optimization and enhancement—Towards integration of renewables, storage and smart grid. Renew. Sustain. Energy Rev. 2017, 72, 281–294. [Google Scholar]
  5. Lauri, P.; Havlík, P.; Kindermann, G.; Forsell, N.; Böttcher, H.; Obersteiner, M. Woody biomass energy potential in 2050. Energy Policy 2013, 66, 19–31. [Google Scholar]
  6. Reid, W.V.; Ali, M.K.; Field, C.B. The future of bioenergy. Glob. Chang. Biol. 2020, 26, 274–286. [Google Scholar]
  7. European Academies Science Advisory Council. Multi-Functionality and Sustainability in the European Union’s Forests; German National Academy of Sciences: Halle, Germany, 2017; p. 51. [Google Scholar]
  8. Sigsgaard, T.; Forsberg, B.; Annesi-Maesano, I.; Blomberg, A.; Bølling, A.; Boman, C.; Bønløkke, J.; Brauer, M.; Bruce, N.; Héroux, M.-E.; et al. Health impacts of anthropogenic biomass burning in the developed world. Eur. Respir. J. 2015, 46, 1577–1588. [Google Scholar]
  9. Barreiro, S.; Schelhaas, M.-J.; Kändler, G.; Antón-Fernández, C.; Colin, A.; Bontemps, J.-D.; Alberdi, I.; Condés, S.; Dumitru, M.; Ferezliev, A.; et al. Overview of methods and tools for evaluating future woody biomass availability in European countries. Ann. For. Sci. 2016, 73, 823–837. [Google Scholar]
  10. Schuldt, B.; Buras, A.; Arend, M.; Vitasse, Y.; Beierkuhnlein, C.; Damm, A.; Gharun, M.; Grams, T.E.; Hauck, M.; Hajek, P.; et al. A first assessment of the impact of the extreme 2018 summer drought on Central European forests. Basic Appl. Ecol. 2020, 45, 86–103. [Google Scholar]
  11. Bowditch, E.; Santopuoli, G.; Binder, F.; Del Río, M.; La Porta, N.; Kluvankova, T.; Lesinski, J.; Motta, R.; Pach, M.; Panzacchi, P.; et al. What is Climate-Smart Forestry? A definition from a multinational collaborative process focused on mountain regions of Europe. Ecosyst. Serv. 2020, 43, 101113. [Google Scholar]
  12. Schweier, J.; Magagnotti, N.; Labelle, E.R.; Athanassiadis, D. Sustainability Impact Assessment of Forest Operations: A Review. Curr. For. Rep. 2019, 5, 101–113. [Google Scholar]
  13. Federal Office for the Environment (FOEN); Swiss Federal Office of Energy (SFOE); State Secretariat for Economic Affairs (SECO). (Eds.) Ressourcenpolitik Holz. Strategie, Ziele und Aktionsplan Holz; Federal Office of the Environment (FOEN)/Federal Office of Energy (SFOE)/State Secretariat for Economic Affairs (SECO): Bern, Switzerland, 2018; p. 62. [Google Scholar]
  14. Federal Office for the Environment (FOEN); Swiss Federal Office of Energy (SFOE); State Secretariat for Economic Affairs (SECO). (Eds.) Ressourcenpolitik Holz. Strategie, Ziele und Aktionsplan Holz; Federal Office of the Environment (FOEN)/Federal Office of Energy (SFOE)/State Secretariat for Economic Affairs (SECO): Bern, Switzerland, 2014; p. 36. [Google Scholar]
  15. Mehr, J.; Vadenbo, C.; Steubing, B.; Hellweg, S. Environmentally optimal wood use in Switzerland—Investigating the relevance of material cascades. Resour. Conserv. Recycl. 2018, 131, 181–191. [Google Scholar]
  16. Farrell, E.P.; Führer, E.; Ryan, D.; Andersson, F.; Hüttl, R.; Piussi, P. European forest ecosystems: Building the future on the legacy of the past. For. Ecol. Manag. 2000, 132, 5–20. [Google Scholar]
  17. Brändli, U.B.; Abegg, M.; Allgaier, L. (Red.), Swiss National Forest Inventory, Results of the Fourth Survey 2009–2017; Swiss Federal Institute for Forest, Snow and Landscape Research WSL: Birmensdorf, Switzerland; Federal Office of the Environment (FOEN): Bern, Switzerland, 2020; p. 341. [Google Scholar]
  18. Schulze, E.-D.; Sierra, C.A.; Egenolf, V.; Woerdehoff, R.; Irslinger, R.; Baldamus, C.; Stupak, I.; Spellmann, H. The climate change mitigation effect of bioenergy from sustainably managed forests in Central Europe. GCB Bioenergy 2020, 12, 186–197. [Google Scholar]
  19. Zhang, F.; Johnson, D.M.; Wang, J.; Liu, S.; Zhang, S. Measuring the Regional Availability of Forest Biomass for Biofuels and the Potential of GHG Reduction. Energies 2018, 11, 198. [Google Scholar]
  20. Thees, O.; Erni, M.; Lemm, R.; Stadelmann, G.; Zenner, E.K. Future potentials of sustainable wood fuel from forests in Switzerland. Biomass Bioenergy 2020, 141, 105647. [Google Scholar]
  21. Wörsdörfer, M. The Future of Petrochemicals, Director of Sustainability, Technology and Outlooks; Brussels-EU Refining Forum: Brussels, Belgium, 2018. [Google Scholar]
  22. Hu, H.; Wu, M. Heavy oil-derived carbon for energy storage applications. J. Mater. Chem. A 2020, 8, 7066–7082. [Google Scholar]
  23. Searle, S.; Malins, C. A reassessment of global bioenergy potential in 2050. GCB Bioenergy 2015, 7, 328–336. [Google Scholar]
  24. Bončina, A.; Simončič, T.; Rosset, C. Assessment of the concept of forest functions in Central European forestry. Environ. Sci. Policy 2019, 99, 123–135. [Google Scholar]
  25. Trutnevyte, E.; Guivarch, C.; Lempert, R.; Strachan, N. Reinvigorating the scenario technique to expand uncertainty consideration. Clim. Chang. 2016, 135, 373–379. [Google Scholar]
  26. Hepperle, F. Prognosemodell zur Abschätzung des Regionalen Waldenergieholzpotenzials auf der Grundlage Forstlicher Inventur- und Planungsdaten unter Berücksichtigung Ökologischer, Technischer und Wirtschaftlicher Nutzungseinschränkungen; Fakultät für Forst und Umweltwissenschaften der Albert-Ludwigs-Universität Freiburg im Breisgau: Freiburg im Breisgau, 2010; p. 165. [Google Scholar]
  27. Baier, U.; Baum, S. Biogene Güterflüsse der Schweiz 2006, Massen- und Energieflüsse; Bundesamt für Umwelt (BAFU): Bern, Switzerland, 2006; p. 114. [Google Scholar]
  28. Balat, M. Use of biomass sources for energy in Turkey and a view to biomass potential. Biomass Bioenergy 2005, 29, 32–41. [Google Scholar]
  29. Steubing, B.; Zah, R.; Waeger, P.; Ludwig, C. Bioenergy in Switzerland: Assessing the domestic sustainable biomass potential. Renew. Sustain. Energy Rev. 2010, 14, 2256–2265. [Google Scholar]
  30. Burg, V.; Bowman, G.; Erni, M.; Lemm, R.; Thees, O. Analyzing the potential of domestic biomass resources for the energy transition in Switzerland. Biomass Bioenergy 2018, 111, 60–69. [Google Scholar]
  31. Thrän, D.; Seidenberger, T.; Zeddies, J.; Offermann, R. Global biomass potentials—Resources, drivers and scenario results. Energy Sustain. Dev. 2010, 14, 200–205. [Google Scholar]
  32. Verkerk, P.J.; Fitzgerald, J.B.; Datta, P.; Dees, M.; Hengeveld, G.M.; Lindner, M.; Zudin, S. Spatial distribution of the potential forest biomass availability in Europe. For. Ecosyst. 2019, 6, 1–11. [Google Scholar]
  33. Vavrova, K.; Knapek, J.; Weger, J. Short-term Boosting of Biomass Energy Sources—Determination of Biomass Potential for Prevention of Regional Crisis Situations. Renew. Sustain. Energy Rev. 2017, 67, 426–436. [Google Scholar]
  34. Gustavsson, L.; Sathre, R. Variability in energy and carbon dioxide balances of wood and concrete building materials. Build. Environ. 2006, 41, 940–951. [Google Scholar]
  35. Hagemann, N.; Gawel, E.; Purkus, A.; Pannicke, N.; Hauck, J. Possible Futures towards a Wood-Based Bioeconomy: A Scenario Analysis for Germany. Sustainability 2016, 8, 98. [Google Scholar]
  36. Vadenbo, C.; Tonini, D.; Burg, V.; Astrup, T.F.; Thees, O.; Hellweg, S. Environmental optimization of biomass use for energy under alternative future energy scenarios for Switzerland. Biomass Bioenergy 2018, 119, 462–472. [Google Scholar]
  37. Heräjärvi, H.; Kunttu, J.; Hurmekoski, E.; Hujala, T. Outlook for modified wood use and regulations in circular economy. Holzforschung 2019, 2019, 10. [Google Scholar]
  38. Aylott, M.J.; Casella, E.; Tubby, I.; Street, N.R.; Smith, P.; Taylor, G. Yield and spatial supply of bioenergy poplar and willow short-rotation coppice in the UK. New Phytol. 2008, 178, 358–370. [Google Scholar]
  39. Burg, V.; Bowman, G.; Hellweg, S.; Thees, O. Long-Term Wet Bioenergy Resources in Switzerland: Drivers and Projections until 2050. Energies 2019, 12, 3585. [Google Scholar]
  40. Werner, C.; Haas, E.; Grote, R.; Gauder, M.; Graeff-Hönninger, S.; Claupein, W.; Butterbach-Bahl, K.; Grote, R. Biomass production potential fromPopulusshort rotation systems in Romania. GCB Bioenergy 2012, 4, 642–653. [Google Scholar]
  41. Aust, C.; Schweier, J.; Brodbeck, F.; Sauter, U.H.; Becker, G.; Schnitzler, J.-P. Land availability and potential biomass production with poplar and willow short rotation coppices in Germany. GCB Bioenergy 2014, 6, 521–533. [Google Scholar]
  42. Van Meerbeek, K.; Muys, B.; Hermy, M. Lignocellulosic biomass for bioenergy beyond intensive cropland and forests. Renew. Sustain. Energy Rev. 2019, 102, 139–149. [Google Scholar]
  43. Brosowski, A.; Thrän, D.; Mantau, U.; Mahrod, B.; Erdmann, G.; Adlera, P.; Stinner, W.; Reinholde, G.; Heringe, T.; Blankec, C. A Review of Biomass Potential and Current Utilisation—Status quo for 93 Biogenic Wastes and Residues in Germany. Biomass Bioenergy 2016, 95, 257–272. [Google Scholar]
  44. Mantau, U.; Saal, U.; Prins, K.; Streierer, F.; Lindner, M.; Verkerk, H.; Eggers, J.; Leek, N.; Oldenburger, J. EUwood—Real Potential for Changes in Growth and Use of EU Forests 2010, Final Report; EFI: Hamburg, Germany, 2010; p. 160. [Google Scholar]
  45. Stadelmann, G.; Temperli, C.; Rohner, B.; Didion, M.; Herold, A.; Rösler, E.; Thürig, E. Presenting MASSIMO: A Management Scenario Simulation Model to Project Growth, Harvests and Carbon Dynamics of Swiss Forests. Forests 2019, 10, 94. [Google Scholar]
  46. Brändli, U.-B. (Ed.) Ergebnisse der Dritten Erhebung 2004–2006; Schweizerisches Landesforstinventar; Eidg. Forschungsanstalt für Wald, WSL: Birmensdorf, Switzerland; Bundesamt für Umwelt (BAFU): Bern, Switzerland, 2010; p. 316. [Google Scholar]
  47. Frutig, F.; Thees, O.; Lemm, R.; Kostadinov, F. Holzernteproduktivitätsmodelle HeProMo-Konzeption, Realisierung, Nutzung und Weiterentwicklung, Grundlagen, Methoden und Instrumente; Eidg. Forschungsanstalt WSL: Birmensdorf, Switzerland, 2009; pp. 441–466. [Google Scholar]
  48. Holm, S.; Frutig, F.; Lemm, R.; Thees, O.; Schweier, J. HeProMo: A Decision Support Tool to Estimate Wood Harvesting Productivities. PLoS ONE 2020. Submitted. [Google Scholar]
  49. Federal Office for the Environment (FOEN). Faktenblatt zur Strategie des Bundesrates «Anpassung an den Klimawandel in der Schweiz»; Anpassung an den Klimawandel; Sektor Waldwirtschaft: Bern, Switzerland, 2013. [Google Scholar]
  50. Thees, O.; Kaufmann, E.; Lemm, R.; Bürgi, A. Energieholzpotenziale im Schweizer Wald. Schweiz. Z. Forstwes. 2013, 164, 351–364. [Google Scholar]
  51. Thees, O.; Burg, V.; Erni, M.; Bowman, G.; Lemm, R. Biomassenpotenziale der Schweiz für die Energetische Nutzung, Ergebnisse des Schweizerischen Energiekompetenzzentrums SCCER BIOSWEET; Eidg. Forschungsanstalt für Wald Schnee und Landschaft (WSL): Birmensdorf, Switzerland, 2017; p. 299. [Google Scholar]
  52. Federal Statistical Office (FSO). Entwicklung des Rundhzolzeinschittes in den Sägereien Nach Kantonen; FSO: Neuchâtel, Switzerland, 2018. [Google Scholar]
  53. Der Schweizerische Bundesrat, Verordnung über den Verkehr mit Abfällen (VeVA). 2005. (Fassung Juli 2016). Available online: https://docplayer.org/21490070-Verordnung-ueber-den-verkehr-mit-abfaellen.html (accessed on 18 November 2020).
  54. Stadelmann, G.; Herold, A.; Didion, M.; Vidondo, B.; Gomez, A.; Thürig, E. Holzerntepotenzial im Schweizer Wald: Simulation von Bewirtschaftungsszenarien. Schweiz. Z. Forstwes. 2016, 167, 152–161. [Google Scholar]
  55. Temperli, C.; Stadelmann, G.; Thürig, E.; Brang, P. Timber Mobilisation and Habitat Tree Retention in Low-Elevation mixed Forests in Switzerland: An Inventory-based Scenario Analysis of Opportunities and Constraints. Eur. J. For. Res. 2017, 136, 711–725. [Google Scholar]
  56. Ginzler, C.; Brändli, U.-B.; Hägeli, M. Waldflächenentwicklung der letzten 120 Jahre in der Schweiz. Schweiz. Z. Forstwes. 2011, 162, 337–343. [Google Scholar]
  57. Bircher, N.; Cailleret, M.; Huber, M.; Bugmann, H. Empfindlichkeit typischer Schweizer Waldbestände auf den Klimawandel. Schweiz. Z. Forstwes. 2015, 166, 408–419. [Google Scholar]
  58. Mina, M.; Bugmann, H.; Cordonnier, T.; Irauschek, F.; Klopčič, M.; Pardos, M.; Cailleret, M. Future ecosystem services from European mountain forests under climate change. J. Appl. Ecol. 2017, 54, 389–401. [Google Scholar]
  59. Rohner, B.; Kumar, S.; Liechti, K.; Gessler, A.; Ferretti, M. Tree Vitality Indicators Revealded a Reapid Response of Beech Forests to the 2018 Drought. Ecol. Indic. 2021, 120, 106903. [Google Scholar]
  60. Rohner, B.; Waldner, P.; Lischke, H.; Ferretti, M.; Thürig, E. Predicting individual-tree growth of central European tree species as a function of site, stand, management, nutrient, and climate effects. Eur. J. For. Res. 2018, 137, 29–44. [Google Scholar]
  61. Trotsiuk, V.; Hartig, F.; Cailleret, M.; Babst, F.; Forrester, D.I.; Baltensweiler, A.; Buchmann, N.; Bugmann, H.; Gessler, A.; Gharun, M.; et al. Assessing the response of forest productivity to climate extremes in Switzerland using model–data fusion. Glob. Chang. Biol. 2020, 26, 2463–2476. [Google Scholar]
  62. Nabuurs, G.-J.; Pussinen, A.; Karjalainen, T.; Erhard, M.; Kramer, K. Stemwood volume increment changes in European forests due to climate change—A simulation study with the EFISCEN model. Glob. Chang. Biol. 2002, 8, 304–316. [Google Scholar]
  63. Abegg, M.; Brändli, U.-B.; Cioldi, F.; Fischer, C.; Herold-Bonardi, A.; Huber, M.; Keller, M.; Meile, R.; Rösler, E.; Speich, S.; et al. Schweizerisches Landesforstinventar—Ergebnistabelle Nr. 173534: Jährlicher Nettozuwachs; Eidg. Forschungsanstalt WSL: Birmensdorf, Switzerland, 2014. [Google Scholar]
  64. Losey, S.; Wehrli, A. Schutzwald in der Schweiz. Vom Projekt SilvaProtect-CH zum harmonisierten Schutzwald; Bundesamt für Umwelt (BAFU): Bern, Switzerland, 2013; p. 29. [Google Scholar]
  65. Federal Office for the Environment (FOEN). Waldpolitik 2020, Visionen, Ziele, Massnahmen für Eine Nachhaltige Bewirtschaftung des Schweizer Waldes; FOEN: Bern, Switzerland, 2013; p. 66. [Google Scholar]
  66. Federal Statistical Office (FSO). Areal Statistics Switzerland, Standard Nomenclature, Data Set, Hectare Level; FSO: Neuchâtel, Switzerland, 2009. [Google Scholar]
  67. Federal Office for the Environment (FOEN); Swiss Federal Office of Energy (SFOE). Energieholzpotenziale Ausserhalb des Waldes; Federal Office for the Environment (FOEN)/Swiss Federal Office of Energy (SFOE): Bern, Switzerland, 2009; p. 82. [Google Scholar]
  68. Federal Statistical Office (FSO). Digital Elevation Model (100 m); GEOSTAT: Neuchâtel, Switzerland, 1979. [Google Scholar]
  69. Swisstopo Federal Office of Topography. Digital Land Model of Switzerland, Vector 25; Swisstopo Federal Office of Topography: Bern, Switzerland, 2007. [Google Scholar]
  70. Federal Office for the Environment (FOEN). Jahrbuch Wald und Holz; Federal Office for the Environment (FOEN): Bern, Switzerland, 2014; p. 162. [Google Scholar]
  71. Erni, M.; Thees, O.; Lemm, R. Altholzpotenziale der Schweiz für die Energetische Nutzung, Ergebnisse einer Vollerhebung; WSL Ber. 52; Eidg. Forschungsanstalt WSL: Birmensdorf, Switzerland, 2017; p. 68. [Google Scholar]
  72. Mantau, U.; Weimar, H.; Kloock, T. Standorte der Holzwirtschaft, Holzrohstoffmonitoring, Altholz im Entsorgungsmarkt, Aufkommens- und Vertriebsstruktur 2010; Universität Hamburg: Hamburg, Germany, 2012; p. 30. [Google Scholar]
  73. Federal Office for the Environment (FOEN). Jahrbuch Wald und Holz; Federal Office for the Environment (FOEN): Bern, Switzerland, 2018. [Google Scholar]
  74. Kohli, R.; Bläuer, A.; Perrenoud, S.; Babel, J. Szenarien zur Bevölkerungsentwicklung der Schweiz 2015–2045; Bundesamt für Statistik (BFS): Neuchãtel, Switzerland, 2015; p. 82. [Google Scholar]
  75. Taverna, R.; Meister, R.; Hächler, K. Abschätzung des Altholzaufkommens und des CO2-Effektes aus Seiner Energetischen Verwertung, Schlussbericht, Bundesamt für Umwelt (BAFU); Departement für Umwelt, Verkehr, Energie und Kommunikation (UVEK): Bern, Switzerland, 2010; p. 63. [Google Scholar]
  76. Lehner, L.; Kinnunen, U.; Weidner, J.; Lehner, J.; Pauli, B.; Menk, J. Branchenanalyse, Analyse und Synthese der Wertschöpfungskette (WSK) Wald und Holz in der Schweiz, Bern, Bundesamt für Umwelt (BAFU); Eidg. Departements für Umwelt, Verkehr, Energie und Kommunikation (UVEK): Bern, Switzerland, 2014; p. 345. [Google Scholar]
  77. Hahn, J.; Schardt, M.; Schulmeyer, F.; Mergler, F. Der Energieinhalt von Holz; Bayerische Landesanstalt für Wald und Forstwirtschaft (LWF): Freising, Germany, 2014; p. 4. [Google Scholar]
  78. Swiss Federal Office of Energy (SFOE). Masse, Einheiten, Zahlen: Umrechnungsfaktoren, Masseinheiten und Energieinhalte; SFOE: Bern, Switzerland, 2006; p. 1. [Google Scholar]
  79. Federal Statistical Office (FSO). Restholzverwertung in den Sägereien nach Kantonen 2012, Tab 7.3.5.3; FSO: Neuchâtel, Switzerland, 2013. [Google Scholar]
  80. Federal Office of Energy (SFOE). Überblick über den Energieverbrauch der Schweiz im Jahr 2019, Auszug aus der Schweizerischen Gesamtenergiestatistik 2019; SFOE: Bern, Switzerland, 2020; p. 9. [Google Scholar]
  81. MeteoSchweiz. Der Wintersturm Burglind/Eleanor in der Schweiz, Fachbericht; MeteoSchweiz: Zurich, Switzerland, 2018; p. 35. [Google Scholar]
  82. Marcucci, A.; Zhang, L. Growth impacts of Swiss steering-based climate policies. Swiss J. Econ. Stat. 2019, 155, 1–13. [Google Scholar]
  83. Yousefpour, R.; Temperli, C.; Jacobsen, J.B.; Thorsen, B.J.; Meilby, H.; Lexer, M.J.; Lindner, M.; Bugmann, H.; Borges, J.G.; Palma, J.H.; et al. A framework for modeling adaptive forest management and decision making under climate change. Ecol. Soc. 2017, 22, 40. [Google Scholar]
  84. Stroheker, S.; Forster, B.; Queloz, V. Zweithöchster je Registrierter Buchdruckerbefall (Ips Typographus) in der Schweiz; Waldschutz Aktuell; Eidg. Forschungsanstalt WSL: Birmensdorf, Switzerland, 2020; p. 2. [Google Scholar]
  85. Federal Office of the Environment (FOEN). 2018 Market Statement for Switzerland, Developments in Forest Product Markets; FOEN: Bern, Switzerland, 2018; p. 31. [Google Scholar]
  86. Ede, A.N.; Adebayo, S.O.; Ugwu, E.I.; Emenike, C. Life Cycle Assessment of Environmental Impacts of using Concrete or Timber to Construct a Duplex Residential Building. IOSR J. Mech. Civ. Eng. 2014, 11, 62–72. [Google Scholar]
  87. Abasian, F.; Rönnqvist, M.; Ouhimmou, M. Forest bioenergy network design under market uncertainty. Energy 2019, 188, 116038. [Google Scholar]
  88. Mair-Bauernfeind, C.; Stern, T. Cascading Utilization of Wood: A Matter of Circular Economy? Curr. For. Rep. 2017, 3, 281–295. [Google Scholar]
  89. Jarre, M.; Petit-Boix, A.; Priefer, C.; Meyer, R.; Leipold, S. Transforming the Bio-based Sector Towards a Circular Economy—What can we learn from Wood Cascading? For. Policy Econ. 2020, 110, 1–12. [Google Scholar]
  90. Shahab, R.L.; Brethauer, S.; Davey, M.P.; Smith, A.G.; Vignolini, S.; Luterbacher, J.S.; Studer, M. A heterogeneous microbial consortium producing short-chain fatty acids from lignocellulose. Science 2020, 369, 9. [Google Scholar]
  91. Holzindustrie Schweiz (HIS). Annual Report of the European Sawmill Industry 2018/2019, EOS ANNUAL REPORT, Brumunddal, Norway; HIS: Bern, Switzerland, 2019; p. 226. [Google Scholar]
  92. Suter, F.; Steubing, B.; Hellweg, S. Life Cycle Impacts and Benefits of Wood along the Value Chain: The Case of Switzerland. J. Ind. Ecol. 2016, 21, 874–886. [Google Scholar]
  93. Röder, M.; Thornley, P. Waste wood as bioenergy feedstock. Climate change impacts and related emission uncertainties from waste wood based energy systems in the UK. Waste Manag. 2018, 74, 241–252. [Google Scholar]
  94. Der Schweizerische Bundesrat. Luftreinhalte-Verordnung (LRV); Der Schweizerische Bundesrat: Bern, Switzerland, 2016; p. 98. [Google Scholar]
  95. Der Shweizerische Bundesrat. Verordnung über die Vermeidung und die Entsorgung von Abfällen; Der Shweizerische Bundesrat: Bern, Switzerland, 2015; p. 46. [Google Scholar]
  96. Suominen, T.; Kunttu, J.; Jasinevičius, G.; Tuomasjukka, D.; Lindner, M. Trade-offs in sustainability impacts of introducing cascade use of wood. Scand. J. For. Res. 2017, 32, 588–597. [Google Scholar]
  97. Röder, M.; Thornley, P. Bioenergy as climate change mitigation option within a 2 °C target—Uncertainties and temporal challenges of bioenergy systems. Energy Sustain. Soc. 2016, 6, 1–7. [Google Scholar]
  98. Husgafvel, R.; Linkosalmi, L.; Hughes, M.; Kanerva, J.; Dahl, O. Forest sector circular economy development in Finland: A regional study on sustainability driven competitive advantage and an assessment of the potential for cascading recovered solid wood. J. Clean. Prod. 2018, 181, 483–497. [Google Scholar]
  99. Näyhä, A. Transition in the Finnish forest-based sector: Company perspectives on the bioeconomy, circular economy and sustainability. J. Clean. Prod. 2019, 209, 1294–1306. [Google Scholar]
  100. Boisvenue, C.; Running, S.W. Impacts of climate change on natural forest productivity—Evidence since the middle of the 20th century. Glob. Chang. Biol. 2006, 12, 862–882. [Google Scholar]
  101. Aertsen, W.; Janssen, E.; Kint, V.; Bontemps, J.-D.; Van Orshoven, J.; Muys, B. Long-term growth changes of common beech (Fagus sylvatica L.) are less pronounced on highly productive sites. For. Ecol. Manag. 2014, 312, 252–259. [Google Scholar]
  102. Pretzsch, H.; Biber, P.; Schütze, G.; Uhl, E.; Rötzer, T. Forest stand growth dynamics in Central Europe have accelerated since 1870. Nat. Commun. 2014, 5, 4967. [Google Scholar] [PubMed] [Green Version]
  103. Etzold, S.; Ferretti, M.; Reinds, G.J.; Solberg, S.; Gessler, A.; Waldner, P.; Schaub, M.; Simpson, D.; Benham, S.; Hansen, K.; et al. Nitrogen Deposition is the most Important Environmental Driver Associated to Continental-scale Growth of Pure, Even-aged, Managed European Forests. For. Ecol. Manag. 2020, 458, 117762. [Google Scholar]
  104. Vittoz, P.; Cherix, D.; Gonseth, Y.; Lubini, V.; Maggini, R.; Zbinden, N.; Zumbach, S. Climate change impacts on biodiversity in Switzerland: A review. J. Nat. Conserv. 2013, 21, 154–162. [Google Scholar]
  105. Herzog, F.; Seidl, I. Swiss alpine summer farming: Current status and future development under climate change. Rangel. J. 2018, 40, 501. [Google Scholar]
  106. Rigling, A.; Etzold, S.; Bebi, P.; Brang, P.; Ferretti, M.; Forrester, D.; Gartner, H.; Gessler, A.; Ginzler, C.; Moser, B.; et al. How much Drought can our Forests Endure? Lessons from Extreme Drought Years. In Proceedings of the Forum fur Wissen 2019—Lernen aus Extremereignissen, Davos, Switzerland, 24 April 2019; pp. 39–51. [Google Scholar]
  107. Lindner, M.; Maroschek, M.; Netherer, S.; Kremer, A.; Barbati, A.; Garcia-Gonzalo, J.; Seidl, R.; Delzon, S.; Corona, P.; Kolström, M.; et al. Climate Change Impacts, Adaptive Capacity, and Vulnerability of European Forest Ecosystems. For. Ecol. Manag. 2010, 259, 698–709. [Google Scholar]
  108. Seidl, R.; Rammer, W.; Lexer, M.J. Climate change vulnerability of sustainable forest management in the Eastern Alps. Clim. Chang. 2011, 106, 225–254. [Google Scholar]
  109. Die Bundesversamulung der Schweizerischen Eidgenossenschaft. Bundesgesetz über den Wald (Stand am 1. Januar 2017). 1991. Available online: https://scnat.ch/de/uuid/i/a15ef764-3704-53fd-b1df-99391ccd63b5-Der_Wintersturm_Burglind%2FEleanor_in_der_Schweiz (accessed on 18 November 2020).
  110. Die Bundesversamulung der Schweizerischen Eidgenossenschaft. Bundesgesetz über die Raumplanung (Raumplanungsgesetz, RPG); Die Bundesversamulung der Schweizerischen Eidgenossenschaft: Bern, Switzerland, 2018; p. 26. [Google Scholar]
Figure 1. Procedure for the estimation of theoretical and sustainable wood fuel potentials (TPs and SPs) today (2020) and in the future (2035 and 2050).
Sustainability 12 09749 g001
Figure 2. Definition of the different potentials and scenarios.
Sustainability 12 09749 g002
Figure 3. Wood fluxes in Switzerland ([70] modified, 2010-2014, five year average). Shown are the shares of the wood residues for recycling and energy in relation to the forest wood harvesting potential. The quantities of wood residues used to generate energy are framed in red. Bark (framed in green) was not part of the wood residues estimation, as its original source is in the forests (Section 2.2.1). It corresponds to approximately 8% of the forest wood utilization potential.
Sustainability 12 09749 g003
Figure 4. Development of the theoretical and sustainable potential (minimum and maximum) of wood fuel from forests for energy use in Switzerland from 2020 to 2050.
Sustainability 12 09749 g004
Figure 5. Development of the theoretical and sustainable potential of wood fuel from trees outside forests in Switzerland from 2020 to 2050.
Sustainability 12 09749 g005
Figure 6. Development of the theoretical and sustainable potential of wood fuel from wood residues for energy use in Switzerland from 2020 to 2050.
Sustainability 12 09749 g006
Figure 7. Development of the theoretical and sustainable potential of wood fuel from waste wood for energy use in Switzerland from 2020 to 2050.
Sustainability 12 09749 g007
Figure 8. Development of the theoretical and sustainable potentials of all woody biomass types for wood fuel in Switzerland from 2020 to 2050. * Wood residues and waste wood have their origins in forest wood and wood from trees outside forests. Therefore, the TP of all domestic woody biomass consists only of the TPs of forest wood and wood from other landscapes. For detailed results, cf. Supplementary Information S5, Table S12.
Sustainability 12 09749 g008
Figure 9. Development of the sustainable potentials (SPs) of wood fuel for all woody biomass types in Switzerland from 2020 to 2050. For detailed results, cf. Supplementary Information S5, Table S14.
Sustainability 12 09749 g009
Table 1. Standard error of the increment derived from MASSIMO for the different time perspectives for Switzerland.
Time/Management StrategyCSIMSRLSR
20202.6%3.0%3.4%
20359.2%3.4%3.4%
205011.7%5.3%2.9%
CSI = continuous growing stock increase, MSR = moderate stock reduction, and LSR = large stock reduction.
Table 2. Range of harvest losses (minimum and maximum).
Harvest LossesConifersBroadleaves
MerchantableBrushwoodMerchantableBrushwood
Minimum wood fuel SPs9%61%16%55%
Maximum wood fuel SPs7%55%10%45%
Table 3. Technical limitations due to slopes.
Categories of Wood from LandscapesModellingNotes
Built-up areasAll the areas are considered for the calculation of SPsMaintenance and management due to safety aspects
Transportation areas
Agricultural areas, tree and brush vegetationOnly areas with a slope <70% were consideredSafety aspects not relevant
Groves, hedges
Embankments (of rivers and lakes)
Table 4. Minimum, expected and maximum restrictions for the calculation of sustainable forest wood potentials.
RestrictionSpecificationMinimumExpectedMaximum
Mortality [%] -/15/-
Reserve areas [%]SP2020~10.04.84.8
2035 and 2050~10.0~10.0~10.0
SP2035/2050~10.0~10.0~10.0
Harvest losses [%]Conifers brushwood (incl. bark)615855
Conifers merchantable987
Broadleaves brushwood (incl. bark)555045
Broadleaves merchantable161310
Costs [CHF/m3]Wood production forests110.0120.0130.0
Protection forests180.0190.0200.0
Table 5. Overview of sustainable potentials (SPs) of woody biomass and the different forest management strategies for the three time points (2020, 2035, and 2050). Shown are the minimum and maximum values in [PJ] primary energy. For more details (e.g., different potentials, scenarios and shares), see Supplementary Information S5, Table S12 (TPs); Supplementary Information S5, Table S13 (SPs); and Supplementary Information S6, Table S14 (shares of woody biomass types, TPs and SPs).
Forest Management2020 [PJ]2035 [PJ]2050 [PJ]
CSI *134.1–59.533.6–64.829.8–60.3
MSR *140.1–64.542.7–71.830.4–59.4
LSR *145.9–75.143.5–77.826.5–52.9
*1 CSI: continuous stock increase (business as usual); MSR: moderate stock reduction; LSR: large stock reduction.
Publisher’s Note: MDPI stays neutral with regard to jurisdictional claims in published maps and institutional affiliations.

