1. Introduction
After setting the Paris Agreement, the term “climate policy” undeniably has a new dimension [
1,
2]. The agreement gives an innovative approach to climate protection issues with ambitious goals and creates the obligations assumed by individual states [
3,
4]. It is a comprehensive strategy that combines environmental issues with all sectors of the economy, main players in every country [
5,
6]; this is the problem faced in the modern world [
7,
8]. Therefore, integrated cooperation in energy, transport, construction, public administration, and environmental policy in a given country is required for global warming mitigation [
9,
10]. Closer cooperation between the various parties at the international level is necessary [
11]. The European Commission recommends exchanging scientific knowledge on adaptation to climate change and information on behavior and strategy [
12,
13]. Combating climate change should remain on the top of the political lists of priorities of relevant international forums [
14,
15]. Another crucial thing is that after signing Paris Agreement, the parties must have the reference point to calculate their emissions, and in most cases, it is 1990.
The Visegrad Group (V4) is one example of strengthening international cooperation in Central Europe recommended by the European Commission to implement the Paris Agreement [
16,
17]. The V4 community is a regional form of cooperation between Poland, the Czech Republic, Slovakia, and Hungary [
18,
19]. Besides a close neighbourhood and geopolitical features, the members of the V4 share a common history, culture, traditions and religious and intellectual values that they wish to preserve and strengthen [
20,
21]. While being an important part of regional cooperation, the group constitutes an element that strengthens the international position and is conducive to the social and economic growth of the four states.
The energy crisis of 2009 showed the gas dependence of the Visegrad Group member states [
22]. Their domestic production is significantly less than what is needed to satisfy sufficient supplies to consumers, and imports of gas and other forms of energy depend primarily on Russia. While Poland’s foreign policy sought to ensure that Poland avoided any cooperation with Russia, Hungary took steps to strengthen ties through economic cooperation. At the meeting of prime ministers in Bratislava in May 2014, the Polish prime minister expressed his negative stance towards the Hungarian partner, claiming that V4 cooperation is more than a symbolic representation of the common past and future and the threat from Russia cannot be ignored [
23,
24].
The European Union was a leader in the UNFCCC (United Nations Framework Convention on Climate Change) negotiations performed from 1997 to 2005. The details regarding the implementation of the Kyoto Protocol have been agreed upon by the countries. Individual greenhouse gases (GHG) emission reduction targets for developed countries were negotiated, and their entry into force was realized [
25,
26]. The EU plays an important role in securing a successful outcome of this process: it played a protagonist role when the United States decided not to ratify the protocol [
27].
From the perspective of 2021, the existence of the Visegrad Group turned out to be a mechanism for consulting the positions of the countries in the region before the proceedings of the relevant bodies of the European Union. Within the Visegrad Group, Poland maintains the status quo, simultaneously striving for the development of the Three Seas Initiative and the Bucharest format. The most important issues of the recent period in Poland’s EU policy were as follows: the adoption of the EU’s multiannual financial framework by the member states as well as the issue of how to introduce carbon neutrality and, above all, the issue of cost sharing of this process between all participants. The importance of these issues in Poland is underlined by the decisions to establish a separate ministry for climate affairs and the separation of European issues from the Ministry of Foreign Affairs. The other V4 countries are natural partners for Poland in the above-mentioned issues. Moreover, there must be consent throughout the EU in both of these issues [
28,
29].
This manuscript is an attempt to analyse the implementation of obligations under the Paris Agreement by the member states of the Visegrad Group, with particular emphasis on the issue of Poland.
This study aimed to (1) analyze the possibility of fulfilling the Paris Agreement by the Visegrad Group countries (V4); (2) to examine strategies of using by each country of key energy resources; (3) to scrutinize sectors with the largest emission of carbon dioxide in V4 Group, and (4) to show recommendation for European Union and each country of V4 to be on a pathway below 2 °C temperature increase.
The study was based on official reports on CO2 emissions and obligations resulting from the signed agreements on its reduction.
The multi-threaded research was carried out by analysing not only changes in the structure of emission sources and energy efficiency issues over the years, but also current and future activities aimed at the fulfillment of international agreements in individual V4 countries.
2. Review of Energy Policies of Member Countries of the Visegrad Group
Fossil fuels dominate the Polish energy sector [
30]. The country also has the least diversified energy mix in the EU [
31,
32]. The role of coal in the Polish economy was defended by all governments after 1989. In Poland, the total global energy consumption in 2019 amounted to 4405.8 PJ [
33]. This figure slightly differs from the European average. Gross domestic energy consumption per capita in Poland in 2018 amounted to 117.7 GJ (in 2017: 115.9 GJ), with the EU average amounting to 136.0 GJ. An increase in global consumption in 2019 compared to the previous year was observed in the case of crude oil, natural gas, renewable energy and other carriers, and a decrease—in the case of hard coal and lignite. The share of hard coal was 37.0% (in 2018: 40%, in 2017: 40%), lignite 9.1% (in 2018: 10.5%, in 2017: 11%), crude oil 26.3% (in 2018: 25.6% in 2017: 24.6%), natural gas 16.1% (in 2018: 15%, in 2017: 14.8%), renewable energy carriers 9.3% (in 2018: 8.2%, in 2017: 8.1%), and the remaining 2.2% (in 2018: 0.7%, in 2017: 1.5%).
The most important acquired energy carrier in 2019 was hard coal, with a share of 56.2% (57.9% in 2018, 57.9% in 2017). In 2019, over 61.6 million tons of hard coal were mined in Poland (1.8 million tons less than in the previous year). The second largest carrier was lignite with a share of 15.2% (18.1% in 2018, 18.7% in 2017). More than 71% of coal is used to produce heat and electricity [
34]. However, Poland depends on the import of this energy carrier, as its domestic production of coal is small [
35]. The share of hard coal and lignite in total consumption decreased by 12.8% in 2017 compared to 2000 [
36]. The next largest source of energy from TPES (total primary energy supply) is natural gas [
37]. In 2019, the share of natural gas in extraction was 5.5% (5.5% in 2018, 5.3% in 2017). One third of natural gas is produced domestically and the remainder is imported. The next largest source of energy is crude oil, with a share of 1.5% (1.6% in 2018, 1.5% in 2017). The remaining renewable energy sources account for 18.3% (16.9% in 2018, 16.6% in 2017). Primary energy obtained in Poland in 2017 amounted to 2723.7 PJ, in 2018 it was 2607.4 PJ, and in 2019 it reached the value of 2528.5 PJ. Poland does not use nuclear energy; however, a scenario for this source of energy in the energy outlook is taken into account [
38]. Nuclear energy is a regular theme in public statements. However, this is a challenge due to time-consuming construction, high expenditure and controversy over countries that would provide the required technology. Primary energy consumption in 2019 was 1188 TWh (in 2018, 1170.5 TWh).
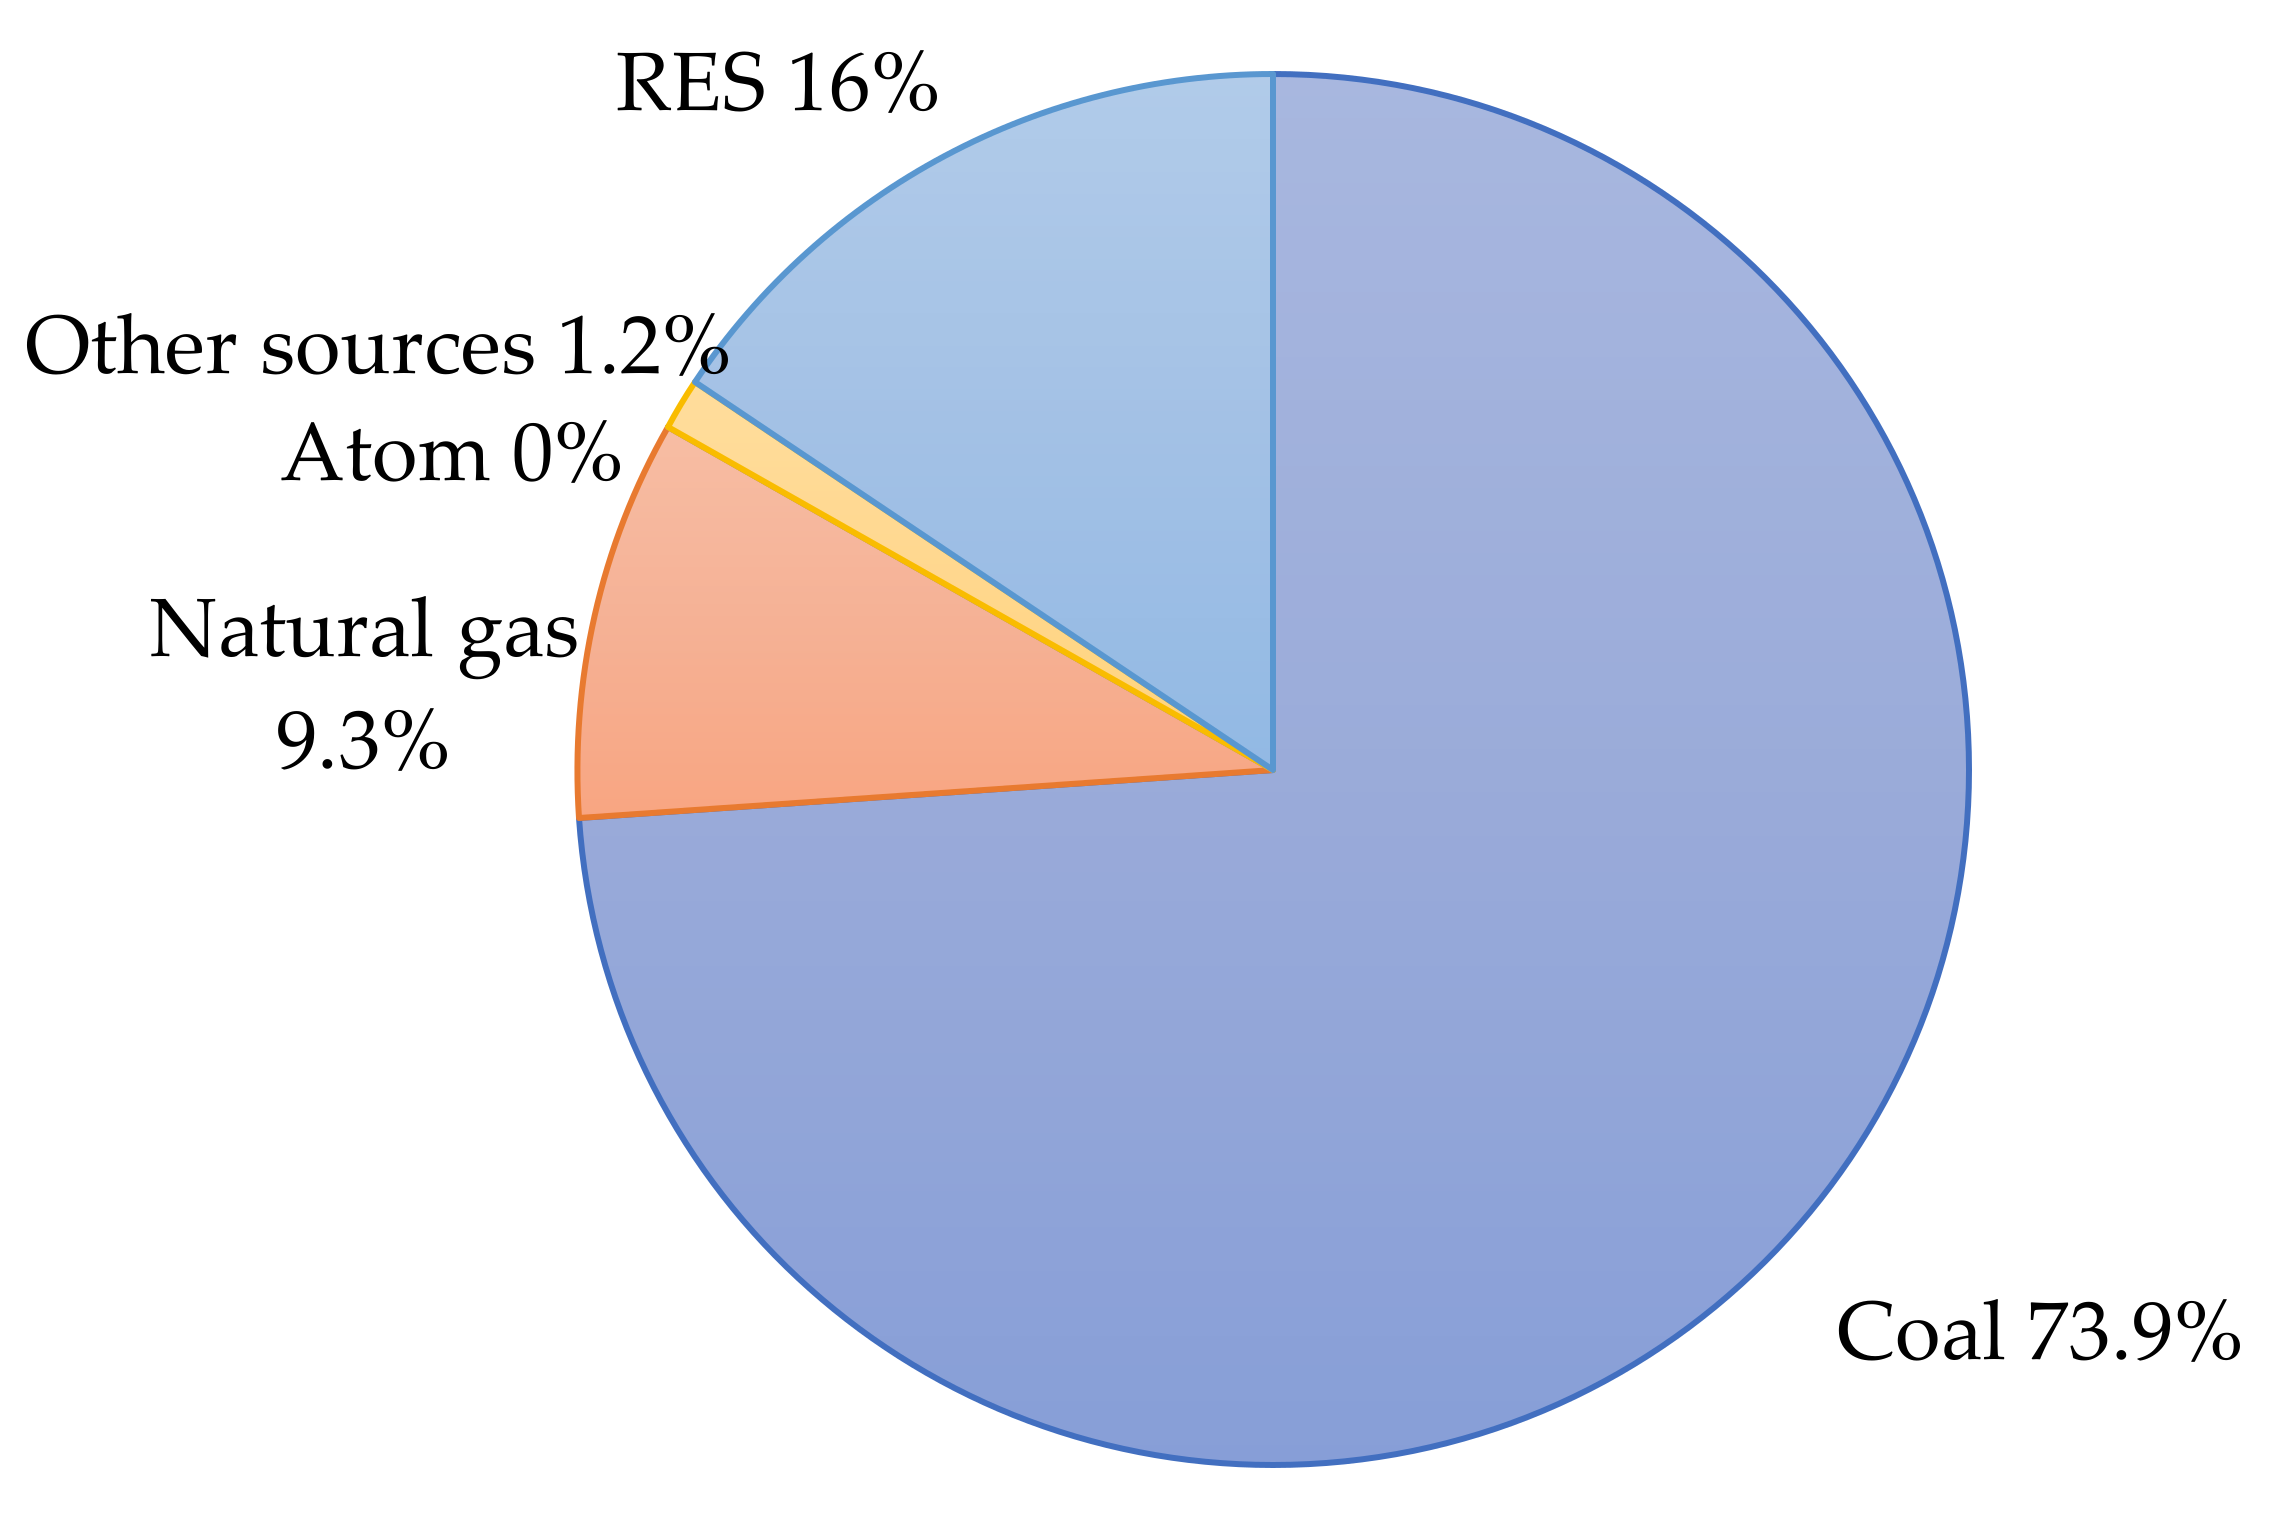
The sector of the economy which had the highest share in direct energy consumption was industry (34.6%), while this share was characterized by slight fluctuations in recent years. The second largest sector in terms of consumption was the transport sector, also including private passenger cars—the share of this sector systematically increased and amounted to 28.1% in 2019. In 2019, households used 21.7% of energy, agriculture 4.5%, construction 1.7%, and other recipients—9.4%. The share of coal in electricity production in 2019 was 73.9% (
Figure 1). The import of electricity to Poland almost doubled. In 2019, it amounted to 10.6 TWh. Electricity production in Poland was 164 TWh in 2019 (158.5 TWh in 2020).
In the Czech Republic, like in Poland, the dominant source of primary energy in 2018 was coal, which accounted for approx. 36.2% of the total primary energy supply (22.4 Mt in total, of which approx. 5.7 Mt is hard coal, and 16.4 Mtce is brown coal) [
39]. The next primary energy carriers were fossil gas (15.8%, 9.7 Mtce) and crude oil (21.6%, 13.3 Mtce). The primary energy mix also includes nuclear energy with a share of 18.1% in 2018 (11.2 Mtce) as well as biofuels and waste which together accounted for 10.2% (6.3 Mtce). The remaining 0.9% of solar, hydro and wind energy provided the remaining 0.6 Mtce. Despite significant dependence on coal energy, the Czech Republic plans to quickly depart from such an energy model [
40]. Gradual replacement of fossil fuels (mainly coal) with nuclear energy is being observed, which will favourably affect the GHG emissions. It is assumed in Government projections that the share of nuclear energy will rise from 25% to 33% of TPES by 2040. The Czech Republic is making efforts in the EU forum to qualify nuclear energy as a green energy source. Such a change in qualification would make it possible to obtain funds for the expansion of nuclear energy.
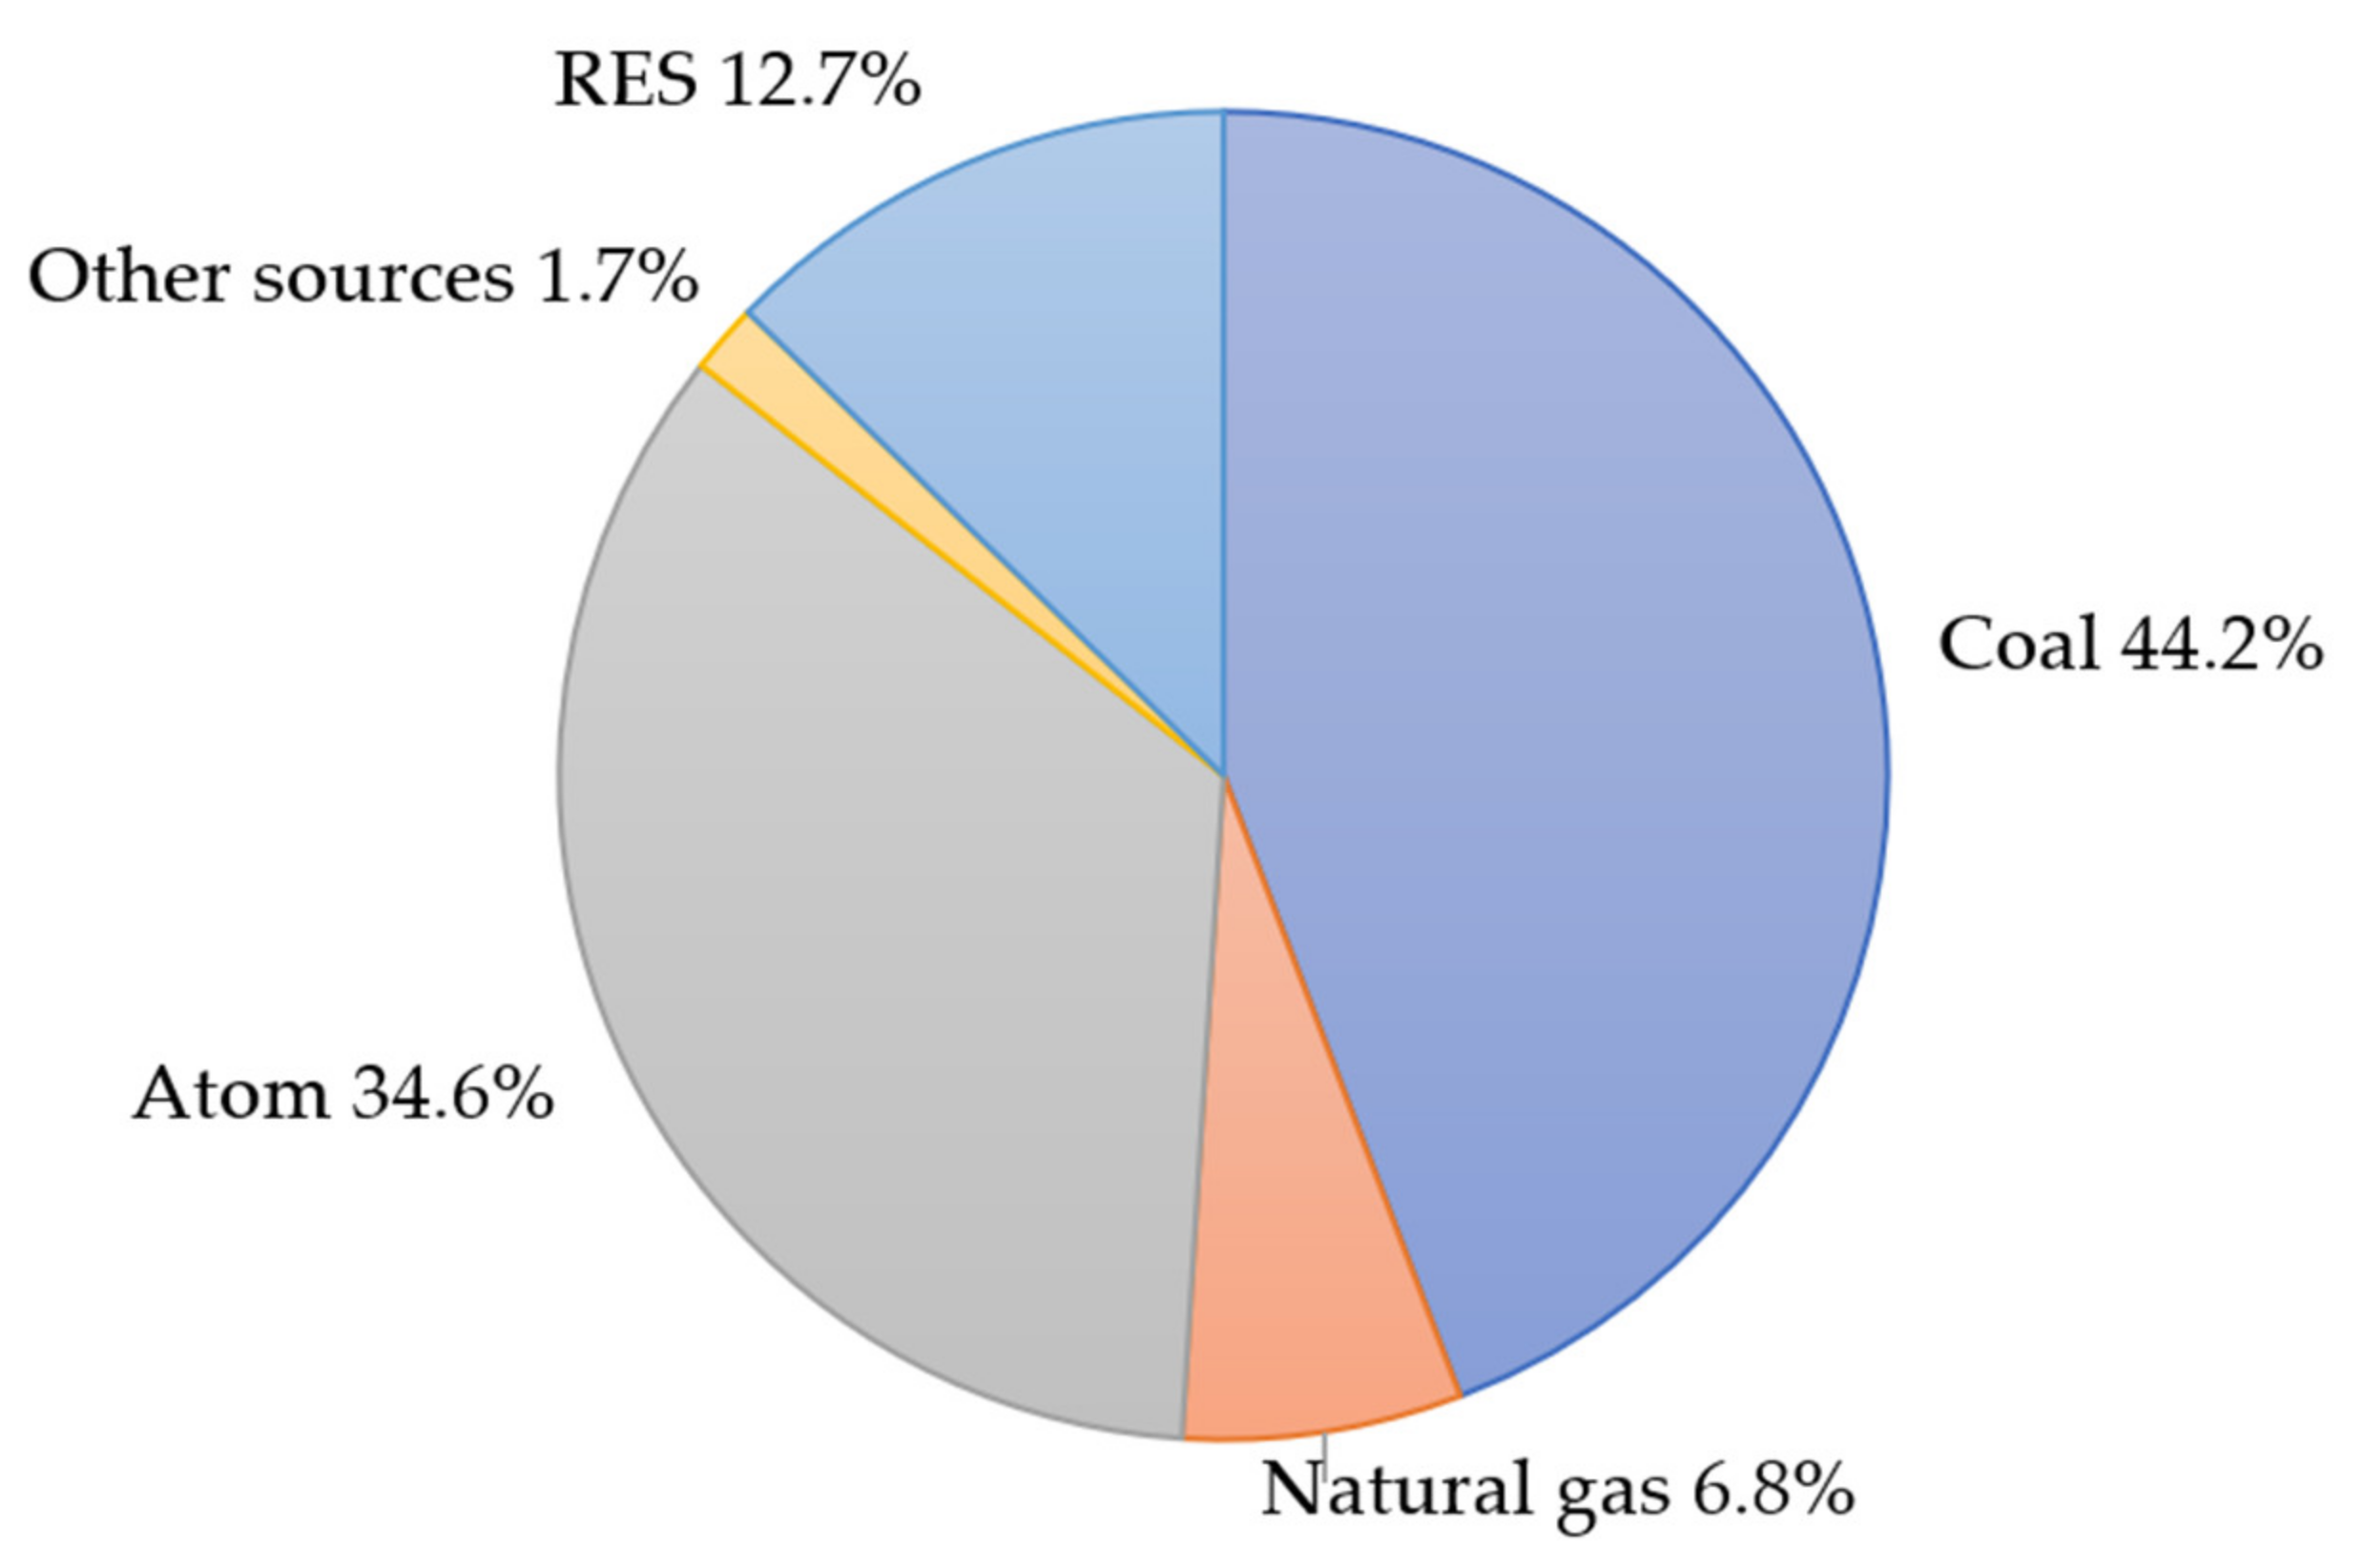
In 2019, electricity was mainly generated from coal—44.2% (51% in 2017) and nuclear energy 34.6% (33% in 2017) (
Figure 2) [
41,
42]. In 2018, the share of coal (lignite and hard coal) decreased to 49%, and nuclear fuel increased to 34% [
43]. Additionally, energy production from fossil natural gas accounted for a 6.8% share in 2019 (4.3% in 2018), while 12.7% came from renewable energy sources (11.8% in 2018). In 2018, the Czech Republic generated almost 88 TWh of energy. The Czech Republic was the fourth largest net exporter of electricity in the EU in 2018, after France, Germany and Sweden. Most of its electricity is exported to Austria, Slovakia and Germany [
44].
In 2019, households (29%), transport (28%) and industry (excluding construction; 27%) had the largest share in final energy consumption. The service sector accounts for 13% of final energy consumption.
The Hungarian energy system differs significantly from the Polish and Czech systems [
45,
46]. The largest energy carriers are natural gas and crude oil—31.3% and 28.3% of TPES, respectively. Nuclear power is the third largest source (15.6% TPES), and serves for electricity production. In 2018, the total primary energy supply was at the level of 25.2 Mtoe [
47]. Coal is not so popular in the Hungarian energy system; it constitutes only 8.5% of the primary energy supply [
48]. The most energy-intensive Hungarian sectors are industry and housing, which account for over 60% of total energy consumption—31.6% and 31.5%, respectively. In terms of energy consumption, the third sector is transportation, accounting for 22.3% of TFC. The services sector, including agriculture, accounts for 14.7% of TFC [
49,
50,
51]. Hungarian energy supplies are dominated by imports from Russia. The country imports about 90% of its crude oil and natural gas, mostly from Russia.
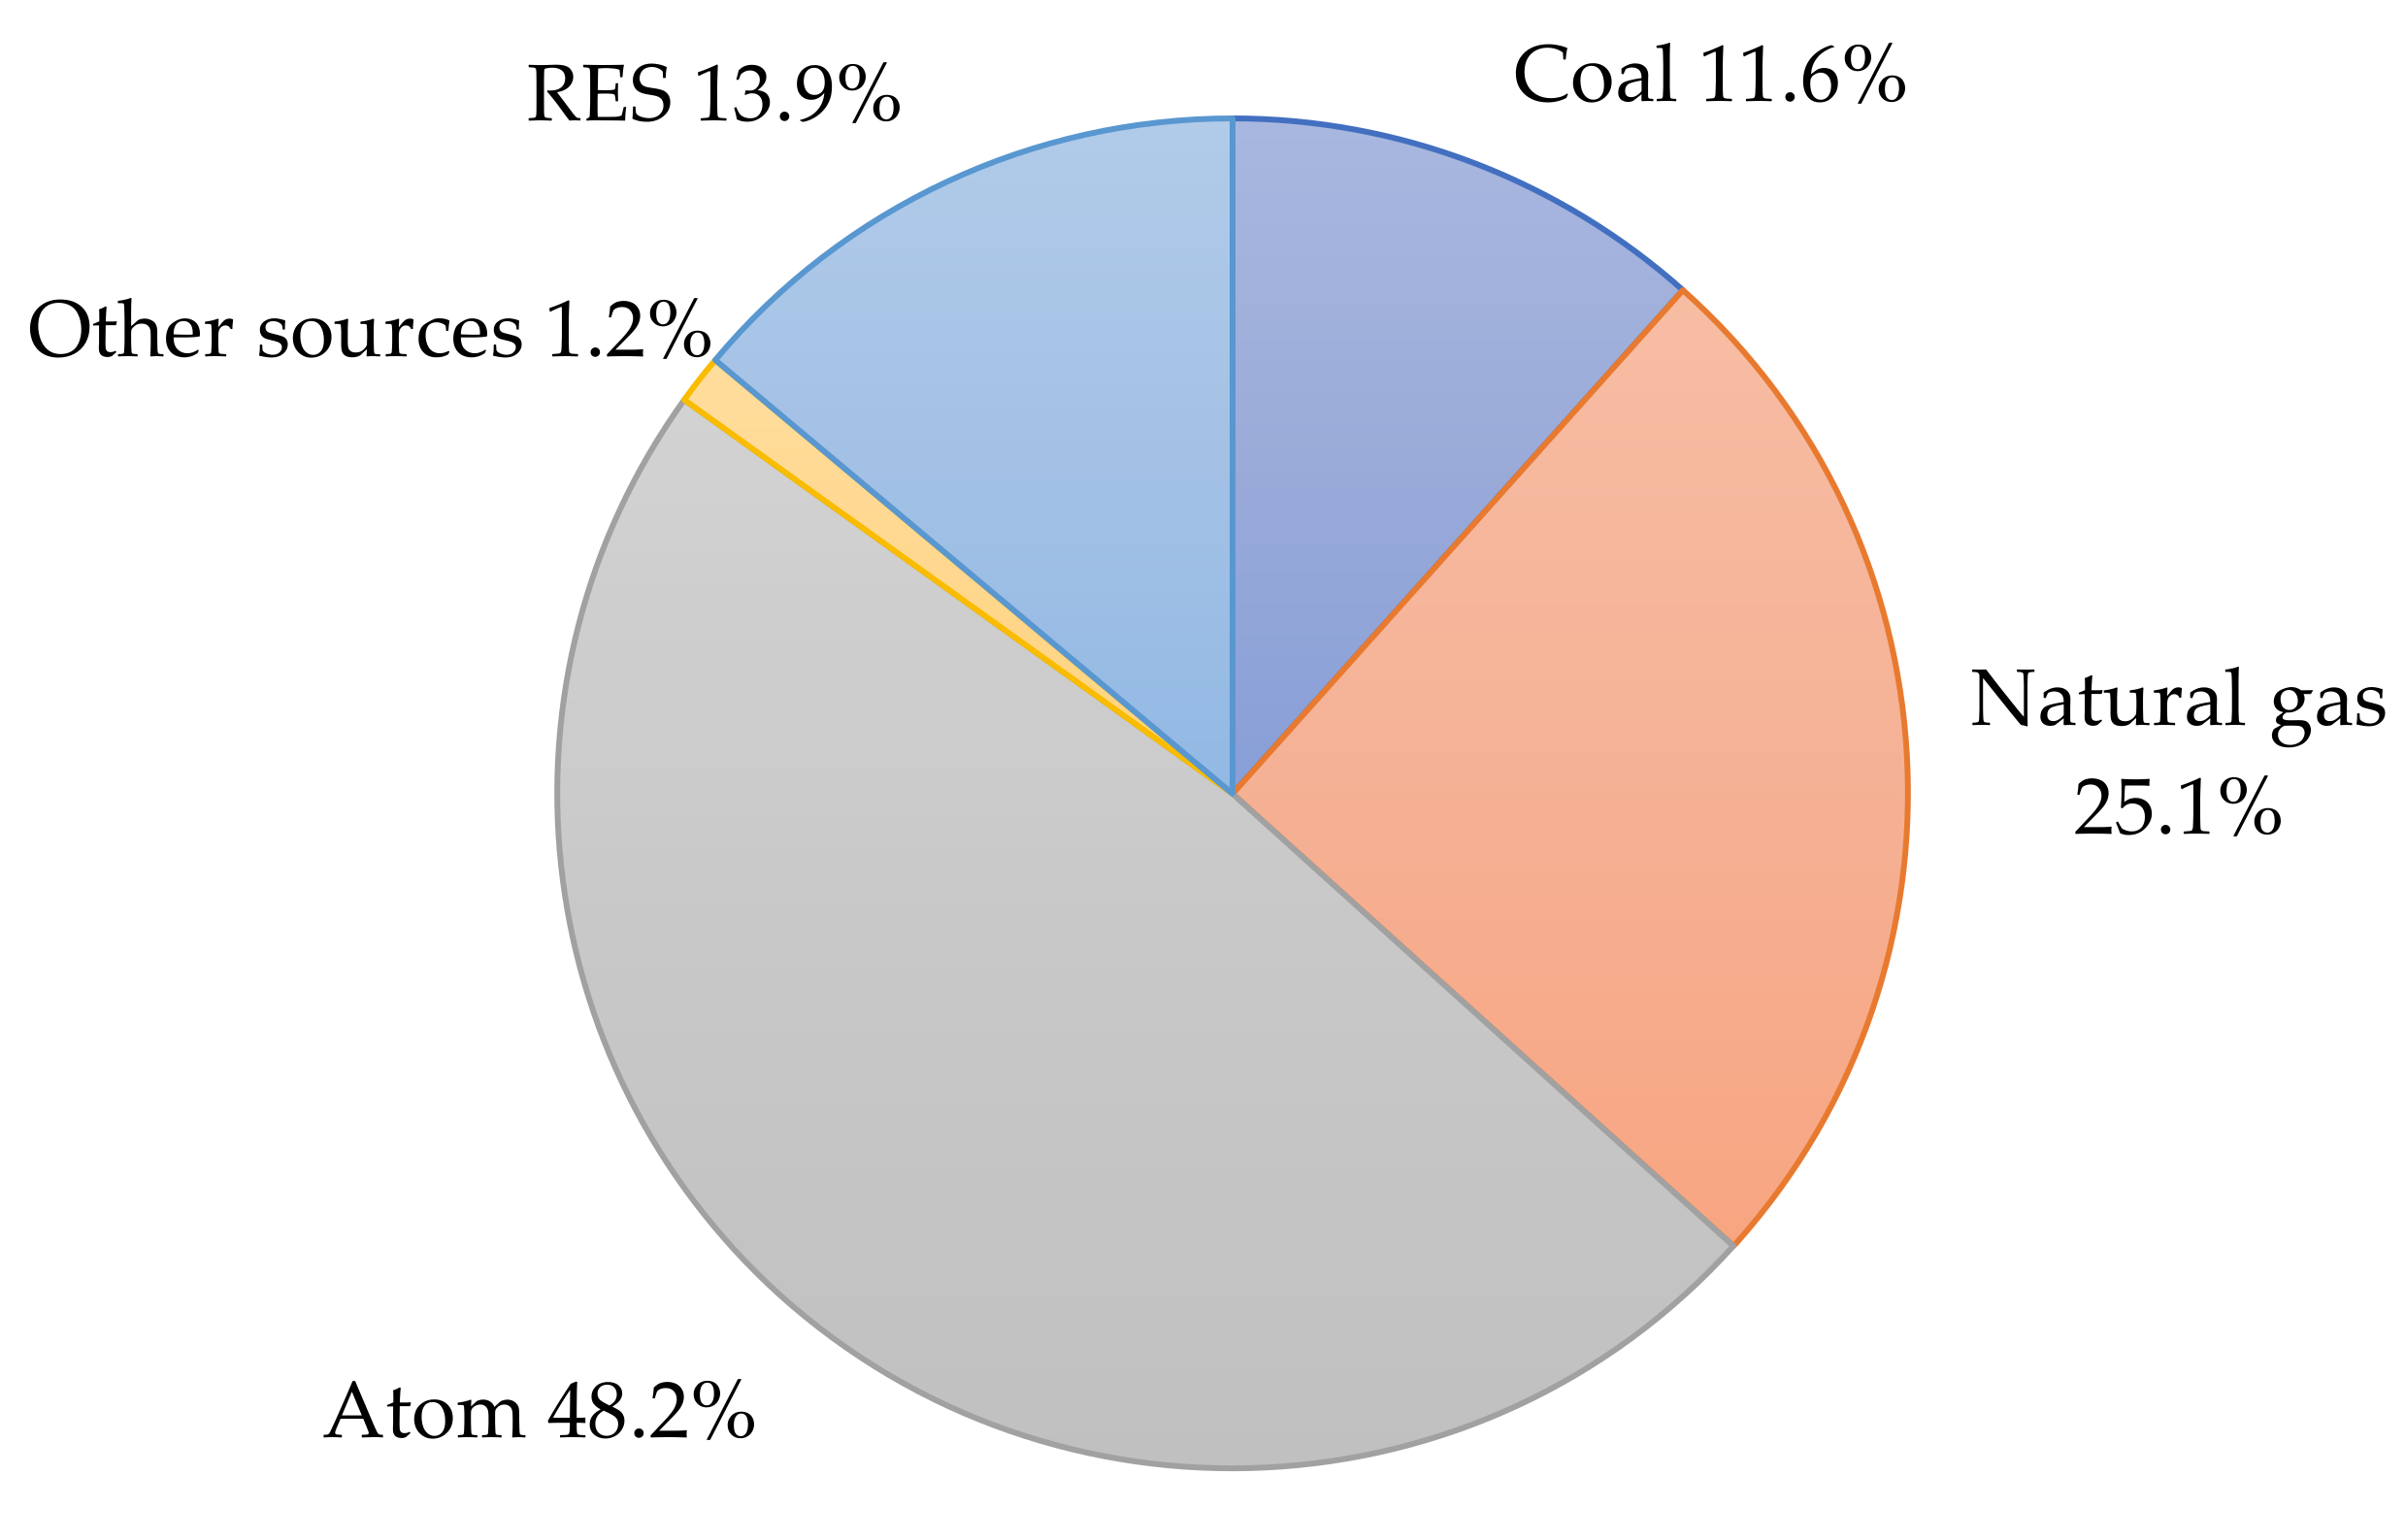
In 2020, 48% of electricity in Hungary came from nuclear power plants (in 2019: 48.2%, in 2018: 49%), 36% of electricity production in Hungary was based on fossil fuels (25% gas, 11% coal) (
Figure 3) [
52,
53,
54]. For comparison, in 2018, 23% of electricity came from gas and 15% from coal. In 2019, coal was the source of 11.6% of electricity and gas of 25.1%. In 2020, 15% of electricity came from renewable sources (12% in 2018). Electricity production from renewable energy sources is increasing, in line with the EU’s Green Electricity Directive. Electricity production in 2019 was 87 TWh. Internationally, the Czech Republic continues to export more electricity than it imports [
55].
In Slovakia, the energy system is dominated by nuclear energy and natural gas, whose shares are 22.7% and 23.5% of TPES, respectively [
39,
50,
51]. In 2016, energy consumption was at the level of 16.5 Mtoe of the total primary energy supply; in 2017, it was 18.0 Mtoe [
39]. The energy carriers are mainly crude oil and coal, whose shares is 21.4% and 19.6% of TPES, respectively. In addition, in Slovakia, the highest energy intensity can be observed in industry, with its total energy consumption of about 4 Mtoe. Transportation (about 2.5 Mtoe TFC) and the housing sector (about 2.3 Mtoe) can be distinguished in the second place. Services take the last place in the energy intensity structure, with energy intensity of around 1.5 Mtoe [
56,
57].
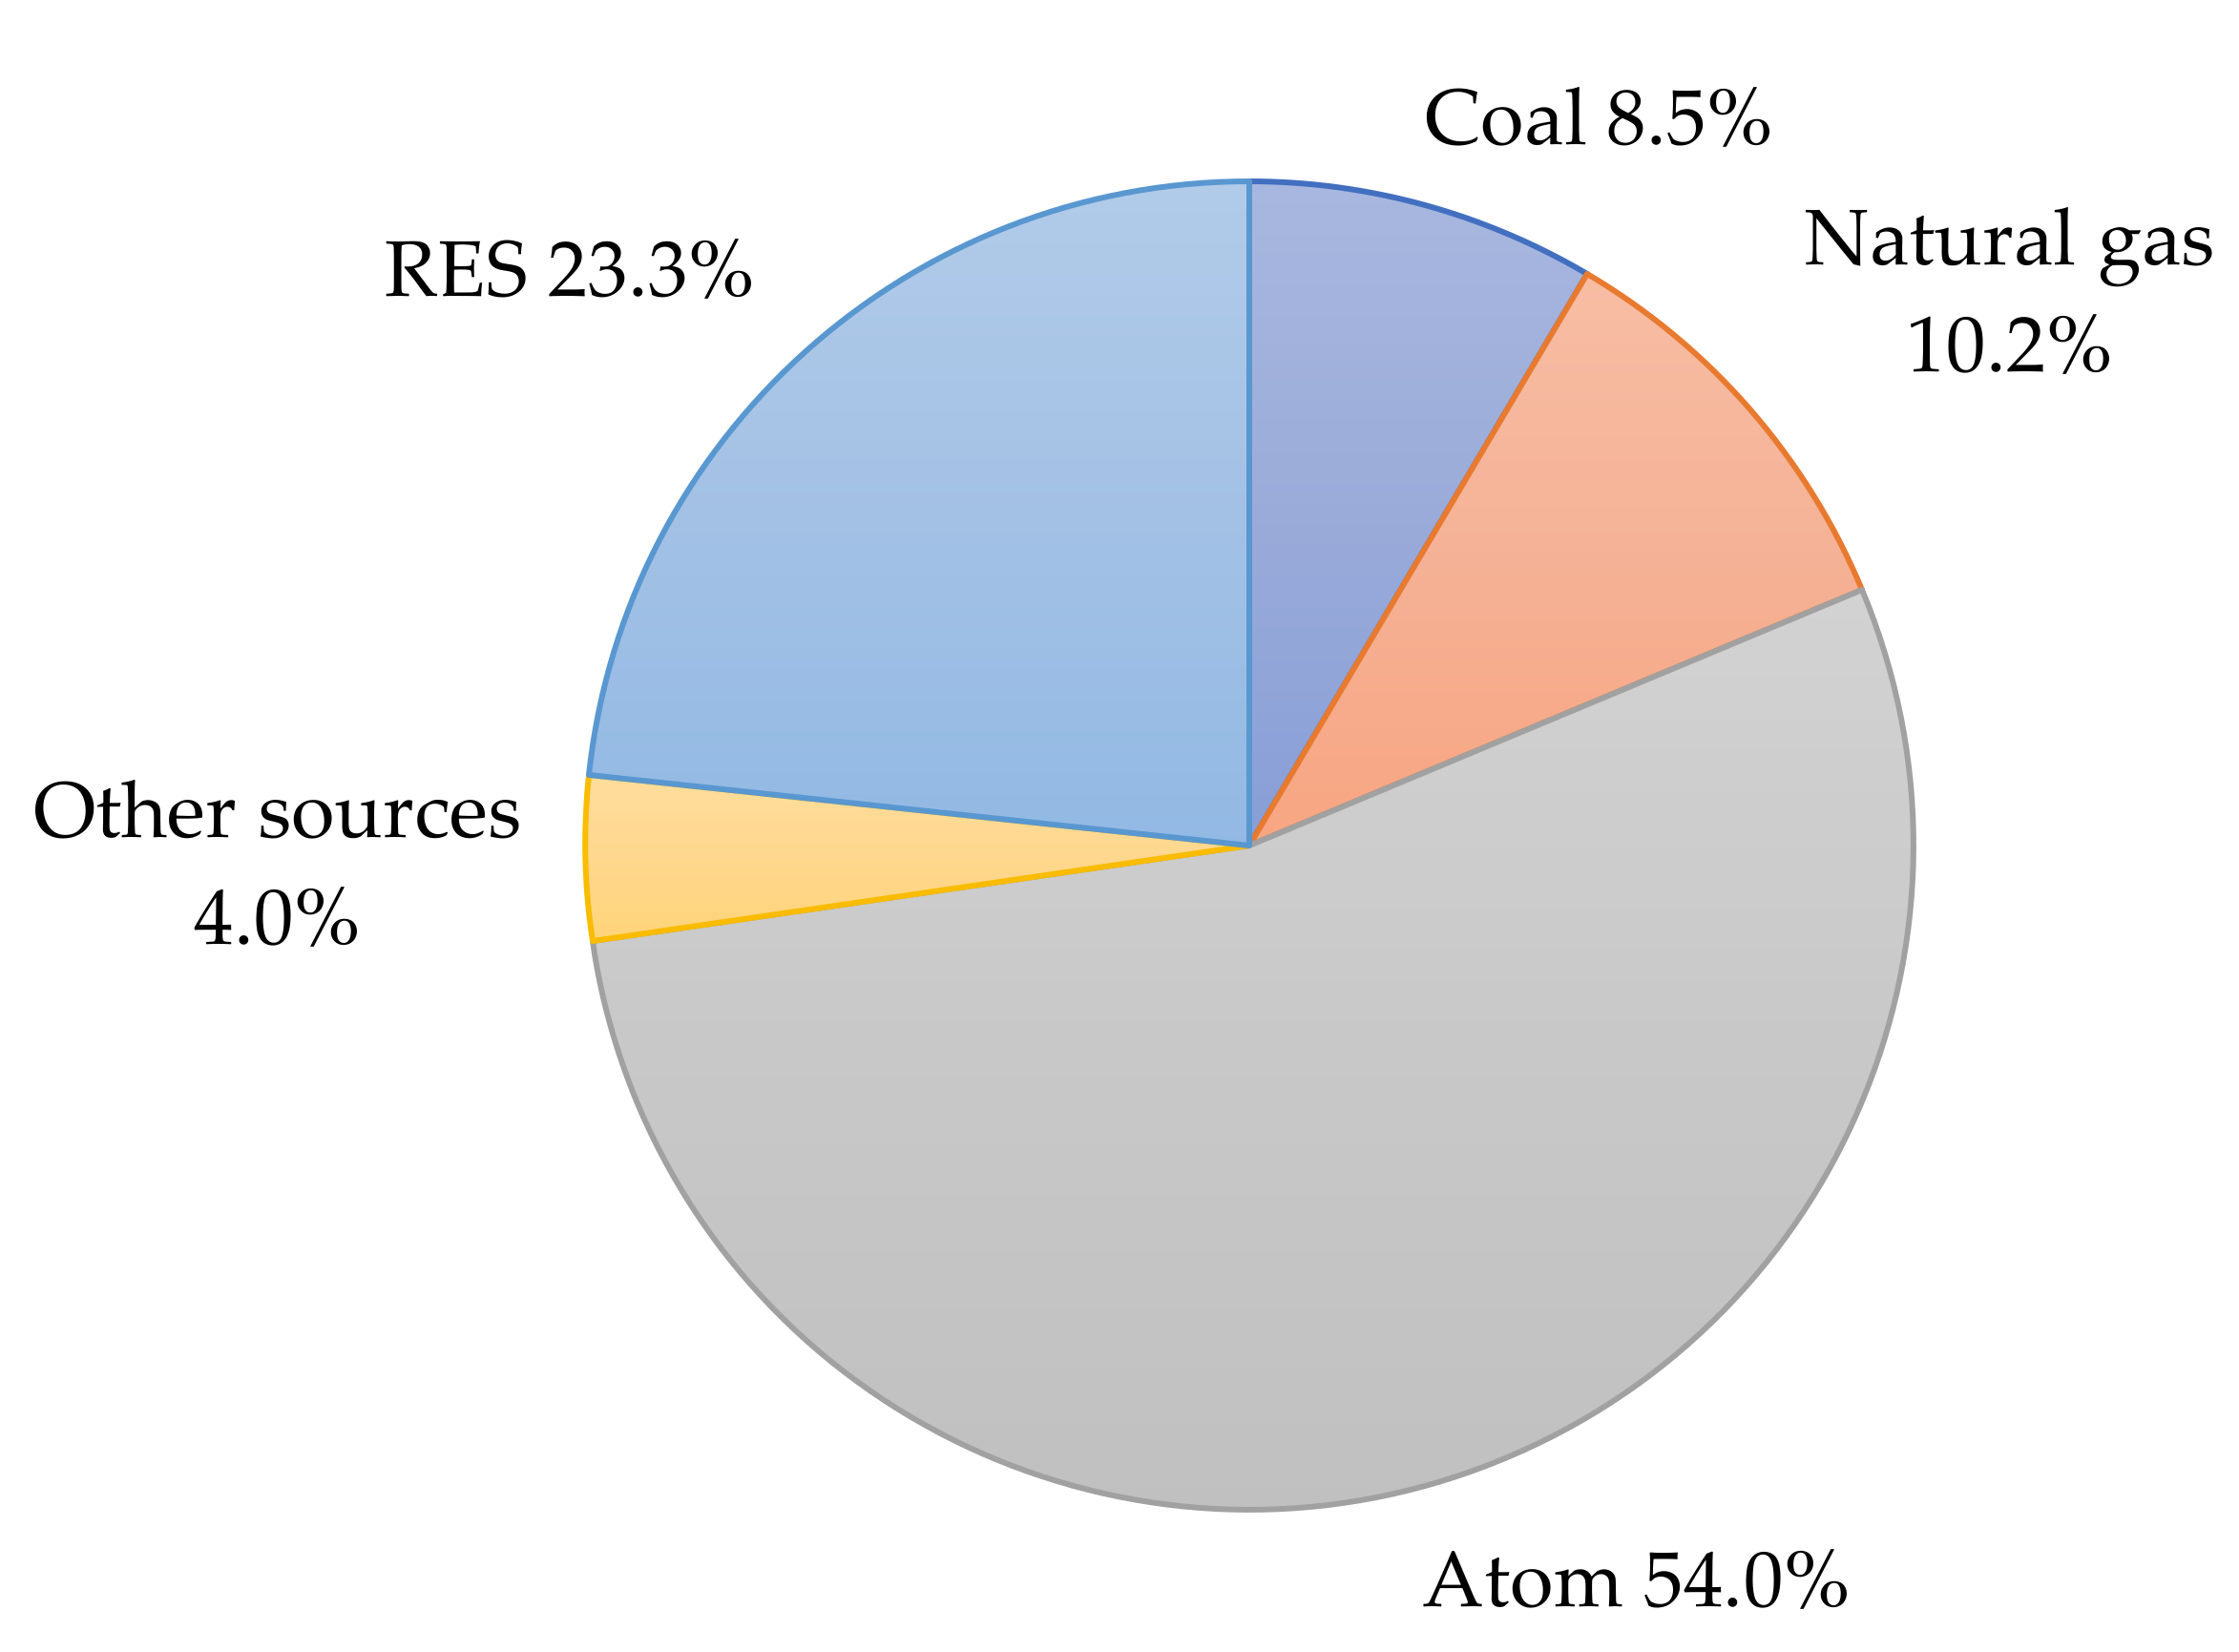
Nuclear power plants are the main contributors to electricity production in Slovakia (
Figure 4) [
58]. In 2020, 54% of electricity in Slovakia came from nuclear power plants (54% in 2019), 8.5% from coal (8.5% in 2019), 10.2% from natural gas (10.2% in 2019), and 23.3% % from renewable energy sources (23.3% in 2019,
Figure 3). The total installed capacity with all energy sources was 7728 MW in 2019 and 7721 in 2017 [
59].
Table 1 presents the listing of the energy mix of the Visegrad Group in 2019 [
60,
61,
62].
Table 2 presents the listing of the quantity of primary energy consumption in the Visegrad Group states [
60,
61,
62].
Table 3 presents the listing of the quantity of energy generated from renewable sources in the Visegrad Group States [in Mtoe] [
60,
61,
62].
2.1. Renewable Energy Sources in the Visegrad Group States
In 2018, the EU adopted new rules on renewable energy sources. The RED II Directive sets out a common framework for the promotion of renewable energy and sets a binding EU target of at least 32% share of renewable energy in the EU’s gross final energy consumption in 2030. Thus, the EU’s climatic and energy goal is to reduce greenhouse gas emissions by at least 40% by 2030, compared to 1990 levels. The European Green Deal already provides for the possibility of increasing the greenhouse gas emission reduction target in the EU not by 40, but by 50–55%, compared to 1990. In line with the guidelines of the new directive, member states were required to define their projected contribution to the achievement of the new EU energy targets. The national energy and climate plans (NECPs) reflect the percentage of renewable energy for the V4 countries such as Poland (23%), Hungary (21%), the Czech Republic (22%) and Slovakia (19.2%) by 2030.
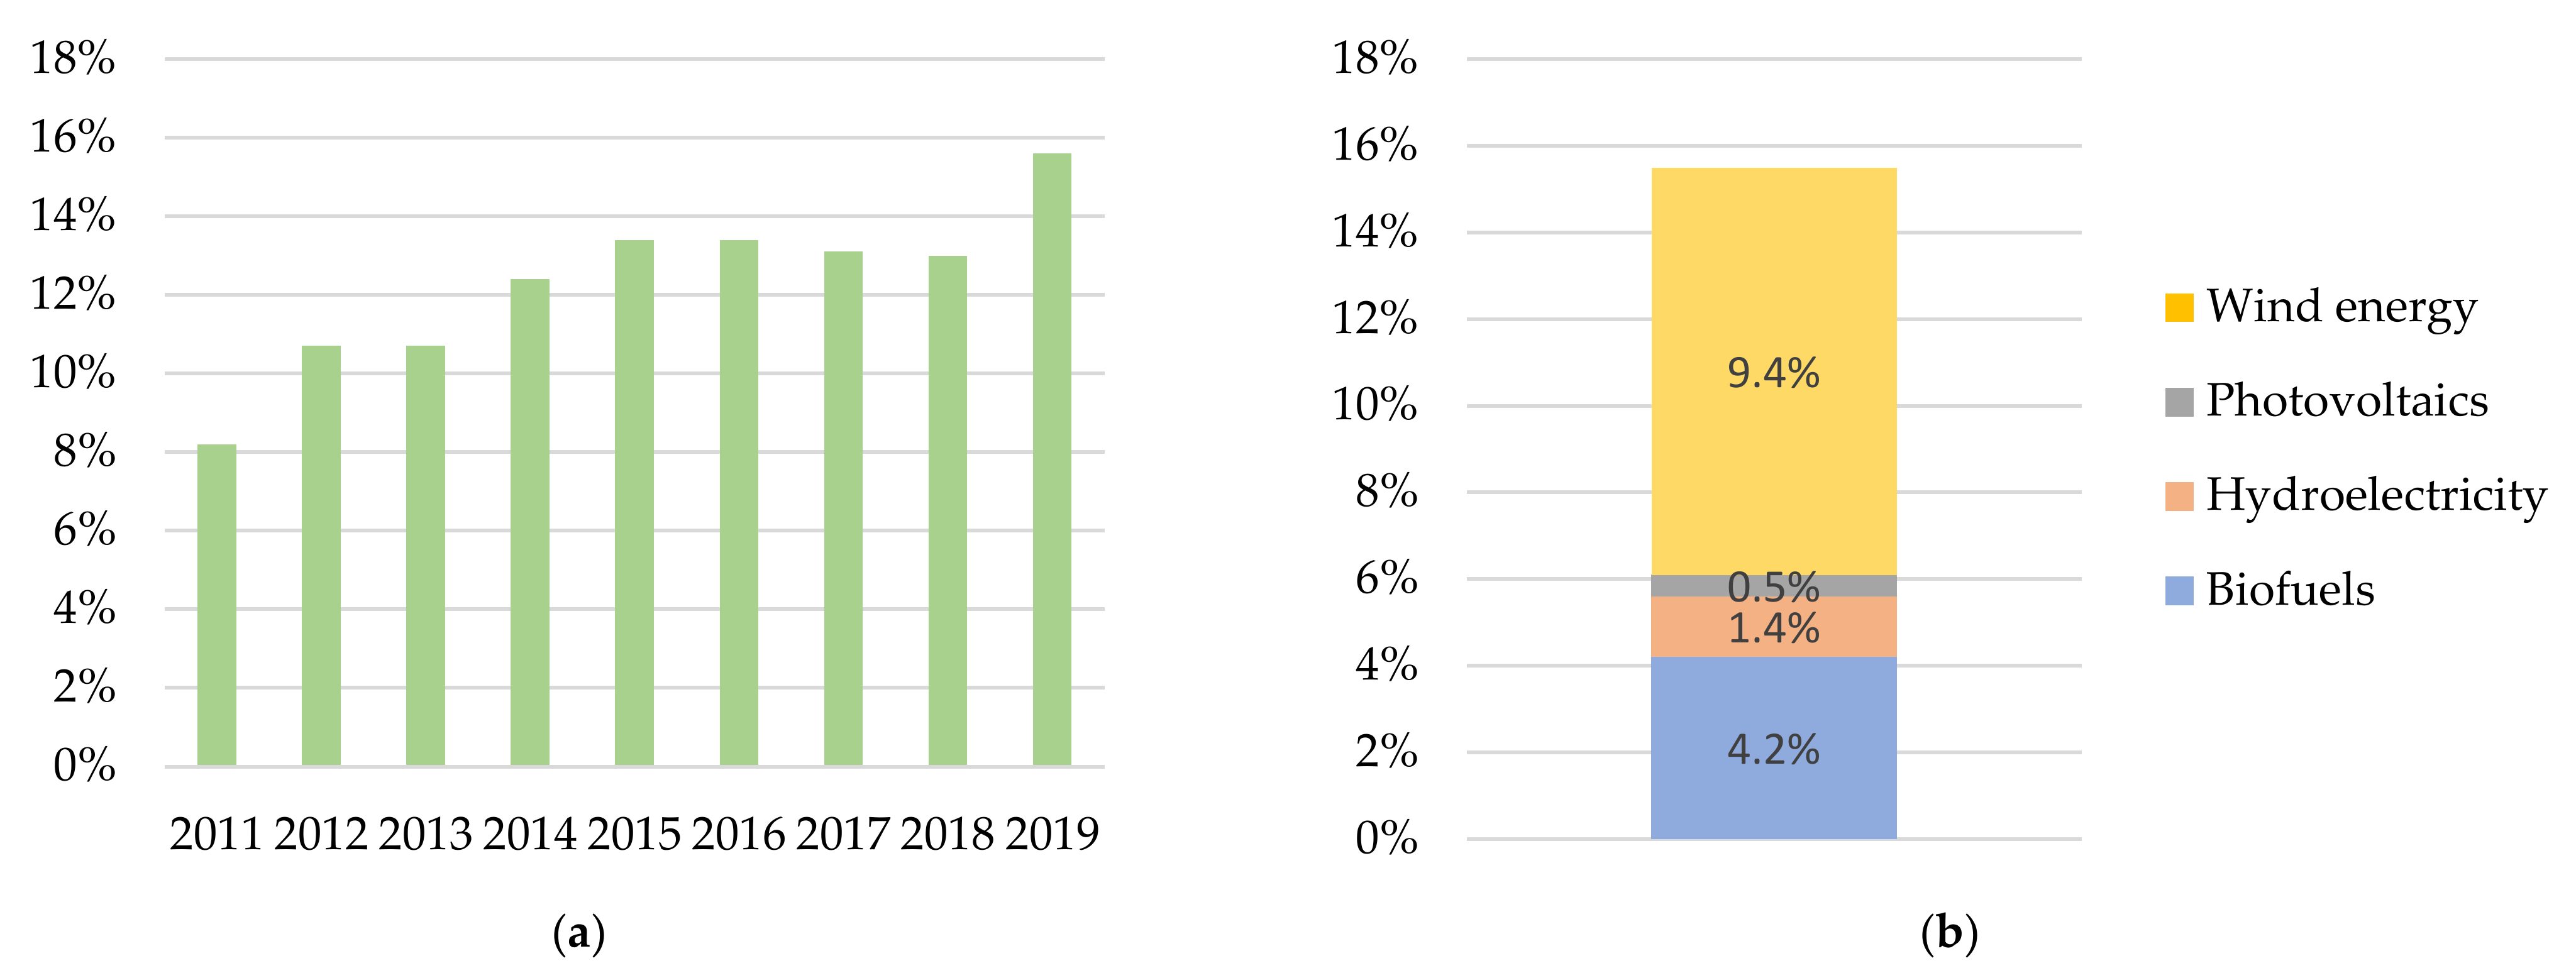
In Poland, the use of renewable energy sources in the energy market has increased significantly since the 1990s [
63,
64]. The share of energy from renewable sources in the acquisition of primary energy TPES increased in 2011–2019 from 8.2% to 15.6% in total. The structure of energy acquisition from renewable sources for Poland results mainly from the geographical conditions characteristic for Poland and the resources that can be managed [
65,
66]. The energy obtained from renewable sources in Poland in 2019 came mainly from solid biofuels (65.56%), wind energy (13.72%) and liquid biofuels (10.36%). The total energy value of primary energy obtained from renewable sources in Poland in 2019 was 396,498 TJ [
67].
In 2019, Poland produced the most electricity from renewable energy sources in history (over 25 TWh). At the end of 2019, 9.5 GW was installed in RES, of which 1.5 GW in photovoltaic installations. The development of RES in the last two years is mainly the result of investments in prosumer installations. The share of RES in the production of electricity was 15.6%. It is the highest ever (
Figure 5).
In the field of electricity, Poland focuses on the construction of wind farms, but also photovoltaic power plants. The increase in photovoltaics was ensured mainly by reducing the tax for small power plants from 23% to 8% as well as through state subsidy program for these projects.
In January 2020, the Government of the Czech Republic approved the National Energy and Climate Plan for 2021–2030. The document, drawn up by the Ministry of Industry and Trade, introduces certain changes regarding the use of individual fuels in the structure of energy production and consumption in relation to the assumptions set out in the country’s energy concept of 2015. The program of the newly adopted strategy assumes an increase in the share of energy from renewable sources in final energy consumption within ten years. The key part of the adopted energy and climate plan is to determine the Czech Republic’s contribution to the European climate and energy goals in terms of reducing greenhouse gas emissions, increasing the share of renewable energy sources in energy production and consumption, and increasing energy efficiency. Despite the EC’s recommendations to increase the share of renewable energy sources in total energy production and use to a minimum of 23% within a decade, the newly adopted version of the plan from January 2020 assumes that it will reach 22% in 2030.
Renewable energy in the Czech Republic in 2015 reached the level of 3.8 Mtoe, or 9.4% of TPES. The dominant renewable energy sources are biomass and biofuels, which accounted for 8.6% of TPES (3.5 Mtoe). This value increased to 10.5% in 2017. Solar energy, water energy and wind energy took marginal positions in the Czech energy sector with their shares of 0.5%, 0.2% and 0.1% of TPES, respectively. There is no energy production from geothermal sources; however, this energy acquisition source is subject to ongoing research [
68,
69,
70]. Although the use of renewable energy in the Czech Republic increased from 2% of TPES in 2000 to about 10% in 2017, nuclear power is an essential element of the Czech diversification strategy [
68]. Biofuels and biomass account for 10.2% of TPES, while coal constitutes only 8.5% of the primary energy supply. The remaining renewable energy sources amount to only about 1.3% of TPES [
47,
71].
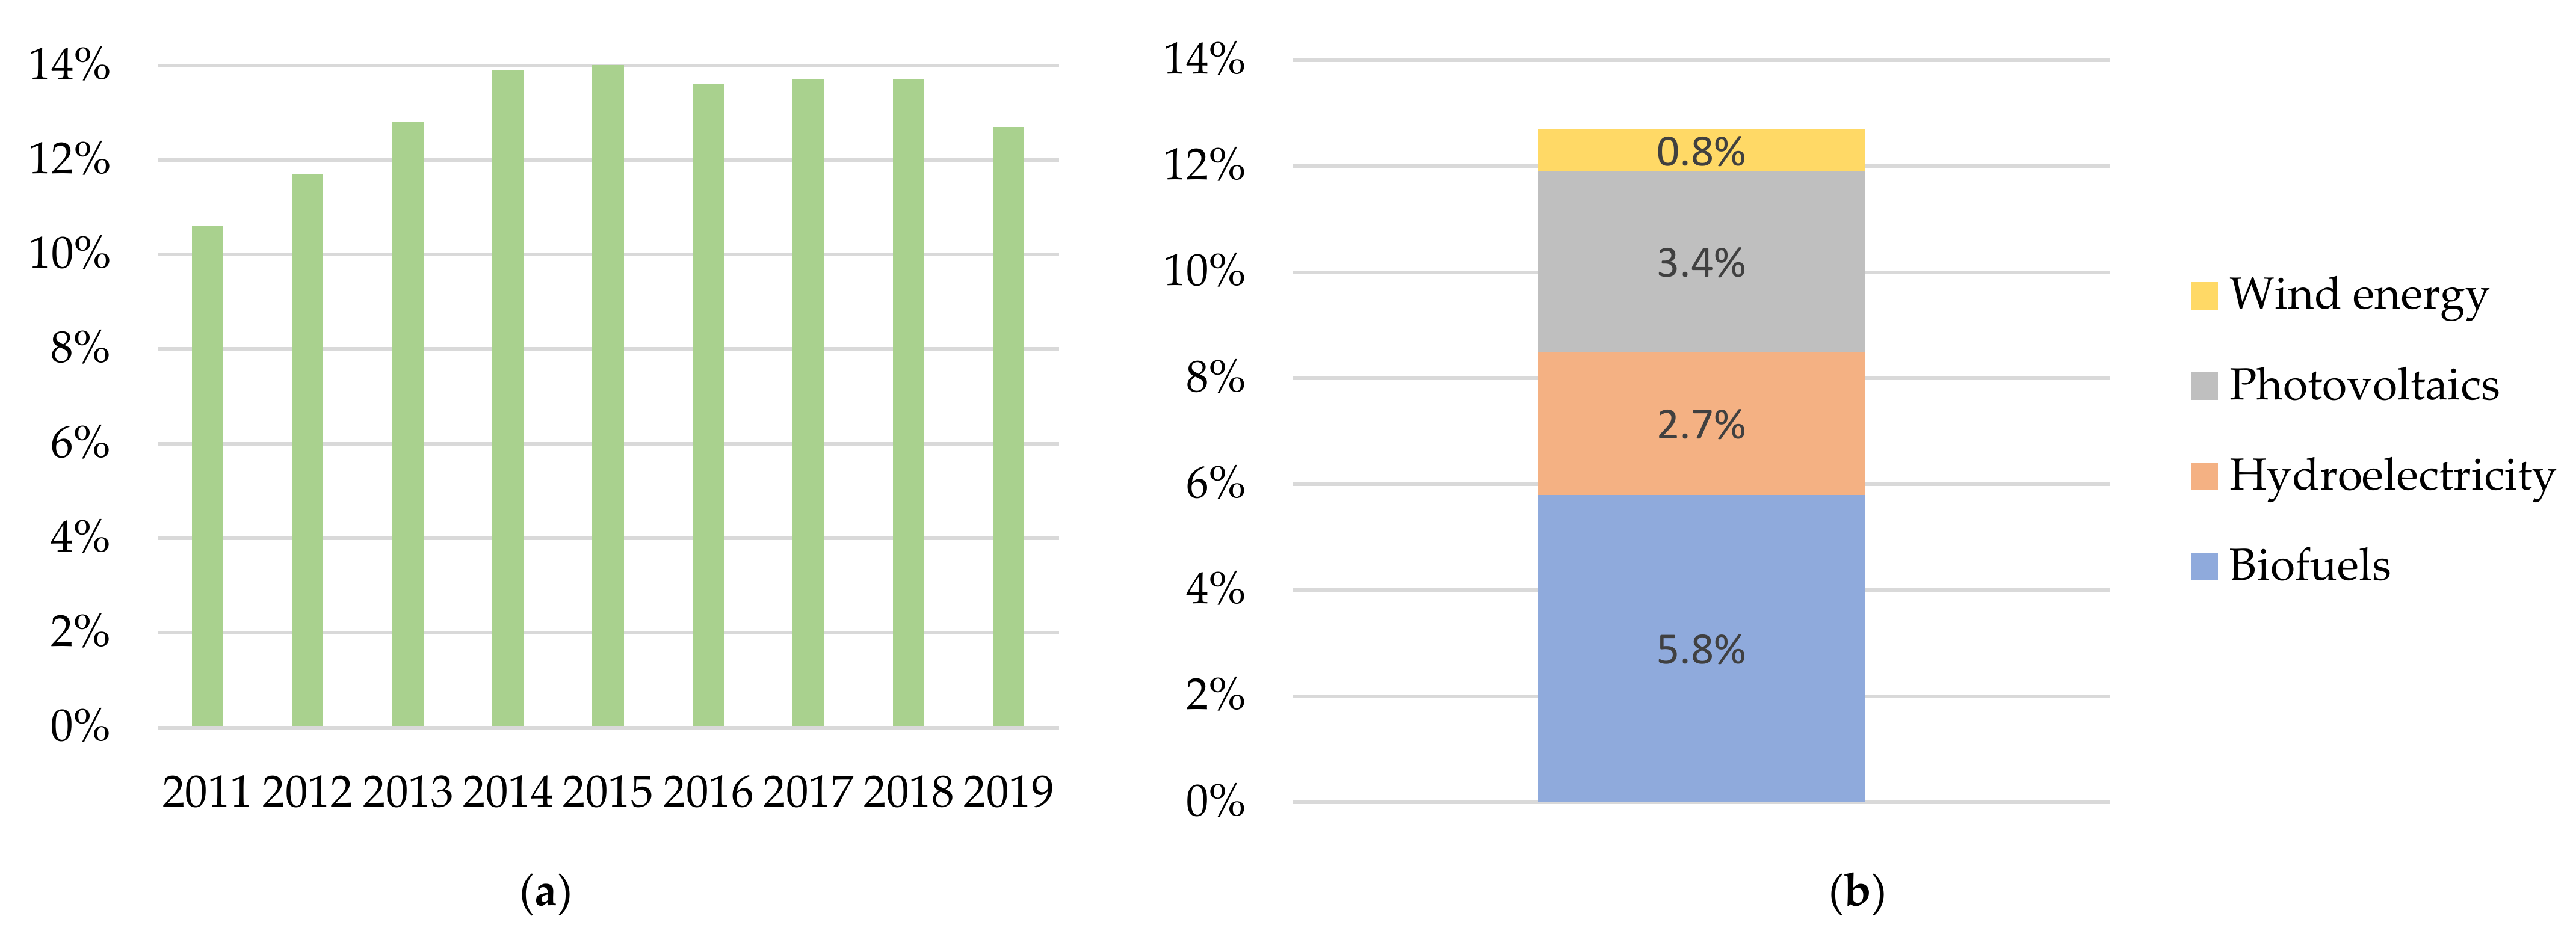
According to the national climate and energy plan, approved by the Czech Government in January 2020, the share of RES in gross final consumption should increase to 22% by 2030. In 2019, this level was 16%, a large part of which was heating households with biomass. Renewable energy sources accounted for only 12.7% of electricity generation (biofuels 5.8%, hydroelectricity 2/7%, photovoltaics 3.4%, wind energy 0.8%) (
Figure 6) [
72,
73,
74,
75].
In Hungary, an increase in renewable energy sources in the energy system has been observed over the last ten years. This increase is caused by the use of biomass to produce heat and energy. Biomass is perceived as the source with the highest potential for heat and electricity, while biofuels are the most advantageous alternative to fossil fuel used in transportation [
48,
49]. In 2018, about 10.1% of the total covered primary energy supply came from renewable energy sources [
48,
49]. Hydro energy is subsequent with a 1.8% TPES indicator. Other renewable resources, such as geothermal, sun and wind, had negligible shares in the Hungarian energy market (up to 1% of TPES) [
47,
48,
49]. The amount of electricity produced in Hungary in 2001–2019 decreased from 36.4 TWh in 2001 to 33.9 TWh in 2019. Renewable electricity generation is a growing sector in Hungary. According to 2019 data, the share of renewable energy sources in final electricity consumption was 13.9%, with biofuels (6.1%) being the main type of renewable energy source, followed by photovoltaics 4.9%, wind energy 2.2% and hydropower plants 0.7% (
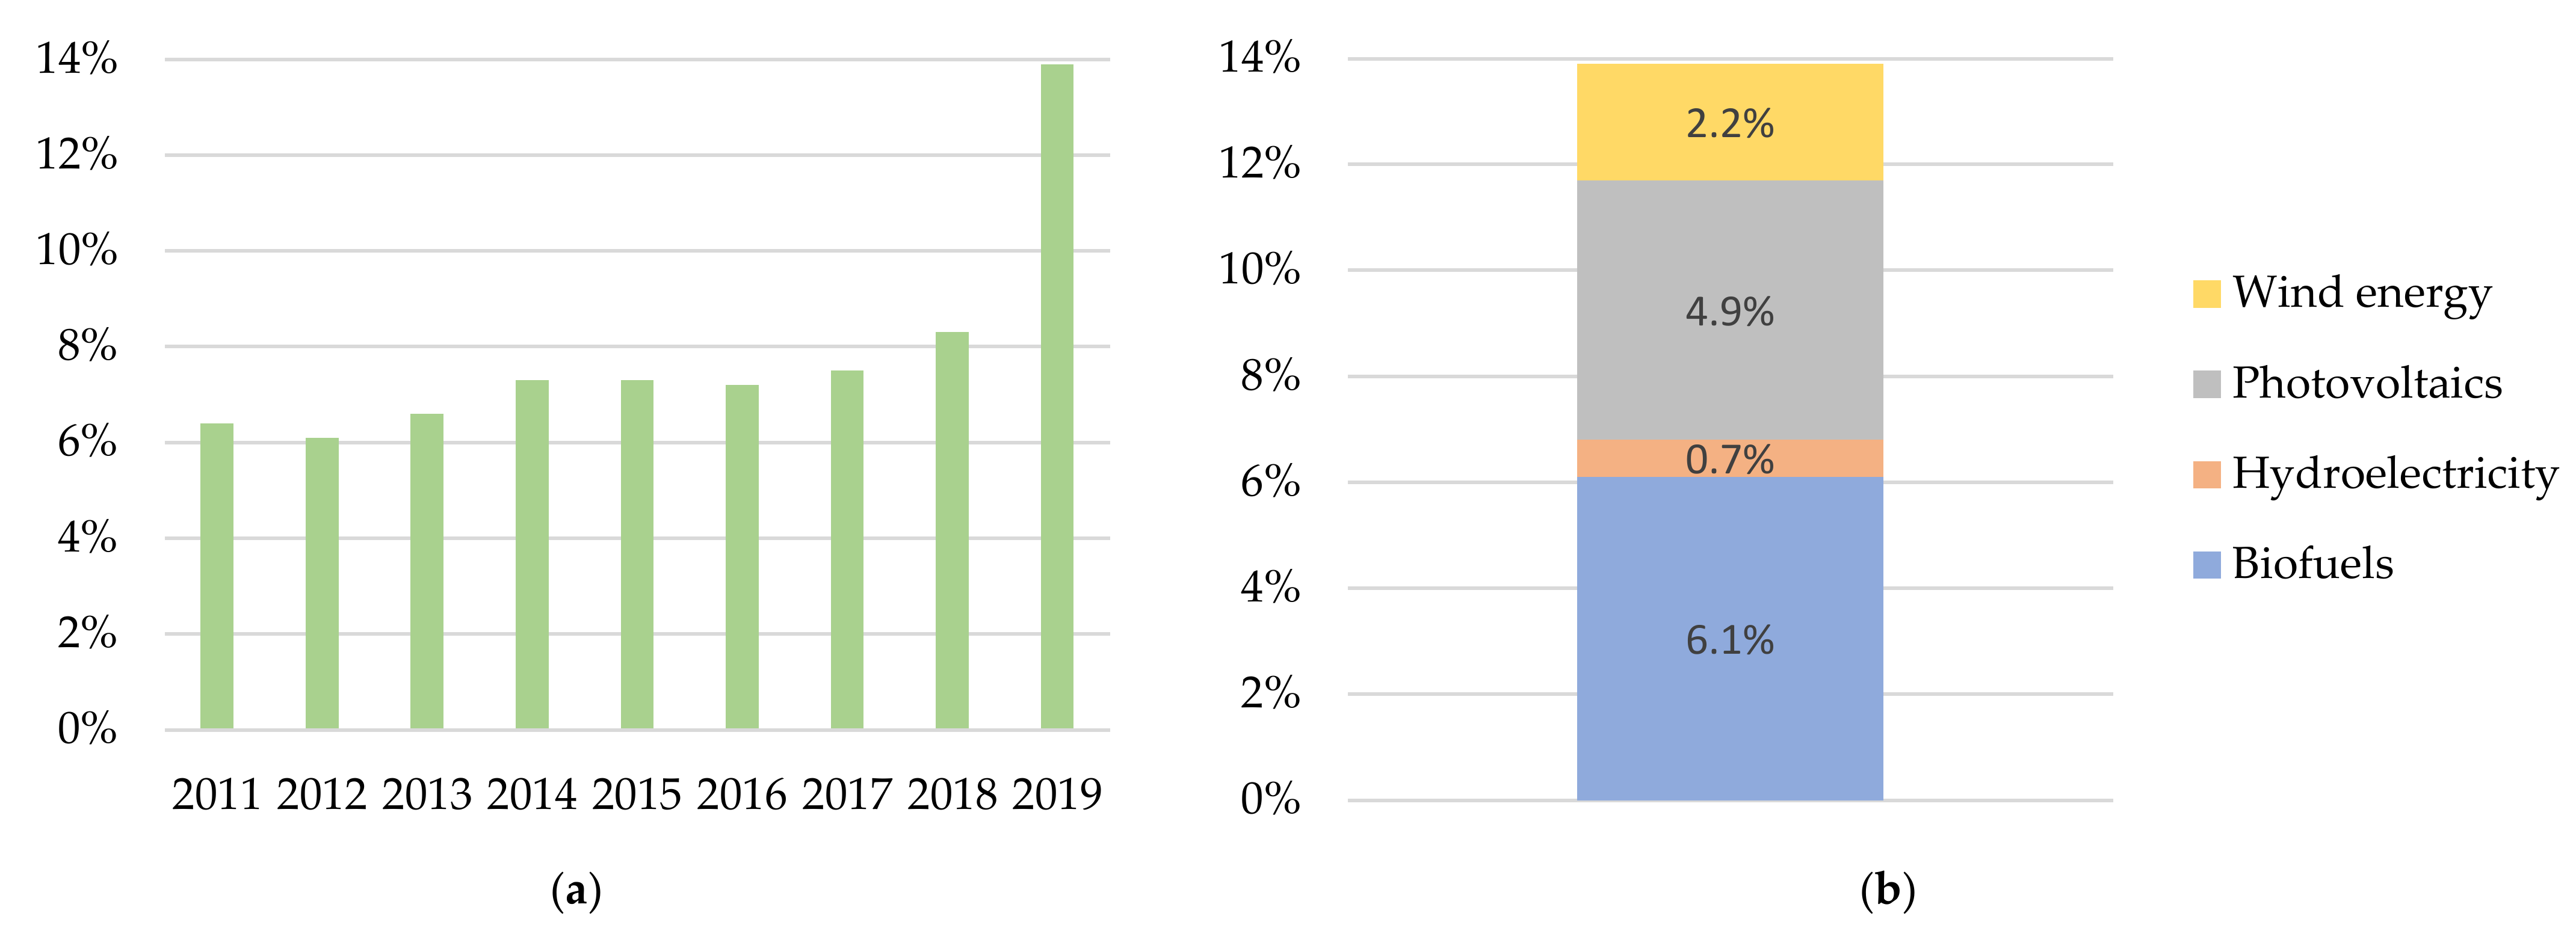
Figure 7). The power of all photovoltaic systems in 2020 was 1170 MW.
In Slovakia, about 9.2% of energy carriers’ share is attributable to renewable energy sources. Among them, biofuels dominate with a total supply ratio of 8%. The other 1.2% of TPES is water energy [
56,
57]. The total potential of renewable energy sources in Slovakia in 2019 was around 27,000 GWh per year [
76]. Biomass had the greatest technical potential of 11,200 GWh per year, the geothermal potential was around 6300 GWh per year and the geothermal waters had a heating capacity of 280 MW. The technical potential of large hydropower plants was 7600 GWh, and the technical potential of solar energy was estimated at 5200 GWh per year.
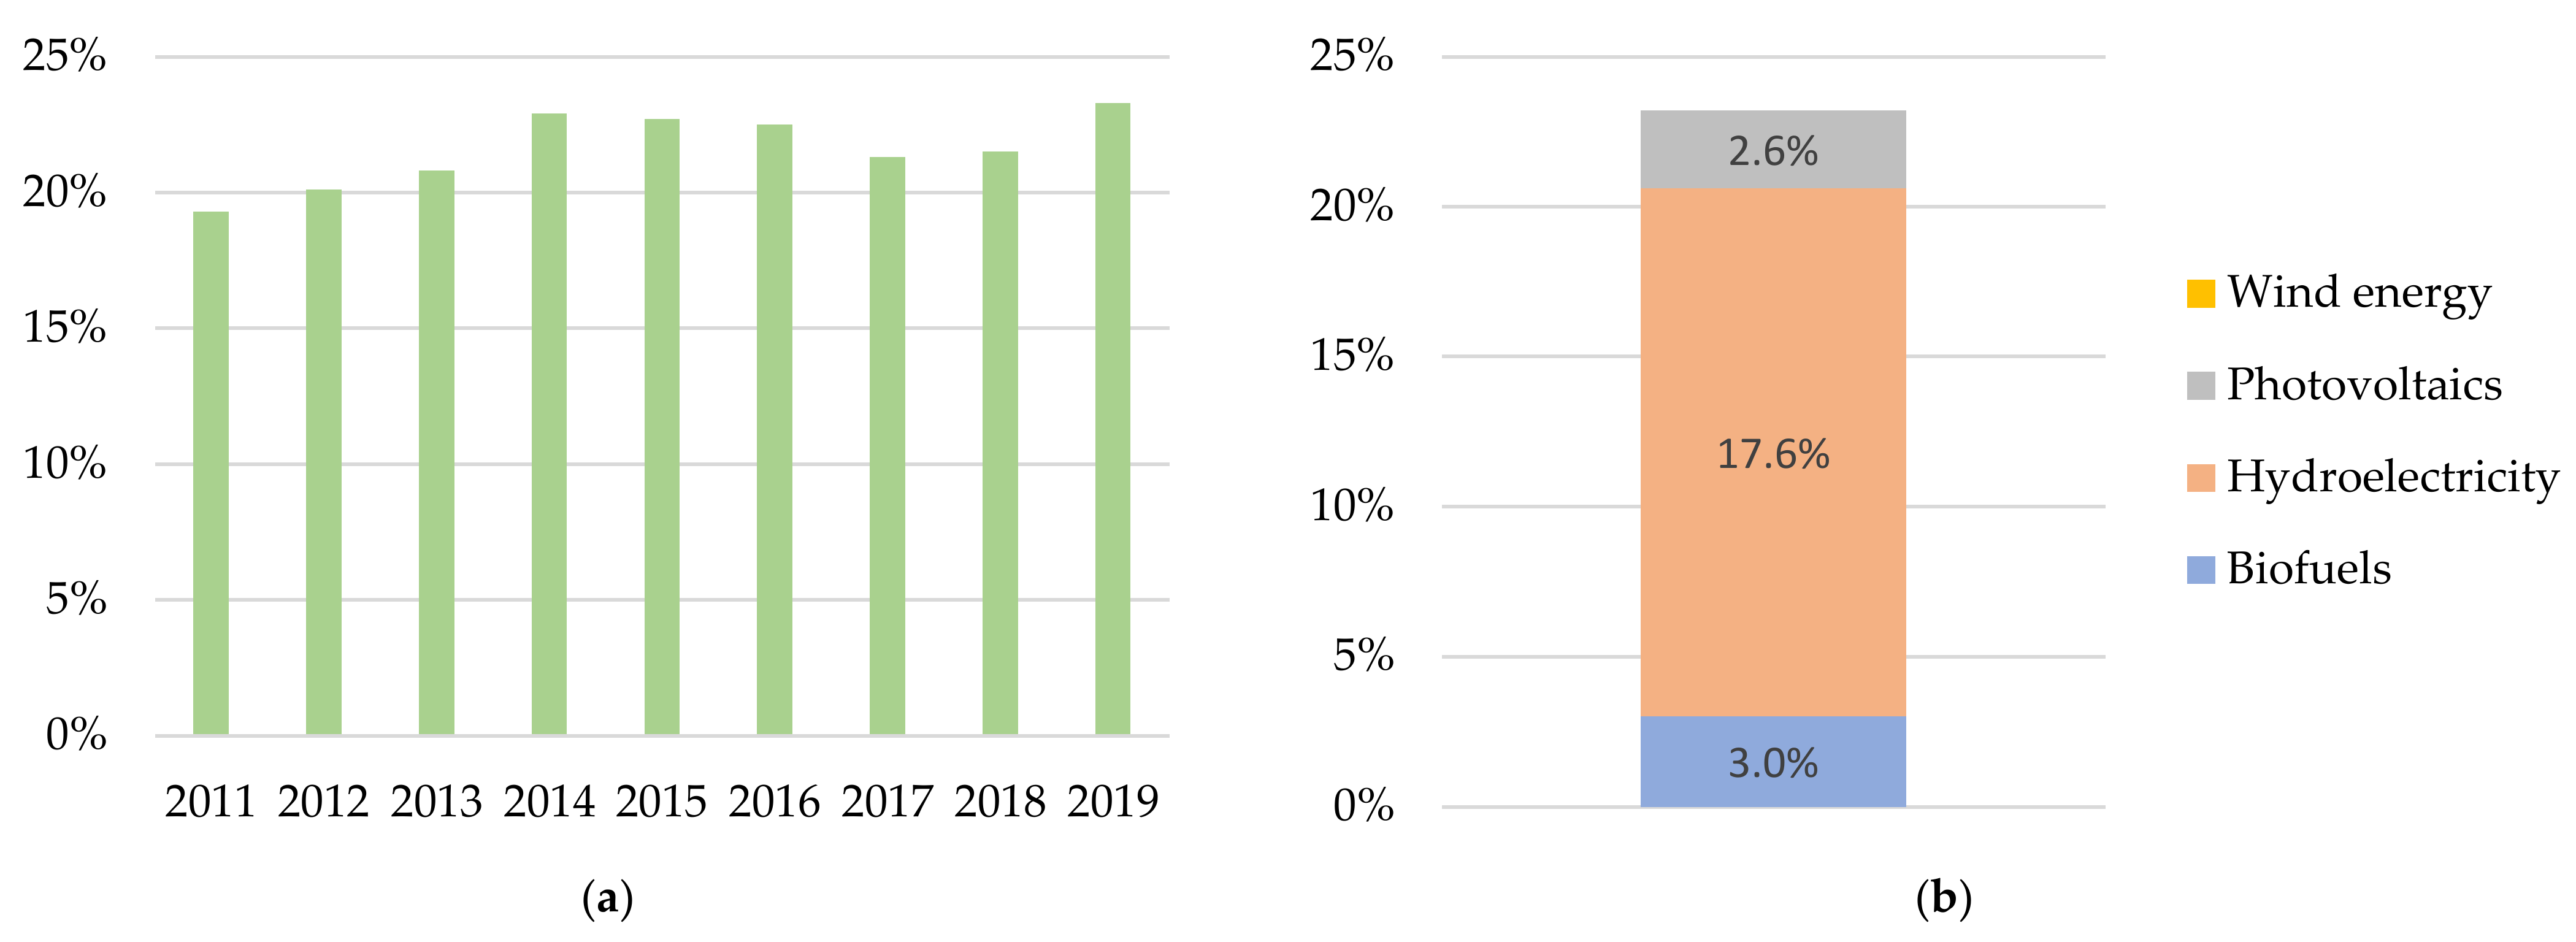
In 2019, 6157 GW of electricity was generated from renewable sources, which accounted for 23.3% in the electricity mix (biofuels 3%, hydroelectricity 17.6%, photovoltaics 2.6%, wind energy 0%) (
Figure 8) [
77,
78,
79].
Increasing the share of renewable energy in gross final energy consumption is one of the key objectives of the European Union. This parameter is supposed to gradually bring the EU closer to sustainable development in the field of energy use and has been translated into the goals of individual member states. The goals have been set individually for each EU member state.
Table 4 shows the share of energy from renewable sources in the gross final energy consumption (in %) in the countries of the Visegrad Group in the years 2010–2019 [
60,
61,
62].
Table 5 presents the share of electricity generated from renewable sources in gross final energy consumption in percentage in the Visegrad Group states in 2010–2019 [
60,
61,
62].
2.2. Energy Efficiency of the Visegrad Group States
All European Union member states are obliged to carry out activities to improve their energy efficiency. One of the priority goals is to increase the share of renewable energy in the produced and consumed energy in Europe.
By the European Parliament and the Council’s Directive 2009/28/EC on the promotion of the use of energy from renewable sources, EU member states were obliged to ensure a certain share of energy from renewable sources in their gross final energy consumption in 2020. National targets make up the overall EU target of 20% for the share of renewable energy in gross final energy consumption in the community. For Poland, this target was set at 15%, for the Czech Republic 13%, for Hungary 13% and for Slovakia 14%.
The EU 2030 climate and energy policy framework includes EU-wide assumptions and energy targets for 2021–2030 to reduce greenhouse gas emissions by at least 40% (compared to 1990 levels). The reduction target for Poland, in terms of greenhouse gas emissions in sectors not covered by the ETS system, was set at −7% in 2030 compared to the level of 2005. Moreover, it is planned to increase the share of renewable energy in total gross energy consumption in the EU to at least 32%. As part of the implementation of the EU-wide target for 2030, Poland declares to achieve 21–23% by 2030, the Czech Republic 22%, Hungary 21%, Slovakia 19% of the share of renewable energy in gross final energy consumption (consumption in total in electricity, heating and cooling as well as in transport purposes). In addition, the EU plans to increase energy efficiency by at least 32.5%. The goals of the energy transformation for 2030 in the V4 countries are presented in
Table 6.
For Poland, the national target for improving energy efficiency by 2030 was set at 23% in relation to primary energy consumption according to the PRIMES 2007 forecast, which corresponds to the primary energy consumption of 91.3 Mtoe in 2030.
The main producers of electricity in Poland are conventional utility power plants [
80]. They produce about 70 percent of total electricity for distribution and sale in the national energy system. The average age of power plants in Poland is 47 years. Aging power generation units reduce the level of Poland’s energy security. Moreover, the problem of the Polish energy generation sector is the relatively low efficiency of coal-based power generation and the accompanying high carbon dioxide emissions. The average efficiency of Polish power plants is lower than that of power plants in the EU. The newest units of the Łagisza II power plant—41%, Pątnów II—41%, Bełchatów II—42%, Opole II—45% have the highest efficiencies, but most of the remaining power plants are characterized by efficiency below 36% (the oldest—even below 30%). With the current efficiency of steam power plants, CO
2 emissions are estimated at approx. 1100–1200 kg CO
2/MWh.
In 2018, the energy production in Poland was 62.4 Mtoe. The final electricity consumption was 166.84 TWh. The total CO2 emissions were 305.75 Mt.
In Poland, the total final consumption (TFC) of energy has increased over the last decade [
81]. In 2017, TFC increased by approximately 20%, compared to 2010 [
82]. Poland has implemented the main requirements of the Energy Efficiency Directive (EED) of 2012 (2012/27/EU) by adopting the Energy Efficiency Act (updated on 20 May 2016). The requirements set out in the act include an energy-saving system for energy companies and other measures resulting in 1.5% savings annually, from 2014 to 2020. One of the most important tools for the achievement of the Polish Energy Efficiency Obligations was the ‘white certificate system’ introduced in 2013. There is also a national action plan with sectoral programs in Poland to support and promote activities to improve energy efficiency [
83]. The National Fund for Environmental Protection and Water Management (NFOŚiGW) possesses financial resources to allocate energy efficiency in public and private construction sectors. The fund also provides a national energy advisory system at the regional and local levels [
84,
85]. The most important documents that define the energy efficiency policy until 2020 include the Polish Energy Policy until 2030 and the National Action Plans on energy efficiency, the development of which was required by Directives 2006/32/EC and 2012/27/EU. Poland’s energy policy in the longer term is presented in these strategic documents: Poland’s Energy Policy until 2040 (PEP2040) and the National Energy and Climate Plan for 2021–2030. According to the updated Polish Nuclear Energy Program (PPEJ), published in October 2020, the first energy reactor is to be commissioned in 2033 and a further six at two-year intervals, so that the installed capacity in nuclear power plants is between 6 and 9 GW in 2043. The PEP2040 document assumes an increase in the share of RES in all sectors and technologies. In 2030, the share of RES in gross final energy consumption will be at least 23%—not less than 32% in the electricity sector (mainly due to wind and photovoltaic energy), 28% in heating and 14% in transport with a large contribution of electromobility. Offshore wind energy will reach approx. 5.9 GW in 2030 and approx. 11 GW in 2040, in terms of installed capacity. There will be a significant increase in the installed capacity in photovoltaics, around 5–7 GW in 2030, and 10–16 GW in 2040. The share of coal in electricity production will reach 37–56 percent in 2030 and 11–28 percent in 2040, depending on whether the price of emission allowances increases faster or slower.
The Czech Republic is introducing provisions on its energy policy to support and improve the country’s energy efficiency in line with the European Union guidelines. The Czech energy policy emphasized increasing overall energy efficiency in all sectors of the economy. The adopted target was the efficiency increase of 20% by 2020 and a further increase of energy efficiency to reduce energy intensity and average energy consumption per capita below the EU Member States average. The Czech Republic set the National Action Plan for Energy Efficiency, which introduced specific quantitative goals for energy savings. The national target for energy efficiency was set at 1060 PJ of final energy consumption. The obligation to cumulate energy savings has been set at 204.39 PJ of cumulative energy savings by 2020.
The State Program for Supporting Energy Saving and Renewable Energy Use (EFEKT) supports financial energy efficiency, secondary and renewable energy sources [
86,
87]. From 2004 to 2017, a decrease by about 30% in the total final energy consumption was observed in the Czech Republic. In the most energy-intensive sector—industry—the trend of energy consumption declined between 2004 and 2014 (−16.9%). Within ten years, the structure of demand for individual energy carriers has also changed to the benefit of renewable raw materials (75.1% TFC for biomass and biofuels).
The Czech Government assumes a gradual withdrawal from coal-based energy with a simultaneous increase in the share of nuclear power in the national energy mix. In 2020, the Czech coal commission set the date of abandonment of coal in the energy sector for 2038 (in accordance with the requirements of the Paris Agreement of 2030). The reduction in the importance of coal in the Czech energy mix is to be compensated by further increasing the share of nuclear power in it. This is supposed to be made possible by the construction of the fifth unit at the Dukovany Nuclear Power Plant—the construction of the unit is scheduled for 2029–2036. The Czech Government plans to increase the share of renewable energy sources in the national energy mix to 20.8% in 2030. Such assumptions, however, differ from the European Commission’s recommendation for the Czech Republic (23% in 2030). So far, the Czechs have managed to achieve such goals even before the suggested date. In 2013, the Czech Republic reached the 13% share of RES in its energy consumption, as recommended by the European Commission (
Table 4). One of the principal goals of the Czech Government is to achieve energy self-sufficiency of the state. The declarations do not translate into reducing dependence on gas supplies from Russia. This is evidenced, e.g., by support for the Nord Stream 2 gas pipeline, which would supply the Czech Republic via the EUGAL gas pipeline running along the Polish–German border. Poland and the Czech Republic are unanimous in their announcements regarding investments in nuclear energy.
In Hungary, in the last decade, a decrease in final energy consumption is observed, despite increases in energy intensity in the housing sector. Residential and commercial sectors combined account for 46% of TFC, but energy consumption has decreased thanks to measures to improve energy efficiency in construction. Energy consumption in industry and transport has increased in recent years. The Hungarian energy strategy and the national action plan for energy efficiency were developed to improve energy efficiency. One of the priorities of Hungarian financial support programs is to reduce energy intensity. The important programs in improving energy efficiency include the green economy financing program and the operational program in environment and energy efficiency [
88,
89,
90,
91]. Hungary’s energy strategy is based on three pillars: becoming independent from Western energy companies, rebuilding and strengthening state-owned companies in the gas and liquid fuel sector and lowering electricity and gas prices, particularly for households. In the field of energy, Hungary works closely with Russia. The Russians also provided credit for 80 percent of the expansion of the nuclear power plant in Paks, which currently produces nearly 40 percent of electricity consumed in Hungary. The Hungarian economy is low-emission compared to the region, which results from the small share of coal in the energy mix (
Table 1). The current, binding energy strategy of Hungary with an outlook until 2030 was adopted in 2011. Hungary has determined the increase of RES in its energy mix in 2020–2030 only to be 20%. In addition, the reduction of CO
2 emissions in the power sector is to be largely based on nuclear energy—the fifth and sixth reactors at the Paks power plant are to be operational by 2027. Hungary plans to reduce GHG emissions in its national climate strategy by 52–85% by 2050, depending on available technologies.
In Slovakia, energy consumption has decreased by approx. 14% since 2002 [
92] as a result of implementing modern production and less energy-intense technologies. Although industry is the sector with the highest energy consumption, a certain decrease in energy intensity can be seen since 2009. The steady downward trend is visible for the housing sector (approx. 30%). On the other hand, energy consumption increased in the transport sector (by approx. 18%). The Slovak energy policy has several priority areas: increasing efficiency of the combined heat and power plants, reducing transmission and distribution losses (especially electricity, gas and heat), and improving the efficiency of electricity production from hydroelectric plants [
93]. In the housing sector, Slovakia focuses on information campaigns and legal regulations regarding energy performance for building components and equipment, including regular inspections of air conditioners and heating devices. Energy efficiency improvement assumption and goal is presented in the Energy Policy of the Slovak Republic [
57,
86]. The Slovak Government has declared its support for the EU’s goal of achieving climate neutrality by 2050 [
94]. Slovakia has committed to achieving an even balance of greenhouse gas emissions and absorption by 2050. According to the Government estimates, 82% of electricity produced in Slovakia in the near future will come from emission-free sources, mainly from nuclear power plants (e.g., from the new units in Mochovce) [
95,
96]. According to the Government plan, subsidies for the production of electricity from coal will end in 2023, and the last Slovak lignite mines will be shut down in 2027.
The planned dates for the termination of coal-based energy production in the V4 countries are presented in
Table 7.
2.3. The Structure of CO2 Emissions and Climate Policy of the Visegrad Group Countries
While the EU average of total annual CO2 emissions has fallen by a fifth since 1990, the pace of decarburisation between countries has varied. Over the past 30 years, Hungary has managed to reduce its emissions by 32%, the Czech Republic by 35%, and Poland by 13%.
Poland is one of the largest gas emitters in the EU. Poland ranks third in Europe in terms of CO2 emissions, and fifth in terms of all greenhouse gas emissions. By 2018, Poland had managed to reduce greenhouse gas (GHG) emissions by 13 percent compared to 1990 (the EU plan is 40%). According to Global Carbon Budget estimates from 2019, Poland ranks 20th in the world among the largest CO2 emitters—the highest among all the member states of the Visegrad Group. Poland’s CO2 emissions are estimated at 323 megatons of CO2. The Czech Republic came 43rd with 101 Mt CO2, then Slovakia which ranked 75th (33 MtCO2) and Hungary at the 57th place (49 MtCO2). The largest source of emissions is electricity which is responsible for a quarter of emissions in Poland, which is due to the large share of coal in energy production. In 2018, imports to Poland amounted to 19.3 million tons of coal, and a year later 14.9 million. The vast majority of the Polish energy sector (about 70%) is still based on coal. The biggest polluter in Europe is the Polish power plant Bełchatów, which emitted 38.2 megatons of CO2 in 2018 alone. Transport plays an increasingly infamous role, accounting for about 15% of emissions. Industry and processing each account for 8 percent in the emission structure. The actions taken in the country show that only the implementation of four flagship projects will possibly reduce greenhouse gas emissions by 42 percent. This means that the missing gap in relation to the EU target is between 2 and 9 percent. The aforementioned flagship projects cover areas that are still underway, due to the ongoing economic processes or e.g., the ongoing fight against smog in Poland. They include: a change in the electricity mix, transformation in heating, innovation in the industrial sector and electrification of transport. Poland already has emission reduction plans in most of these areas.
Based on the annual reports on CO2 emissions for 2020 from ETS participants, the total amount of CO2 emissions in Poland covered by the EU ETS in 2020 amounted to 172.15 million tons of CO2, including the aviation sector.
The total annual greenhouse gas emissions in the Czech Republic in 2018 were 129.39 million tons (in 2019, they were 131 million tons of CO2). The Czech emissions represent 3.5% of the total EU emissions and have decreased by almost 13% since 2005. It should be noted that the average reduction of emissions across the EU was 19% during the same period. Emissions in the energy sector amounted to 51.07 million tons of CO2 (39.5% of total emissions), in the transport sector 20.3 million tons of CO2 (15.7% of total emissions), emissions from industrial processes 16.26 million tons of CO2 (12.6% of total emissions), emissions from fossil fuel combustion for industry 9.96 million tons of CO2 (7.7% of total emissions), combustion in households, institutions and agriculture generated 13.15 million tons of CO2 (10.2% of total emissions), emissions from waste management 5.7 million tons of CO2 annually (4.4% of total emissions), agricultural emissions 8.61 million tons of CO2 (6.7% of total emissions).
The climate protection policy of the Czech Republic was adopted by the Czech Government in March 2017 and replaced the previous national program to mitigate the effects of climate change in the Czech Republic. The main goals presented in the document are as follows: the reduction of greenhouse gas emissions by 32 Mt CO2eq by 2020, compared to 2005 and the reduction of greenhouse gas emissions by 44 Mt CO2eq by 2030, compared to 2005. In terms of energy security, the target is to keep energy import dependency below 65% by 2030 and 70% by 2040 (nuclear fuel is considered an imported resource).
The Hungarian Parliament passed the Climate Protection Act in 2020. According to this document, Hungary will reduce its carbon dioxide emissions by at least 40 percent by 2030, compared to 1990 levels, and renewable energy will have accounted for at least 21 percent of consumed energy by then. In addition, Hungary is to be entirely climate neutral by 2050. The Hungarian Government has decided to pin its hopes on nuclear power (supplemented by increased photovoltaic capacity) to meet emission reduction targets and increase the rate of emission-free electricity production from the current 60 percent to 90 percent by 2030. Currently, it is to be investigated how low-carbon nuclear energy can be used to produce clean hydrogen. According to data from the EU Statistical Office, Hungarian emissions dropped by 0.8 percent in 2018 and amounted to about 1.4% of total EU CO2 emissions.
The emission of carbon dioxide from Hungary was 58 Mt CO
2eq in 2014 [
88] and 45.8 Mtoe CO
2eq in 2017 [
39]. Hungary reduced greenhouse gas emissions by 32% between 1990 and 2017, however, these emissions have been increasing. In 2020, Hungary generated 45.5 metric tons of carbon dioxide emissions. That was a drop by almost 4 percent, compared to 1990 levels. Greenhouse gas emissions have decreased significantly due to the transformation in the economic and energy sectors in reduced consumption of fossil fuels. It is energy industry (28%)—mainly heating, based on natural gas in 80%—and transport (26%) that are the most responsible for those emissions. Due to the high share of emissions from the transport sector, the National Transport Strategy was developed, focusing its activities on broadly understood mobility. It sets targets for increasing the number of transport means with low GHG emissions and obliges to increase the share of biofuels in the sector. It also indicates the need to share electricity and hydrogen sources in overall energy consumption. Hungary also uses ETS emissions trading systems, which are used to finance emission reduction support schemes [
48,
49].
Slovakia generated 35.9 Mt CO2 in 2019 (was 38.1 Mt CO2 in 2018). The sector with the largest CO2 emission was energy production, responsible for 50% of all emissions. The industry sector was responsible for 23%. A total 16% of emitted CO2 originated from transport, 7% of emissions resulted from agriculture and 4% from waste. By 2023, Slovak coal power plants and all lignite mines will have been shut down. Only one will be allowed to mine lignite for non-energy purposes.
The basic documents for the development of climate change mitigation policies are “Low-Emission Development Strategy of the Slovak Republic until 2030 with a Prospect to 2050” and the “Integrated National Energy Plan of Slovakia until 2030”. The low-emission development strategy of the Slovak Republic until 2030 with a prospect to 2050 was approved by the Government of the Slovak Republic in March 2020. The main objective of the document was to set the direction for achieving climate neutrality in the Slovak Republic by 2050. The strategy includes national emission reduction targets by 2030, based on European targets. These goals were specified in the integrated national energy plan of Slovakia until 2030: the share of RES 19.2% (EU targets 32%) and energy efficiency at 30.3% (EU targets 32.5%).
3. Summary
In 2020, the share of European electricity production from renewable sources increased to 38% (compared to 34.6% in 2019). Conversely, electricity generation from fossil fuels has fallen to 37%. It is undoubtedly an important moment in the European transformation to clean energy. Still, the pace of the energy transition is too slow to achieve a 55% reduction in greenhouse gas emissions by 2030 and climate neutrality by 2050. Unfortunately, according to new data from the Ministry of Energy, Poland will not achieve the expected share of renewable energy in 2020. The share of renewable energy sources in energy consumption in 2018 was 11.4%, and in 2019 it was 12.1%. The national target for 2020 was 15%. The share of RES in Poland in 2020 was 13.8% instead of 15%. In 2019, the share of the Czech Republic in RES was 16.2% (the national target for 2020 was 13%), Hungary had 12.6% (the target was 13%) and Slovakia achieved 16.9% (the target was 14%).
This means that Poland only keeps emissions at the bottom of the target. Of the 28 EU countries, only 12 have reached the national target for the distribution of renewable energy sources by the end of the energy supply set for 2020 [
89].
The policies and actions currently described in the National Forecast are insufficient to achieve the steps needed to reach the EU’s target of at least 40% reduction by 2030. Depending on the existing actions in the country [
89], this problem will be mitigated by 26% from 2020, and 30% until 2030. To comply with the Paris Agreement, the EU will have to exceed the 32% renewable energy rate by 2030. This would increase the RES energy surplus to 55%, as the share of renewable energy is up to 59%. By 2030—75%, by 2050, the total decarbonization will be achieved [
93]. Renewable energy accounts for 17% of total energy consumption in the EU-28, with a target of 20%.
In November 2018, the European Commission stated the European climate strategy for 2050 titled “A Clean Planet for All.” These EU Member States have adopted or offered long-term abandonment strategies. All EU Member States should prepare and report on a long-term strategy with a vision of at least 30 years [
97].
The EU ambition concerning mitigation has been relatively limited, mainly due to the group of Central and Eastern European EU member states led by Poland, and the Visegrad Group [
15]. The EU’s GHG emission reduction target for 2030 is 40%. It was constituted based on INDC and was agreed upon in October 2014; however, the Visegrad Group was against more ambitious targets. It is worth saying that it is not ambitious enough to keep the world on a pathway below a 2 °C temperature increase. The EU is trying to force other developed countries to make ambitious commitments on climate change mitigation after 2020 [
98,
99].
The development of the European Union’s climate and energy policy in 2018 means that the EU can gain the EU’s global leadership position in negotiations on climate action. The currently implemented climate action level is not yet compatible with the Paris Agreement’s 1.5 °C limits. The European Parliament has called for increasing the EU’s INDC emissions 2030 reduction goal to 55% below 1990 levels. Achieving this would need to build on the reform of the EU ETS, the adoption of the Energy Performance of Buildings Directive (EPBD), and the political agreement on increasing renewable energy and energy efficiency targets for 2030 [
93].
The recent disagreements between Poland and Hungary by the Visegrad Group on the EU’s energy and climate agenda are a good sign (on Russia). Divided, the association can hardly thwart major environmental policies. In particular, Poland will be more difficult to defend against as a coal miner that does not meet EU energy and climate targets. Suppose the EU and its negotiating members succeed in exploiting this dangerous alliance. In this case, this could bring the association closer to the winter solstice under the Paris Agreement [
93].
In summary, three of the Visegrad Group (except Poland) countries meet the commitments made in reducing carbon dioxide emissions. The consequence of failing to meet these commitments is rising emissions trading costs, energy costs and production costs (closure of production facilities or temporary shutdown of production, for example, Huta Kraków) [
100].
4. Conclusions
In 2021, the Visegrad Group celebrates its 30th anniversary. The group has included the Czech Republic, Poland, Slovakia and Hungary since 1 January 1993, following the break-up of Czechoslovakia. Its members are linked by neighbourhood and similar geopolitical conditions. The keynote of establishing the group was cooperation on strengthening the processes of democratic transformations of state structures and building a free market economy, so that in the longer term it would be possible to achieve the goal of European and Atlantic integration (all V4 countries have been members of the European Union and NATO since 2004 and 1997, respectively). Currently, the Visegrad Group is a forum for exchanging experiences and working out common positions on issues important for the future of the region and the EU. In 2015, almost 200 countries decided to conclude a global agreement (the Paris Agreement) to combat global warming. This agreement was also signed by the countries of the Visegrad Group. For Poland, whose energy sector is based primarily on coal, any provisions regarding the reduction of CO2 emissions are a big challenge.
The manuscript presents the situation of the energy sector of the Visegrad Group countries in recent years. The climate and energy policy in recent years was analysed, as well as the plans of the V4 countries in the context of the European Union’s climate goals for 2020, 2030 and 2050. The level of energy efficiency, the structure of the shares of individual energy carriers, the share of renewable energy sources and the emission of carbon dioxide have been analyzed in detail and in many ways.
Slovakia, the Czech Republic and Hungary are countries that have already achieved the level of emission reductions required by the convention (compared to the reference year) and can contribute to the achievement of the EU target. Only Poland would keep its emissions below the target. It should be emphasized that Poland has ratified four international agreements on climate protection: the Climate Convention of 1994, and the Kyoto Protocol of 2002. In 2016, it also ratified the Paris Agreement, and in 2018, an amendment to the Kyoto Protocol, which expires after 2020. In the last two, Poland undertook to meet the reduction targets together with the EU.
The following list contains a collection of the most important names used in the manuscript, along with the corresponding symbols (
Table 8).


 ,
, 


