An Examination of the Safety Impacts of Bus Priority Routes in Major Israeli Cities


Abstract
1. Introduction
1.1. Previous Research Findings on the Safety Impacts of BPRs
1.2. The Current Study Motivation
2. Materials and Methods
2.1. The Study Framework
2.2. The Study Cases and Data
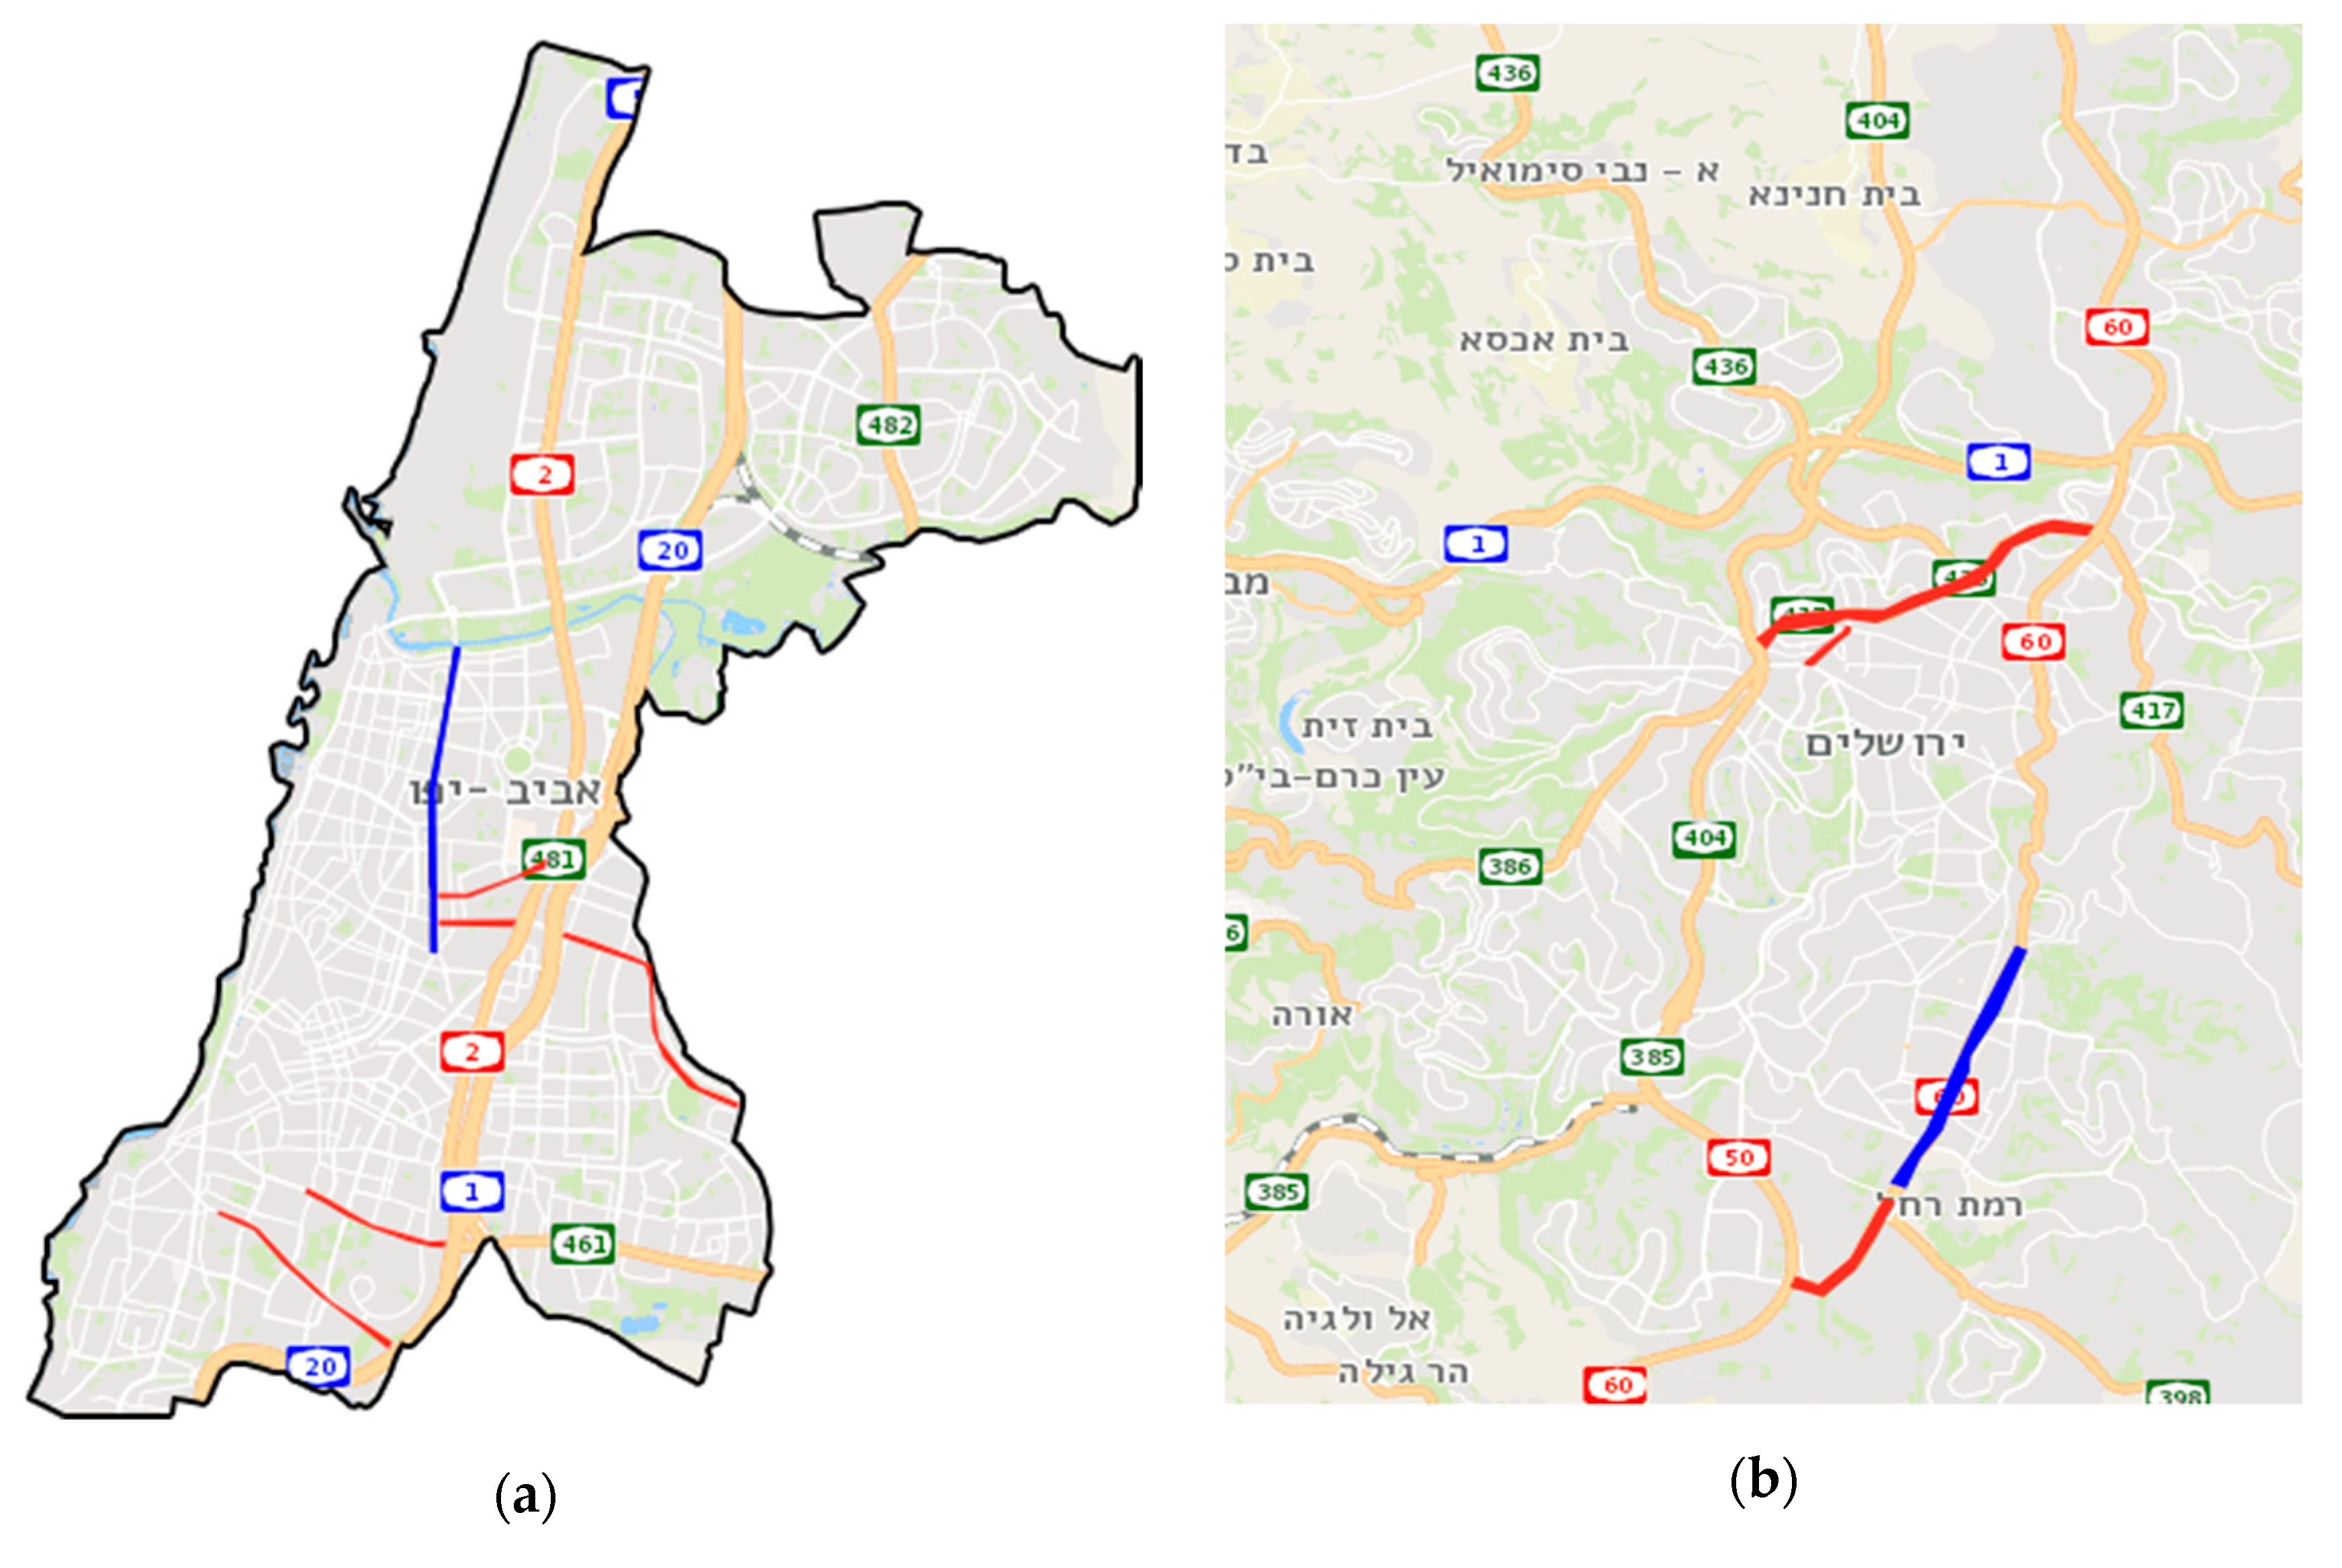
2.2.1. A BPR in Tel Aviv: Ibn Gvirol Street
2.2.2. A BPR in Jerusalem: Hebron Road
2.2.3. BPRs in Haifa
2.3. Crash Analyses
3. Results
3.1. The BPR in Tel Aviv
3.2. The BPR in Jerusalem
3.3. The BPRs in Haifa
4. Discussion
5. Conclusions
Author Contributions
Funding
Acknowledgments
Conflicts of Interest
Appendix A


References
- United Nations. 2018 Revision of World Urbanization Prospects. Available online: https://www.un.org/development/desa/en/news/population/2018-revision-of-world-urbanization-prospects.html (accessed on 25 May 2020).
- United Nations. World Urbanization Prospects: The 2018 Revision (ST/ESA/SER.A/420); Department of Economic and Social Affairs, Population Division; United Nations: New York, NY, USA, 2018. [Google Scholar]
- Paganelli, F. Urban Mobility and Transportation. In Sustainable Cities and Communities; Filho, W.L., Azul, A.M., Brandli, L., Eds.; Encyclopedia of the UN Sustainable Development Goals; Springer International Publishing: Cham, Switzerland, 2020; pp. 887–899. [Google Scholar]
- UITP. Statistics Brief, Urban Public Transport in the 21st Century; The International Association of Public Transport (UITP): Brussels, Belgium, 2017. [Google Scholar]
- Rupprecht Consult. Guidelines for Developing and Implementing a Sustainable Urban Mobility Plan, 2nd ed.; Forschung, B.G., Ed.; Rupprecht Consult: Cologne, Germany, 2019. [Google Scholar]
- Winters, M.; Buehler, R.; Götschi, T. Policies to Promote Active Travel: Evidence from Reviews of the Literature. Curr. Environ. Health Rep. 2017, 4, 278–285. [Google Scholar] [CrossRef] [PubMed]
- Steg, L. Can public transport compete with the private car? IATSS Res. 2003, 27, 27–35. [Google Scholar] [CrossRef]
- Moura, F.; Kalakou, S. Active Modes and Sustainability. In Encyclopedia of the UN Sustainable Development Goals; Springer Science and Business Media LLC: Cham, Switzerland, 2019; pp. 1–17. [Google Scholar]
- Martens, K. Basing Transport Planning on Principles of Social Justice. Berkeley Plan. J. 2011, 19. [Google Scholar] [CrossRef]
- Litman, T. Evaluating Transportation Equity: Guidance for Incorporating Distributional Impacts into Transport Planning. Victoria Transport Policy Institute. 2007. Available online: http://www.vtpi.org/equity.pdf.L (accessed on 25 May 2020).
- Nahmias-Biran, B.-H.; Martens, K.; Shiftan, Y. Integrating equity in transportation project assessment: A philosophical exploration and its practical implications. Transp. Rev. 2017, 37, 192–210. [Google Scholar] [CrossRef]
- EC. Traffic Safety Facts on Heavy Goods Vehicles and Buses; European Commission (EC): Brussels, Belgium, 2016. [Google Scholar]
- Litman, T. A New Transit Safety Narrative. J. Public Transp. 2014, 17, 114–135. [Google Scholar] [CrossRef]
- Temurhan, M.; Stipdonk, H. Coaches and road safety in Europe. In An Indication Based On Available Data 2007–2016; Report R-2019-11; SWOV Institute of Road Safety Research: Hague, The Netherlands, 2019. [Google Scholar]
- RSA. The Relationship between Public Transport Use and Road Safety: The Situation in Israel and Solutions for Improving the Safety of Vulnerable Road Users; Road Safety Authority (RSA): Jerusalem, Israel, 2016. [Google Scholar]
- Stimpson, J.P.; Wilson, F.A.; Araz, O.M.; Pagán, J.A. Share of Mass Transit Miles Traveled and Reduced Motor Vehicle Fatalities in Major Cities of the United States. J. Hered. 2014, 91, 1136–1143. [Google Scholar] [CrossRef]
- Viegas, J.M.; Lu, B. Widening the scope for bus priority with intermittent bus lanes. Transp. Plan. Technol. 2001, 24, 87–110. [Google Scholar] [CrossRef]
- ITDP. Bus Rapid Transit Planning Guide; Institute for Transportation & Development Policy (ITDP): New York, NY, USA, 2007. [Google Scholar]
- Panera, M.; Shin, H.; Zerkin, A.; Zimmerman, S. Peer-to-Peer Information Exchange on Bus Rapid Transit and Bus Priority Practices; FTA Report 009; Federal Transit Administration, US Department of Transportation: Washington, DC, USA, 2012. [Google Scholar]
- Duduta, N.; Adriazola, C.; Hidalgo, D.; Lindau, L.A.; Jaffe, R. Traffic safety in surface public transport systems: A synthesis of research. Public Transp. 2014, 7, 121–137. [Google Scholar] [CrossRef]
- Hidalgo, D.; Pereira, L.; Estupiñán, N.; Jiménez, P.L. TransMilenio BRT system in Bogota, high performance and positive impact—Main results of an ex-post evaluation. Res. Transp. Econ. 2013, 39, 133–138. [Google Scholar] [CrossRef]
- Dadashzadeh, N.; Ergun, M. Spatial bus priority schemes, implementation challenges and needs: An overview and directions for future studies. Public Transp. 2018, 10, 545–570. [Google Scholar] [CrossRef]
- Azadpeyma, A.; Kashi, E. Level of Service Analysis for Metro Station with Transit Cooperative Research Program (TCRP) Manual: A Case Study—Shohada Station in Iran. Urban Rail Transit 2018, 5, 39–47. [Google Scholar] [CrossRef]
- Levinson, H.; Zimmerman, S.; Clinger, J.; Rutherford, S.; Smith, R.; Cracknell, J.; Soberman, R. Transportation Research Board Bus Rapid Transit, Volume 1: Case Studies in Bus Rapid Transit. 2003. Available online: https://nacto.org/docs/usdg/tcrp_rpt_90_case_studies_volume_1_levinson.pdf (accessed on 20 August 2018).
- Duduta, N.; Adriazola, C.; Hidalgo, D.; Lindau, L.A.; Jaffe, R. Understanding Road Safety Impact of High-Performance Bus Rapid Transit and Busway Design Features. Transp. Res. Rec. J. Transp. Res. Board 2012, 2317, 8–14. [Google Scholar] [CrossRef]
- Goh, K.C.K.; Currie, G.; Sarvi, M.; Logan, D. Bus accident analysis of routes with/without bus priority. Accid. Anal. Prev. 2014, 65, 18–27. [Google Scholar] [CrossRef] [PubMed]
- Tse, L.Y.; Hung, W.T.; Sumalee, A. Bus lane safety implications: A case study in Hong Kong. Transp. A Transp. Sci. 2012, 10, 140–159. [Google Scholar] [CrossRef]
- Duduta, N.; Adriazola-Steli, K.; Wass, C.; Hidlago, D.; Lindau, L.-A.; John, V.-S. Traffic safety on bus priority systems. In Recommendations for Integrating Safety into the Planning, Design and Operation of Major Bus Routes; World Resources Institute: Washington, DC, USA, 2014. [Google Scholar]
- Ingvardson, J.B.; Nielsen, O.A. Effects of new bus and rail rapid transit systems: An international review. Transp. Rev. 2018, 38, 96–116. [Google Scholar] [CrossRef]
- Vecino-Ortiz, A.I.; Hyder, A.A. Road Safety Effects of Bus Rapid Transit (BRT) Systems: A Call for Evidence. J. Hered. 2015, 92, 940–946. [Google Scholar] [CrossRef]
- Bocarejo, J.P.; Velasquez, J.M.; Diaz, C.A.; Tafur, L.E. Impact of BRT systems on road safety: Lessons from Bogota. Transp. Res. Rec. 2012, 2317, 1–7. [Google Scholar] [CrossRef]
- Goh, K.C.K.; Currie, G.; Sarvi, M.; Logan, D. Road Safety Benefits from Bus Priority. Transp. Res. Rec. J. Transp. Res. Board 2013, 2352, 41–49. [Google Scholar] [CrossRef]
- Goh, K.C.K.; Currie, G.; Sarvi, M.; Logan, D. Experimental Microsimulation Modeling of Road Safety Impacts of Bus Priority. Transp. Res. Rec. J. Transp. Res. Board 2014, 2402, 9–18. [Google Scholar] [CrossRef]
- Naznin, F.; Currie, G.; Logan, D. Exploring the impacts of factors contributing to tram-involved serious injury crashes on Melbourne tram routes. Accid. Anal. Prev. 2016, 94, 238–244. [Google Scholar] [CrossRef]
- Naznin, F.; Currie, G.; Logan, D.; Sarvi, M. Application of a random effects negative binomial model to examine tram-involved crash frequency on route sections in Melbourne, Australia. Accid. Anal. Prev. 2016, 92, 15–21. [Google Scholar] [CrossRef]
- Naznin, F.; Currie, G.; Sarvi, M.; Logan, D. An Empirical Bayes Safety Evaluation of Tram/Streetcar Signal and Lane Priority Measures in Melbourne. Traffic Inj. Prev. 2015, 17, 91–97. [Google Scholar] [CrossRef]
- Guadamuz, R.; Gayah, V.V.; Paleti, R. Impact of Bus Routes on Crash Frequency in Metropolitan Areas. Transp. Res. Rec. J. Transp. Res. Board 2020, 2674, 305–316. [Google Scholar] [CrossRef]
- Bezerra, B.S.; Kaiser, I.M.; Battistelle, R.A.G. Road safety implications for sustainable development in Latin America. Latin Am. J. Manag. Sustain. Dev. 2015, 2, 1–18. [Google Scholar] [CrossRef]
- Gitelman, V.; Carmel, R.; Doveh, E.; Hakkert, S. Exploring safety impacts of pedestrian-crossing configurations at signalized junctions on urban roads with public transport routes. Int. J. Inj. Control. Saf. Promot. 2017, 25, 31–40. [Google Scholar] [CrossRef]
- Chen, L.; Chen, C.; Ewing, R.; McKnight, C.E.; Srinivasan, R.; Roe, M. Safety countermeasures and crash reduction in New York City—Experience and lessons learned. Accid. Anal. Prev. 2013, 50, 312–322. [Google Scholar] [CrossRef]
- Shahla, F.; Shalaby, A.S.; Persaud, B.N.; Hadayeghi, A. Analysis of Transit Safety at Signalized Intersections in Toronto, Ontario, Canada. Transp. Res. Rec. J. Transp. Res. Board 2009, 2102, 108–114. [Google Scholar] [CrossRef]
- Song, Y.; Noyce, D. Assessing Effects of Transit Signal Priority on Traffic Safety: Empirical Bayes Before–After Study using King County, Washington, Data. Transp. Res. Rec. J. Transp. Res. Board 2018, 2672, 10–18. [Google Scholar] [CrossRef]
- Gitelman, V.; Carmel, R.; Korchatov, A. Assessing Safety Implications of Bus Priority Systems: A Case-Study of a New BRT System in the Haifa Metropolitan Area. Adv. Trans. Policy Plan. 2018, 1, 63–91. [Google Scholar] [CrossRef]
- Elvik, R.; Hoya, A.; Vaa, T.; Sorensen, M. The Handbook of Road Safety Measures, 2nd ed.; Emerald: Bingley, UK, 2009. [Google Scholar]
- Griffith, M.S. Statistical analysis techniques. In Statistical Evaluation in Traffic Safety Studies; Publication No IR-097; Institute of Transportation Engineers: Washington, DC, USA, 1999. [Google Scholar]
- Gitelman, V.; Carmel, R.; Pesahov, F. The evaluation of safety efficiency of non-urban infrastructure improvements; a case-study. Eur. Transp. Res. Rev. 2014, 6, 477–491. [Google Scholar] [CrossRef]
- Kou, S.G.; Ying, Z. Asymptotics for a 2 × 2 table with fixed margins. Stat. Sin. 1996, 6, 809–829. [Google Scholar]
- NACTO. Urban Street Design Guide; Island Press: Washington, DC, USA, 2013. [Google Scholar]
- Welle, B.; Liu, Q.; Li, W.; Adriazola-Steil, C.; King, R.; Sarmiento, C.; Obelheiro, M. Cities safer by design. In Guidance and Examples to Promote Traffic Safety through Urban and Street Design; World Resources Institute: Washington, DC, USA, 2015. [Google Scholar]
- Adminaité-Fodor, D.; Jost, G. Safer roads, safer cities: How to improve urban road safety in the EU. In PIN Flash Report 37; European Transport Safety Council: Brussels, Belgium, 2019. [Google Scholar]


| a—Ibn Gvirol Street, Tel Aviv | |||||||||
| Sites *, Hours | Period | On Road Sections | At Intersections | ||||||
| Injury Crashes | Severe Crashes | Pedestrian Crashes | Bus Crashes | Injury Crashes | Severe Crashes | Pedestrian Crashes | Bus Crashes | ||
| With BPR, 6:30–10 | before | 11 | 2 (18%) | 5 (45%) | 1 (9%) | 19 | 1 (5%) | 3 (16%) | 2 (2%) |
| after | 7 | 1 (14%) | 4 (57%) | 1 (14%) | 16 | 3 (19%) | 5 (31%) | 3 (19%) | |
| With BPR, 14–19 | before | 23 | 1 (4%) | 5 (22%) | 1 (4%) | 40 | 1 (3%) | 9 (23%) | 5 (13%) |
| after | 17 | 5 (29%) | 5 (29%) | 2 (12%) | 18 | 3 (17%) | 9 (50%) | 0 | |
| Comparison 1, 6:30–10 | before | 19 | 0 | 4 (21%) | 1 (5%) | 63 | 6 (10%) | 8 (13%) | 5 (8%) |
| after | 9 | 1 (11%) | 2 (22%) | 2 (22%) | 29 | 3 (10%) | 6 (21%) | 1 (3%) | |
| Comparison 1, 14–19 | before | 39 | 1 (3%) | 6 (15%) | 0 | 120 | 8 (7%) | 9 (8%) | 4 (3%) |
| after | 24 | 5 (21%) | 7 (29%) | 1 (4%) | 56 | 4 (7%) | 9 (16%) | 3 (5%) | |
| Comparison 1, other hours | before | 97 | 3 (3%) | 16 (16%) | 2 (2%) | 291 | 18 (6%) | 48 (16%) | 15 (5%) |
| after | 57 | 8 (14%) | 27 (47%) | 3 (5%) | 149 | 13 (9%) | 27 (18%) | 10 (7%) | |
| Comparison 2, btw 10–14 | before | 21 | 2 (10%) | 6 (29%) | 0 | 39 | 4 (10%) | 19 (49%) | 4 (10%) |
| after | 18 | 2 (11%) | 9 (50%) | 2 (11%) | 17 | 3 (18%) | 8 (47%) | 1 (6%) | |
| b—Hebron Road, Jerusalem | |||||||||
| Sites | Period | On Road Sections | At Intersections | ||||||
| Injury Crashes | Severe Crashes | Pedestrian Crashes | Bus Crashes | Injury Crashes | Severe Crashes | Pedestrian Crashes | Bus Crashes | ||
| With BPR | after 1 | 50 | 13 (26%) | 13 (26%) | 10 (20%) | 198 | 25 (13%) | 39 (20%) | 27 (14%) |
| after 2 | 59 | 12 (20%) | 14 (24%) | 12 (20%) | 123 | 11 (9%) | 33 (27%) | 22 (18%) | |
| Comparison-group | after 1 | 65 | 10 (16%) | 16 (25%) | 7 (11%) | 270 | 20 (7%) | 44 (16%) | 22 (8%) |
| after 2 | 60 | 15 (25%) | 19 (32%) | 12 (20%) | 219 | 23 (11%) | 48 (22%) | 36 (16%) | |
| c—Streets with BPRs, Haifa | |||||||||
| BPR Configuration | Period | On Road Sections | At Intersections | ||||||
| Injury Crashes | Severe Crashes | Pedestrian Crashes | Bus Crashes | Injury Crashes | Severe Crashes | Pedestrian Crashes | Bus Crashes | ||
| Center-lane BPR near two lanes | before | 167 | 32 (19%) | 41 (25%) | 4 (2%) | 254 | 26 (10%) | 35 (14%) | 3 (1%) |
| after # | 36 | 7 (19%) | 9 (25%) | 3 (8%) | 160 | 11 (7%) | 26 (16%) | 13 (8%) | |
| Center-lane BPR near one lane | before | 22 | 6 (27%) | 11 (50%) | 0 | 27 | 2 (7%) | 11 (41%) | 1 (4%) |
| after # | 3 | 1 (33%) | 0 | 1 (33%) | 7 | 0 | 3 (43%) | 0 | |
| Curbside BPR | before | 13 | 5 (38%) | 2 (15%) | 1 (8%) | 60 | 10 (17%) | 10 (17%) | 0 |
| after # | 24 | 3 (13%) | 6 (25%) | 0 | 65 | 7 (11%) | 15 (23%) | 2 (3%) | |
| Comparison: Sites, Hours | Crash Type | Mean Effect | 95% Confidence Interval | Meaning | |
|---|---|---|---|---|---|
| With BPR, morning * vs. Comparison-group 1, morning * | Total injury, on sections | +34% | −61% | +362% | IT |
| Total injury, at junctions | +83% | −18% | +306% | IT | |
| Pedestrian, at junctions | +122% | −63% | +1218% | IT | |
| With BPR, evening * vs. Comparison-group 1, evening * | Total injury, on sections | +20% | −46% | +169% | IT |
| Total injury, at junctions | −4% | −49% | +83% | No change | |
| Pedestrian, at junctions | 0% | −73% | +269% | No change | |
| With BPR, all * vs. Comparison-group 1, all * | Total injury, on sections | +24% | −37% | +144% | IT |
| Total injury, at junctions | +24% | −24% | +103% | IT | |
| Pedestrian, at junctions | +32% | −53% | +273% | IT | |
| With BPR, all * vs. Comparison-group 1, other hours | Total injury, on sections | +20% | −35% | +123% | IT |
| Total injury, at junctions | +13% | −29% | +79% | IT | |
| Pedestrian, at junctions | +107% | −16% | +412% | IT | |
| With BPR, morning * vs. Comparison-group 2 | Total injury, on sections | −26% | −76% | +132% | DT |
| Total injury, at junctions | +93% | −20% | +364% | IT | |
| Pedestrian, at junctions | +296% | −24% | +1966% | IT | |
| With BPR, evening * vs. Comparison-group 2 | Total injury, on sections | −14% | −65% | +110% | DT |
| Total injury, at junctions | +3% | −53% | +129% | No change | |
| Pedestrian, at junctions | +138% | −31% | +720% | IT | |
| After Period 1 (6 Years) | After Period 2 (5 Years) | |||||||||||
|---|---|---|---|---|---|---|---|---|---|---|---|---|
| On Road Sections | At Intersections | On Road Sections | At Intersections | |||||||||
| Sites | Injury Crashes | Pedestrian Crashes | Bus Crashes | Injury Crashes | Pedestrian Crashes | Bus Crashes | Injury Crashes | Pedestrian Crashes | Bus Crashes | Injury Crashes | Pedestrian Crashes | Bus Crashes |
| With BPR * | 18.8 | 4.9 | 3.8 | 15.2 | 3.0 | 2.1 | 22.2 | 5.3 | 4.5 | 9.5 | 2.5 | 1.7 |
| Comparison-group ** | 8.3 | 2.0 | 0.9 | 6.8 | 1.1 | 0.6 | 7.6 | 2.4 | 1.5 | 5.5 | 1.2 | 0.9 |
| Differences (p-value) | <0.01 | 0.03 | 0.01 | <0.01 | <0.01 | <0.01 | <0.01 | 0.03 | 0.01 | <0.01 | <0.01 | 0.02 |
| 2 Years * | 3 Years * | 3.5 Years * | ||||
|---|---|---|---|---|---|---|
| Crash Type | Mean Effect | Mean Effect | Mean Effect | 95% Confidence Interval # | Meaning # | |
| Center-lane BPR near two lanes | ||||||
| Severe crashes, on sections | +14% | −33% | −29% | −74% | +98% | DT |
| Total injury crashes, on sections | −24% | −38% | −38% | −60% | −4% | Decrease |
| Pedestrian crashes, on sections | −39% | −48% | −54% | −82% | +17% | DT |
| Severe crashes, at junctions | +14% | −19% | +3% | −63% | +188% | No change |
| Total injury crashes, at junctions | +34% | +18% | +15% | −9% | +44% | IT |
| Pedestrian crashes, at junctions | +136% | +81% | +33% | −42% | +205% | IT |
| Bus crashes, at junctions | +135% | +72% | +73% | −60% | +641% | IT |
| Center-lane BPR near one lane | ||||||
| Total injury crashes, on sections | −70% | −78% | −81% | −97% | +27% | DT |
| Pedestrian crashes, on sections | −93% | −96% | −96% | −100% | +88% | DT |
| Total injury crashes, at junctions | −32% | −47% | −48% | −78% | +23% | DT |
| Pedestrian crashes, at junctions | +52% | 0% | −16% | −82% | +284% | DT |
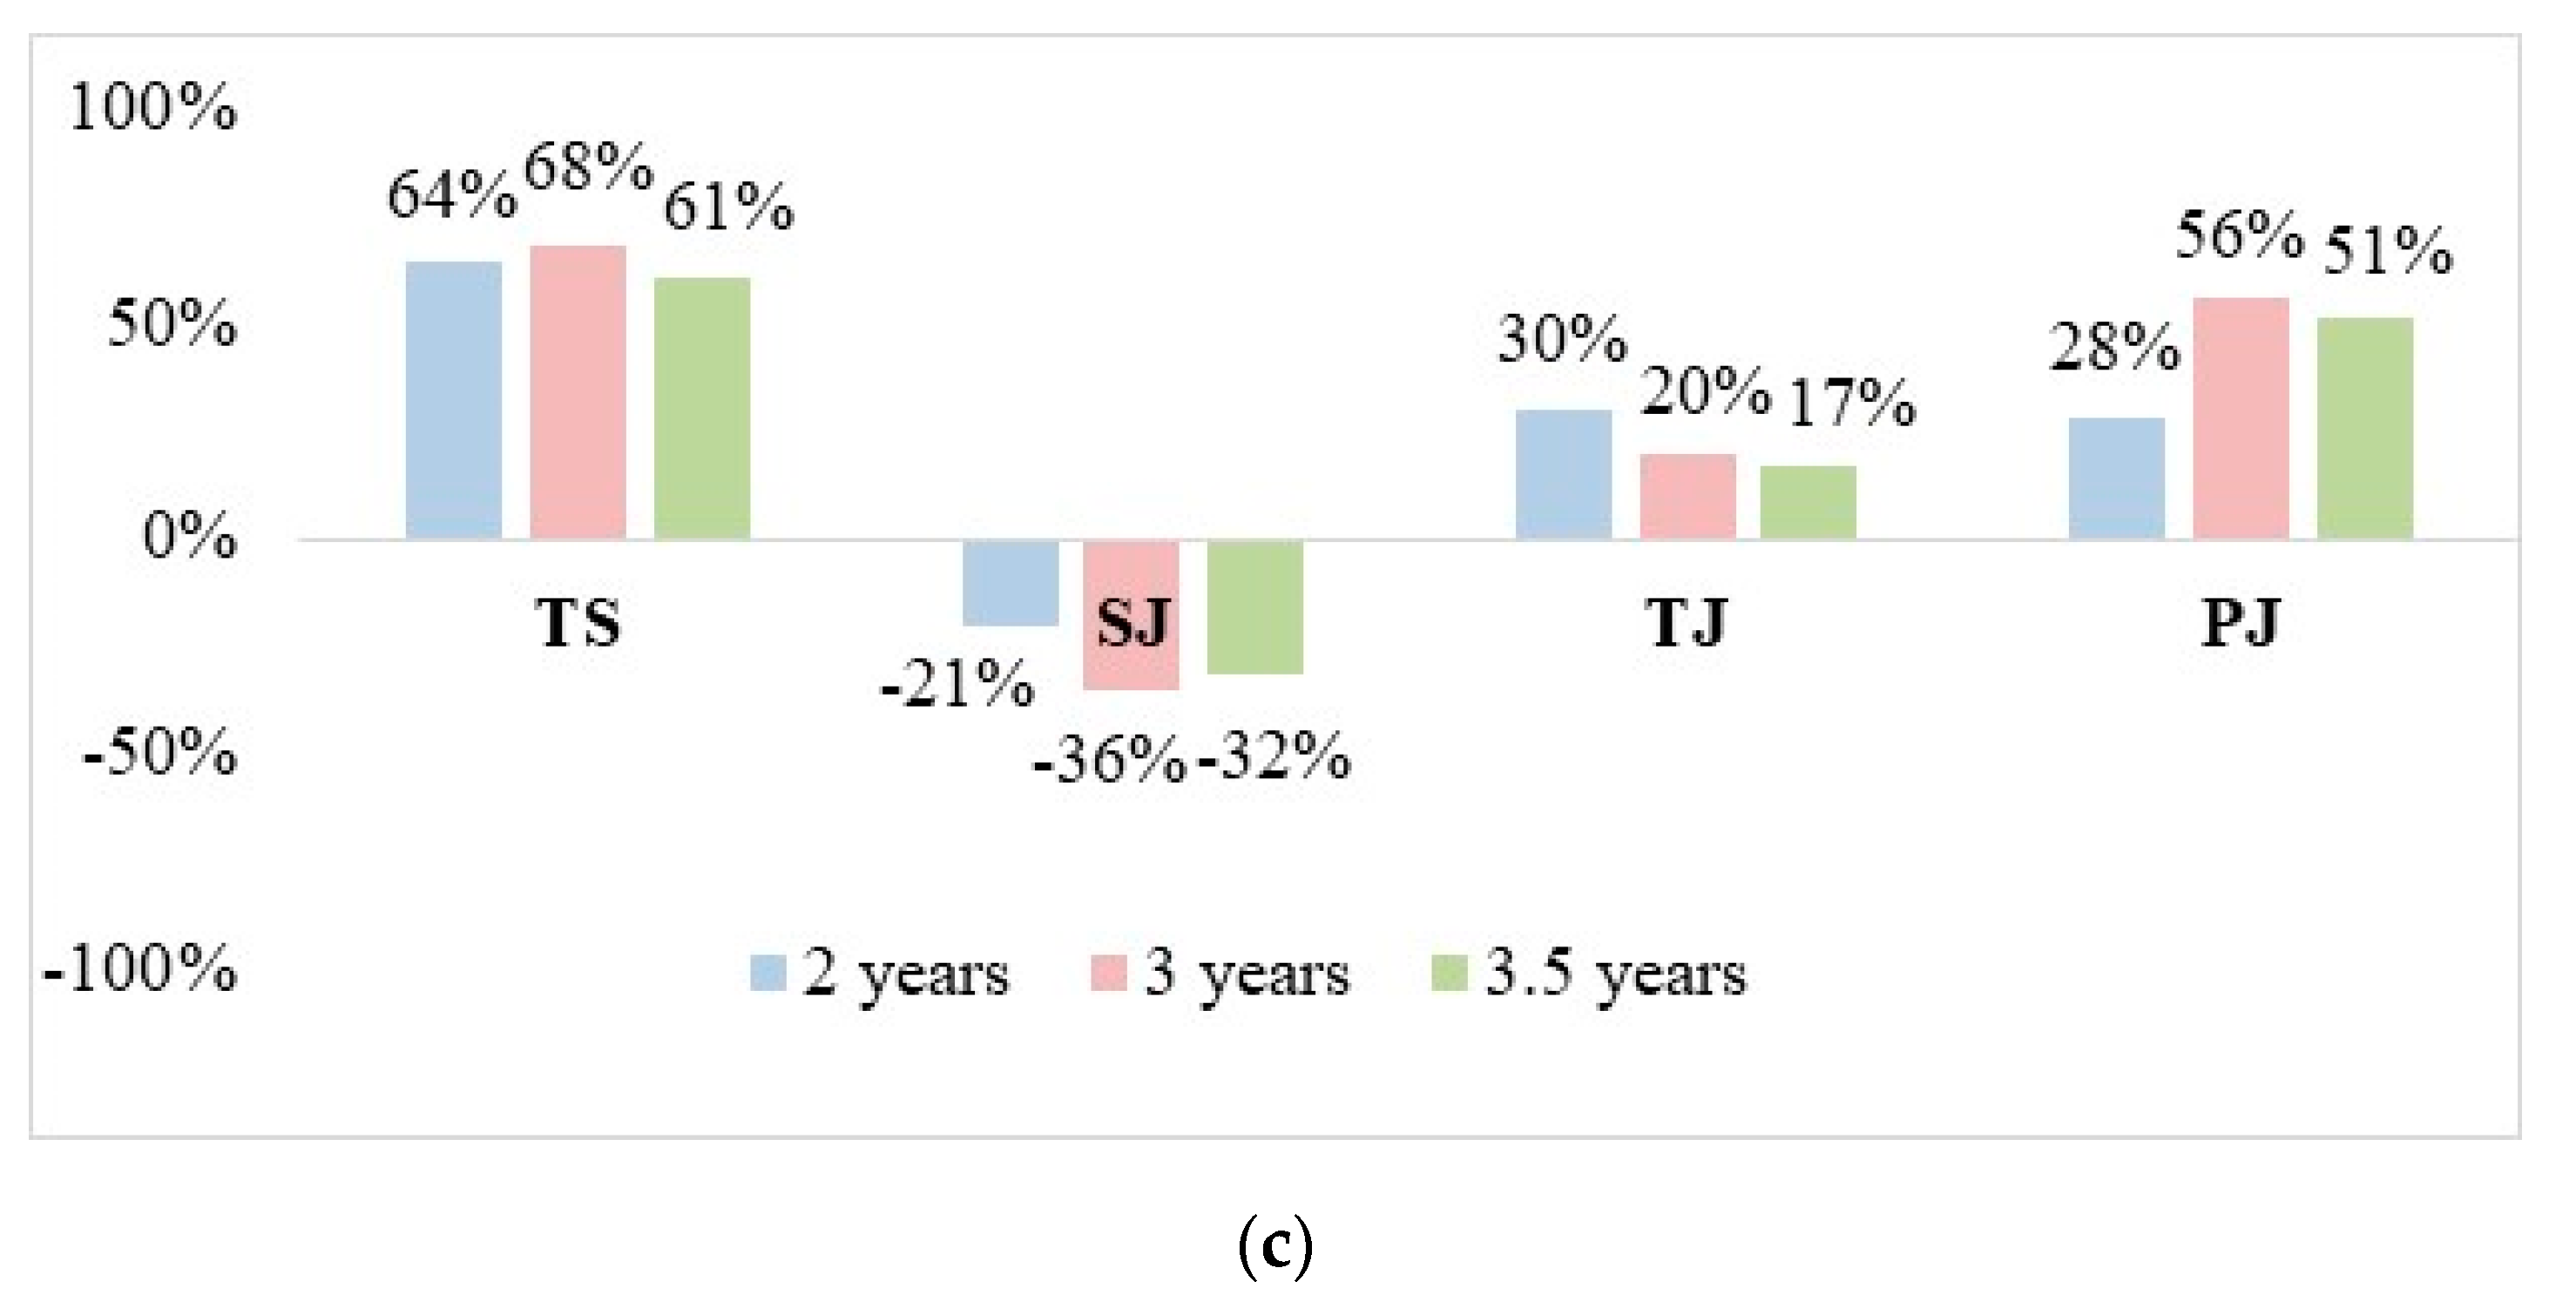
| Curbside BPR | ||||||
| Total injury crashes, on sections | +64% | +68% | +61% | −19% | +218% | IT |
| Severe crashes, at junctions | −21% | −36% | −32% | −76% | +94% | DT |
| Total injury crashes, at junctions | +30% | +20% | +17% | −19% | +69% | IT |
| Pedestrian crashes, at junctions | +28% | +56% | +51% | −35% | +251% | IT |
Publisher’s Note: MDPI stays neutral with regard to jurisdictional claims in published maps and institutional affiliations. |
© 2020 by the authors. Licensee MDPI, Basel, Switzerland. This article is an open access article distributed under the terms and conditions of the Creative Commons Attribution (CC BY) license (http://creativecommons.org/licenses/by/4.0/).
Share and Cite
Gitelman, V.; Korchatov, A.; Elias, W. An Examination of the Safety Impacts of Bus Priority Routes in Major Israeli Cities. Sustainability 2020, 12, 8617. https://doi.org/10.3390/su12208617
Gitelman V, Korchatov A, Elias W. An Examination of the Safety Impacts of Bus Priority Routes in Major Israeli Cities. Sustainability. 2020; 12(20):8617. https://doi.org/10.3390/su12208617
Chicago/Turabian StyleGitelman, Victoria, Anna Korchatov, and Wafa Elias. 2020. "An Examination of the Safety Impacts of Bus Priority Routes in Major Israeli Cities" Sustainability 12, no. 20: 8617. https://doi.org/10.3390/su12208617
APA StyleGitelman, V., Korchatov, A., & Elias, W. (2020). An Examination of the Safety Impacts of Bus Priority Routes in Major Israeli Cities. Sustainability, 12(20), 8617. https://doi.org/10.3390/su12208617