1. Introduction
Ecosystem services (ES) are defined as services provided by nature that directly and indirectly benefit the well-being of humans. The concept of ES has been developed in the scientific literature since the end of the 1970s [
1], and the Millennium Ecosystem Assessment (MEA) report 2005 [
2] is considered the milestone in the field of mapping ES. The MEA report evaluated the impacts on human beings as the consequences of changes in the ecosystem. The core finding of the MEA report is that human activities are depleting the Earth’s natural resources, which is inducing stress on the self-sustaining capability of the natural environment. This phenomenon urges immediate measures for checking and prevention in order to enhance the sustainability of ecosystems for future generations.
To meet the requirements of a globally increasing population for food, shelter, timber, etc., land use changes are occurring but at the expense of a degraded environment and ecosystems. Land use and land cover (LULC) change is considered the major factor for the degradation of ES and loss in biodiversity [
3,
4]. Climate change is another factor impacting natural systems, and ultimately affects the flow of ES [
5]. With the increasingly evident effects of climate change, which is especially impacting developing countries [
6,
7,
8], the challenge to attain sustainable economic development goals while preserving the natural resources and ES is getting more difficult [
9]. ES have significance in both developed and developing nations. However, as the livelihood of people in developing nations is highly dependent on them, the risk of ES losses is high in developing nations. In addition, developing nations are more prone to the impacts of climate change. In this scenario, identifying where ES originate and to whom the benefits flow under current and future climate conditions is critical information [
9].
Land cover refers to the biophysical attributes of Earth’s surface such as water, soil, vegetation, etc. It refers to human purposes or intents applied to these attributes such as building construction, forestry, etc. [
10]. Changes in LULC is a substantial phenomenon and is occurring globally since time immemorial [
11]. Urbanization is necessary for regional economic growth [
12] and is one of the most important drivers of change worldwide [
13]. The recent decade has seen a major increase in the rate of worldwide urbanization. As per the 2011 census of the Central Bureau of Statistics of Nepal, the urban population has increased to 17% in 2011 from 2.9% in 1952/1954 [
14]. Recorded among the fastest urbanizing countries of the world [
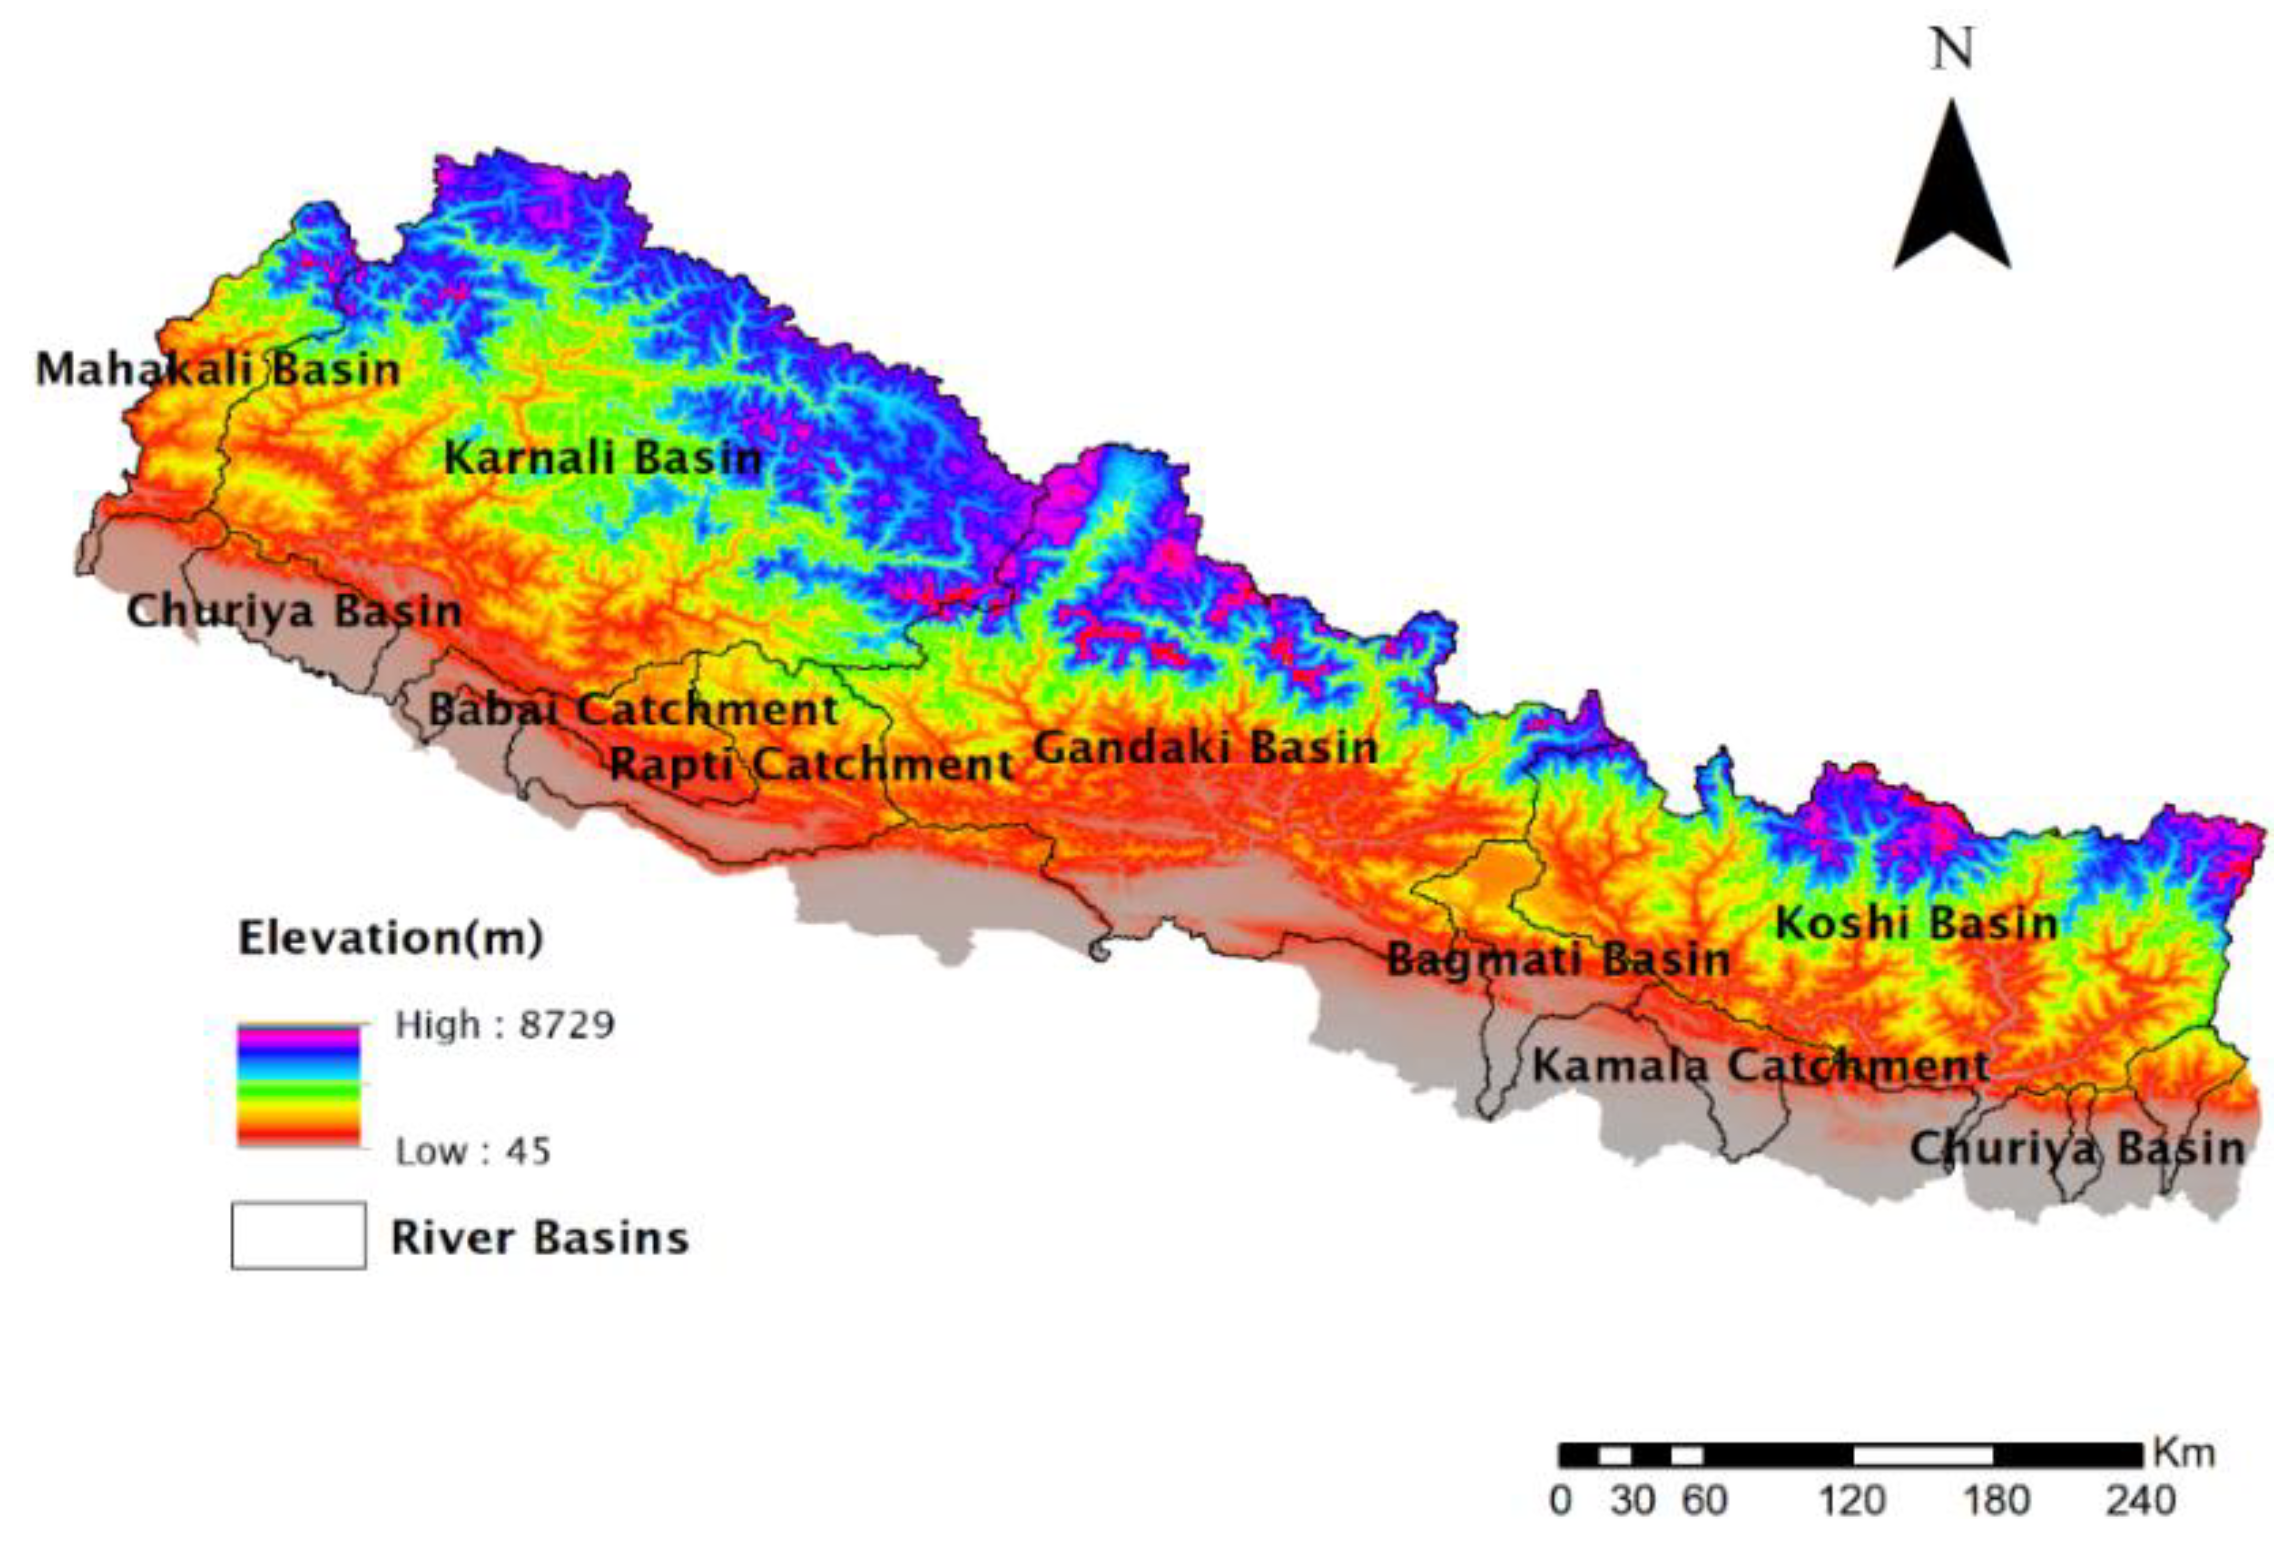
15], Nepal has faced notable LULC changes especially in urban and semi-urban areas. The Bagmati Basin, incorporating the capital city Kathmandu, has significant socio-economic importance because of centralized job opportunities, education, health facilities, etc. Issues such as decreased availability of freshwater resources, urban floods, degraded water quality, solid waste management, etc. are major problems in the basin especially in urban and semi-urban areas in the upper part of the basin [
16]. The basin has been facing many flood events in its lower belt [
16] and urban floods have become a re-occurring phenomenon every monsoon season in major city cores like in Kathmandu and Bhaktapur. Water availability and accessibility are also issues and due to the lack of effective plans for waste management by households, industries, and agricultural areas, water quality is on the constant verge of degradation [
17]. Likewise, unchecked LULC changes for activities such as agriculture and road expansion are increasing soil loss rates. Industrialization and urbanization mainly in the upper part of the basin are impacting the overall ES of the basin. The optimum provision of ES under changing LULC and climatic conditions would be questionable if proper mitigation and preservation plans are not formulated in time.
Several studies on ES have been carried out in Nepal to inform biodiversity conservation and to promote local and national decision making [
18,
19]. Some examples are LULC dynamics and ES valuation in the Gandaki Basin of Nepal [
20] and effects of LULC change on ES in the Koshi Basin, which focused on food production, carbon storage, habitat quality, etc. [
21]. Several international organizations such as the International Union for Conservation of Nature (IUCN), the International Centre for Integrated Mountain Development (ICIMOD), the World Bank, and the Asian Development Bank are currently working toward the assessment of ES and the implementation of Payments for Ecosystem Services (PES) in Nepal [
19,
22]. The implementation of PES schemes in sectors such as drinking water, irrigation, and tourism already exists in Nepal, but these payments are being made only for mandatory requirements, not for the sustained supply of services [
19]. Many studies have independently assessed freshwater availability [
23], water pollution issues [
24], and soil loss cases [
25] in the Bagmati Basin of Nepal. However, to the extent of our knowledge, a collective effort to access in terms of ES, LULC impacts on them, and projections based on climate data are not yet available. Thus, to overcome this gap, the concept of this study was devised. Climate change and LULC are major drivers of changes in ES and ES are itself interrelated [
26]. This study aims to analyze the impacts on ES owing to changes in LULC and to provide an overview of the provision of ES in the context of a changing climate. This study thus treats four regulating ES, namely, water yield (WY) for a freshwater provision and flood control, soil loss indicating soil degradation and impacts on interrelated services, nitrogen export for surface water quality, and carbon storage for climate regulation. Integrated Valuation of Ecosystem Services and Tradeoffs (InVEST) [
27] ES tools and the Revised Universal Soil Loss Equation (RUSLE) [
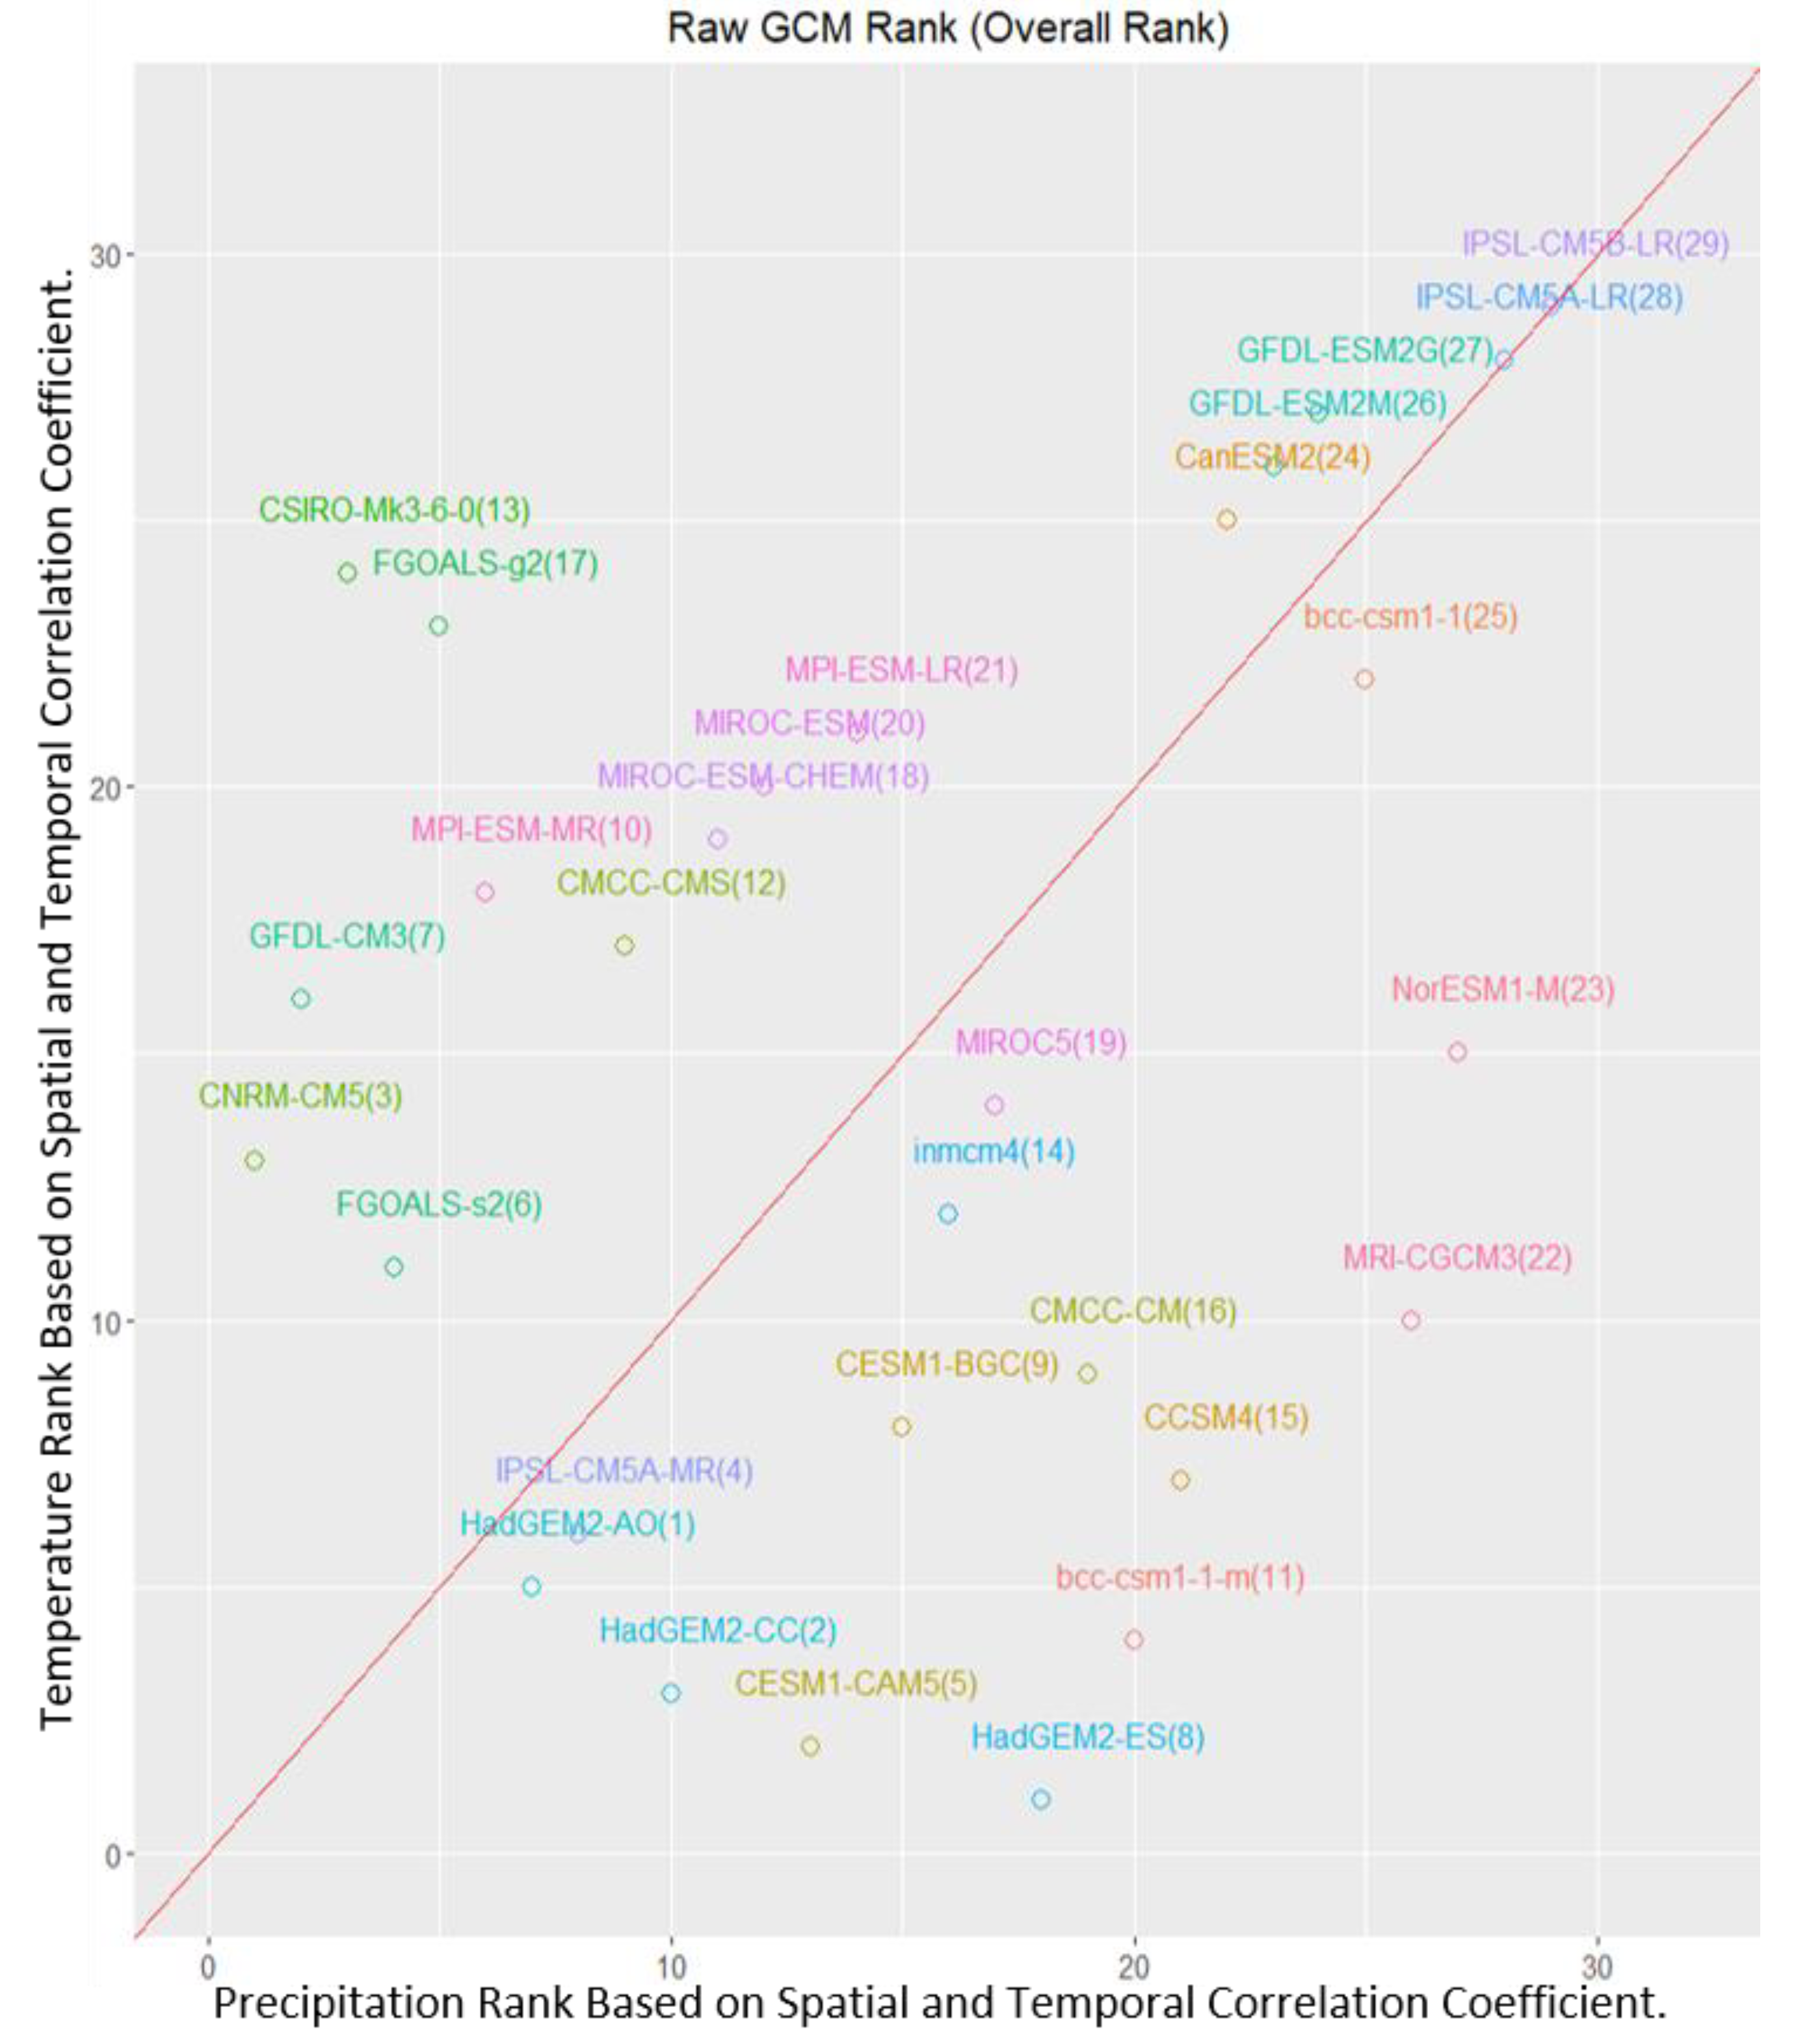
28] method along with ArcGIS were used to map ES of the basin, and APCC Integrated Modelling Solution (AIMS) software developed by the Asia Pacific Economic Cooperation Climate Centre (APCC) was used for statistical downscaling of bias-corrected global climate model (GCM) data.
4. Discussion
The global concern for the conservation and promotion of ES is rising along with an awareness that projected extreme events as a result of climate change will hamper the provision of services. Normally, ES are renewable if they can be managed sustainably but can be depleted or degraded if mismanaged. The future climate will continue to deliver ES; in some cases, ES are increased and, in some cases, decreased—mostly decreased compared to historical supply. Along with climate change, another important factor is LULC transformation, which alters the provision of ES. Thus, mapping and evaluation of ES are crucial for future land use plans and for strengthening the capability of various services and facilities, directly or indirectly associated with ES.
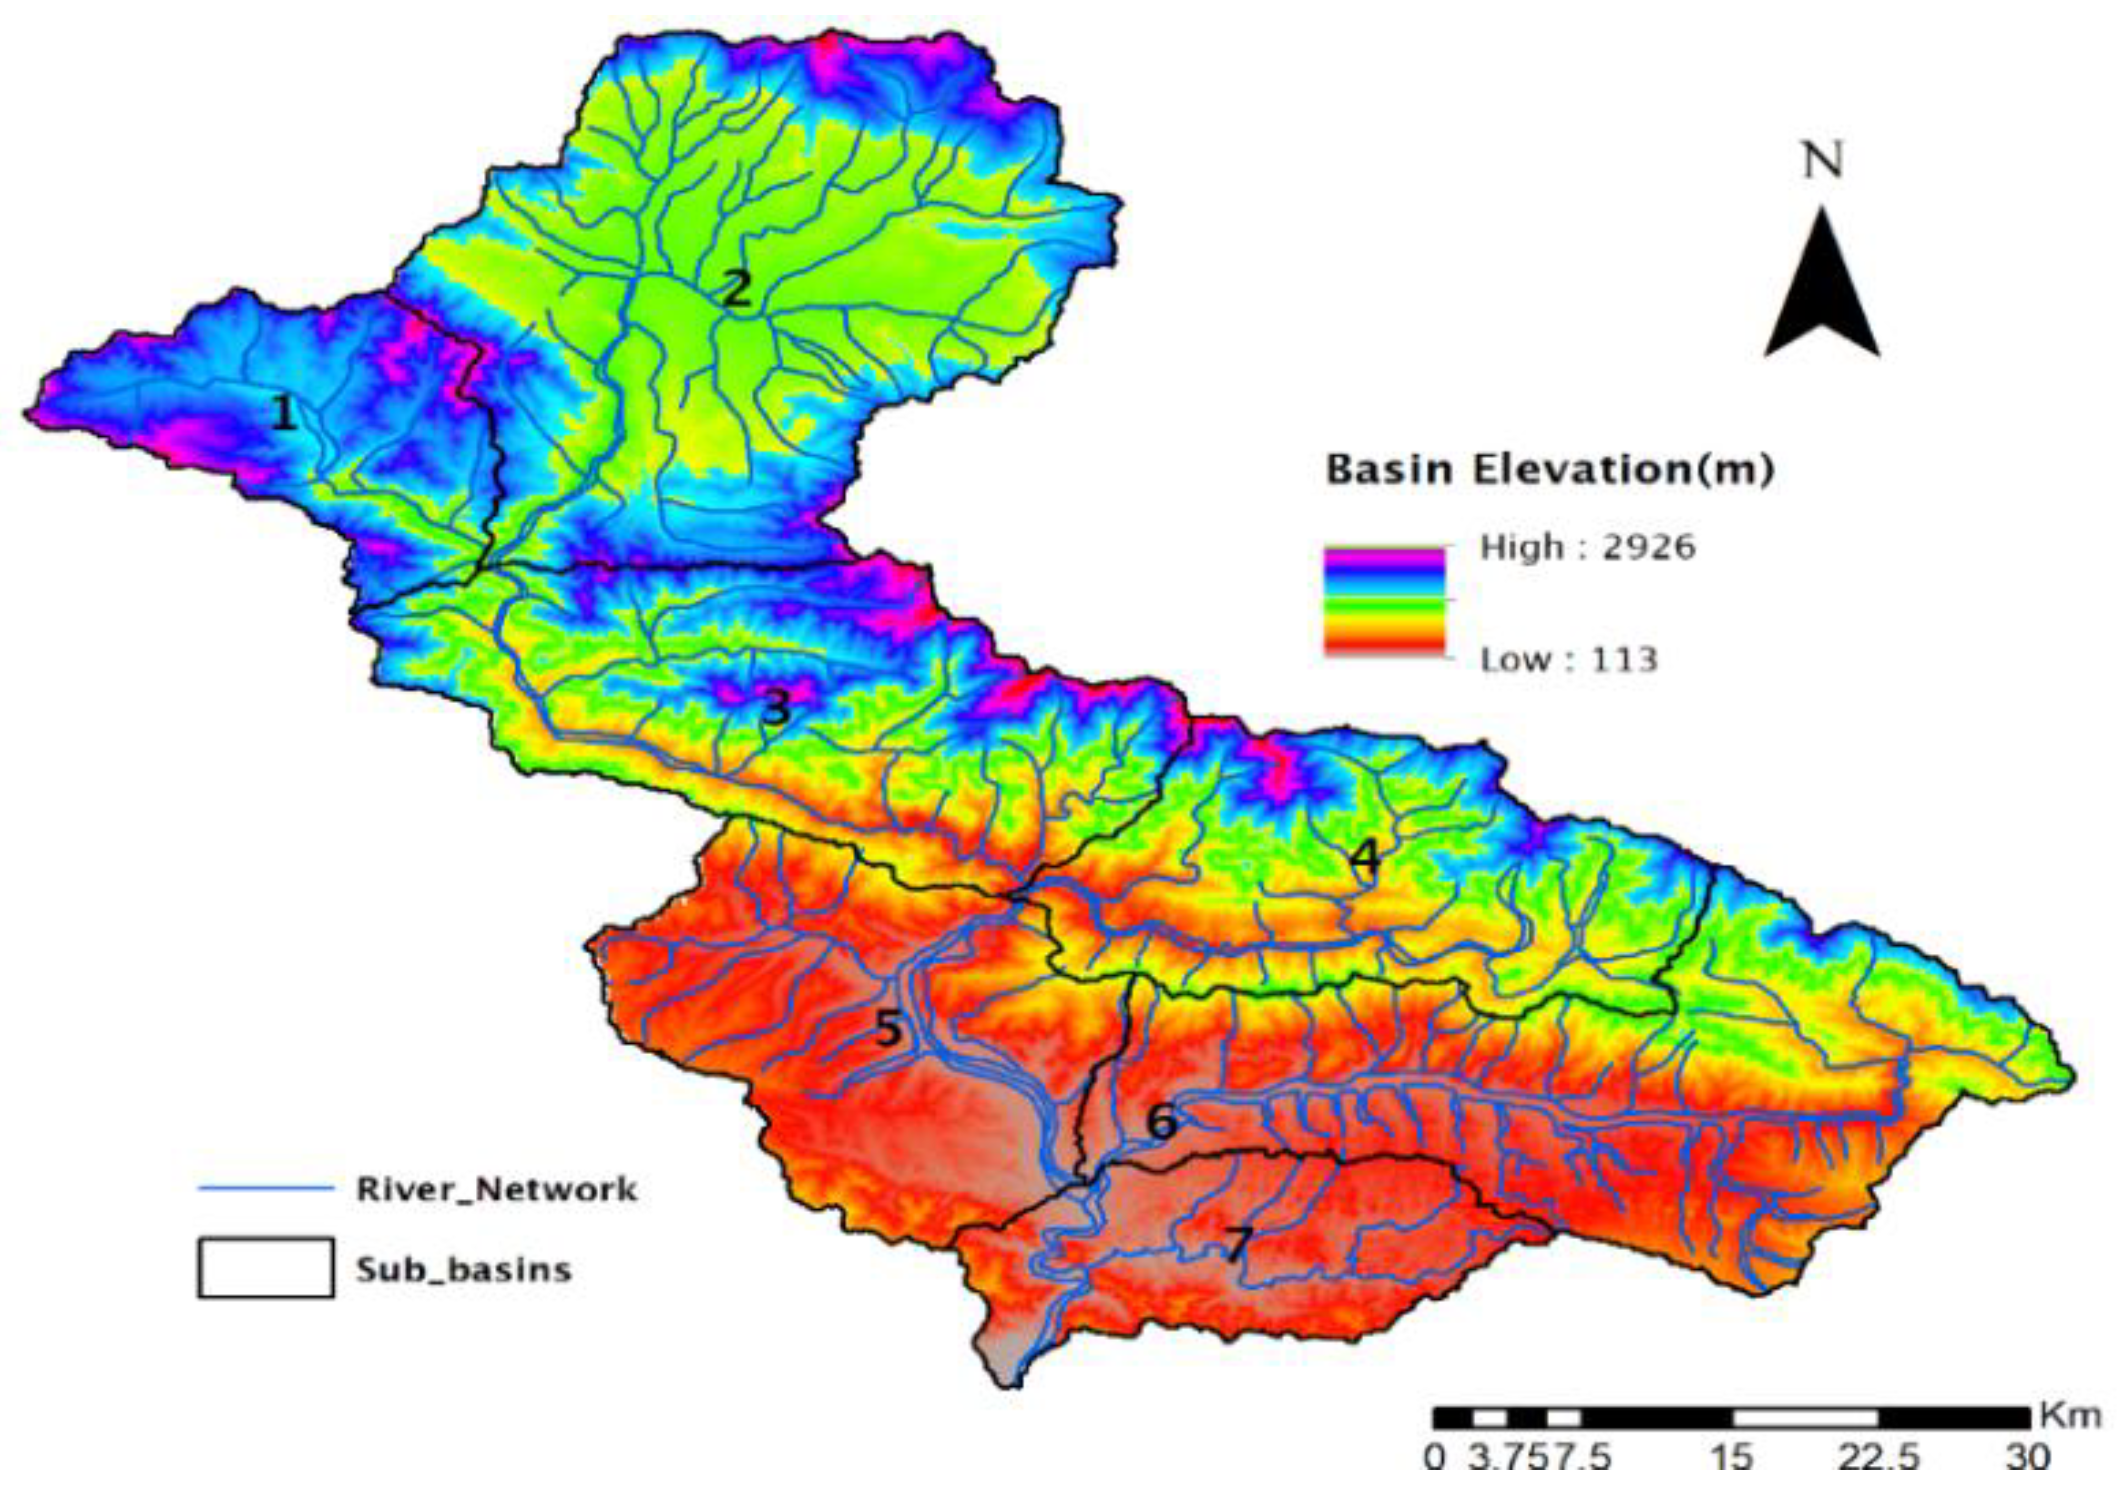
Provisioning services are often readily appreciated by the public as they have direct market values. However, other ES (regulating services, supporting services, and cultural services) are often not prioritized in decision making as these services do not hold immediate monetary value. To emphasize the significance of regulating services in the production and sustainability of other ES, we focused on four major regulating ES, namely, WY, soil loss, nitrogen export, and carbon storage. The provision of these services was compared on sub-basin scales and compared based on LULC data of two time periods, namely, 2000 and 2010. We also computed the ES provision on future climate scenarios with the baseline LULC data of 2010 and downscaled climate data for 2010–2099.
The LULC change analysis between the periods 2000 and 2010 shows that the conversion to built-up and agriculture areas from other LULC is significantly high on the Bagmati Basin. This is because of increased anthropogenic activities for food sustainability and economic upliftment. These conversions come at the huge cost of increased WY, soil loss, loss of carbon sink, and increased nitrogen export to water resources. Meantime, the concept of a Payments for Ecosystem Services (PES) scheme is being promoted in the basin with the realization of the need for ecosystem conservation [
55]. This scheme has increased protected areas and community forests in the basin and has a twin objective of promoting ecosystem conservation and development earnings [
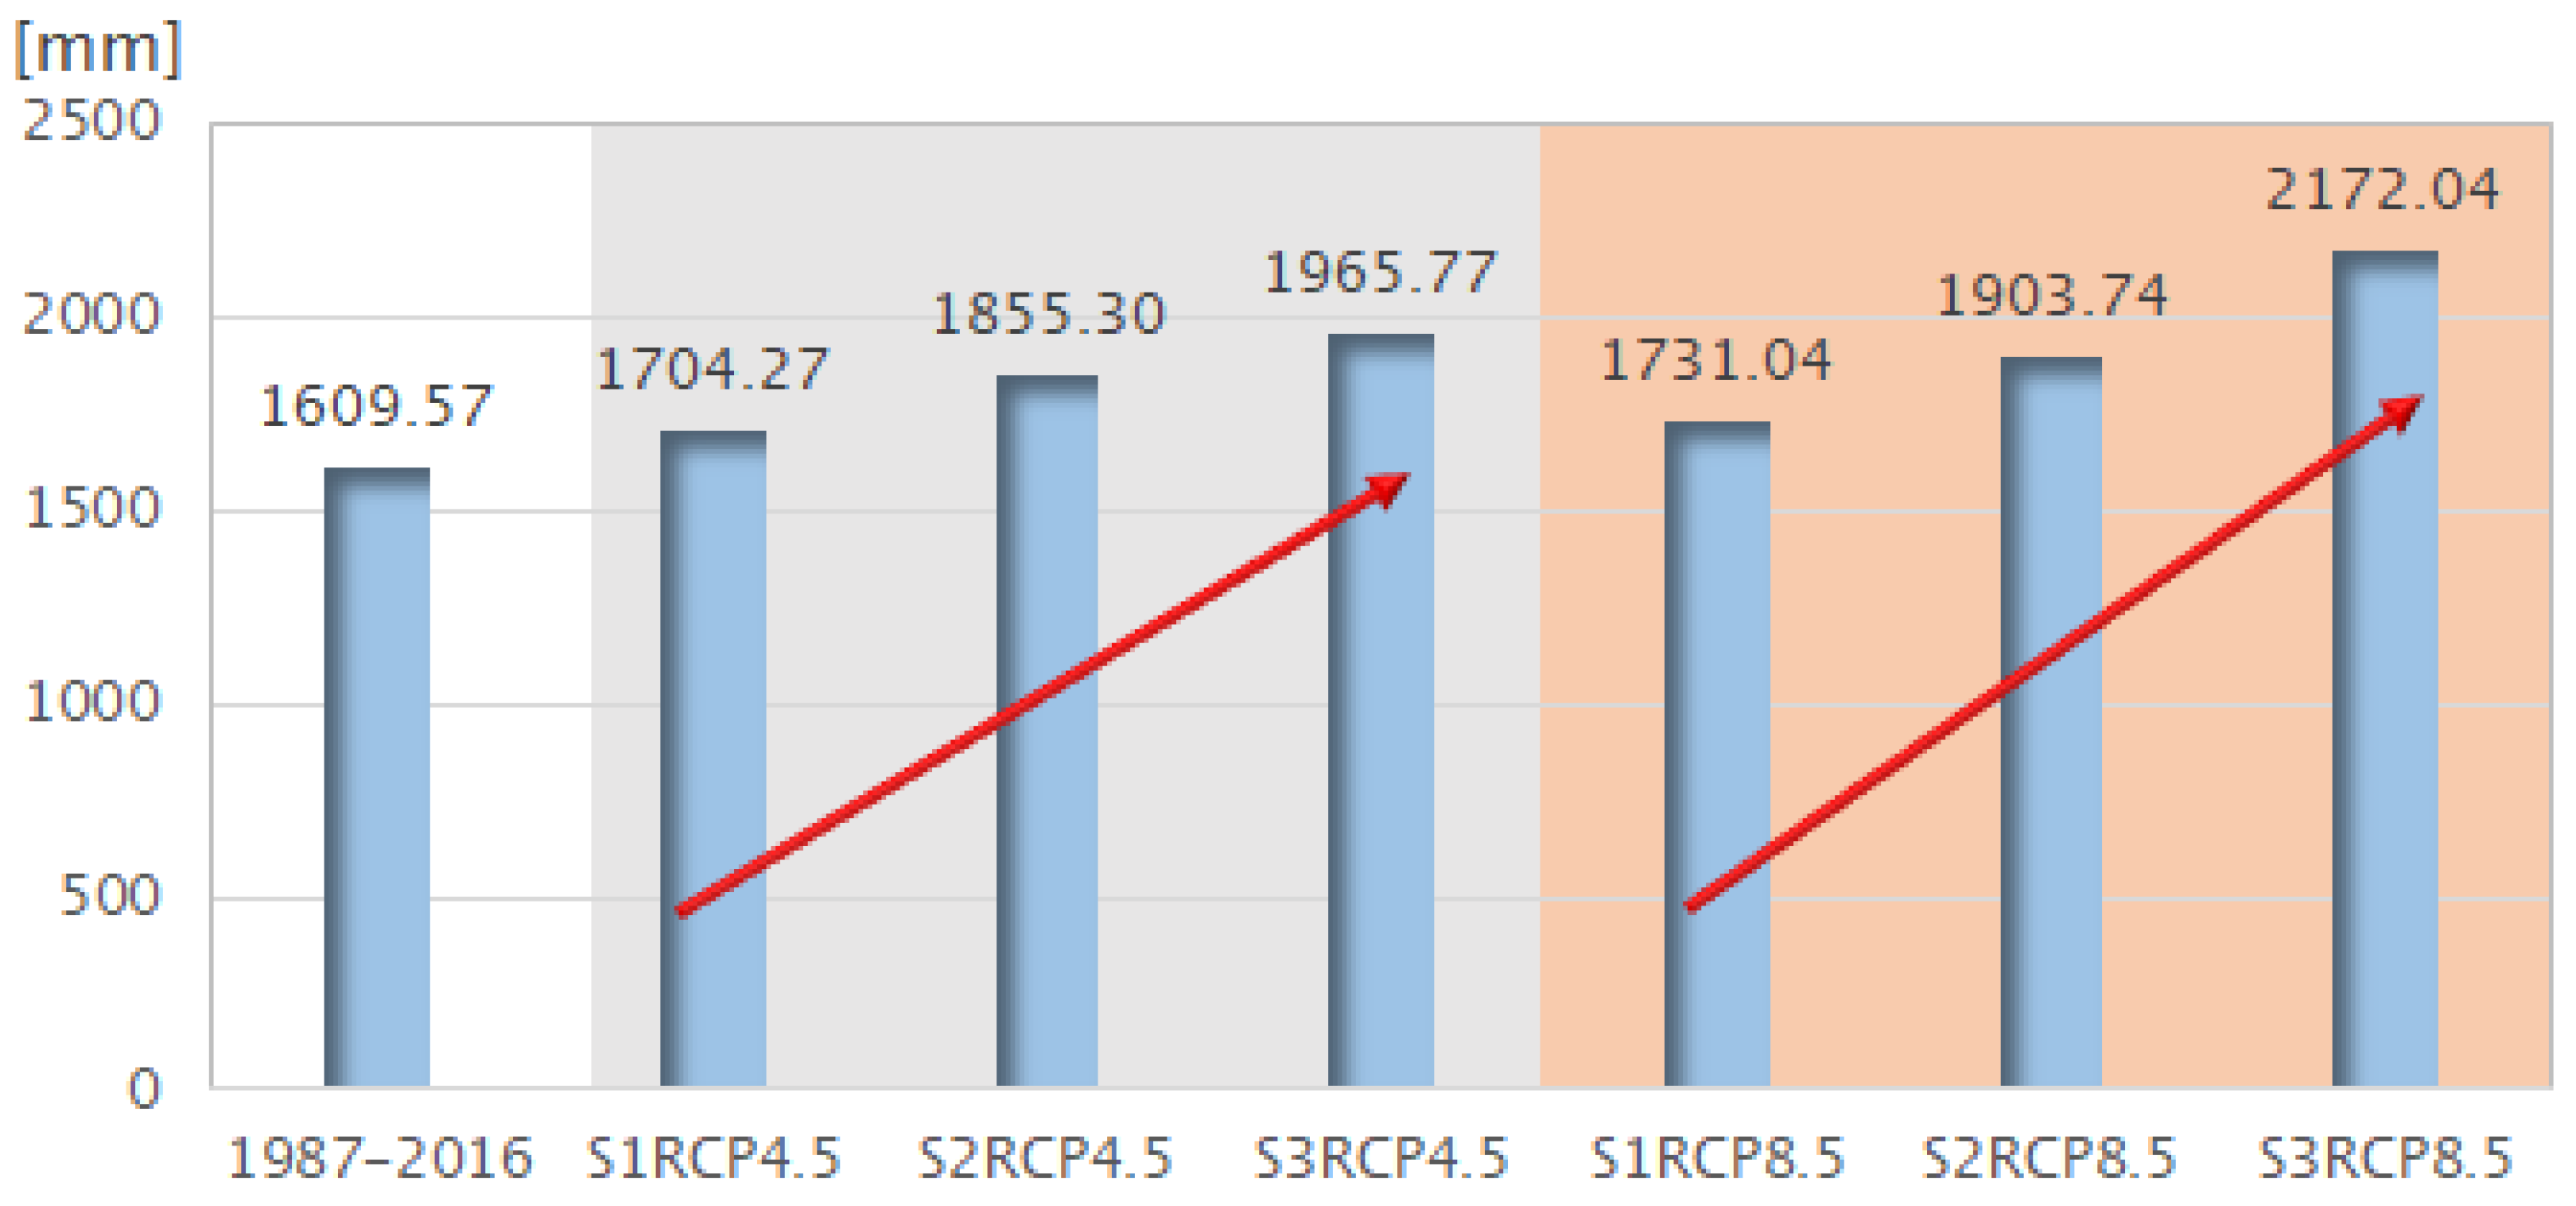
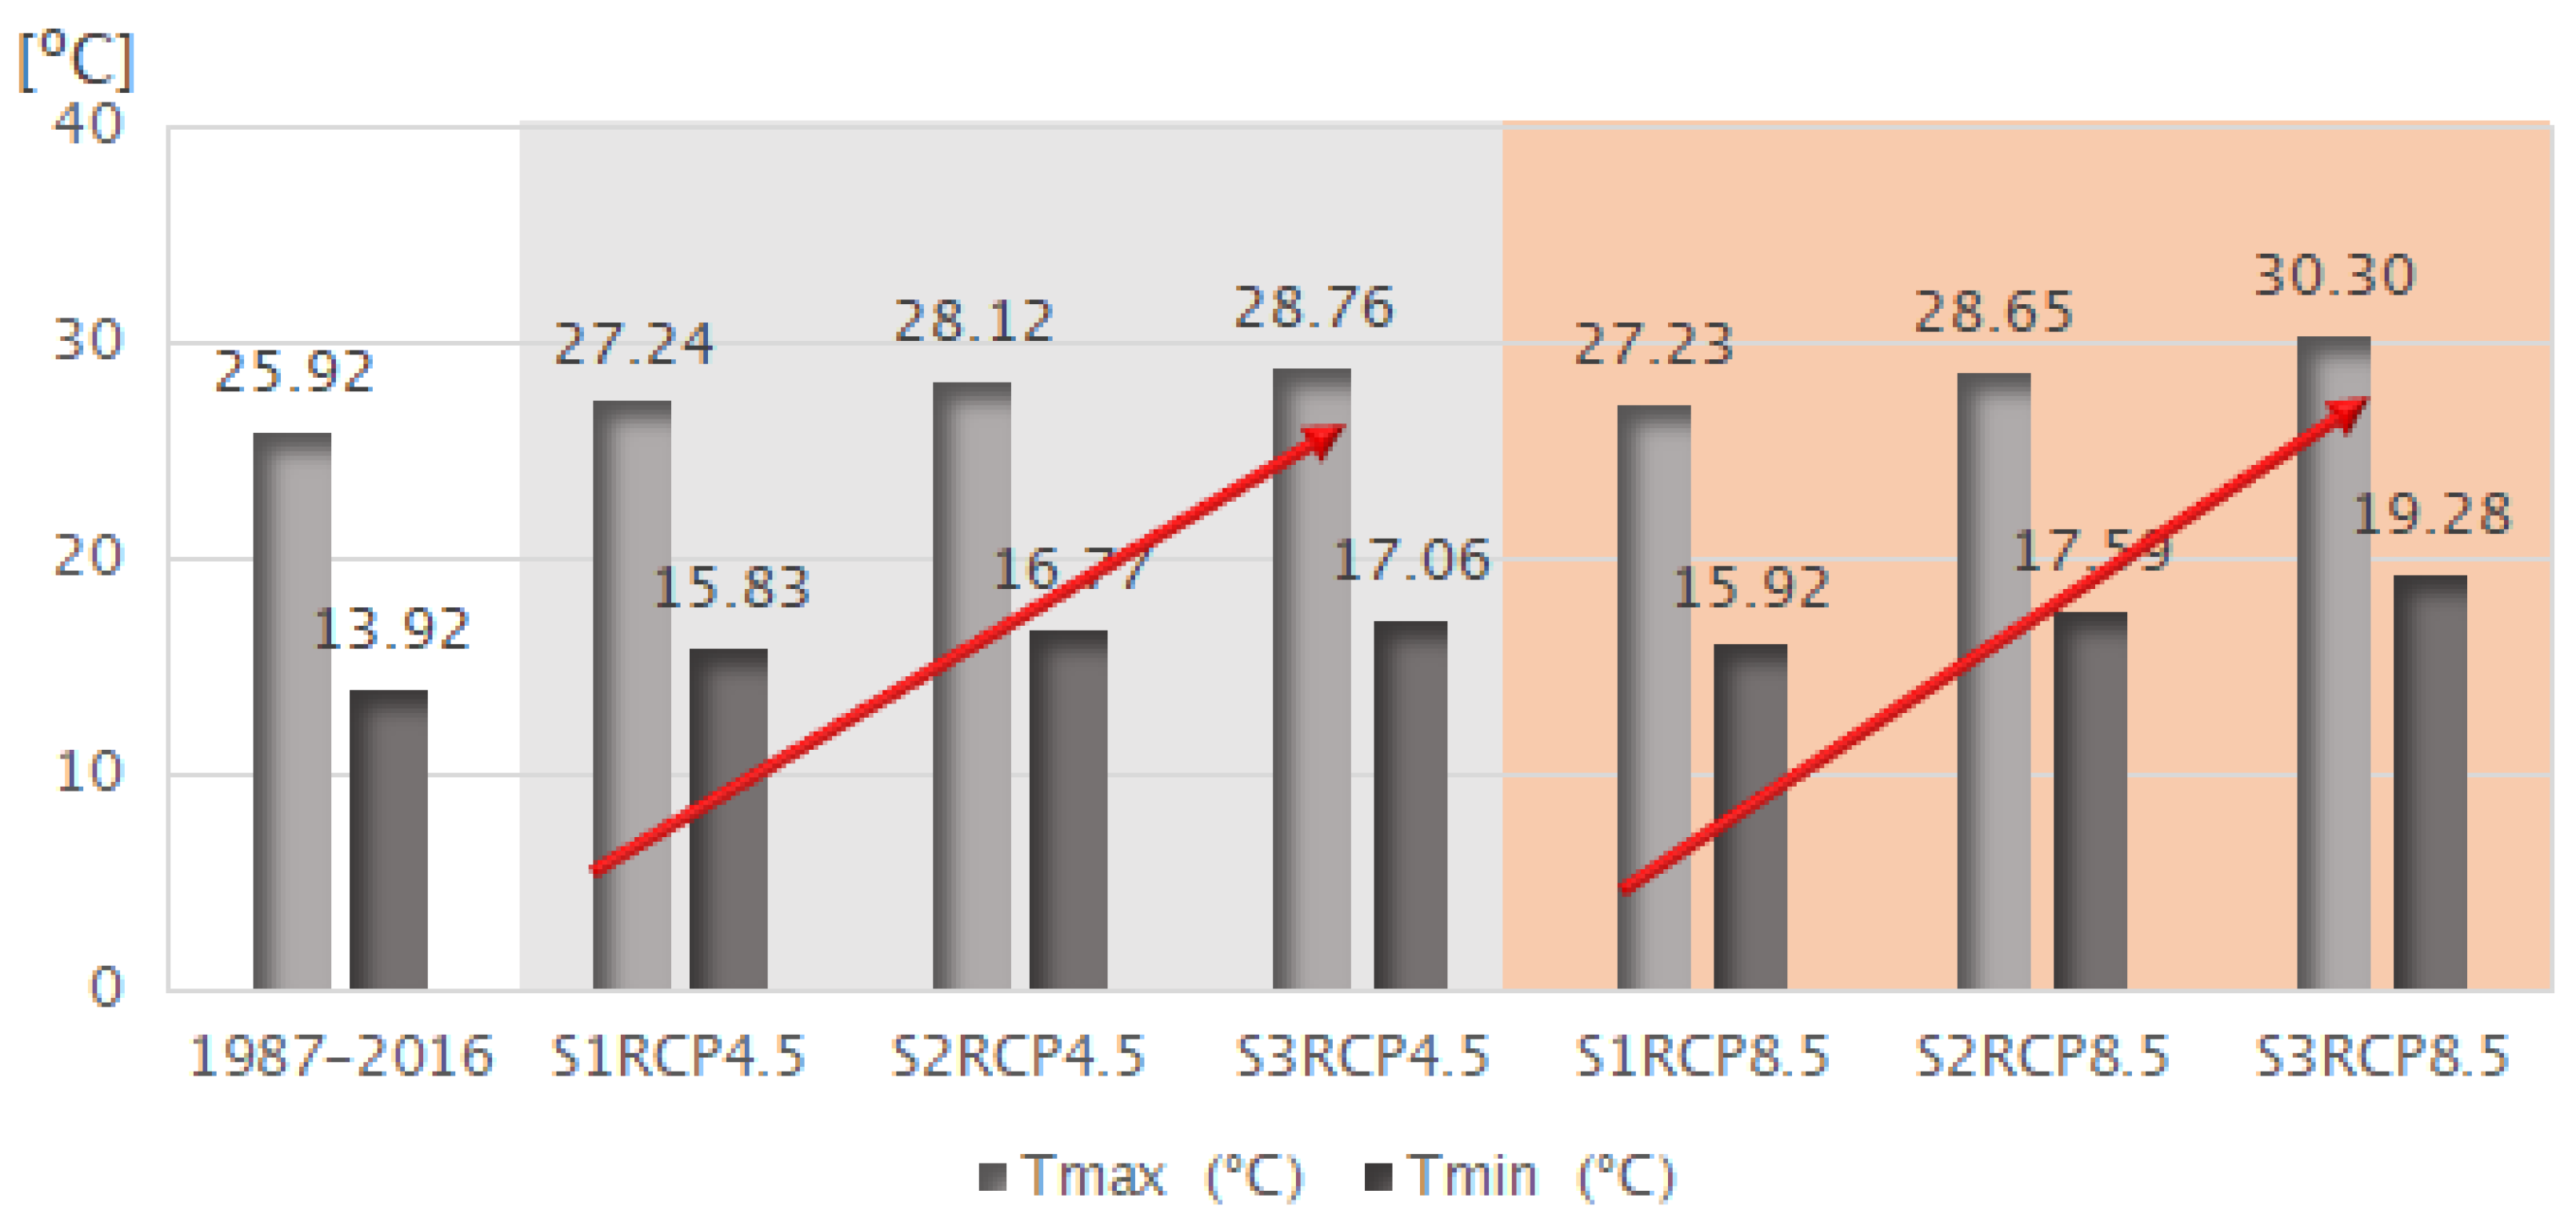
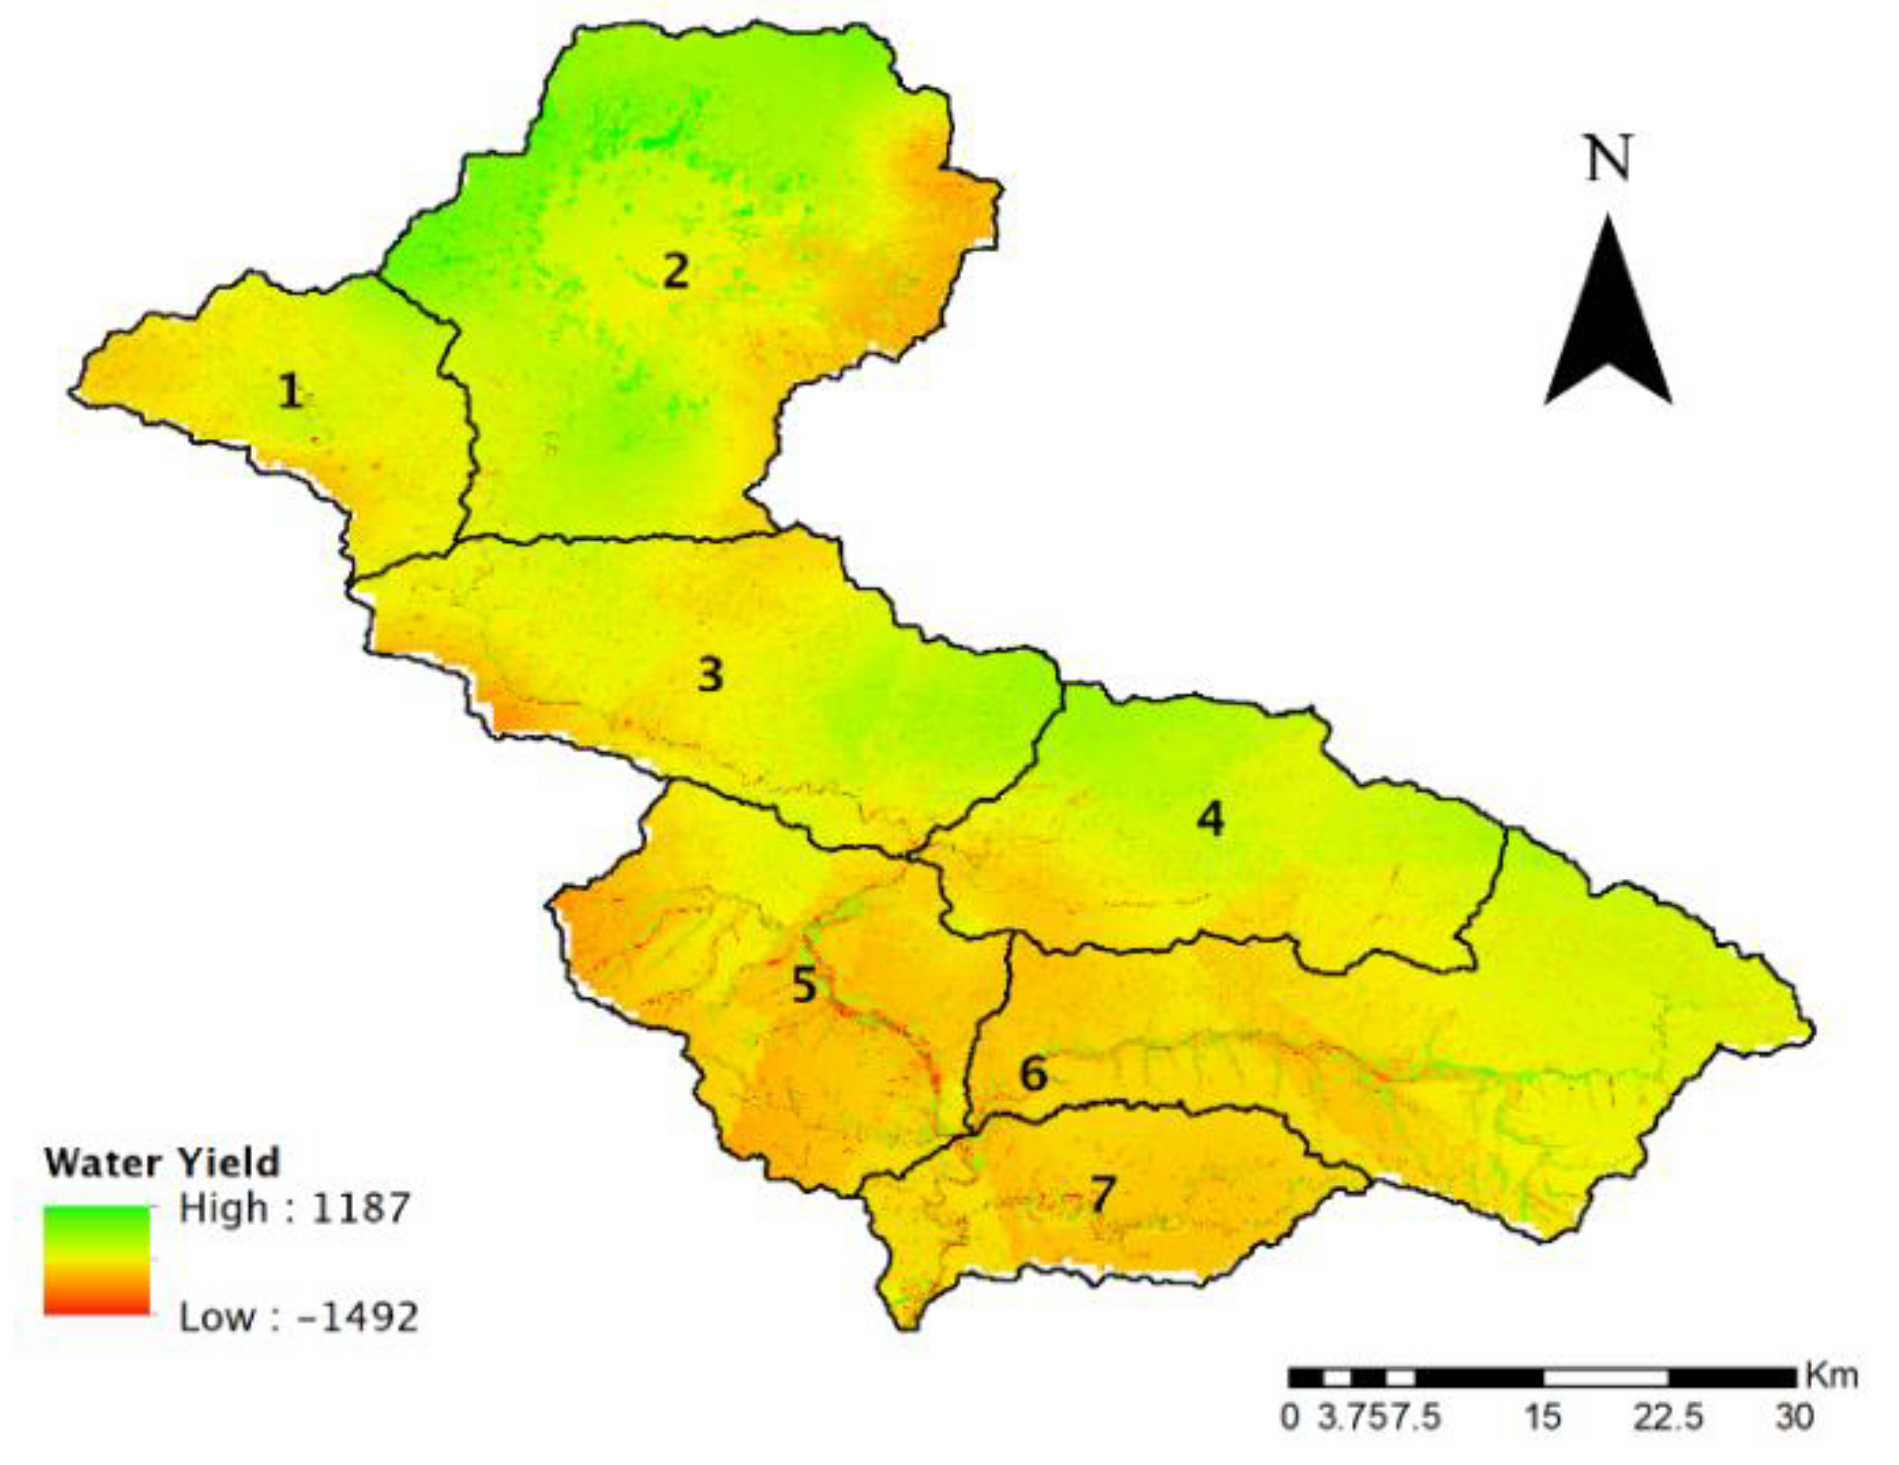
55]. Likewise, climate projection shows increased precipitation and temperatures for the future period. The mean annual average precipitation in the case of 2010 was lower than that of 2000 and as WY and soil loss are highly affected by precipitation amount, its magnitude was decreased in 2010 compared to 2000. Though the overall WY was decreased in 2010 compared to 2000, the WY on sub-basin 2 increased. Sub-basin 2 faced a higher increment of built-up areas and, consequently, evaporative loss and water retention were reduced, causing an overall increase of WY. This phenomenon was also observed by another study [
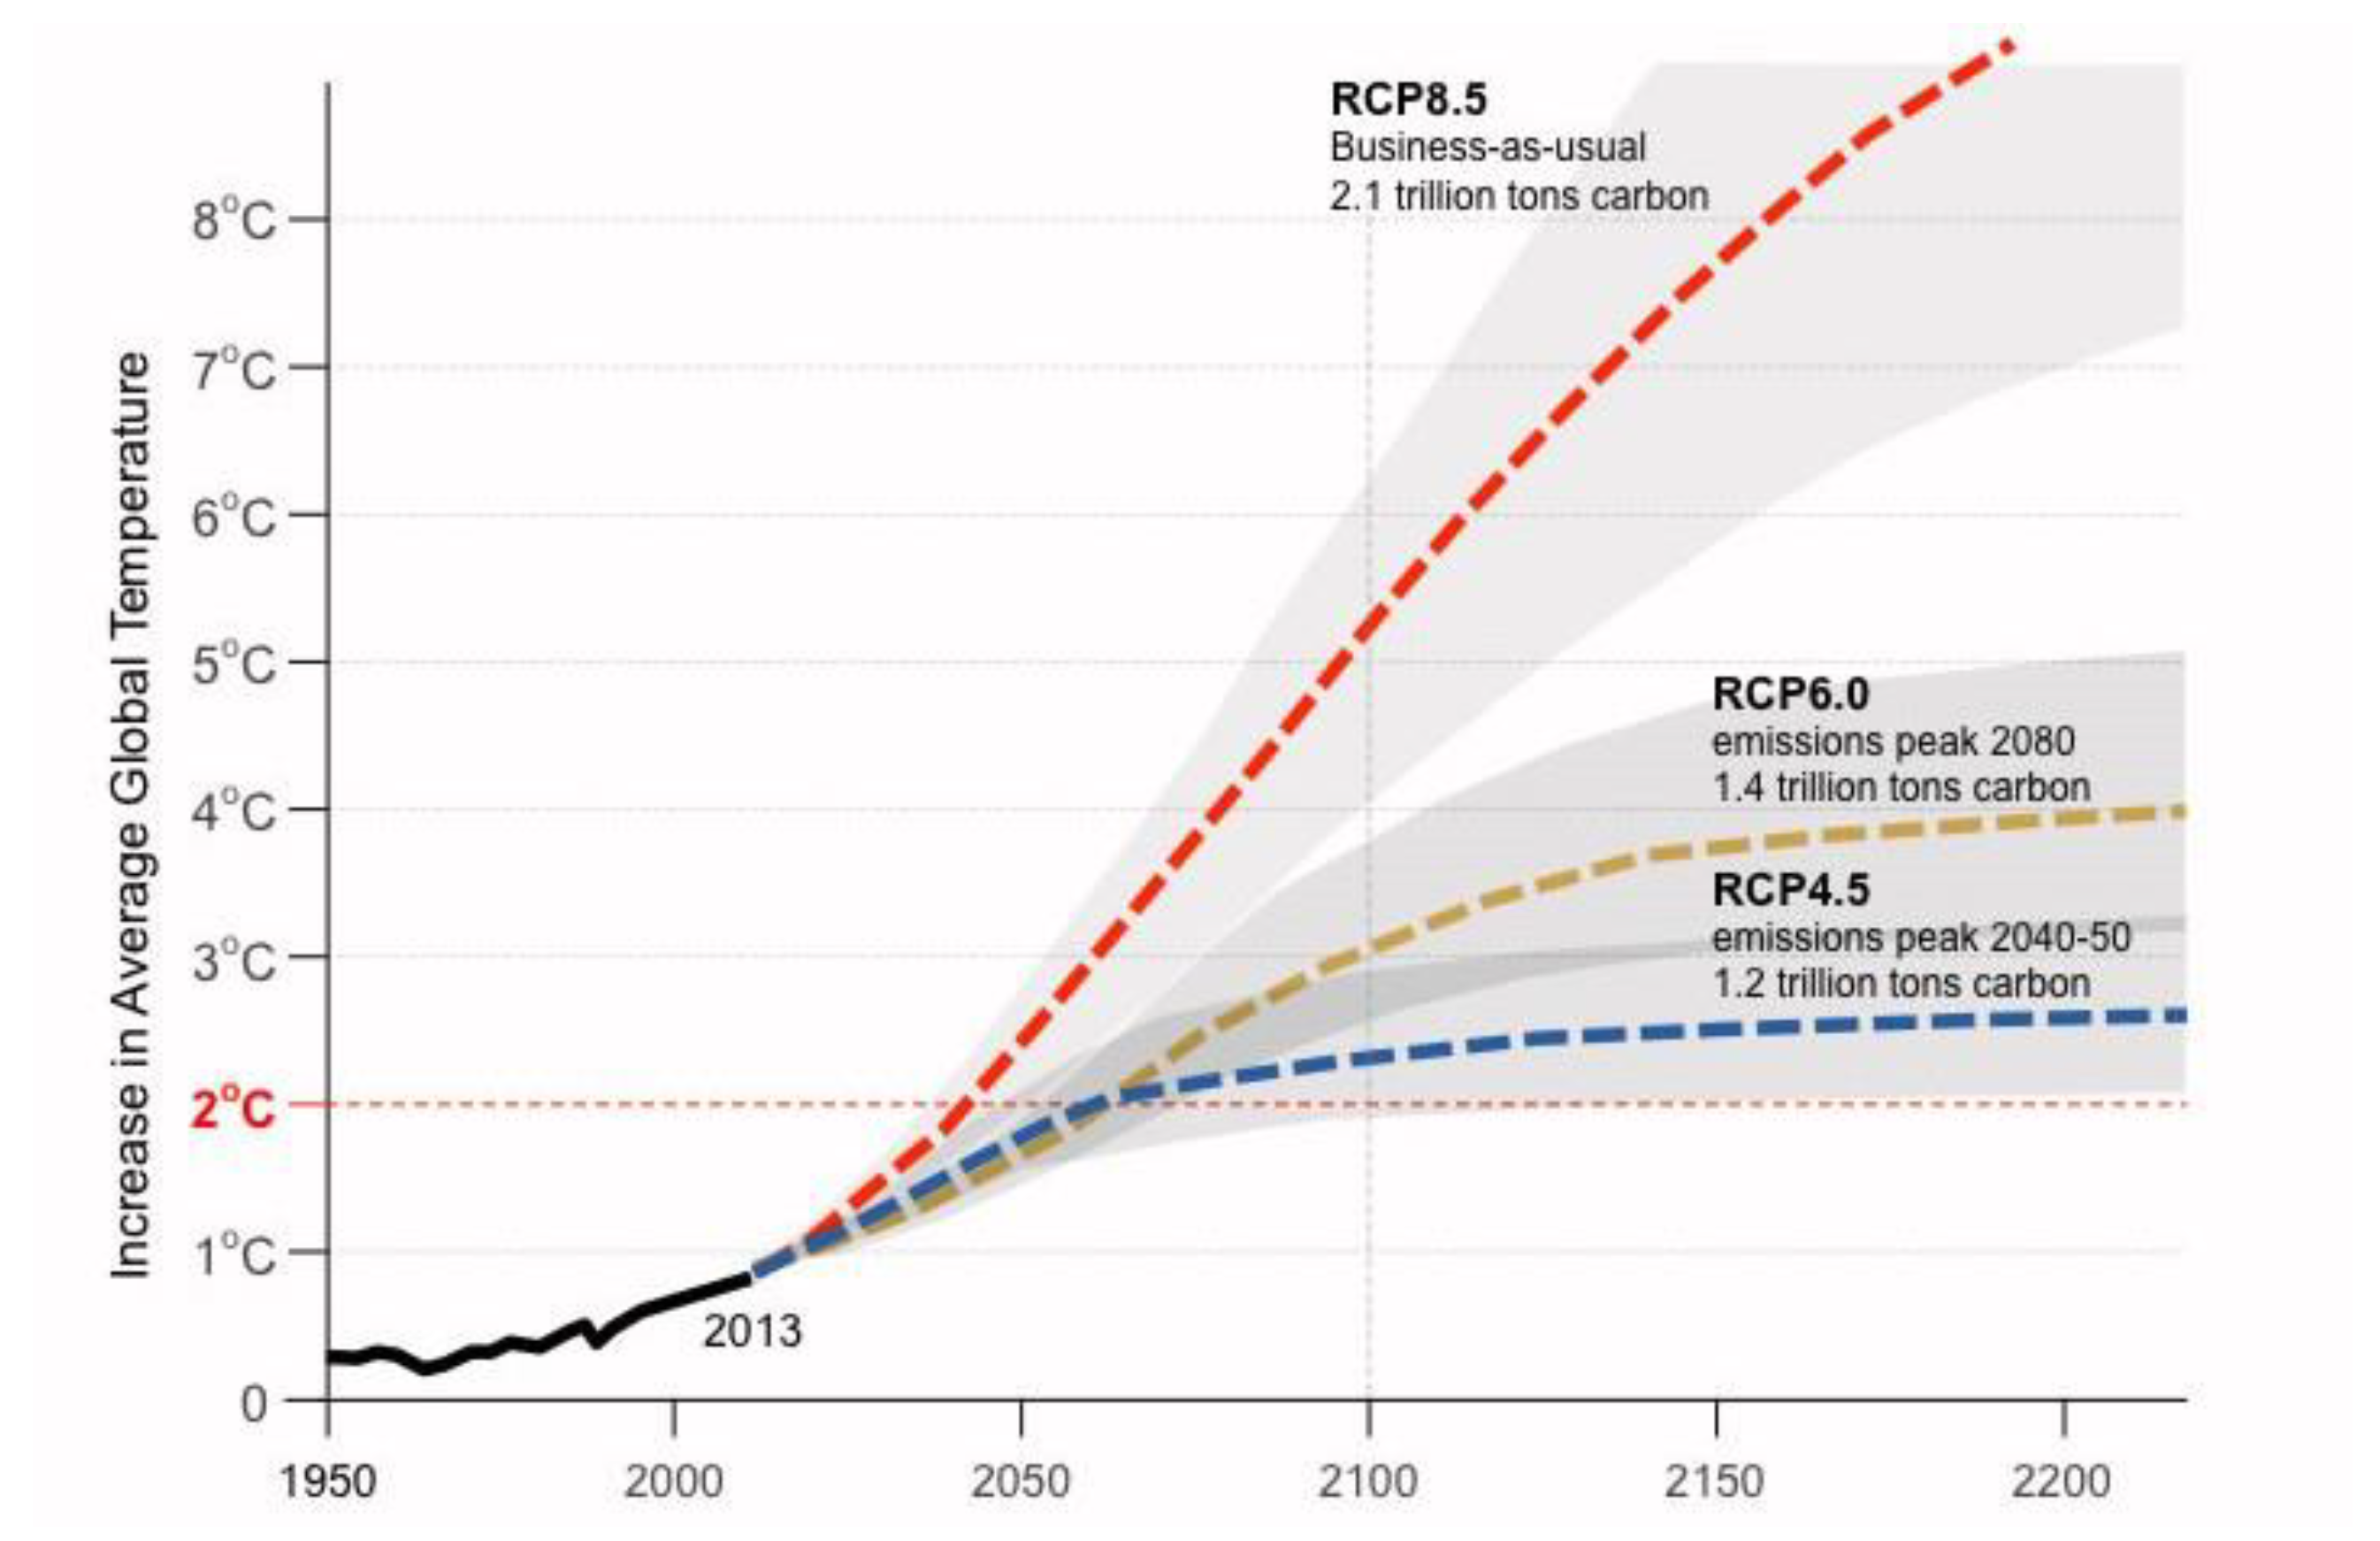
56] when computing the impacts of LULC on WY provision. The prediction of WY on future climate scenarios shows an overall increase in all sub-basins in consecutive periods S1 to S3 under both RCP 4.5 and RCP 8.5 scenarios (
Table 9). Although precipitation determines the amount of water provided by nature, LULC plays a significant role in determining the amount of water that flows as runoff or is retained as storage [
57]. Owing to this phenomenon, urbanization has induced frequent urban floods in Nepal and the lack of sufficient water retention structures has increased flood peaks and flood volumes.
In terms of ES, changes in WY caused by LULC changes have two major effects, namely, contribution to the water available for consumption and/or increased flood risks during storms [
58]. Infrastructural capability for water collection, delivery, and treatment may work temporarily to counter increased WY. In the long term, however, management should consider human–nature interactions to avoid unintended environmental and socio-economic consequences which are caused as a result of rapid and large-scale development [
58]. Several studies have recommended ecosystem-based “green” infrastructures such as wetlands, well-structured soils, and forest patches to enhance water storage and flood regulation [
59]. The mapping of WY and its tendencies in future climate scenarios can hence provide an outline for such sustainable land use plans to mitigate flood risks and water scarcity problems.
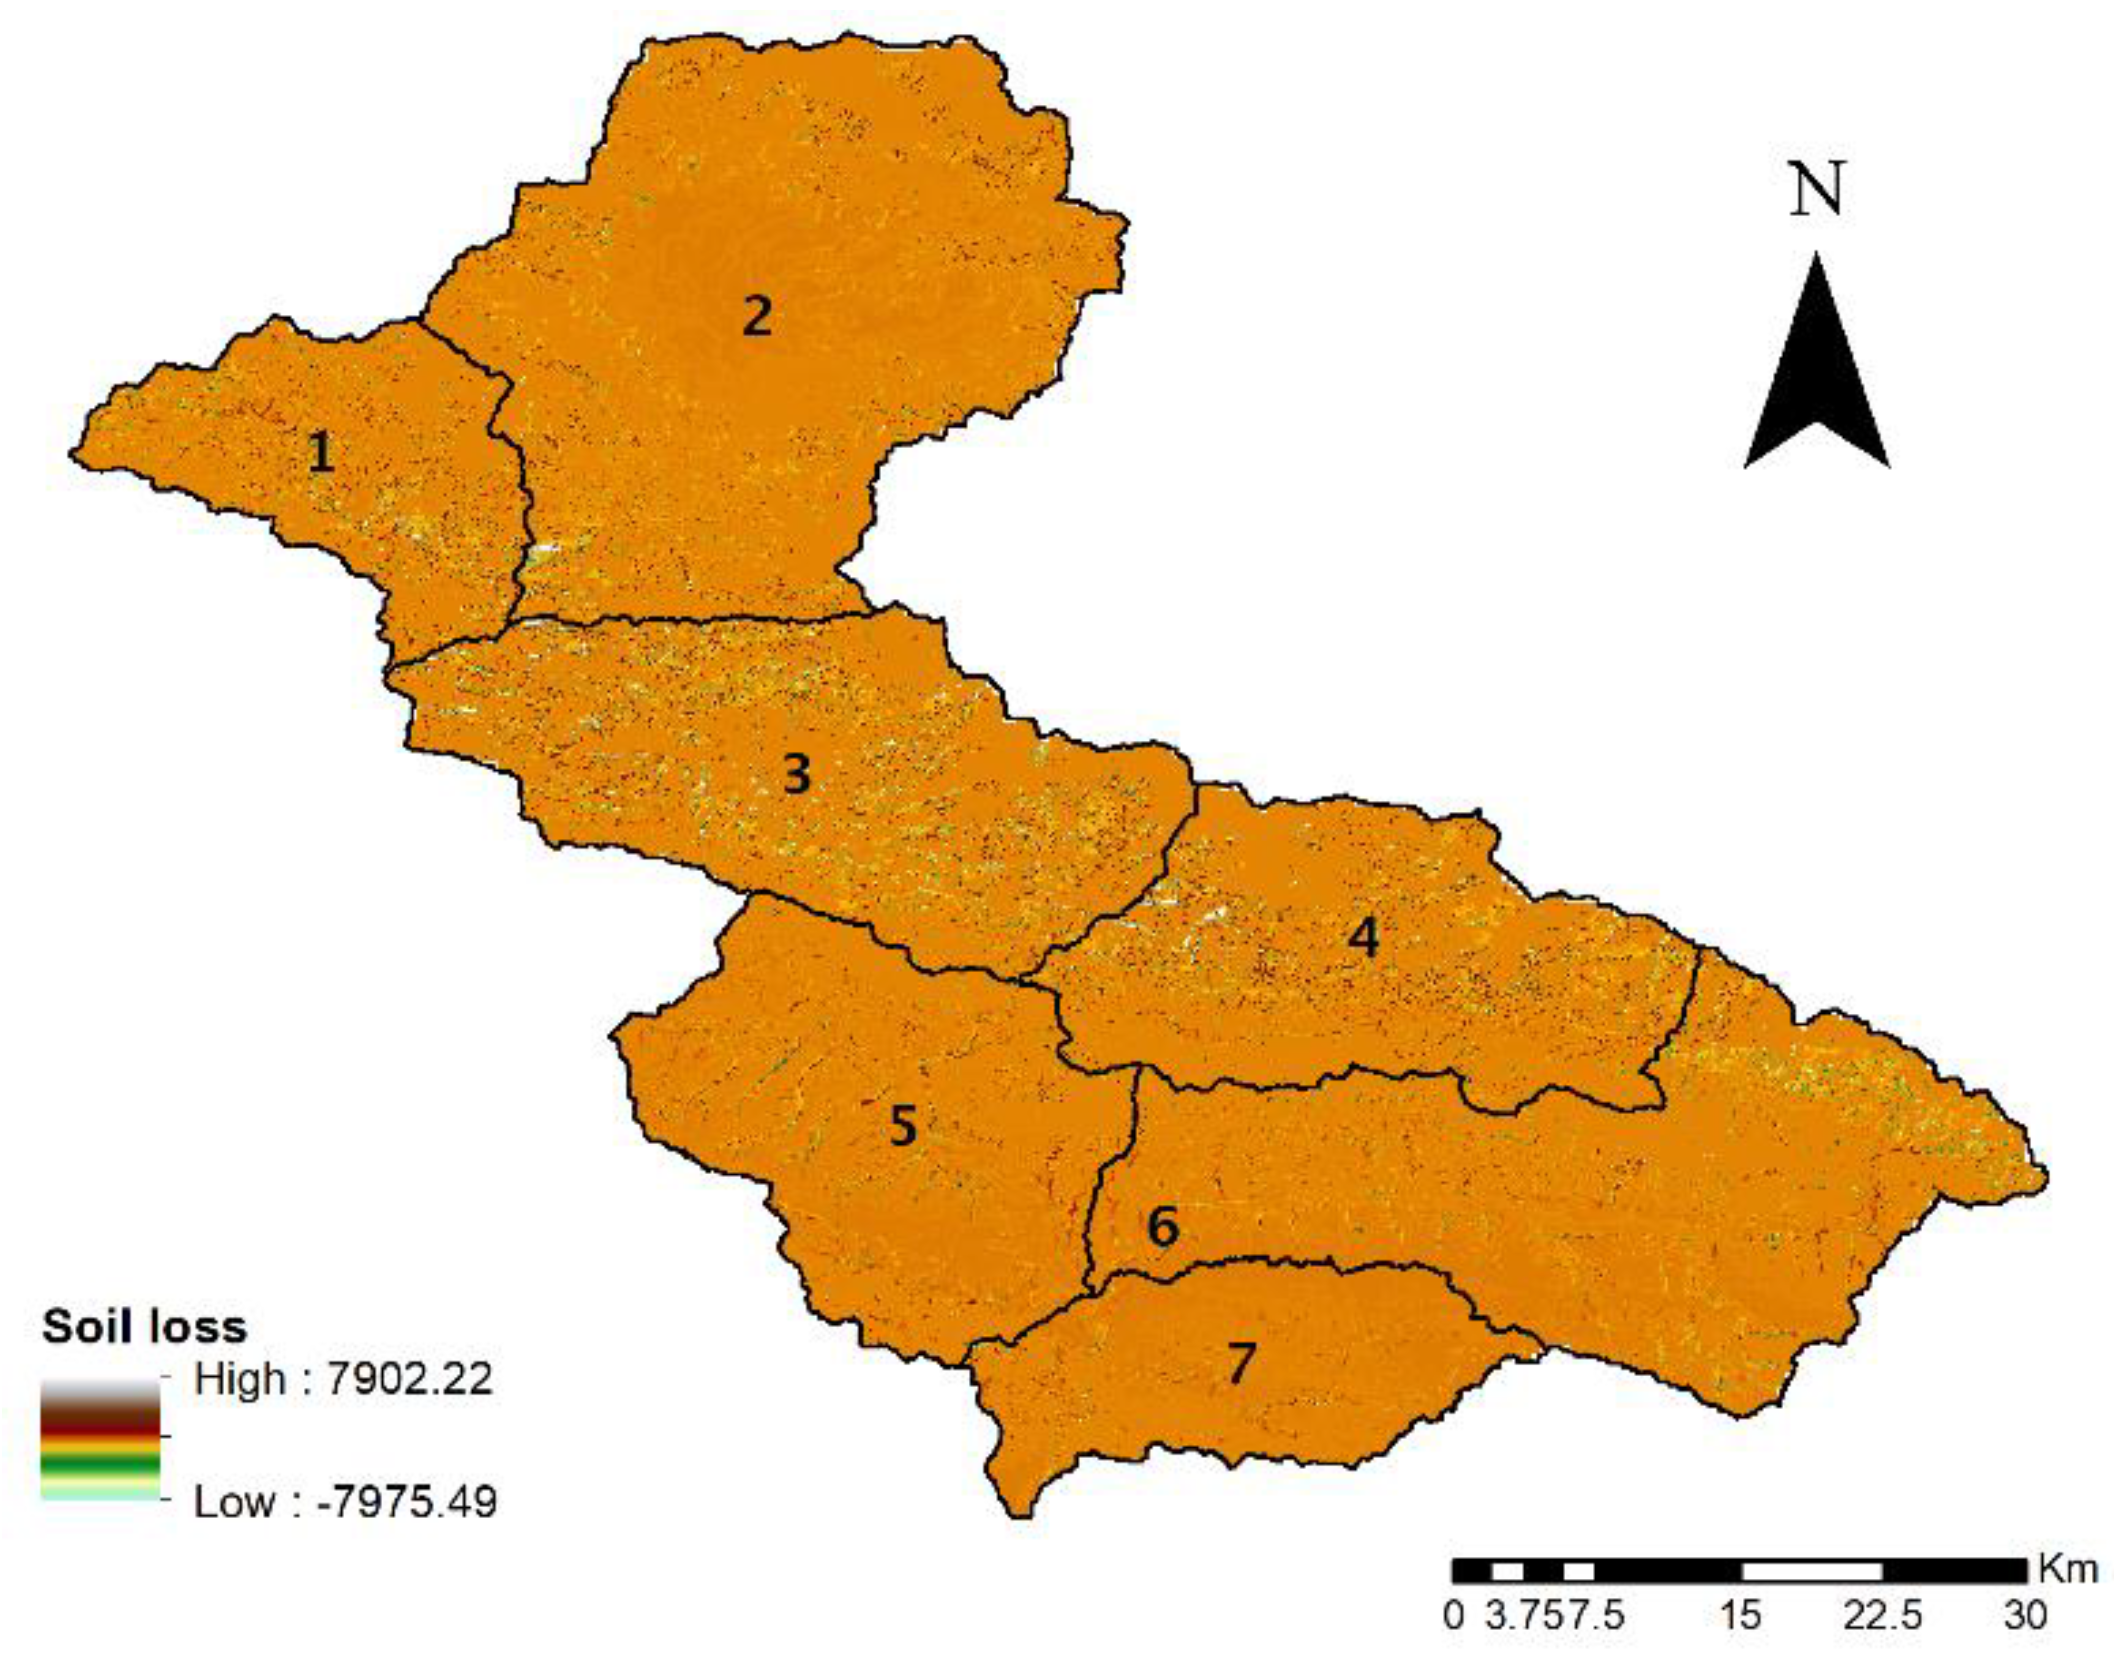
Although soil loss due to erosion and sedimentation are natural processes in a healthy ecosystem, excess loss mainly due to changes in LULC is a threat to the security of water, food, and energy [
60]. Soil loss is observed to be highest from agricultural land use in the study basin. Agriculture is the major activity sustaining the economy of Nepal. Thus, the traditional agricultural system demands improved methods to sustain topsoil-containing organic matter and essential plant nutrients that are otherwise removed from the soil during erosion. Likewise, the predicted increment of soil loss in the future climate scenarios also indicates the necessity for improved farm management practices that incorporate the management of increased WY. In addition to the stress on food production, soil erosion also reduces water and nutrient retention, biodiversity, and water resources/downstream power generation [
61]. Therefore, for sustainable management of soils and related services, spatial mapping of soil erosion on different land use and future scenarios can provide guidelines and mark areas for immediate actions to mitigate the loss.
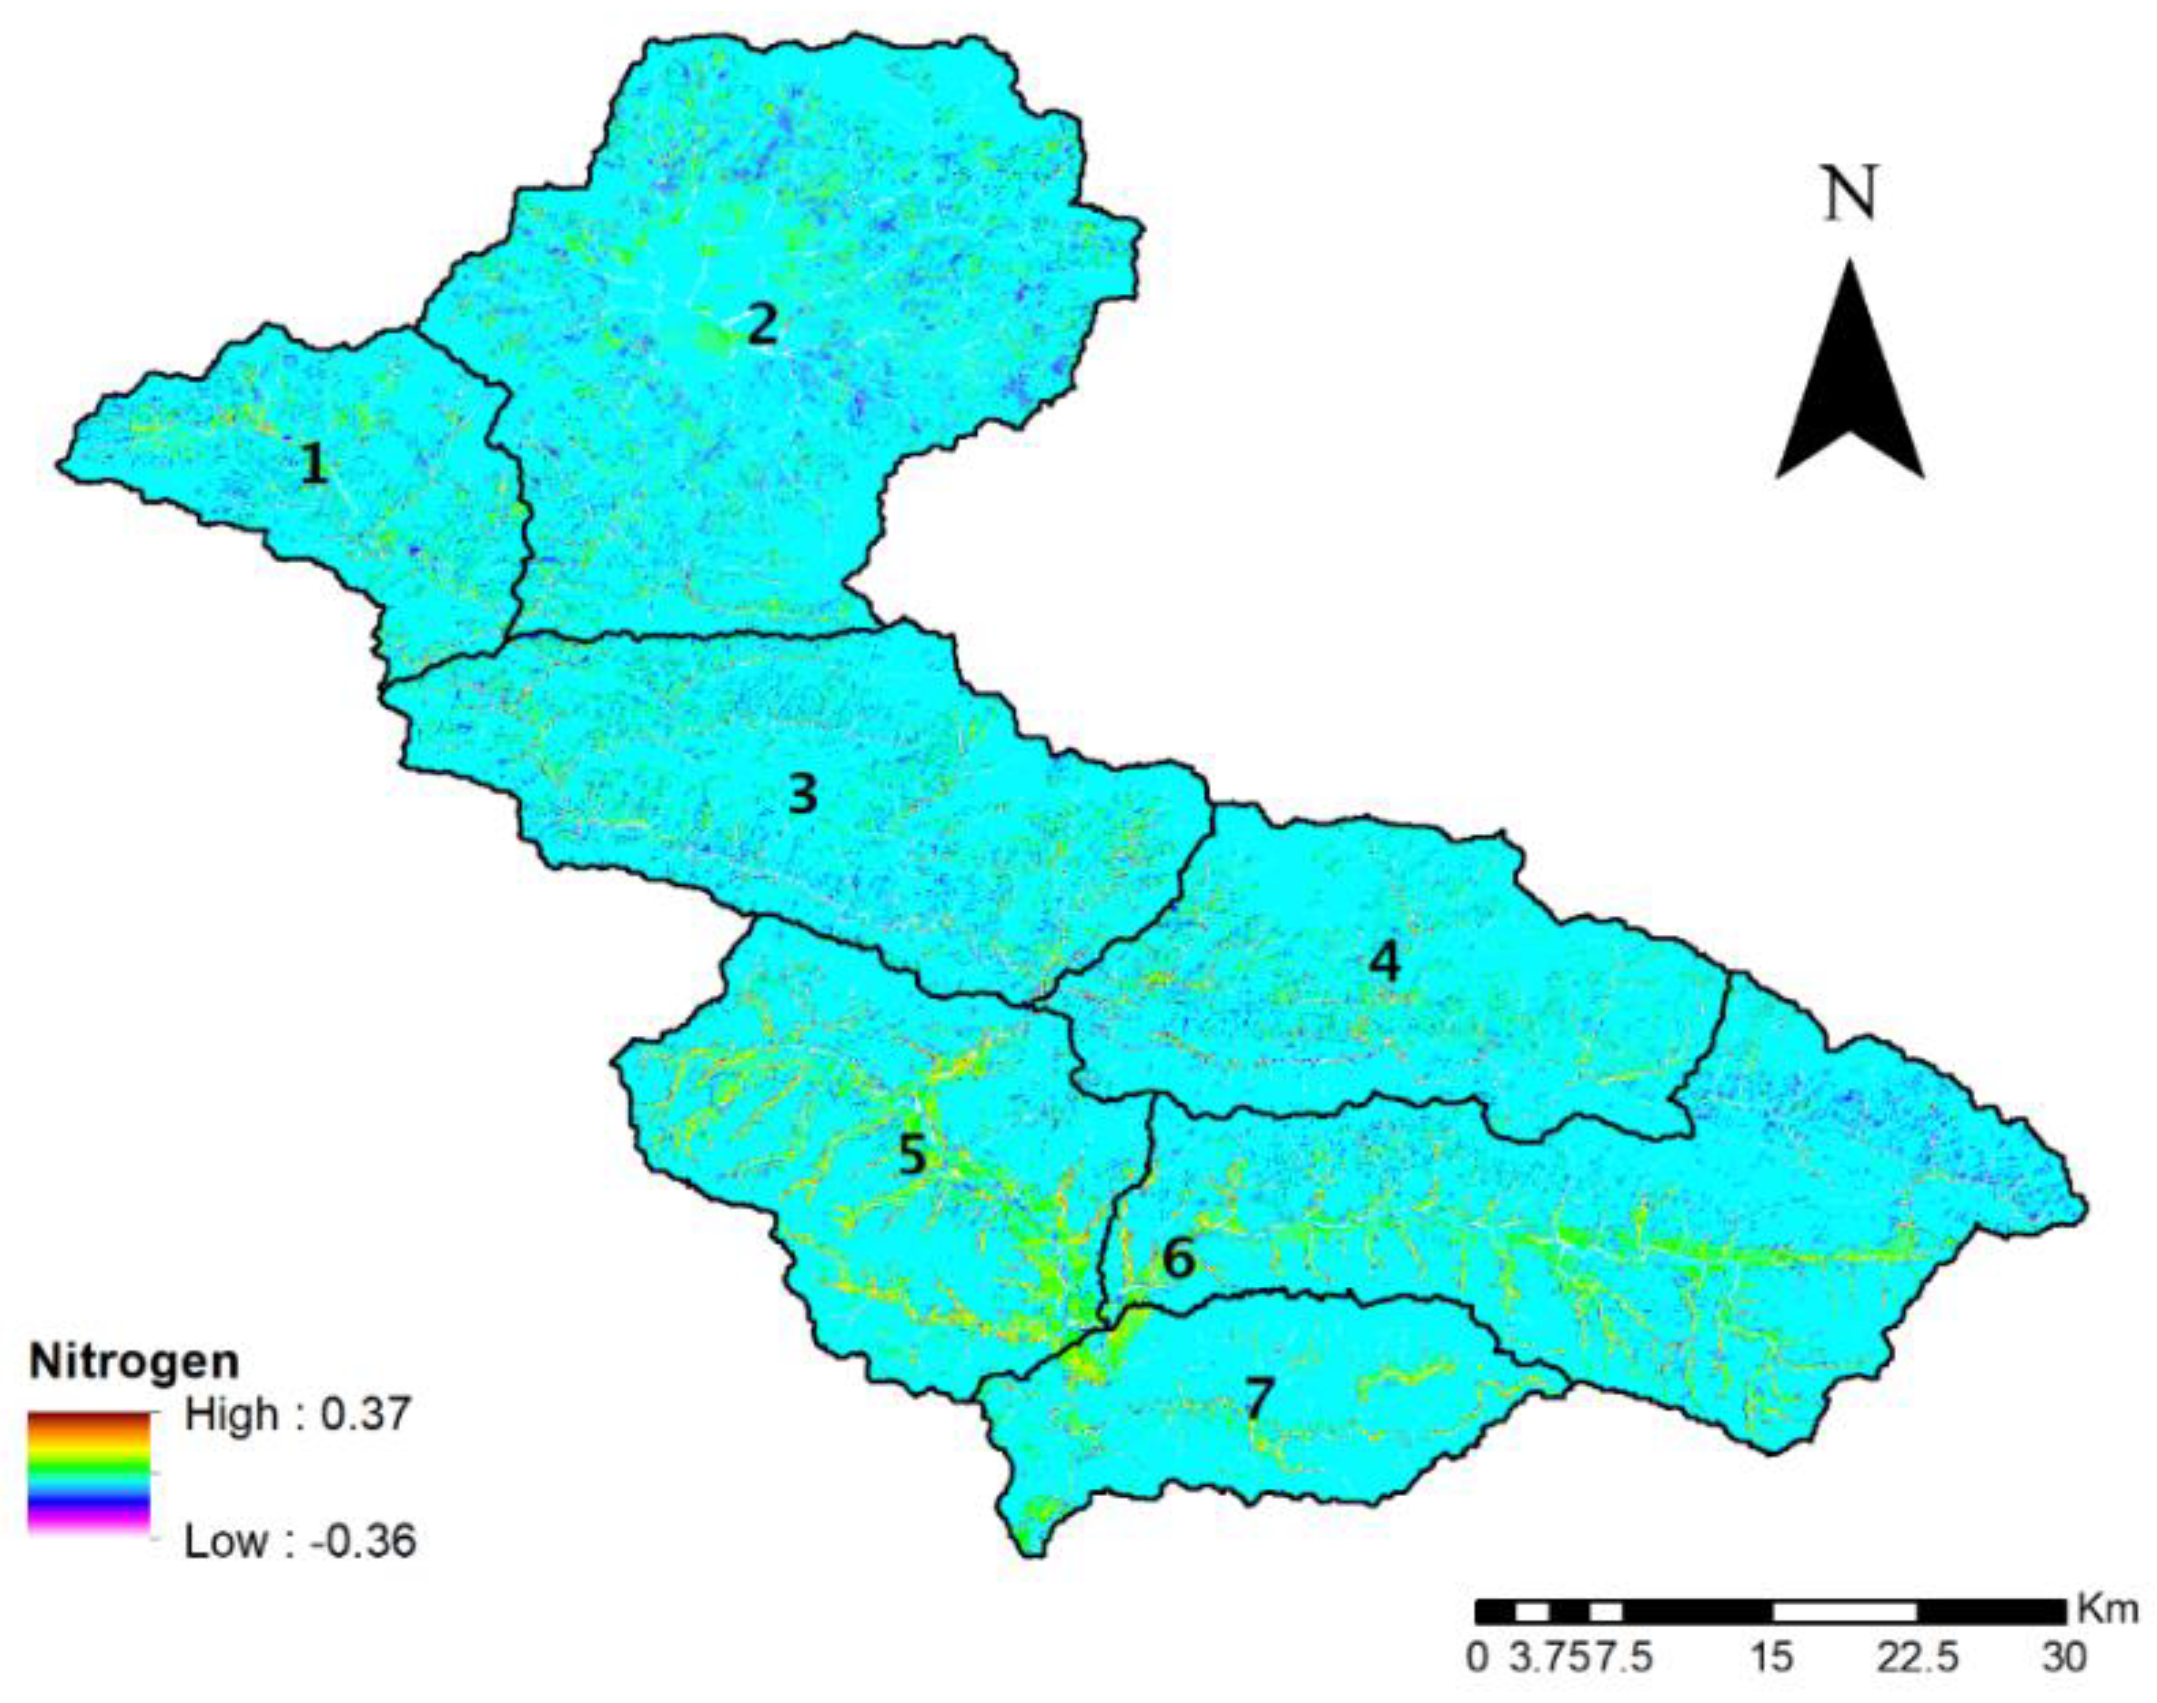
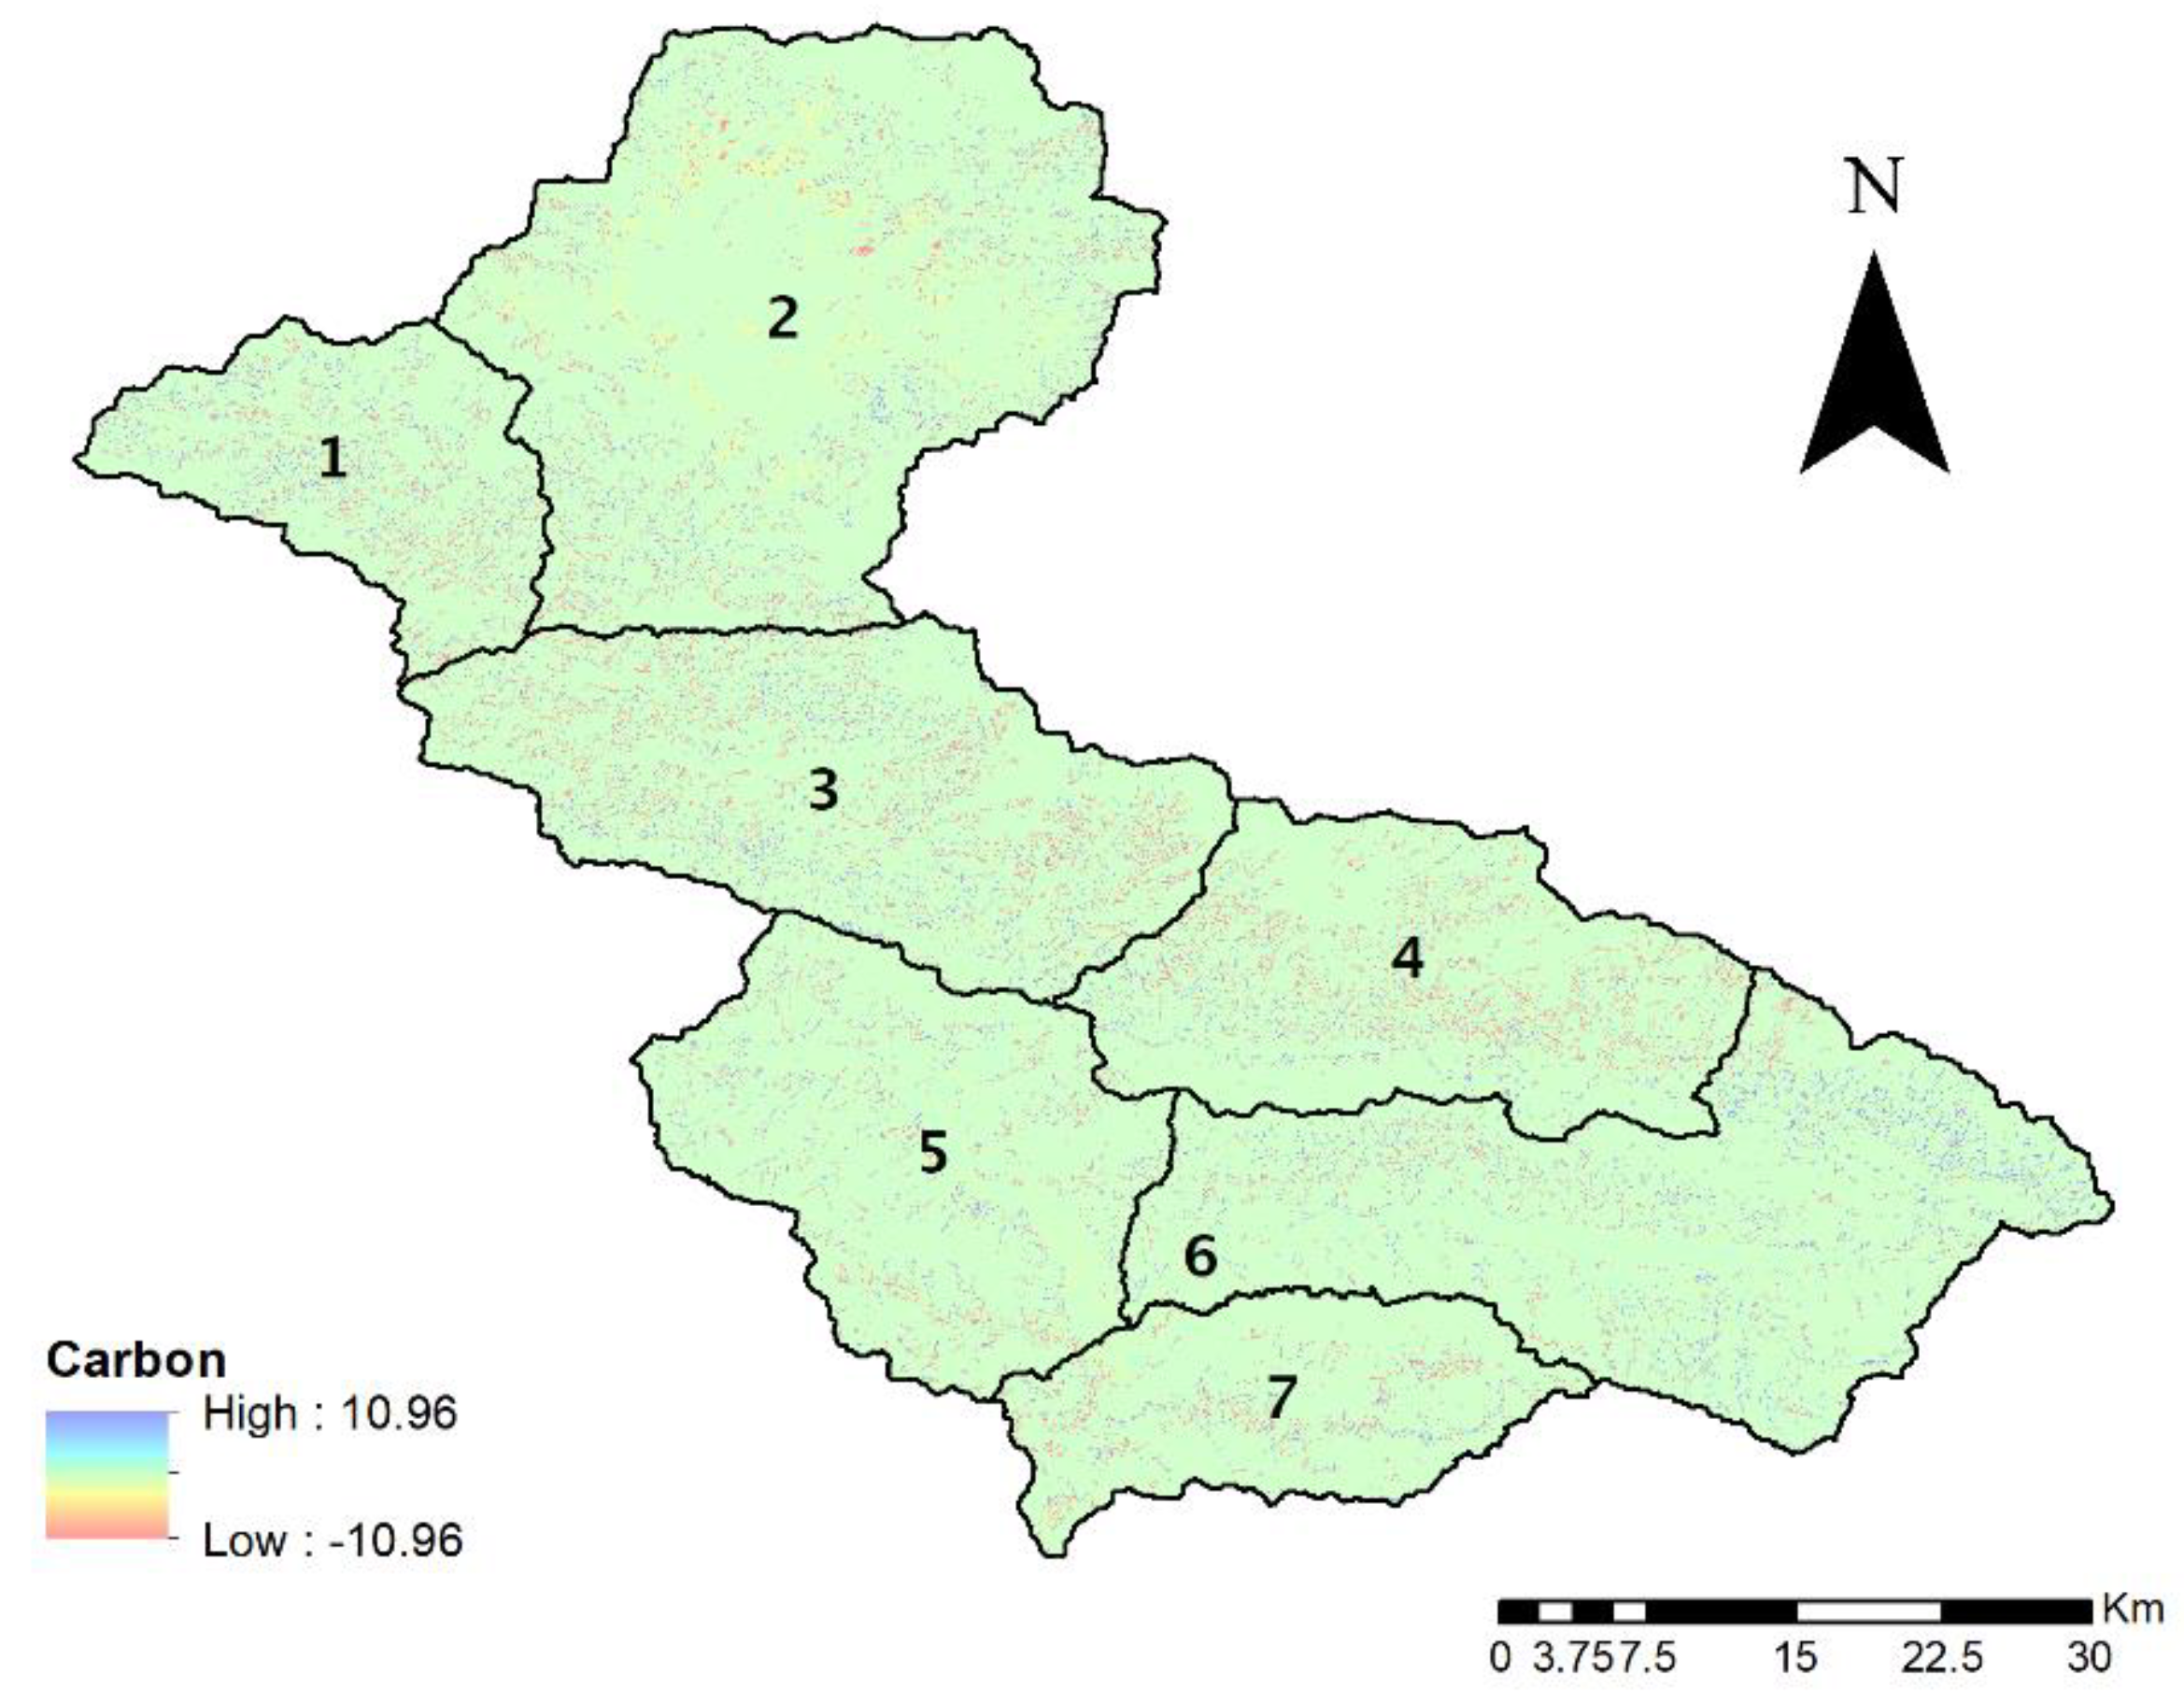
The loss of carbon storage is another significant phenomenon observed in the study basin with a reduction in forest areas and increases in agricultural and built-up areas. Terrestrial-based carbon storage and sequestration are directly affected by LULC. The concentrated anthropogenic activities on the upper part of the basin, especially in sub-basin 2, contribute to the lowest carbon storage and highest nitrogen export per ha of land in this sub-basin. Most developing nations have serious problems with the degradation of forests and soils which have crucial implications for changing the global C pools [
62]. The information on carbon storage and fluctuations can help land managers to choose among sites for protection, harvest, or development. Furthermore, these maps can support multiple decisions by governments, NGOs, and stakeholders to offer incentives to landowners in exchange for forest conservation. Sub-classification of land use and consideration of altitudinal variation in various carbon pools produces more accurate results. Poudel et al. [
63] have found higher carbon stocks at the higher altitudinal gradient in the study conducted in the Panchase Conservation Area in Nepal. The study indicated that due to human disturbance, carbon stocks were low at low altitude. Temperature and precipitation also have significant effects on the carbon pool of various biomass [
64]. Thus, a detailed study with climate and elevation variation helps to produce an accurate estimate of carbon value.
Similarly, with increased agricultural activities, and reduced vegetation covers, nutrient retention diminishes and, hence, the amount of nitrogen entering the river network/water resources increases. This severely increases water contamination, thereby affecting human and aquatic health. Additionally, because of increased WY in future climate scenarios, nitrogen export is expected to increase in all sub-basins. In this scenario, spatial information on nutrient export and areas with the highest filtration can help land use planners to integrate the contribution of ecosystems in order to mitigate water pollution.
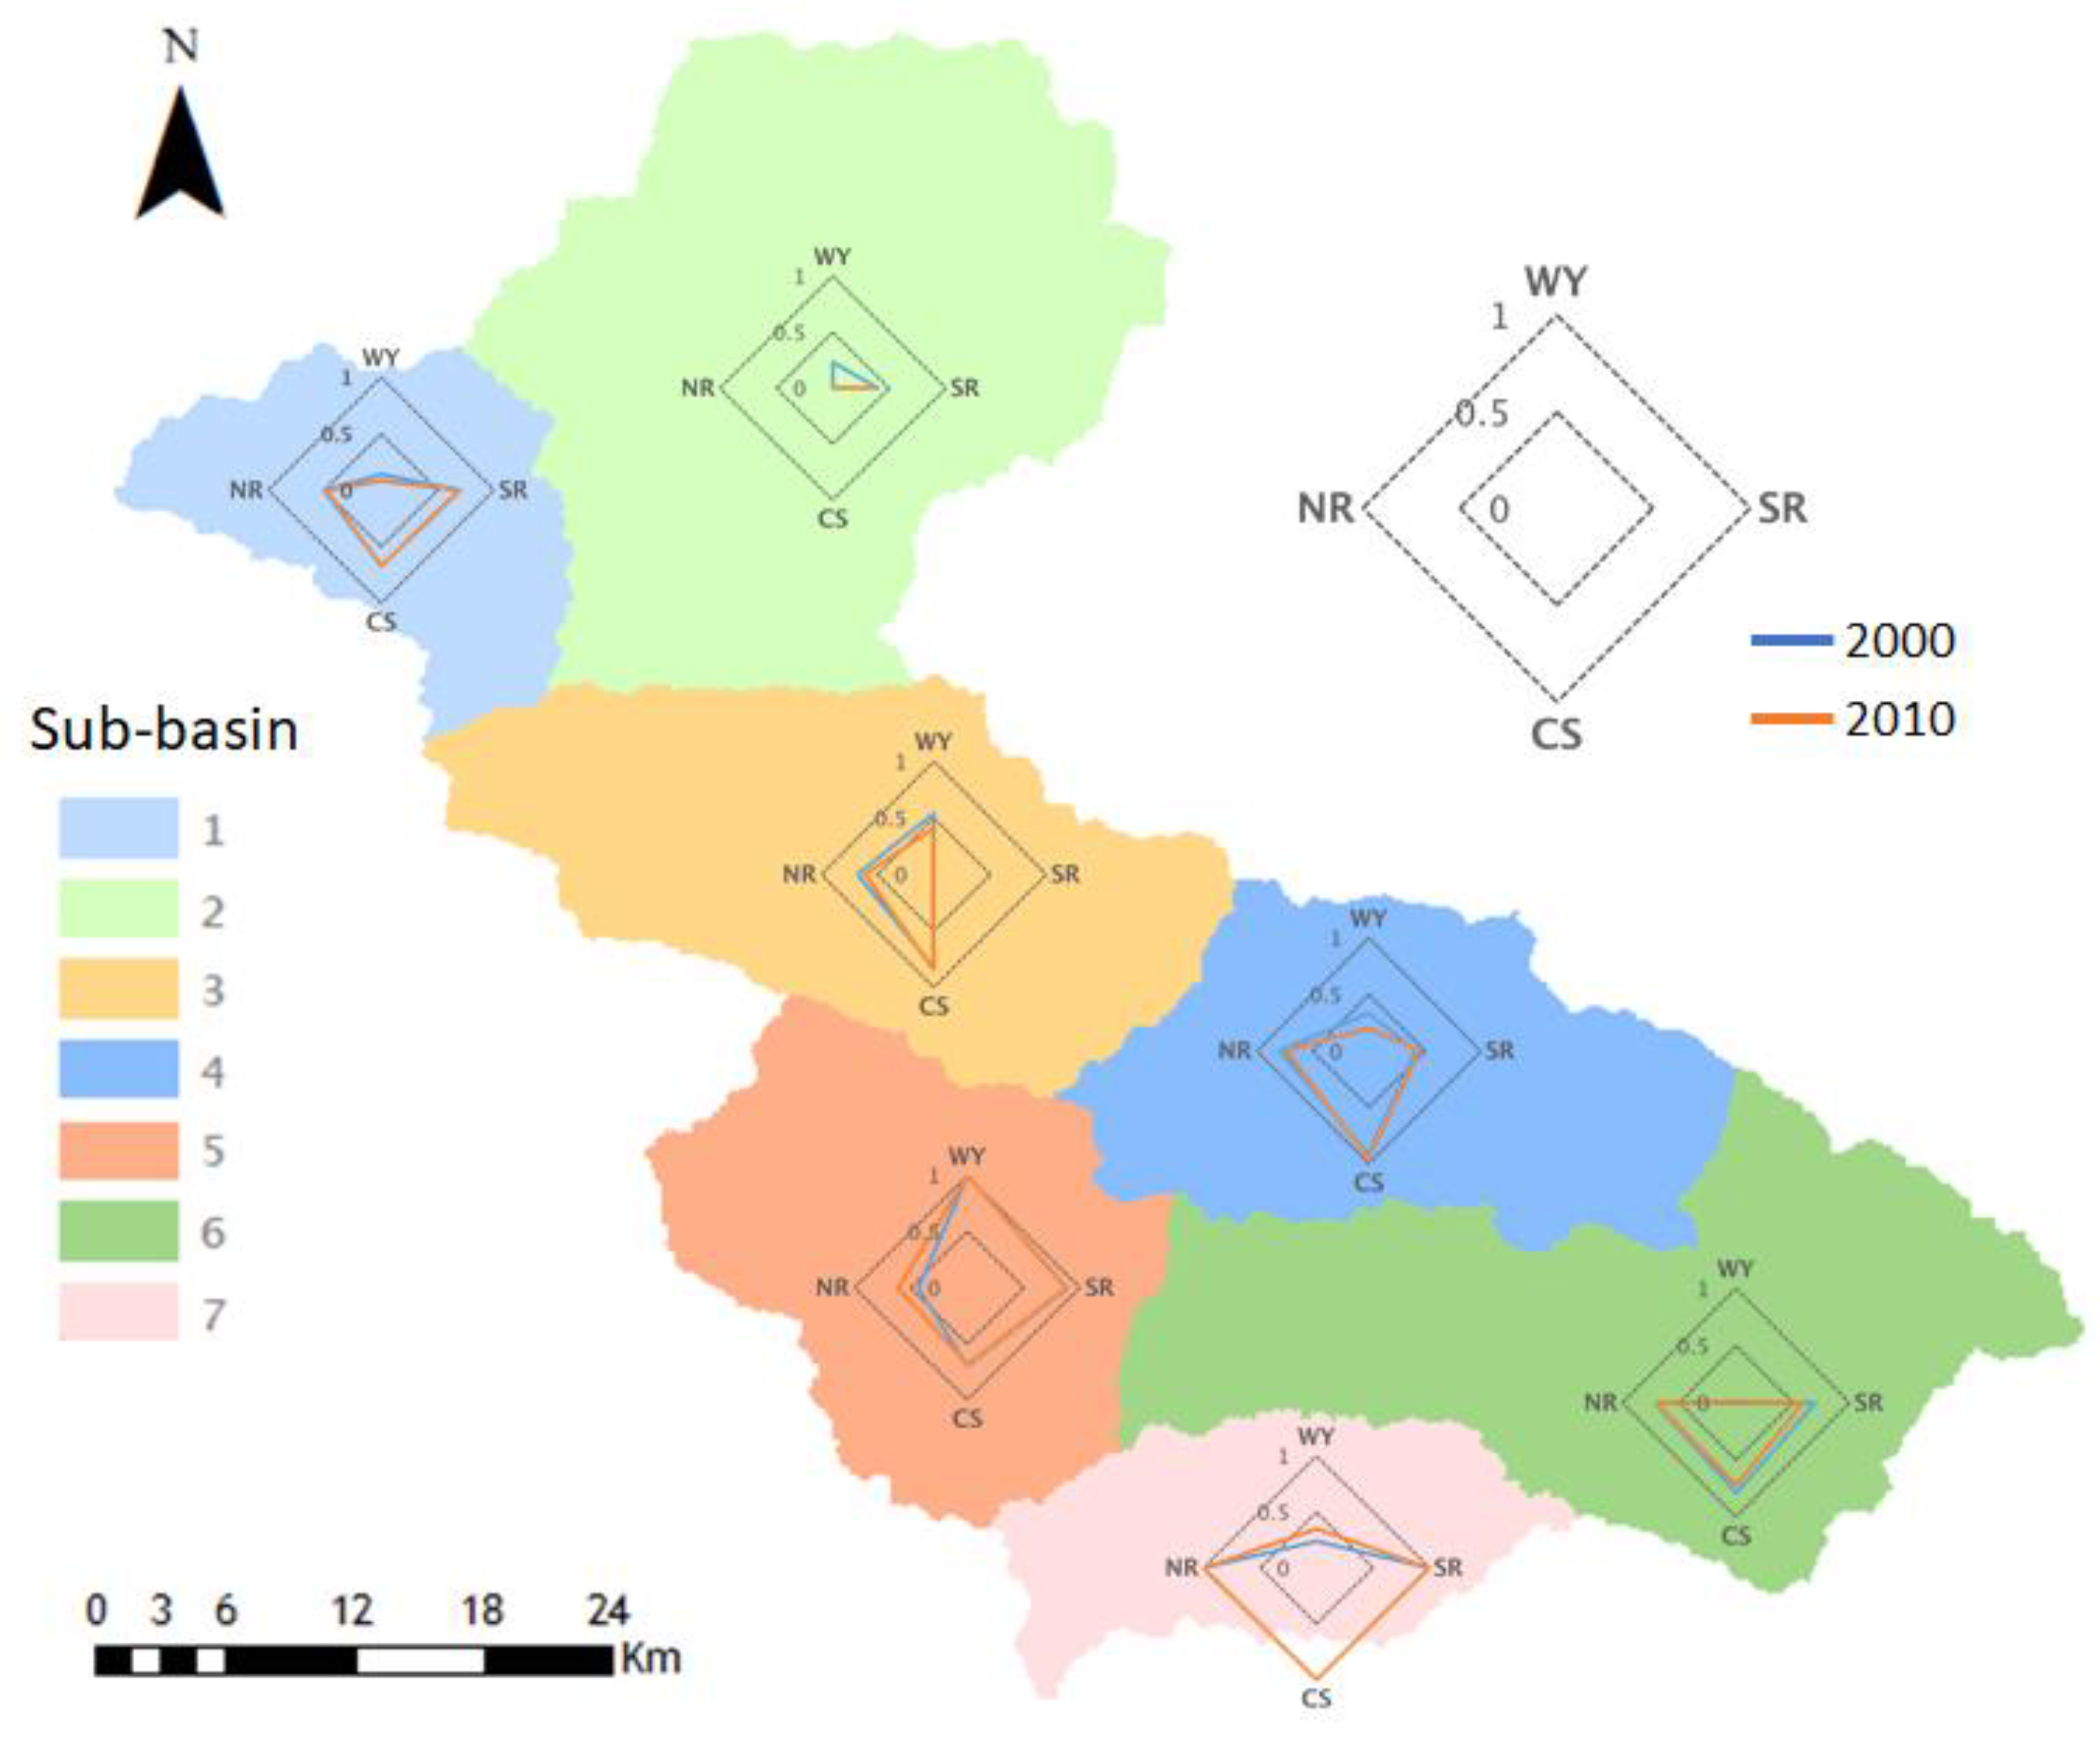
To understand the temporal change of ecosystem services in 2000 and 2010, the minimum value was set to 0 and the maximum value was set to 1 for each ecosystem service in two periods. This shows a comparative provision of ES in all sub-basins in the 2000 and 2010 periods which depicted that sub-basin 2 had the lowest combined ES provision in both 2000 and 2010 (
Figure 12). Thus, this indicates the need for urgent policies in order to restore the services and to promote its sustainability. Likewise, the computation of ES with the projection of climate data in the 2010–2099 period shows increased WY, soil loss, and nitrogen export from the study area. The case of sub-basin 2, especially of the Kathmandu Valley area, can be referenced for the planning of other emerging cities. As Nepal is prioritizing decentralization and focusing on the development of many other smart cities on the outskirts of the Kathmandu Valley and other parts of the country, studies like this can present risk analyses and help decision making that prioritizes the conservation of ES for the optimum utilization and preservation of natural capital.


