Abstract
Several cities in developing countries are challenging the permanent process of urbanization. This generates a great disturbance on the hydrological response of the urbanized area during rainfall events, which can cause floods. Among the disturbances that urbanized basins may suffer, it is found that variations in rain losses (hydrological abstractions) can be estimated by the named volumetric runoff coefficient (CVOL) methodology. In the present study, this methodology is used in an attempt to estimate the hydrological abstraction of two nearby urbanized basins, with different degrees of impermeability, located in the city of Cuenca in Ecuador. The data for that analysis were collected between April and May of 2017. The results obtained indicate that the micro-basin with the largest impervious area presents the higher initial hydrological losses, the higher rate of decrease in abstractions, and the higher stormwater runoff flows per unit area. In addition, the abstractions found in the two urban micro-basins show great sensitivity to the maximum rainfall intensity and do not relate to the antecedent soil moisture. These results demonstrate the importance of having higher pervious surfaces in urbanized areas because they lead to reduce negative impacts associated with increased stormwater runoff on impervious surfaces.
1. Introduction
At present, according to data reported in the Sustainable Development Goal 11 [1], around 3.5 billion people (50% of the world’s population) live in urban areas, and it is estimated that by 2030 this quantity will increase to about 60%. This increased growth is more pronounced in Latin America since the United Nations (UN) indicates that 77% of the population is urban [2]. This reality contributes to the fact that cities present deficiencies like inefficient functioning in the services that they provide and a lack of urban infrastructure [3].
The urbanization process includes several physical changes in the hydrographic basins, among them, the imperviousness of the urban area and the construction of rainwater drainage systems that replace natural evacuation routes to collect the runoff produced by these rainfall events. These changes have caused considerable modifications on the hydrological response of urbanized areas to a rain event [4] and, in agreement with Marsalek et al. [5], the water cycle can also be considerably modified. The aspects of the hydrological response that are affected by urbanization are the peak flow, the lag time, the frequency of the floods, and the total runoff produced in the basin [6]. This impact on the hydrological response of a basin caused by the urbanization can generate urban floods that lead to economic losses, pollution, and health problems [7].
Considering this problem, it is important for cities that are in a permanent urbanization process to undertake an estimate of the hydrological response of their urban basins to rain-runoff events. By doing so, this could provide engineering solutions and contribute to the management of rainwater in these areas. It has been verified that little information is available regarding the impact on hydrological abstractions that an urbanized basin has, which becomes a problem considering that urban drainage management currently presents new challenges [8].
By studying and understanding the hydrological response of an urban catchment, stormwater runoff can be analyzed which is one of the most important phenomena to provide engineering solutions. To improve the knowledge of this process, it is essential to know the hydrological abstractions [9,10]. Hydrological abstractions are the losses that occur in the process of transformation of rain into runoff, which is mainly produced by three different processes: infiltration below the ground surface, interception in vegetation or other surfaces, and storage in depressions that exist on the surface of the hydrographic basin [10,11]. In addition to the processes indicated, if a water balance is proposed to analyze hydrological abstractions, evaporation and evapotranspiration should also be considered because the evaporation may occur even when vegetation is scarcely diffused. However, since it is an analysis in an urbanized basin where there are few green areas, these losses are considered negligible, and therefore are not included within the abstractions [5]. Still, processes should be incorporated according to the particular characteristics of the studied basin. Following the literature, there are several methods to identify the basin abstractions, among them are the runoff coefficient [12,13], and specifically, the volumetric runoff coefficient (CVOL) [14,15].
The impact that different abstractions types have on the rainfall-runoff process in areas where the hortonian flow predominates (urbanized areas) is different from that which occurs in natural basins. For example, in the case of evaporation and infiltration in urban areas where it has been established that the contribution of these processes is substantially diminished; however, it has also been shown that evaporation and infiltration persist in urbanized areas altered by the dynamics of this environment without finding convergences regarding the level of impact of these processes [16]. Specifically for evapotranspiration, to understand its behavioral results is important because this abstraction is considered a sustainable way to manage the runoff [17]. Conversely, it has been established that in the permeable areas of urbanized watersheds, uncertainty persists about the role that these areas play in runoff processes [17]. Likewise, when the effects of land-use change are analyzed, this condition has a very significant influence on runoff processes when heavy rains occur [18]. Therefore, these uncertainties can lead to errors in estimating the hydrological response to rain events in urbanized basins, making it necessary to study them.
The Ecuadorian Andes has shown a tendency towards increased rainfall, especially during the rainy season due to the effects of climate change [19], which has increased the extreme events (floods) in rivers such as the Paute River and its tributaries [20]. Climate change could have more severe effects on rainfall-runoff processes [21]. Therefore, it is necessary to understand the hydrological response of an urbanized catchment in the cities located in the mountains of Ecuador.
Through this research, considering that the study areas show similar hydrologic conditions such as antecedent soil moisture, slope, drainage density, and mean temperature, we seek to understand the behavior of the hydrological abstractions of two urban micro-basins with different levels of impermeability located in the city of Cuenca, Ecuador, between April and May 2017. For this, the effect of variables such as the rainfall intensity, antecedent, and pervious soil moisture in each micro-basin for various rainfall-runoff events, as well as initial abstractions and runoff flow per unit area were estimated in each micro-basin. For this, we assumed the hypothesis that the water table variation processes do not affect the surface soil moisture based on what was found by Ragab et al. [22] and Chen and Hu [23], since it has been verified that the rainy season water table in the area under study is higher than 2 m deep. With this information, we seek to improve the knowledge of the behavior of hydrological abstractions in urban areas and contribute this information to the urban planning and management of the urban drainage system.
2. Materials and Methods
2.1. Study Area
Two micro-basins close in proximity to each other were studied in the urban area of the city of Cuenca, the capital of the Azuay province in Ecuador. Cuenca is a city with a population of 407,000 inhabitants in 2020 [24]. It is located in a valley of the Andes at an average altitude of 2500 m above sea level and is crossed by four rivers, the Tomebamba, Yanuncay, Machángara, and Tarqui, which belong to the Paute river basin. The rainfall season in Cuenca is bimodal and occurs between the months of February until the beginning of July, and between September and mid-November. The rest of the year is considered the dry season [25]. The average annual rainfall in Cuenca between 1977 and 2011 was approximately 879 mm per year and the yearly average temperature was 16.3 °C [26].
The sanitation system of Cuenca has around 1300 km (km) of sewerage networks and 80 km of sanitary interceptors that direct the wastewater to the Ucubamba Treatment Plant [27].
The studied micro-basins, T2 and T3 are located on the right bank of the Tomebamba River. Each micro-basin has an area of 19.45 and 56 ha, a similar slope of 2.2% and 2.3%, respectively, and a similar drainage density of 24.1 and 21.4 km.km−2, respectively (Figure 1). The analyzed micro-basins are urbanized areas presenting mixed characteristics, since T3 presents commercial and residential areas, with commercial characteristics prevailing, while T2 has characteristics that are mostly residential, and to a lesser extent commercial. Additionally, it should be noted that these areas evacuate stormwater runoff through a combined sewerage system that prior to its disposal in the river, discharges the wastewater flow to the sanitary interceptor. This sanitary interceptor leads to its treatment through a flow regulator structure (hydraulic structure), which for these urban catchments correspond to the type known as transverse weir with orifice.
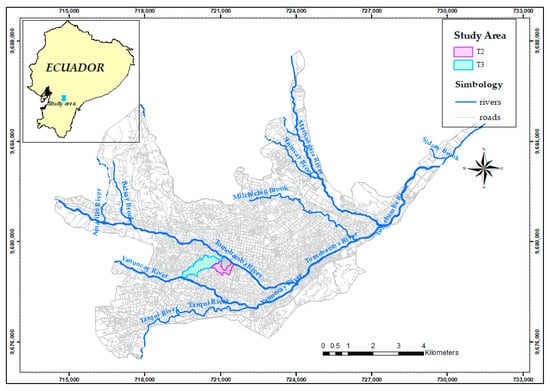
Figure 1.
Study area.
The impervious area in micro-basin T2 is around 60%, while in micro-basin T3, it represents 82% of the total area. This information was calculated through the supervised classification of land cover realized by using the orthophotos NV-F4b-F4, NV-F4b-F3, NV-F4b-F2, NV-F4b-F1 that was made by SIGTIERRAS (Spatial resolution: 0.3 × 0.3 m, Digital number and 4 bands: R, G, B, NIR) between September and October of 2010. For the analysis of orthophotos, QGIS and the open code Semi-Automatic Classification Plugin were used (SCP) (Figure 2).
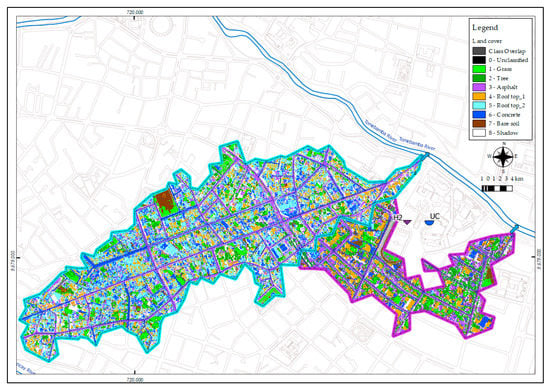
Figure 2.
Land cover on micro-basins T2 and T3.
2.2. Data Collection
The required data on stormwater runoff and rainfall for the hydrograph and hyetograph of the two micro-basins were collected during the period between 8 April and 14 May 2017, which corresponds to the first rainy season phase of the year in Cuenca. The stormwater runoff data were determined from the measured depths of the flow that is evacuated into the river from the sanitation discharges through the submerged probe module connected to the TELEDYNE ISCO 6712 equipment. This equipment measures and records the data every minute through a differential pressure transducer. It was installed in the discharge pipe of the sanitation system of each micro-basin studied (Figure 3).
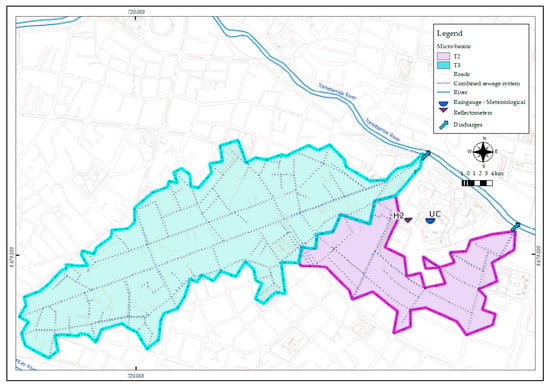
Figure 3.
Equipment location to measure rainfall, soil humidity, flow runoff and evapotranspiration.
To calculate the flow, the Manning equation was used. The slope and channel section data were determined with field measurements, while the channel roughness value (n) was obtained from the literature [28,29]. The estimation of the runoff hydrographs was calculated from a conceptual model of the diversion system, which considers the hydraulics of circular pipes and a balance of flows on the flow regulator structures (Equation (2)). The rainfall data used to build hyetographs and to calculate rainfall intensity of the two micro-basins only take into account one rain station called the UC, based on recommendations from the Guide to Hydrological practices Volume I [30]. The rain gauge at this station is Davis equipment with a 0.2 mm tip, and is located between the two analyzed micro-basins very close to their discharges (Figure 3). To calculate evapotranspiration, the FAO Penman Monteith equation was used, for which the temperature, relative humidity, net radiation, and wind velocity was obtained from the Davis meteorological station installed in the University of Cuenca. Finally, to obtain the moisture of the pervious soil, a CS625 Campbell water content reflectometer was used in the area between the micro-basins. The time scale for data recording of the equipment was 30 min (Figure 3), and calibration equations, previously established by the manufacturer, were used which vary according to the type of soil where the measurement was made. The hyetographs and hydrograph, which have been used in this research, were processed with a resolution of five minutes in order to capture the details (Figure 4).
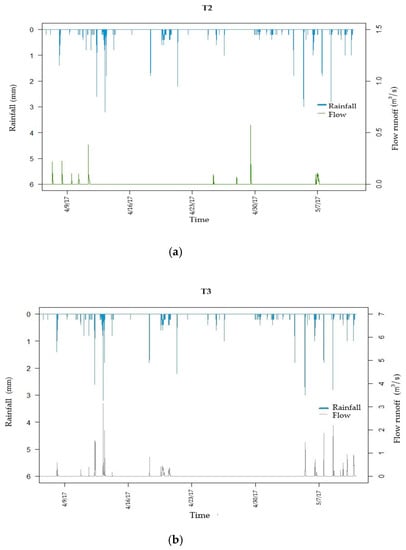
Figure 4.
Hydrograph and hyetograph for: (a) T2 and (b) T3.
2.3. Hydrological Abstractions Using a Lumped Model: Volumetric Runoff Coefficient
For the identification of excess rainfall, several models can be used, some of which focus on losses and others on runoff [11]. The losses approach, according to Pilgrim and Cordery [11], consists of a constant fraction of rainfall in each time period, or if the rainfall intensity does not vary, a proportion of the total rainfall. Among the methods that consider the loss approach is the volumetric runoff coefficient (CVOL), which is the transformation of the volume of rainfall to volume of runoff making it a simple method for determining abstractions from the analysis of rainfall and storm runoff over a period of time [12].
From the above, CVOL includes the lumped effect of all the factors that affect the water balance of the analyzed system, which may include evaporation, infiltration, errors in estimating flows and rainfall, and other abstractions that prevent rain from becoming runoff [31]. Another factor included in this effect is the loss in runoff that occurs due to the effects of the Combined Sewerage System (CSS). This is because the increase in storage capacity due to a dense drainage network can reduce generation runoff [16], significantly impacting the generation of surface runoff [32]. Consequently, in this research, hydrological losses in urban watersheds with CSS, in addition to the loss processes commonly established in the literature, include the effects produced by the drainage network. The CVOL was calculated as the ratio of the total depth of runoff and the total depth of rainfall (Equation (1)) as representing an average value of the event analyzed with the possible values between 0 and 1 [15].
where:
- RK: total runoff from each event (mm),
- PK: total rainfall of each event (mm).
To determine the PK values, the total rain height of each event was calculated, while to obtain the RK, the volume generated by the runoff (integration of the area under the curve of the hydrographs of each event) was divided by the area of the contributing micro-basin. To construct the hydrographs due to rain runoff (QRAIN), a balance equation was proposed that responds to the system studied (Figure 5):
where:
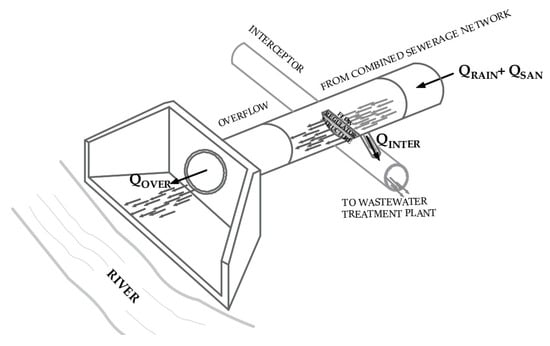
Figure 5.
Balance scheme for the studied basin.
- QINTER: flow to the interceptor sewer,
- QOVER: combined sewerage system overflow,
- QSAN: sanitary flow.
The QOVER was obtained by using the flow depths measured during the monitoring period, while the QSAN was determined from parameters such as water demand, return factor [33], and the population of the micro-basin. The latter was determined from information published by the Ecuadorian Institute of Statistics and Census (INEC) [34]. For the QINTER estimation, due to the characteristics of the flow regulator structure, its estimate depends on the flow depth that occurs during each overflow.
To estimate the flow depth, it was determined that the most realistic approximation of the operation of the weir corresponds to one with a short-crested weir. The formulation of the discharge equations for this type of weir with a non-rectangular control section is similar to that for broad-crested weirs [35]. Consequently, it can be assumed that the hydraulic head that occurs at the crest of this type of weir is equal to the critical depth. As stated by Clemmens et al. [36], an expression in terms of dimensionless relationships for the flow in circular channels can be obtained from the valid expressions for broad-crested weirs with critical flow from which the value of depth of the weir’s upstream water can be estimated. This is the value with which the QINTER will be calculated using submerged orifices expressions [37].
Once the QRAIN (Equation (2)) was obtained, the hydrographs were constructed. However, since the QOVER measures were done downstream from the water of the weir, the hydrographs were incomplete because the information from both the beginning and ending of the hydrographs was not recorded. This was because at those moments, the depth flow did not exceed the height from the weir. To complete this information, the data from the recession and concentration curves of each event were extrapolated.
To analyze individual rainfall-runoff events, it was necessary to establish the criteria to define the events by selecting the minimum inter-event time (MIT) method. This method has not been standardized, but a range of between 10 and 60 min is recommended [38]. For this study, it was established that the MIT is 30 min and to complement it, the hydrographs were also analyzed. Finally, once the CVOL was achieved for each event, the value corresponding to the hydrological abstractions (Abs) that occurred was calculated through Equation (3):
3. Results
During April 8 and May 14 of 2017, 12 and 15 rain runoff events were determined for the T2 and T3 micro-basins, respectively. The time series of the abstractions recorded for the micro-basins under study, and the rainfall intensities produced in this period are presented in Figure 6.
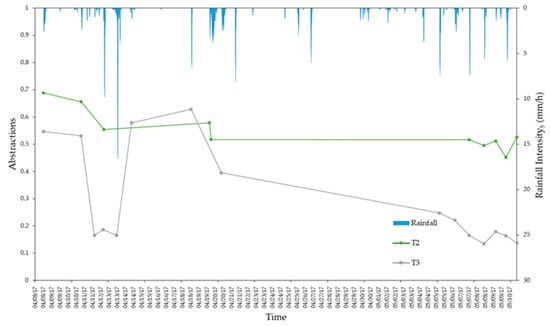
Figure 6.
Variation of rain intensity and abstractions in the T2 and T3 micro-basins.
Figure 6 shows that the tendency of hydrological loss is higher in the micro-basin with the highest permeability. In addition, sudden variations in abstractions were observed in the two micro-basins because of the increase in rainfall intensity, which is more noticeable in T3 (more impervious micro-basin). In the same way, it was registered that the proximity of the events also affects the value of hydrological losses. It was noted that the closer the events are to each other, the greater the losses of the micro-basin, despite the fact that the events that produce them have low rainfall intensities. Furthermore, the value obtained on 24 March in T2 was identified as incongruous (Figure 6); therefore, for subsequent analyses, these data were discarded.
To begin the search for the relationships between the hydrological response of the micro-basins and their abstractions, information such as the rainfall runoff of each event, the initial abstraction, and the hydrological reduction factor for each micro-basin were quantified (Figure 7).
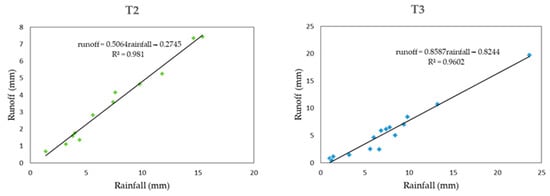
Figure 7.
Determination of initial abstractions and hydrological reduction factors for micro-basins T2 y T3.
Corresponding the initial abstraction to the value of the rainfall in the regression line when the runoff is null, values of 0.54 mm and 0.95 mm, respectively, were found for T2 and T3. These values indicate that the micro-basin with the highest pervious area, (T2), corresponds to the lowest initial abstraction and vice versa. Additionally, the micro-basin with the largest impervious area (T3) shows a greater slope (hydrological reduction factor) in the regression line.
However, as previously indicated, the moisture of the pervious soil was measured as between 0 and 0.30 m (Figure 8). This shows the behavior of hydrological losses over time for the two micro-basins as well as the variation in measured soil moisture. In Figure 8, the moisture of the pervious soil increases, while the values of the hydrological losses in the two micro-basins show a decrease as the rainy stage passes. Conversely, in the case of T3 (higher impermeability) the losses decrease at a higher rate and its last value of registered abstraction is smaller than the corresponding T2 value.
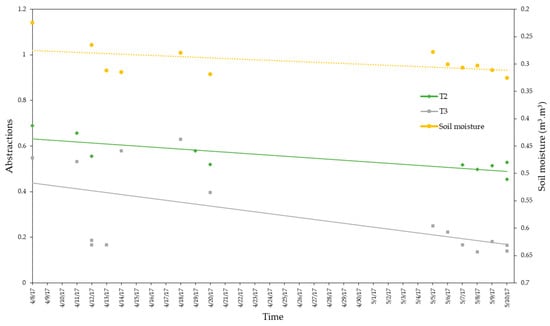
Figure 8.
Variation of soil moisture (0–0.30 m) and abstractions in the T2 and T3 micro-basins.
To study the behavior of the T2 and T3 micro-basins, coincidental rainfall-runoff events were analyzed. Based on the total number of events recorded in each micro-basin, seven coincidental events were analyzed. Table 1 presents the statistical results found for each micro-basin. Regarding hydrological losses, for T3, it was determined that the maximum value recorded was 0.55 mm and the minimum was 0.13 mm, while for T2, which has a pervious surface 1.36 times higher, the maximum value reached was 0.69 mm and its minimum was 0.45 mm. Regarding the evapotranspiration, it was found that for T2, the incidence of evapotranspiration in the context of total losses of the micro-basin varies between 3% and 12%, while for T3, the incidence of this abstraction was between 10% and 33%.

Table 1.
Results of the hydrological abstractions of coincidental events in the two micro-basins studied.
Additionally, the individual behavior of the seven coincidental rainfall-runoff events in the micro-basins was studied (Figure 9). It was observed that the largest abstractions occurred in T2, and that their decreasing rate was lower than that obtained for T3. Moreover, this figure shows the sensitivity that occurs in abstractions to a sudden change in rainfall intensity in both micro-basins. This implies that before an increase in intensity, the hydrological losses decrease again or decrease at a higher rate. This sensitivity is noted to be greater in the case of T3.
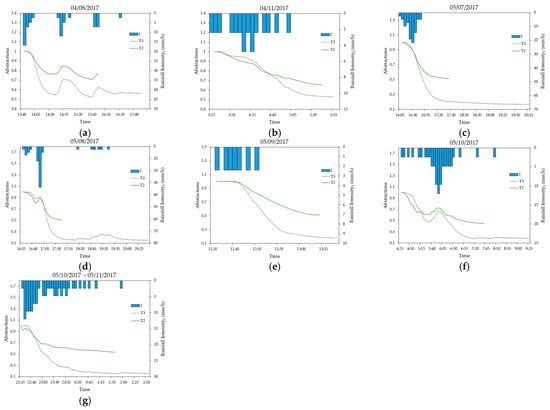
Figure 9.
Variation of the abstractions with respect to the rain intensity for the T2 and T3 micro-basins, in 7 coincidental rain events: (a) 04/08/2017, (b) 04/11/2017, (c) 05/07/2017, (d) 05/08/2017, (e) 05/09/2017, (f) 05/10/2017 and (g) 05/10/2017-05/11/2017.
In the same way as in Figure 8 and Figure 9, it was observed that as the rainy season progresses, the lower limit of the hydrological losses in each event does not tend to show a fixed value, but decreases in both micro-basins as the rainy season continues. Furthermore, during the study period, an analysis of the variation in soil moisture was measured as 0–0.3 m (Figure 8). The behavior of the humidity in three rainfall-run-off events was obtained, and the results are shown below in Figure 10.
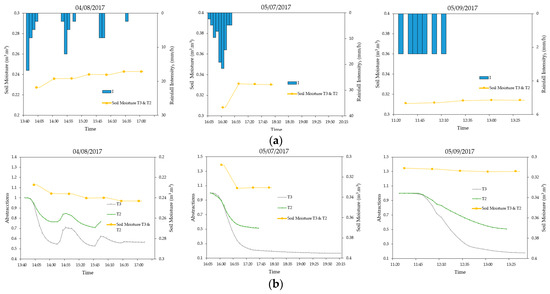
Figure 10.
(a) Variation of soil moisture (0–30 cm) with respect to rainfall intensity. (b) Variation of abstractions with respect to soil moisture (0–30 cm) and antecedent moisture.
From the analysis of soil moisture behavior (0–0.3 m) with the intensity of rainfall (Figure 10a), it was concluded that the soil moisture reflects a sensitivity to variations in the intensity of rainfall, as occurs with abstractions. While, in Figure 10b, taking into account that the antecedent soil moisture corresponds to the first humidity data in the analyzed event, it was found that for the event of 4 August, the measured antecedent humidity was 22% while for the remaining events, it was around 31%. In the first case, it was observed that the abstractions for the T3 micro-basin reached an approximate value of 0.6 mm, while for T2, it measured around a value of 0.75 mm. For the remaining two events, the abstractions for T3 reached a value of 0.15 mm, and 0.6 mm for T2. Moreover, from the values presented in Table 1, it can be determined that in the events studied, the lowest antecedent soil moisture also corresponds to the highest abstractions.
To complement this micro-basin analysis, the normalized flow duration curve was constructed with respect to each contribution area (Figure 11) for the events in common, finding that the curve of T2 is more flattened with respect to T3. Additionally, there was evidence that the flows per hectare of runoff produced in T3 were higher than those observed in T2.
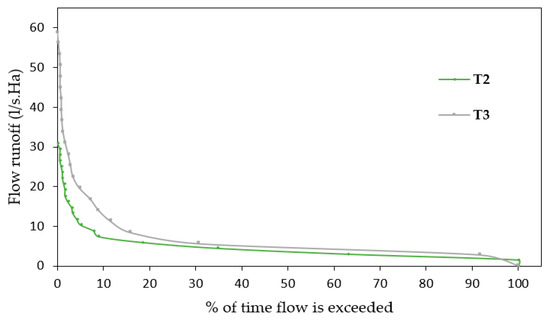
Figure 11.
Normalized flow duration curve for the T2 and T3 watersheds.
4. Discussion
It is important to indicate that for the analysis of the abstractions in the two micro-basins, the influence of evapotranspiration was studied because there exist contrary positions about the role of evapotranspiration in abstractions of urban areas. According to the results, there exists a low incidence of evapotranspiration for the micro-basin with a higher pervious area. This is explained because the generation of total losses that occur for this area due to other phenomena such as interception and infiltration are much higher. Therefore, it could be concluded that this phenomenon for the micro-basin with higher pervious areas is less important than the others. Therefore, in such a case, evapotranspiration would be negligible, coinciding with what was indicated by Marsalek et al. and Ogden et al. [5,38]. Conversely, the high incidence of evapotranspiration for the micro-basin with the smallest pervious areas is considerable compared to the total abstractions mainly due to evaporation. Therefore, the evapotranspiration would not be negligible, which is concomitant with that indicated by Ragab et al. [22].
The rainfall-runoff relationship of all analyzed events for each micro-basin shows that the highest initial abstractions, corresponding to losses that were due to depression storage and surface wetting [5]. This happened for the micro-basin with the most impervious area (T3), and the value found for this micro-basin was within the range of initial losses for impervious areas of residential use (0.7 mm−2.5 mm) [39]. Regarding the T2 micro-basin, the value obtained in this work was lower than the values for residential areas given by Geiger et al. [39] (Figure 7).
Regarding the slope of the regression line from the rainfall-runoff data, this represents a fraction of the rain that reaches the impervious area and runs off to the sewer [40]. When comparing the results obtained, it confirmed that in the impervious area of the T3 micro-basin, there was greater runoff than in the impervious portion of the T2 micro-basin. Therefore, the least abstractions occurred in the impervious zone of the T3 micro-basin, which is possibly due to the type and condition of impervious surfaces.
The hydrological abstractions in the micro-basin with the higher pervious area (T2) caused an important attenuation on the runoff volume, because T2 registered an abstraction of up to 0.69, which represented 25% more than the maximum registered for the micro-basin with the smallest pervious area. These values are concurrent with what was determined by Guan et al. and Ramier et al. [10,41]. For the minimum values of abstractions, this tendency was also evident. However, the relationship between these values was much greater than that recorded for the maximums (3.15 times), obtained in this study.
However, when the flow duration curve of the micro-basin’s hydrological performance was analyzed, it showed that T3 produced runoff flows among 1.3 and 1.9 times per unit area with respect to T2. This may have occurred in T3 due to lower hydrological losses produced by the impermeability level that it presented, which was similar to that found in the study carried out by Sun et al. [42] (Figure 11).
As rainfall intensity is a variable to which the hydrological response of a hydrographic basin is very sensitive [43], the relationship this has with respect to the abstractions analyzed in Figure 6 and Figure 9 suggests that there is a sensitivity in the two micro-basins concerning to the variation of the maximum intensity of the rainfall. When analyzing this relationship in each coincidental event, it was determined that, in the presence of relatively high rainfall intensities, the abstractions suddenly elevated their rate of decrease. This effect is noticeable when several intensity peaks occur within the same event. Conversely, when there is rainfall with lower and constant maximum intensities, the abstractions tend towards a uniform rate of decrease.
In the less urbanized micro-basin (T2), the abstractions are also sensitive to the maximum intensity of the rainfall, despite the existence of factors for abstractions. This was produced because the rainfall intensity exceeds the infiltration rate, the rapid decrease in interception, because the surfaces were wet [16] and the storage capacity varied. The latter had a very low impact on the abstractions for these rainfall intensities [32]. Meanwhile, in the more urbanized micro-basin, this sensitivity was similar to that found by Ogden et al. [44] because when high intensity events occur, the hydrological response of the micro-basin developed in a short time caused two kinds of variations. The first was higher flow peaks, which can increase to a range of between 5 and 50 times, and the second was the time reductions response which was between 20 and 50% [5].
Analyzing coincidental events, a gradual decrease in the final values of hydrological losses in both micro-basins (Figure 9) was observed; similar results have been found at Harry’s Brook [43]. It is possible that this decrease in pervious surfaces was due to the variation of the infiltration capacity of the surfaces, which was determined by the increase in pervious soil moisture. This variation is also explained because the pervious areas act as semi-impervious areas due to the compaction processes undergone at the time of urbanization [4,16], which increases with the maximum intensity of the rainfall. Meanwhile, in the impervious areas, the decrease in hydrological losses was due to the diminishing storage capacity in the superficial depressions (Figure 8).
In this research, the behavior of the abstractions with respect to the antecedent humidity was also analyzed. In this regard, Miller et al. and Yang et al. [43,45] found that the antecedent moisture in urban areas did not play a determinant role in generating runoff. This statement was confirmed by the evidence recorded in this study of the events of 8 April and 7 May 2017, since, for the antecedent moisture conditions of pervious soils (variation of up to 35%), the decreasing rate of change of the abstractions is very pronounced and similar during two humid conditions (−0.010 and −0.006 for T3 and T2, respectively). Therefore, this variable did not have a decisive influence on the generation of runoff in the studied watershed (Figure 10b).
5. Conclusions
The main purpose of this research has been to contribute to the knowledge of the hydrological response of urban basins, through the determination of hydrological abstractions in two contiguous urban micro-basins with similar drainage density and mean slope but with different levels of impermeability. The results show that the rainfall intensity is a key factor that determines the behavior of the processes of abstractions. It is this parameter that controls the stormwater runoff in urbanized micro-basins. Conversely, it was found that for the analyzed micro-basins, the urban micro-basin with impervious areas that were 1.36 times higher experienced an increase in runoff per unit area between 1.3 to 1.9 times higher. This shows the advantage of generating less impervious urban areas. Based on these results, the importance of having higher pervious surfaces in urban areas is demonstrated, because while the hydrological abstractions increase, their rates decrease when the rainy season passes. These pervious surfaces improve their hydrological response to rain events, reducing negative impacts associated with increased stormwater runoff on impervious surfaces, and become essential tools for the planning and management of urban drainage systems. Additionally, it was found that for the studied area, evapotranspiration in the urban micro-basin with a higher pervious area can be omitted while that which occurs in the micro-basin with a smallest pervious area should be included.
It is important to note that the present research has been limited by not having field data related to the roughness coefficient n, QSAN, and the flow corresponding to the infiltration of the CSS. This information would have allowed a better representation of the behavior of the study areas. However, it is considered that, with the guidelines established in the applied methodology, the indicated limitations and any error that may have been derived from the system used to measure the QOVER causes the results to be considered reliable. In addition, due to the flooding from the river, several events with rainfall runoff were not able to be recorded in the micro-basins.
It is important to note that with the information found in the present work, it is also possible to generate research that, through simulations, compares the magnitude of the effect of an urbanization process with scenarios that consider aspects that affect, to a lesser extent, the hydrological responses of urban areas.
Author Contributions
Conceptualization, R.R.-R. and D.M.-S.; methodology, R.R.-R.; software, R.R.-R.; validation, D.M.-S. and R.J.-C.; formal analysis, R.R.-R., D.M.-S. and R.J.-C.; investigation, R.R.-R.; resources, D.M.-S. and R.J.-C.; data curation, R.R.-R. and D.M.-S.; writing—original draft preparation, R.R.-R.; writing—Review and editing, R.R.-R. and R.J.-C.; visualization, R.R.-R., D.M.-S. and R.J.-C.; supervision, D.M.-S. and R.J.-C.; project administration, R.J.-C. All authors have read and agreed to the published version of the manuscript.
Funding
This research was funded by the VLIR-UOS IUC Programme—University of Cuenca and the VLIR Ecuador Biodiversity Network project and Wastewater Management Municipal Company ETAPA—EP.
Institutional Review Board Statement
Not applicable.
Informed Consent Statement
Not applicable.
Data Availability Statement
Not applicable.
Acknowledgments
This research was executed in the context of the VLIR-UOS IUC Programme—University of Cuenca and the VLIR Ecuador Biodiversity Network project. The authors would also like to extend their gratitude for collaboration with the Water Supply and Wastewater Management Municipal Company ETAPA—EP, the Water and Soil Management Program PROMAS—University of Cuenca.
Conflicts of Interest
The authors declare no conflict of interest.
References
- Naciones Unidas Ciudades y Comunidades Sostenibles. Available online: http://www.un.org/sustainabledevelopment/es/cities/ (accessed on 15 November 2017).
- Tucci, C.E. Urban Flood Management; World Meteorological Organization: Geneva, Switzerland, 2007. [Google Scholar]
- Carrión, F. Las Nuevas Tendencias de la Urbanización en America Latina; FLACSO, Sede Ecuador: Quito, Ecuador, 2001; pp. 7–23. ISBN 9978-67-057-2. [Google Scholar]
- Miller, J.D.; Kim, H.; Kjeldsen, T.R.; Packman, J.; Grebby, S.; Dearden, R. Assessing the Impact of Urbanization on Storm Runoff in a Peri-Urban Catchment Using Historical Change in Impervious Cover. J. Hydrol. 2014, 515, 59–70. [Google Scholar] [CrossRef]
- Marsalek, J.; Cisneros, B.J.; Karamouz, M.; Malmquist, P.-A.; Goldenfum, J.A.; Chocat, B. Urban Water Cycle Processes and Interactions: Urban Water Series-UNESCO-IHP; CRC Press: Boca Raton, FL, USA, 2008; Volume 2. [Google Scholar]
- Eslamian, S.; Mujere, N. Impact of Urbanization on Runoff Regime. In Handbook of Engineering Hydrology: Modeling, Climate Change, and Variability; Eslamian, S., Ed.; Taylor & Francis Group: Boca Raton, FL, USA, 2014; pp. 605–615. ISBN 978-1-4665-5247-0. [Google Scholar]
- Yao, L.; Wei, W.; Chen, L. How Does Imperviousness Impact the Urban Rainfall-Runoff Process under Various Storm Cases? Ecol. Indic. 2016, 60, 893–905. [Google Scholar] [CrossRef]
- Ávila, H. Perspectiva Del Manejo Del Drenaje Pluvial Frente al Cambio Climático-Caso de Estudio: Ciudad de Barranquilla, Colombia. Rev. Ing. 2012, 54–59. [Google Scholar] [CrossRef]
- Monsalve, G. Hidrología En La Ingeniería, Escuela Colombiana de Ingeniería; Escuela Colombiana de Ingeniería: Bogotá, Colombia, 2004. [Google Scholar]
- Ramier, D.; Berthier, E.; Andrieu, H. The Hydrological Behaviour of Urban Streets: Long-Term Observations and Modelling of Runoff Losses and Rainfall–Runoff Transformation. Hydrol. Process. 2011, 25, 2161–2178. [Google Scholar] [CrossRef]
- Pilgrim, D.H.; Cordery, I. Flood Runoff, Chap. 9 of Maidment, DR, Ed., Handbook of Hydrology; McGraw-Hill: New York, NY, USA, 1993. [Google Scholar]
- Chow, V.T.; Maidment, D.R.; Mays, L.W. Hidrología Aplicada, 1st ed.; McGraw-Hill: New York, NY, USA, 1994; ISBN 958-600-171-7. [Google Scholar]
- American Society of Civil Engineers. Standard Guidelines for the Design of Urban Stormwater Systems, ASCE/EWRI 45-05: Standard Guidelines for the Installation of Urban Stormwater Systems, ASCE/EWRI 46-05; Standard Guidelines for the Operation and Maintenance of Urban Stormwater Systems, ASCE/EWRI 47-05; ASCE standard; American Society of Civil Engineers: Reston, VA, USA, 2006; ISBN 978-0-7844-0806-3. [Google Scholar]
- Dhakal, N.; Fang, X.; Cleveland, T.G.; Thompson, D.B.; Asquith, W.H.; Marzen, L.J. Estimation of Volumetric Runoff Coefficients for Texas Watersheds Using Land-Use and Rainfall-Runoff Data. J. Irrig. Drain. Eng. 2011, 138, 43–54. [Google Scholar] [CrossRef]
- Guo, J.C.Y. Urban Flood Mitigation and Stormwater Management; CRC Press: Boca Raton, FL, USA, 2017; ISBN 978-1-315-26991-7. [Google Scholar]
- Cristiano, E.; ten Veldhuis, M.; van de Giesen, N. Spatial and Temporal Variability of Rainfall and Their Effects on Hydrological Response in Urban Areas—A Review. Hydrol. Earth Syst. Sci. 2017, 21, 3859–3878. [Google Scholar] [CrossRef]
- McGrane, S.J. Impacts of Urbanisation on Hydrological and Water Quality Dynamics, and Urban Water Management: A Review. Hydrol. Sci. J. 2016, 61, 2295–2311. [Google Scholar] [CrossRef]
- Wang, J.; Hu, C.; Ma, B.; Mu, X. Rapid Urbanization Impact on the Hydrological Processes in Zhengzhou, China. Water 2020, 12, 1870. [Google Scholar] [CrossRef]
- Morán-Tejeda, E.; Bazo, J.; López-Moreno, J.I.; Aguilar, E.; Azorín-Molina, C.; Sanchez-Lorenzo, A.; Martínez, R.; Nieto, J.J.; Mejía, R.; Martín-Hernández, N.; et al. Climate Trends and Variability in Ecuador (1966–2011). Int. J. Climatol. 2016, 36, 3839–3855. [Google Scholar] [CrossRef]
- Mora, D.; Campozano, L.; Cisneros, F.; Wyseure, G.; Willems, P. Climate Changes of Hydrometeorological and Hydrological Extremes in the Paute Basin, Ecuadorean Andes. Hydrol. Earth Syst. Sci. 2014, 18, 631–648. [Google Scholar] [CrossRef]
- Rezaei, A.R.; Ismail, Z.B.; Niksokhan, M.H.; Ramli, A.H.; Sidek, L.M.; Dayarian, M.A. Investigating the Effective Factors Influencing Surface Runoff Generation in Urban Catchments—A Review. Desalination Water Treat. 2019, 164, 276–292. [Google Scholar] [CrossRef]
- Ragab, R.; Rosier, P.; Dixon, A.; Bromley, J.; Cooper, J.D. Experimental Study of Water Fluxes in a Residential Area: 2. Road Infiltration, Runoff and Evaporation. Hydrol. Process. 2003, 17, 2423–2437. [Google Scholar] [CrossRef]
- Chen, X.; Hu, Q. Groundwater Influences on Soil Moisture and Surface Evaporation. J. Hydrol. 2004, 297, 285–300. [Google Scholar] [CrossRef]
- Instituto Nacional de Estadística y Censos Proyecciones Poblacionales. Available online: https://www.ecuadorencifras.gob.ec/proyecciones-poblacionales/ (accessed on 21 October 2020).
- Jerves-Cobo, R.; Lock, K.; Van Butsel, J.; Pauta, G.; Cisneros, F.; Nopens, I.; Goethals, P.L. Biological Impact Assessment of Sewage Outfalls in the Urbanized Area of the Cuenca River Basin (Ecuador) in Two Different Seasons. Limnologica 2018, 71, 8–28. [Google Scholar] [CrossRef]
- Jerves-Cobo, R.; Benedetti, L.; Amerlinck, Y.; Lock, K.; De Mulder, C.; Van Butsel, J.; Cisneros, F.; Goethals, P.; Nopens, I. Integrated Ecological Modelling for Evidence-Based Determination of Water Management Interventions in Urbanized River Basins: Case Study in the Cuenca River Basin (Ecuador). Sci. Total Environ. 2020, 709, 136067. [Google Scholar] [CrossRef]
- Montalvo-Cedillo, C.; Jerves-Cobo, R.; Domínguez-Granda, L. Determination of Pollution Loads in Spillways of the Combined Sewage Network of the City of Cuenca, Ecuador. Water 2020, 12, 2540. [Google Scholar] [CrossRef]
- Chow, V.T. Hidráulica de los Canales Abiertos, Primera ed.; Diana S. A.: Mexico, 1982; ISBN 968-13-1327-5. [Google Scholar]
- Torres, A.; Zarruk Serrano, G.A.; Borrero, J.A.L. Roughness Coefficient in Operational Sections of Sewage Systems. Rev. Inst. Univ. Tecnológica Chocó Investig. Biodivers. Desarro. 2009, 28, 85–92. [Google Scholar]
- World Meteorological Organization, (WMO). Guía de Prácticas Hidrológicas Volumen I Hidrología—De la Medición A la Información Hidrológica, 6 ed.; WMO: Ginebra, Switzerland, 2008; ISBN 978-92-63-30168-0. [Google Scholar]
- Visessri, S.; McIntyre, N. Regionalisation of Hydrological Responses under Land-Use Change and Variable Data Quality. Hydrol. Sci. J. Sci. Hydrol. 2016, 61, 302–320. [Google Scholar] [CrossRef]
- Salvadore, E.; Bronders, J.; Batelaan, O. Hydrological Modelling of Urbanized Catchments: A Review and Future Directions. J. Hydrol. 2015, 529, 62–81. [Google Scholar] [CrossRef]
- ETAPA EP, U. Análisis de La Demanda de Agua Potable; Empresa Pública Municipal de Telecomunicaciones, Agua Potable, Alcantarillado y Saneamiento de Cuenca, ETAPA EP: Cuenca, Ecuador, 2015; p. 8. [Google Scholar]
- Instituto Nacional de Estadística y Censos Censo de Población y Vivienda 2010; Instituto Nacional de Estadísticas y Censos: Quito, Ecuador, 2010.
- Bos, M.; Boiten, W.; Pitlo, R.; de Vries, A.; Kraijenhoff van de Leur, D.; Oostinga, H.; Wijidieks, J. Discharge Measurement Structures; Bos, M.G., Ed.; 3. rev. ed.; ILRI: Wageningen, The Netherlands, 1989; ISBN 90-70754-15-0. [Google Scholar]
- Clemmens, A.J.; Bos, M.G.; Replogle, J.A. RBC Broad-Crested Weirs for Circular Sewers and Pipes. Glob. Water Sci. Eng. Ven Te Chow Meml. Vol. 1984, 68, 349–368. [Google Scholar] [CrossRef]
- Zambrano. Recolección de Aguas Residuales; Editorial Universidad del Cauca: Bogotá, Colombia, 2015; ISBN 978-958-98664-7-4. [Google Scholar]
- Wang, J.; Fisher, B.L.; Wolff, D.B. Estimating Rain Rates from Tipping-Bucket Rain Gauge Measurements. J. Atmos. Ocean. Technol. 2008, 25, 43–56. [Google Scholar] [CrossRef]
- Geiger, W.F.; Marsalek, J.; Rawls, W.J.; Zuidema, F.C. Manual on Drainage in Urbanized Areas: Planning and Design of Drainage Systems; Unesco: Paris, France, 1987; Volume 1, ISBN 92-3-102416-7. [Google Scholar]
- Rasmussen, M.R.; Thorndahl, S.; Schaarup-Jensen, K. A Low Cost Calibration Method for Urban Drainage Models. In Proceedings of the Conf. Proc. 11th Int. Conf. Urban Drain. Edinb. Int. Conf. Cent. Scotl. 11 ICUD, Edinburgh, UK, 31 August–5 September 2008. [Google Scholar]
- Guan, M.; Sillanpää, N.; Koivusalo, H. Storm Runoff Response to Rainfall Pattern, Magnitude and Urbanization in a Developing Urban Catchment. Hydrol. Process. 2016, 30, 543–557. [Google Scholar] [CrossRef]
- Sun, Y.; Li, Q.; Liu, L.; Xu, C.; Liu, Z. Hydrological Simulation Approaches for BMPs and LID Practices in Highly Urbanized Area and Development of Hydrological Performance Indicator System. Water Sci. Eng. 2014, 7, 143–154. [Google Scholar] [CrossRef]
- Yang, L.; Smith, J.A.; Baeck, M.L.; Zhang, Y. Flash Flooding in Small Urban Watersheds: Storm Event Hydrologic Response. Water Resour. Res. 2016, 52, 4571–4589. [Google Scholar] [CrossRef]
- Ogden, F.L.; Pradhan, N.R.; Downer, C.W.; Zahner, J.A. Relative Importance of Impervious Area, Drainage Density, Width Function, and Subsurface Storm Drainage on Flood Runoff from an Urbanized Catchment. Water Resour. Res. 2011, 47. [Google Scholar] [CrossRef]
- Miller, J.D.; Hess, T. Urbanisation Impacts on Storm Runoff along a Rural-Urban Gradient. J. Hydrol. 2017, 552, 474–489. [Google Scholar] [CrossRef]
Publisher’s Note: MDPI stays neutral with regard to jurisdictional claims in published maps and institutional affiliations. |
© 2021 by the authors. Licensee MDPI, Basel, Switzerland. This article is an open access article distributed under the terms and conditions of the Creative Commons Attribution (CC BY) license (http://creativecommons.org/licenses/by/4.0/).