Article

Lifetime Analysis of Energy Storage Systems for Sustainable Transportation

1
Institute of Electrical Measurement and Measurement Signal Processing, Energy Aware Systems Group, Graz University of Technology, 8010 Graz, Austria
2
Institute of Machine Components and Methods of Development, Graz University of Technology, 8010 Graz, Austria
*
Author to whom correspondence should be addressed.
Sustainability 2019, 11(23), 6731; https://doi.org/10.3390/su11236731
Submission received: 15 October 2019 / Revised: 21 November 2019 / Accepted: 23 November 2019 / Published: 27 November 2019

Abstract

:
On the path to a low-carbon future, advancements in energy storage seem to be achieved on a nearly daily basis. However, for the use-case of sustainable transportation, only a handful of technologies can be considered, as these technologies must be reliable, economical, and suitable for transportation applications. This paper describes the characteristics and aging process of two well-established and commercially available technologies, namely Lithium-Ion batteries and supercaps, and one less known system, flywheel energy storage, in the context of public transit buses. Beyond the obvious use-case of onboard energy storage, stationary buffer storage inside the required fast-charging stations for the electric vehicles is also discussed. Calculations and considerations are based on actual zero-emission buses operating in Graz, Austria. The main influencing parameters and effects related to energy storage aging are analyzed in detail. Based on the discussed aging behavior, advantages, disadvantages, and a techno-economic analysis for both use-cases is presented. A final suitability assessment of each energy storage technology concludes the use-case analysis.

1. Introduction

Despite the enormous effort put into the reduction of greenhouse gases, CO2 emissions are still increasing. Road transport contributes up to 25 percent to the CO2 emissions and represents one of the fastest-growing economic sectors [1]. A possible strategy to reduce local emissions is to increase the share of electric mobility consistently. Observing the technical developments of zero-emission vehicles in recent years, especially energy storage, has proved to be the bottleneck. Despite intensive research activities, mobile energy storage is still the limiting factor, curbing the success of hybrid and electric vehicles.
Since the direct storage of electrical energy can be realized only by the capacitors and coils, indirect storage methods prevail. This means that in a first step, the electrical energy is converted into another form of energy and subsequently stored for later reconversion into electrical energy. In Figure 1, a short classification into mechanical, electrochemical, chemical, electrical and thermal energy storage systems is given.
When energy storage is discussed in the context of sustainable transportation, the first topic that comes to mind is electrochemical batteries for electric vehicles (EVs). Battery electric vehicles—without a doubt—play an important role in our path towards zero-emission mobility, but many experts agree that the energy revolution will require a mix of different energy storage solutions and transportation modes, as the “one-size-fits-all-solution” is yet to be invented [2,3].
A further classification is made in Figure 2, where different energy storage types are shown as a function of their power rating, energy content, and the consequently-related typical charge and discharge time. The dotted circle in the figure represents the area of particular importance for the use-case sustainable transportation, limiting the number of different storages to batteries, supercaps, flywheels and superconducting magnetic energy storages (SMES). However, the selection can further be reduced as SMES do not yet have the maturity necessary for a real implementation [4,5].
Beyond the obvious use-case of onboard energy storage, stationary buffer storage inside the required electric vehicle fast-charging stations will also be discussed in Section 3.3. Calculations and considerations are based on actual zero-emission buses operating in Graz, Austria. The main influencing parameters and effects related to energy storage aging are analyzed in detail. Based on the discussed aging behavior, advantages/disadvantages, and techno-economic analysis for both use-cases is presented. A final suitability assessment of each energy storage technology concludes the use-case analysis.

2. Properties of Different Energy Storage Systems

To give an overview, Table 1 shows general technical and economic properties of the storage technologies preselected in Section 1.

2.1. Battery and Superap

Both Li-Ion batteries and supercaps are mature technologies that have been used in various fields of application since the beginning of the 21st century. However, due to developments in recent years, Li-Ion batteries have become the energy storage device of choice for most transportation applications. Because of their popularity, a lot of scientific [6,7,11] and industrial [8,9,10,12,13,14,15], literature (provided by manufacturers) exists, which can be used to assess certain properties, such as cycle life, aging, etc. This paper will, hence, give only a short overview and primarily focus on the lesser-known properties of Flywheel Energy Storage Systems (FESS)—see Section 2.2.
When it comes to “usable/achievable lifetime”, a metric is necessary to ‘measure’ the state of health of batteries. Typically, capacity and/or internal resistance are used in datasheets of cell manufacturers, giving some indicators to define the end-of-life (EOL) condition, e.g., a decrease of capacity by 20% or increase of internal resistance by a factor of two compared to the begin-of-life (BOL) values. In reality, those limits depend on the actual application, and the datasheet’s lifetime values need to be scaled accordingly. Many applications allow a much higher decrease in capacity than defined by the manufacturer. This slightly increases initial costs and weight, but tremendously extends service life, e.g., a typically used value of 33% decrease of capacity results in a BOL to EOL capacity ratio of 1.5 compared to 1.25 for the manufacturer’s 20% value. In this case, the battery would weigh (=cost) about 20% more. However, the lifetime would increase by about 65%. In other words, the battery would weight (=cost) less for a given lifetime and reach a higher over-all energy throughput. Only small benefits are gained by pushing it even further. Especially in transportation applications, the initial increase in weight is the limiting factor.
The achievable lifetime and performance of batteries and supercaps depend on many parameters, with temperature as the dominating influencing factor. Even though the values are given in Table 1 suggest a wide operating temperature range, a closer look into actual datasheets reveals the problems within: Temperature must be kept below a certain value in order to reach the highest cycle life. Table 2 illustrates the significant decrease in cycle life when temperatures exceed 25 °C.
Low temperatures increase the internal resistance and thereby have a detrimental effect on the performance of the system as well. In the case of supercaps, even at the lowest allowed operating temperature, the increase is typically around factor two, e.g., the company AVX states an increase of about 120% at −40 °C compared to the reference value at 25 °C [8]. This decreased performance is still sufficient for common applications, and only the efficiency suffers slightly, but the capacity remains almost the same. Simultaneously, the (increased) losses heat up the supercap and thereby reduce the negative effects over time.
However, in the case of a battery, these effects are much more severe than in the case of supercaps. Typically, the temperature influence is already noticeable at around 10–20 °C. At temperatures below 0 °C, charging is often no longer allowed by the manufacturer. Finally, at the low end of the operating temperature range, the discharge performance of the cell is typically less than 10% compared to 20 °C values, e.g., References [9,13,15]. Due to this severe decrease in performance, it is often necessary to heat up the cells before the system is put into operation. According to the Graz Public Transport Services (GVB), putting a battery electric bus into operation in the winter may take up to 30 min.
The primary significance of high temperature is the decrease of the cell’s lifetime, both calendar and cycle life. As a rule of thumb, one can assume that the calendar life is reduced by a factor of two every 10 °C increase in temperature (actual values taken from datasheets vary between 7 and 15 °C). The continuous operation at the maximum allowed temperature would reduce the lifetime to just a few months, or a year at most. An additional factor influencing the achievable lifetime is the cell voltage, and in the case of batteries also cycle count, depth of discharge (DOD), as well as charge and discharge rates.
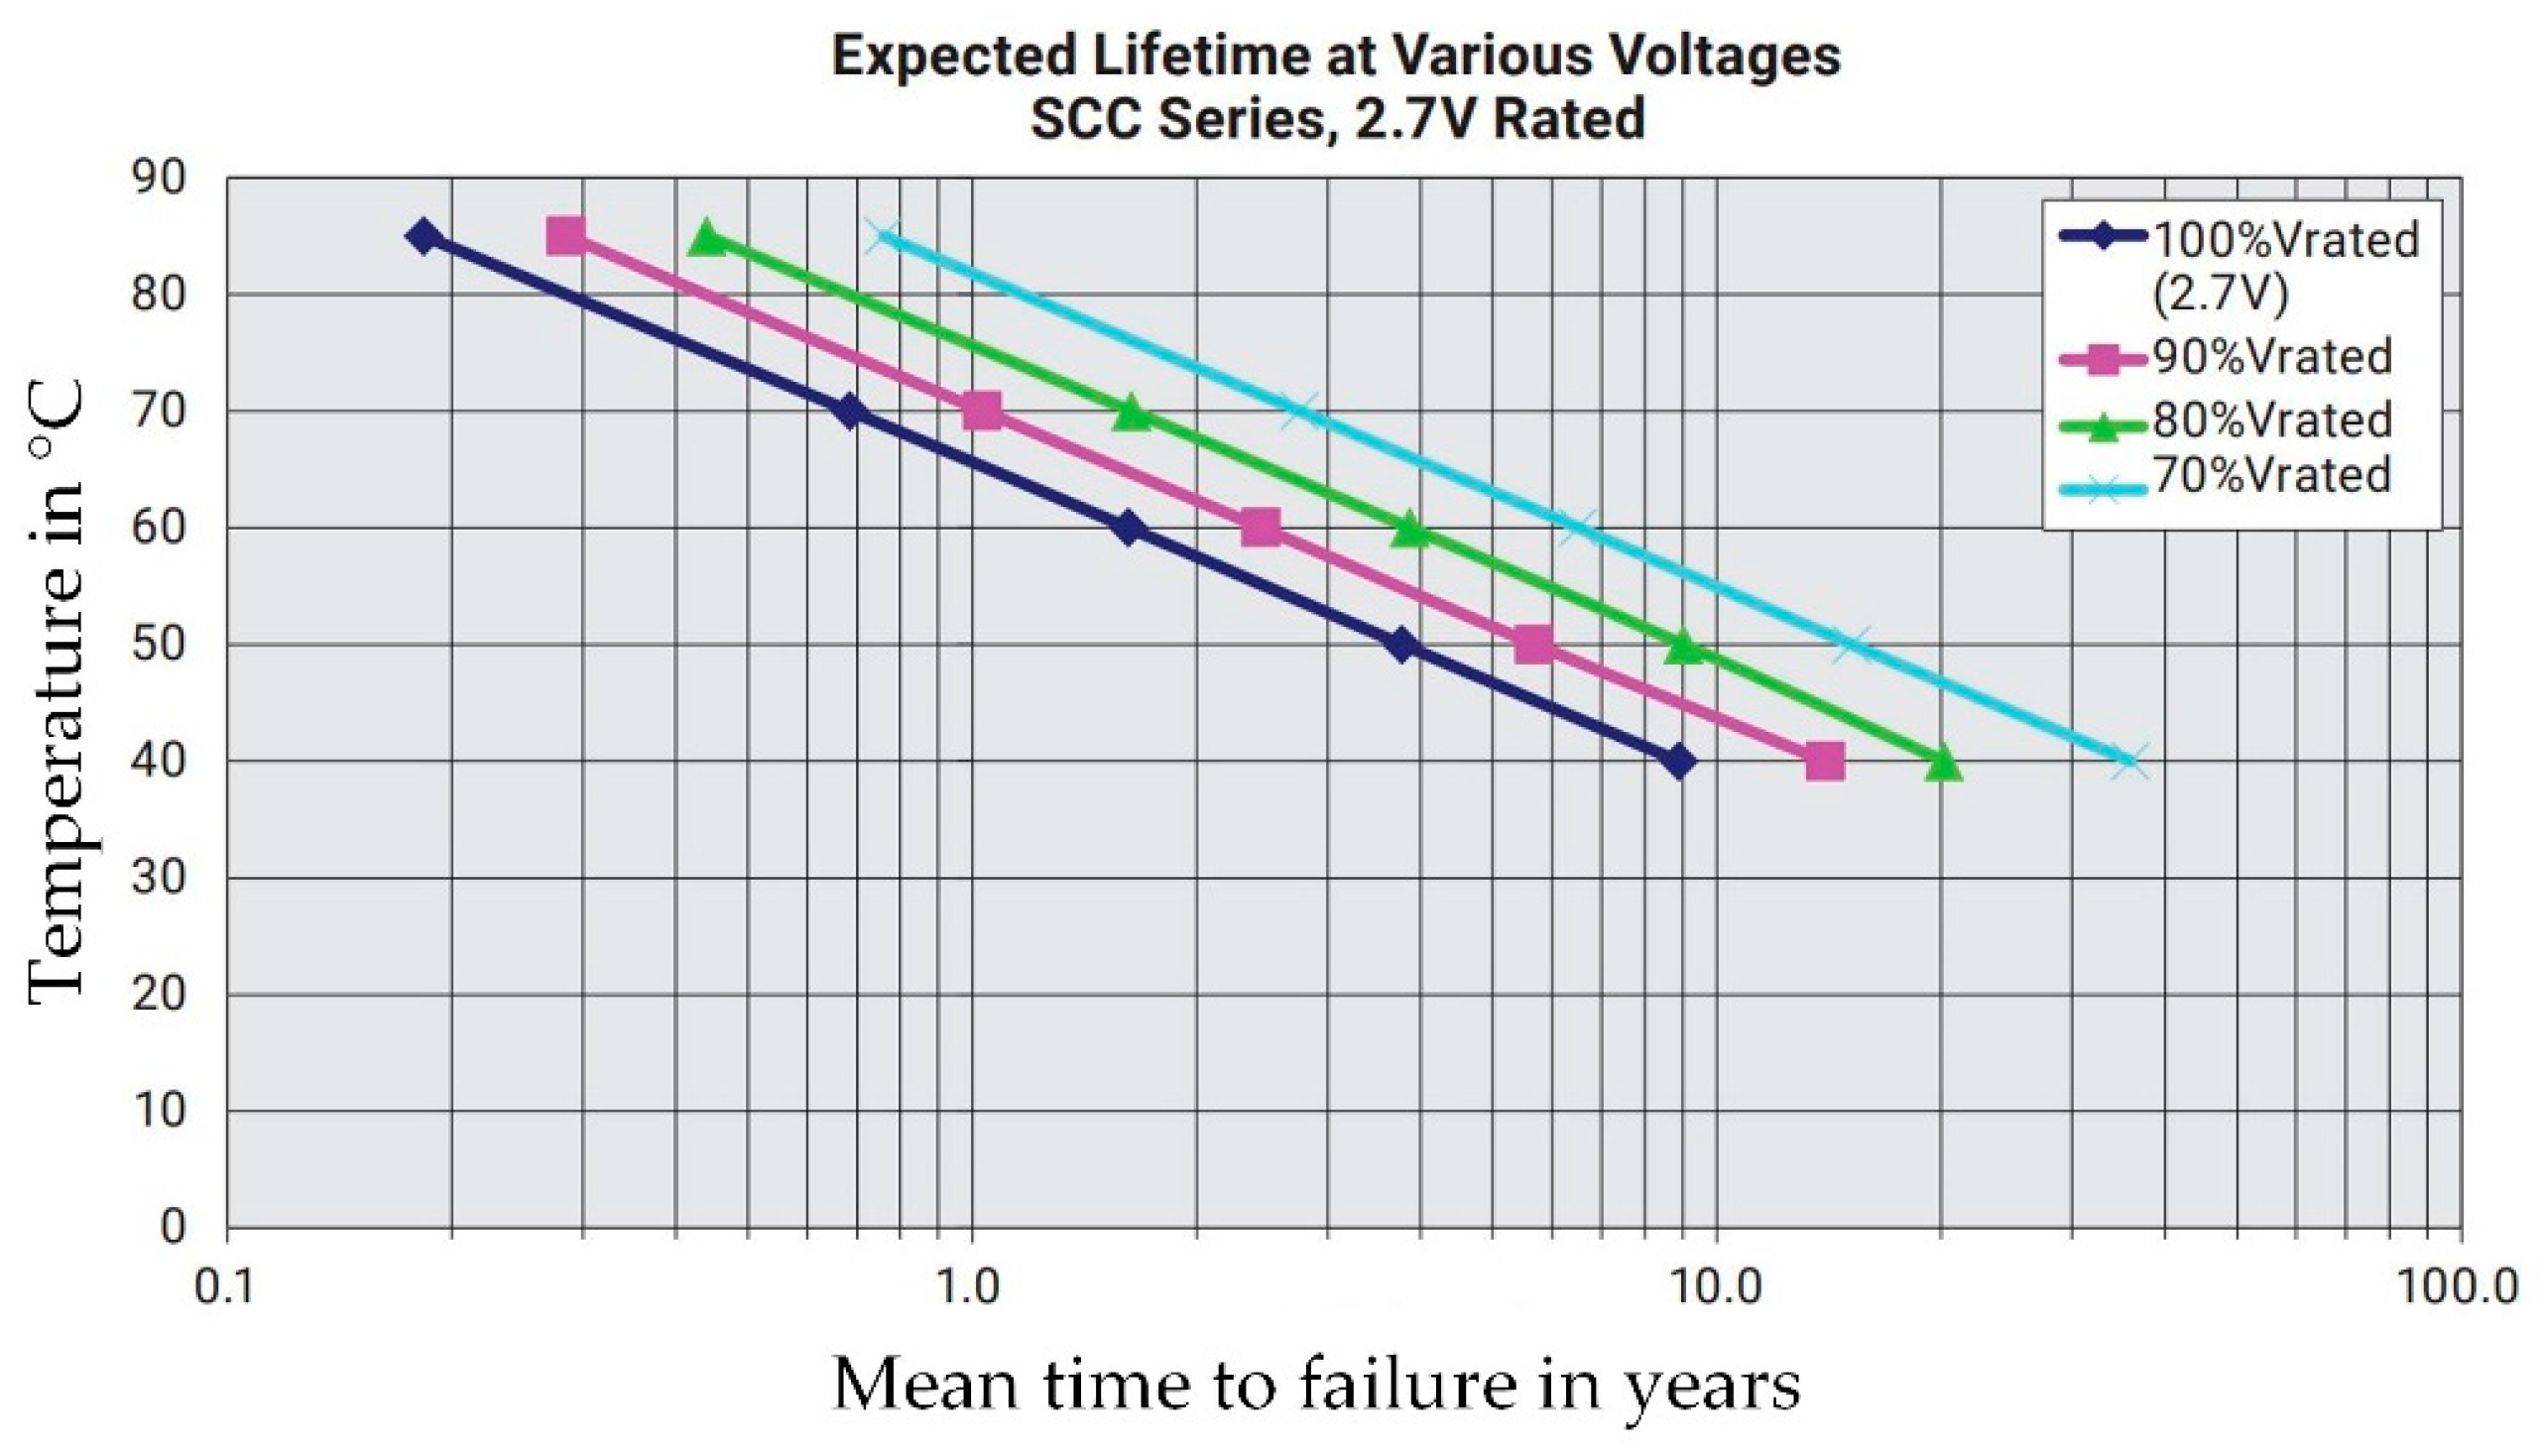
For example, an AVX-SCC series supercap [8] has a base lifetime expectancy of 20 years at 30 °C in a fully charged state. The temperature coefficient is 8 °C per factor two in a lifetime, and the voltage dependence is 0.4 V per factor two in a lifetime (a lower voltage increases the lifetime, but reduces available capacity)—see Figure 3.
Similar to the supercap, calendar life of batteries depends on temperature and end-of-charge (EOC) voltage. Unfortunately, in many datasheets, only sparse data sets are given. If anything, one usually finds data regarding temperature dependence. Reasonable EOC voltages for different applications are rarely mentioned in datasheets/literature, with one notable exception being [15]. Depending on the application, Table 3 states different suggested EOC voltages. Still, it is not mentioned how much the lifetime is improved, due to voltage reduction.
Additionally, cycling the battery reduces its lifetime. There is no simple correlation between charge/discharge cycles and occurred damage. As mentioned before, it not only depends on the cycle count, but among other factors, also state-of-charge (SOC), DOD and charge/discharge rates. Still, a few basic and generally valid statements can be made:
  • Just like calendar life, cycle life is influenced by cell temperature, but not necessarily with the same temperature coefficient. e.g., in Reference [9] the calendar life temperature coefficient is 10 °C per half/double lifetime, but for cycle life, the coefficient is 14 °C.
  • Increasing charge/discharge rates reduce cycle life. High cycle life values, as shown in Table 1, are typically obtained by utilizing low charge/discharge rates, e.g., 1 C (1 h charge/discharge rate) or even lower. Increasing these rates, as often necessary for high-speed charging or other heavy-duty applications, reduces lifetime. Especially when the cell is optimized for high specific energy content, which is mainly the case for most batteries used in electric vehicles, where weight is of major interest.
  • DOD influences the achievable energy throughput [10,14]. For example, Saft Evolion (NCA chemistry) reaches a cycle life of 4000 cycles for a DOD of 100% [14]. For a DOD of 10%, the cycle life increases to 250,000, resulting in a total energy throughput equivalent to 25,000 100%-cycles.
One last comment: In the case of rectangular or pouch bag cells, special care has to be taken for correct mounting that homogeneously compresses the cell with a defined pressure. This is equally important for the proper functioning of the cell, as well as to achieve long cell life.

2.2. Flywheel Energy Storage Systems (FESS)

2.2.1. Background Information

Prices of Lithium-Ion batteries are decreasing on the global market and energy densities have reached reasonable values, allowing EVs to travel 200 km and more on one charge [18]. However, there are still significant technical challenges, which need to be solved, or alternatives need to be found. One of the major drawbacks of chemical batteries is limited cycle life, which was described in Section 2.1 and will be discussed in particular in this paper.
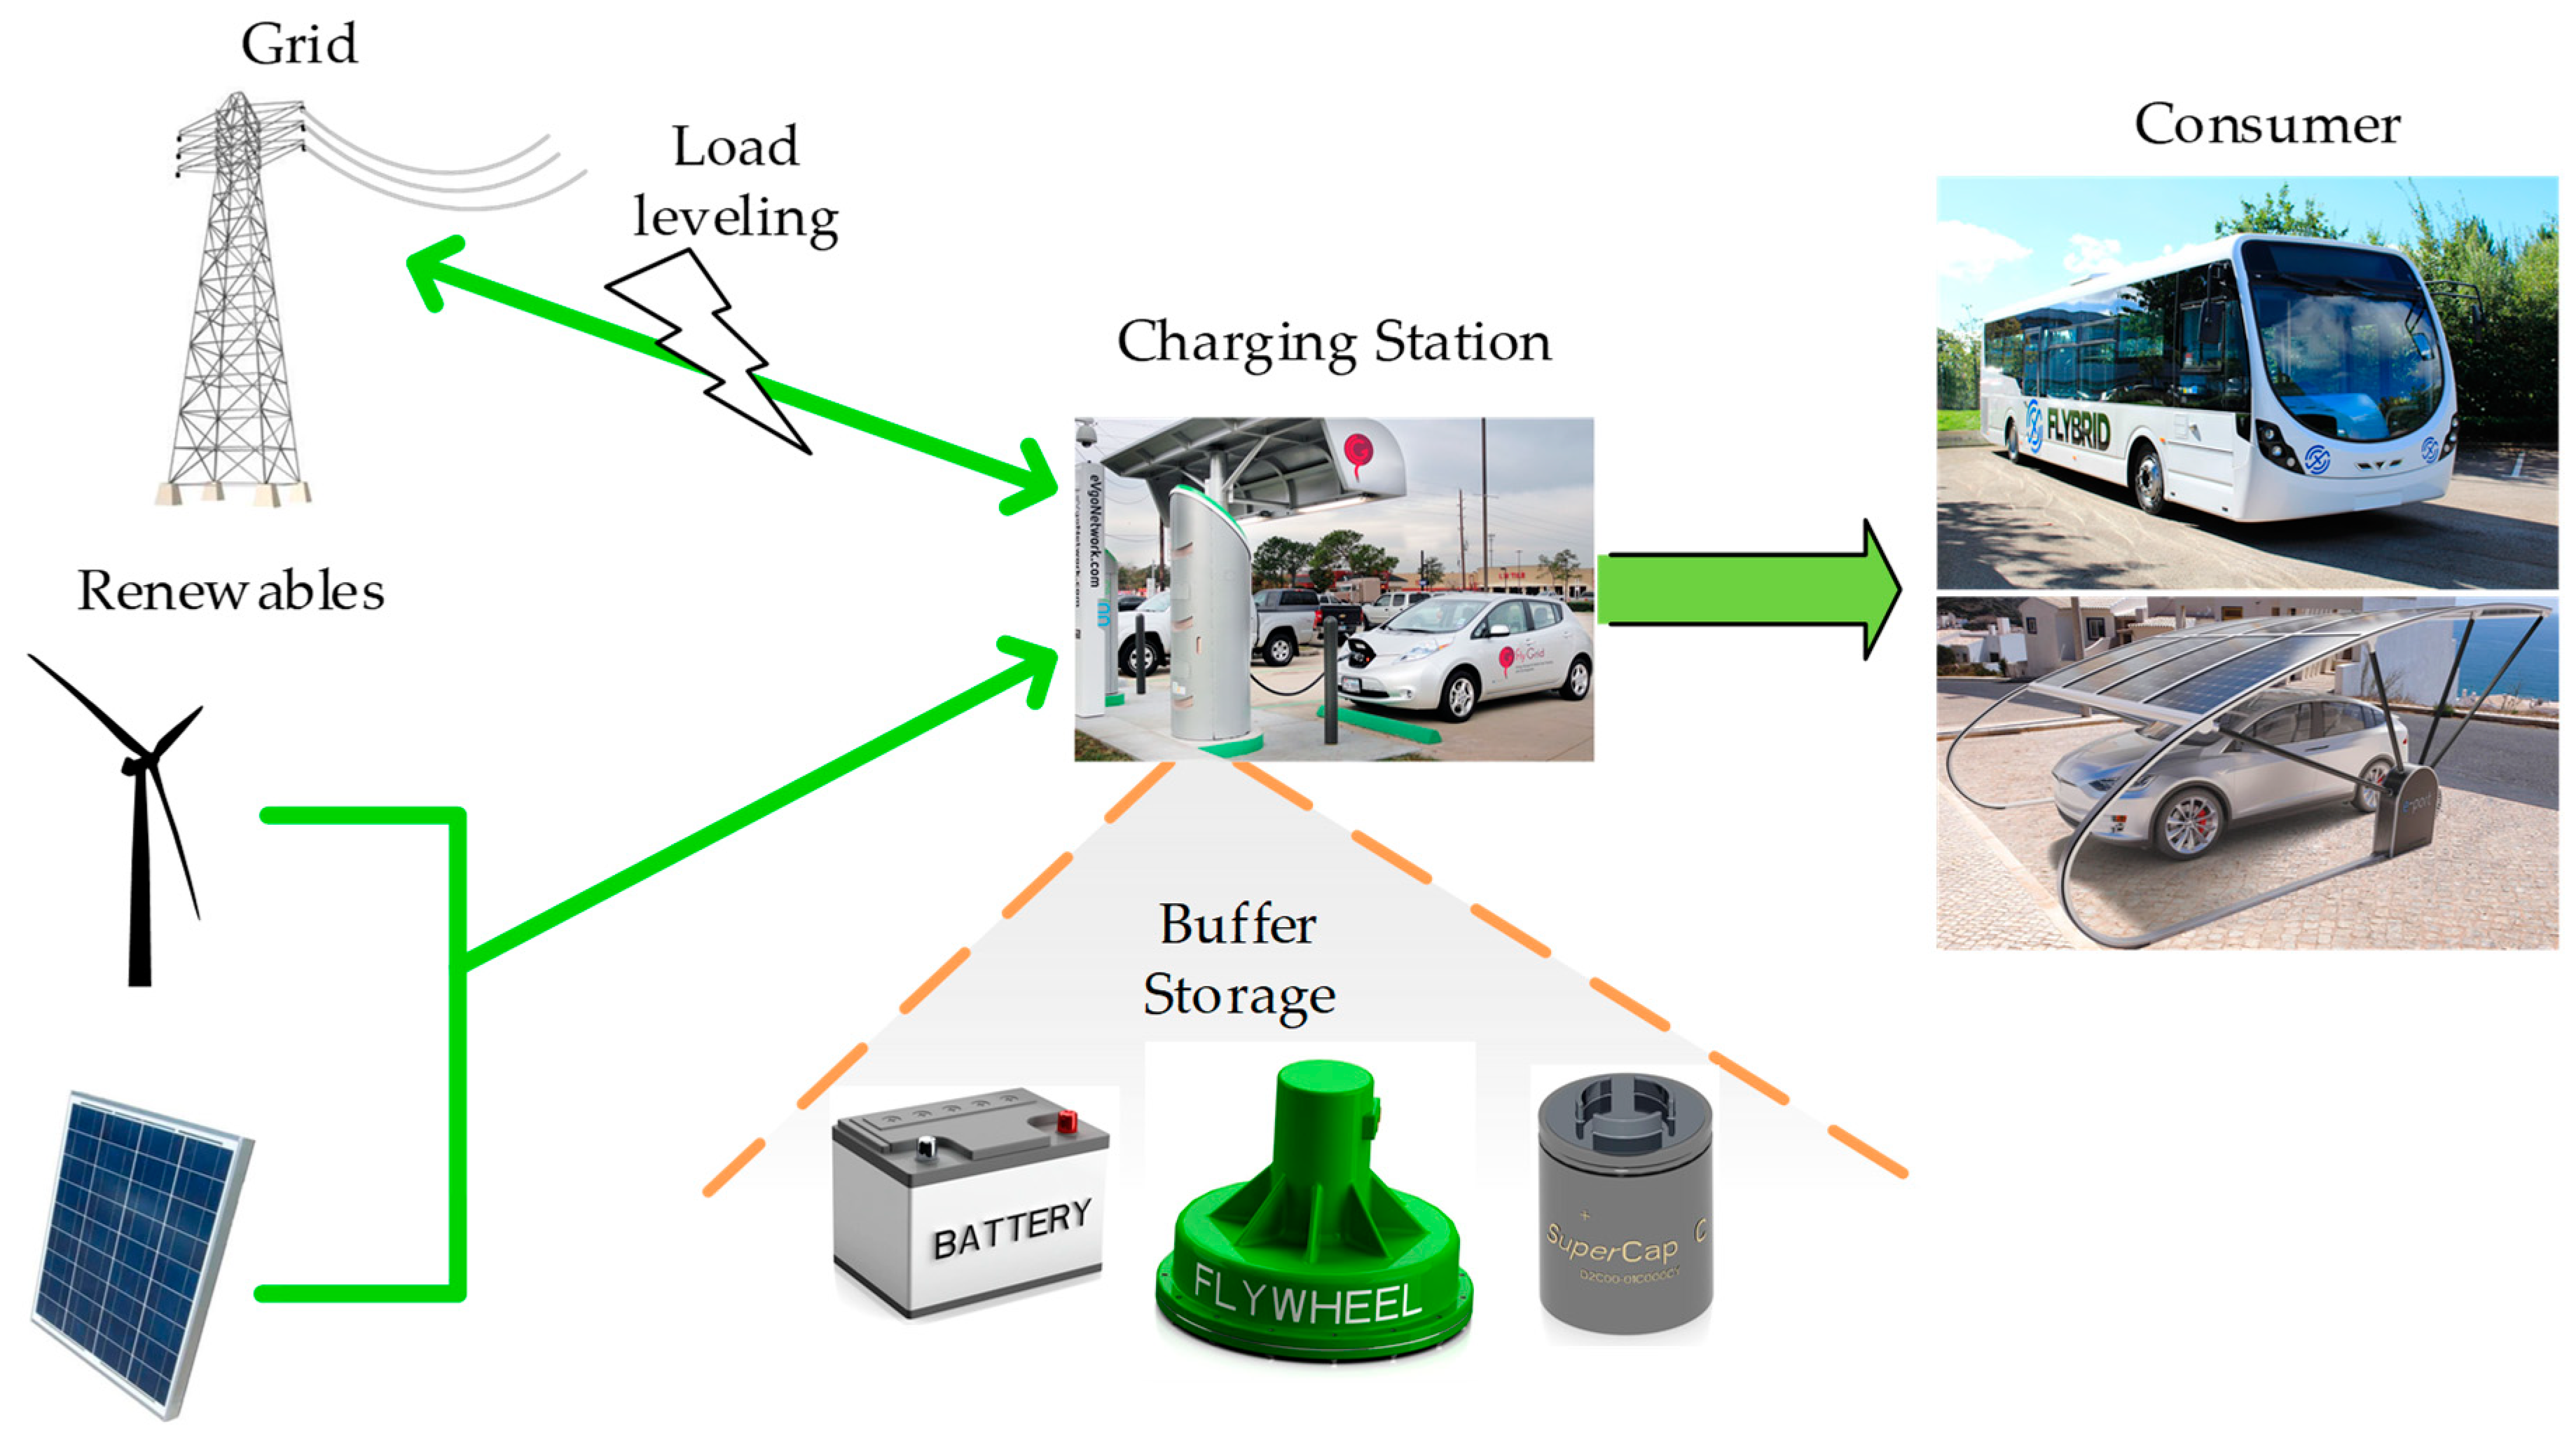
It must be stressed that sustainable transportation does not only rely on batteries inside the vehicles. The increasing primary electricity supply through volatile sources, in combination with high grid loads caused by charging power demand, requires decentralized electric energy storage [19]. The requirements for these stationary energy storage systems may differ significantly from those of transportation applications. However, in both cases, long cycle life and negligible aging effects are usually desired. This is particularly the case when alternatives to chemical batteries come into play.
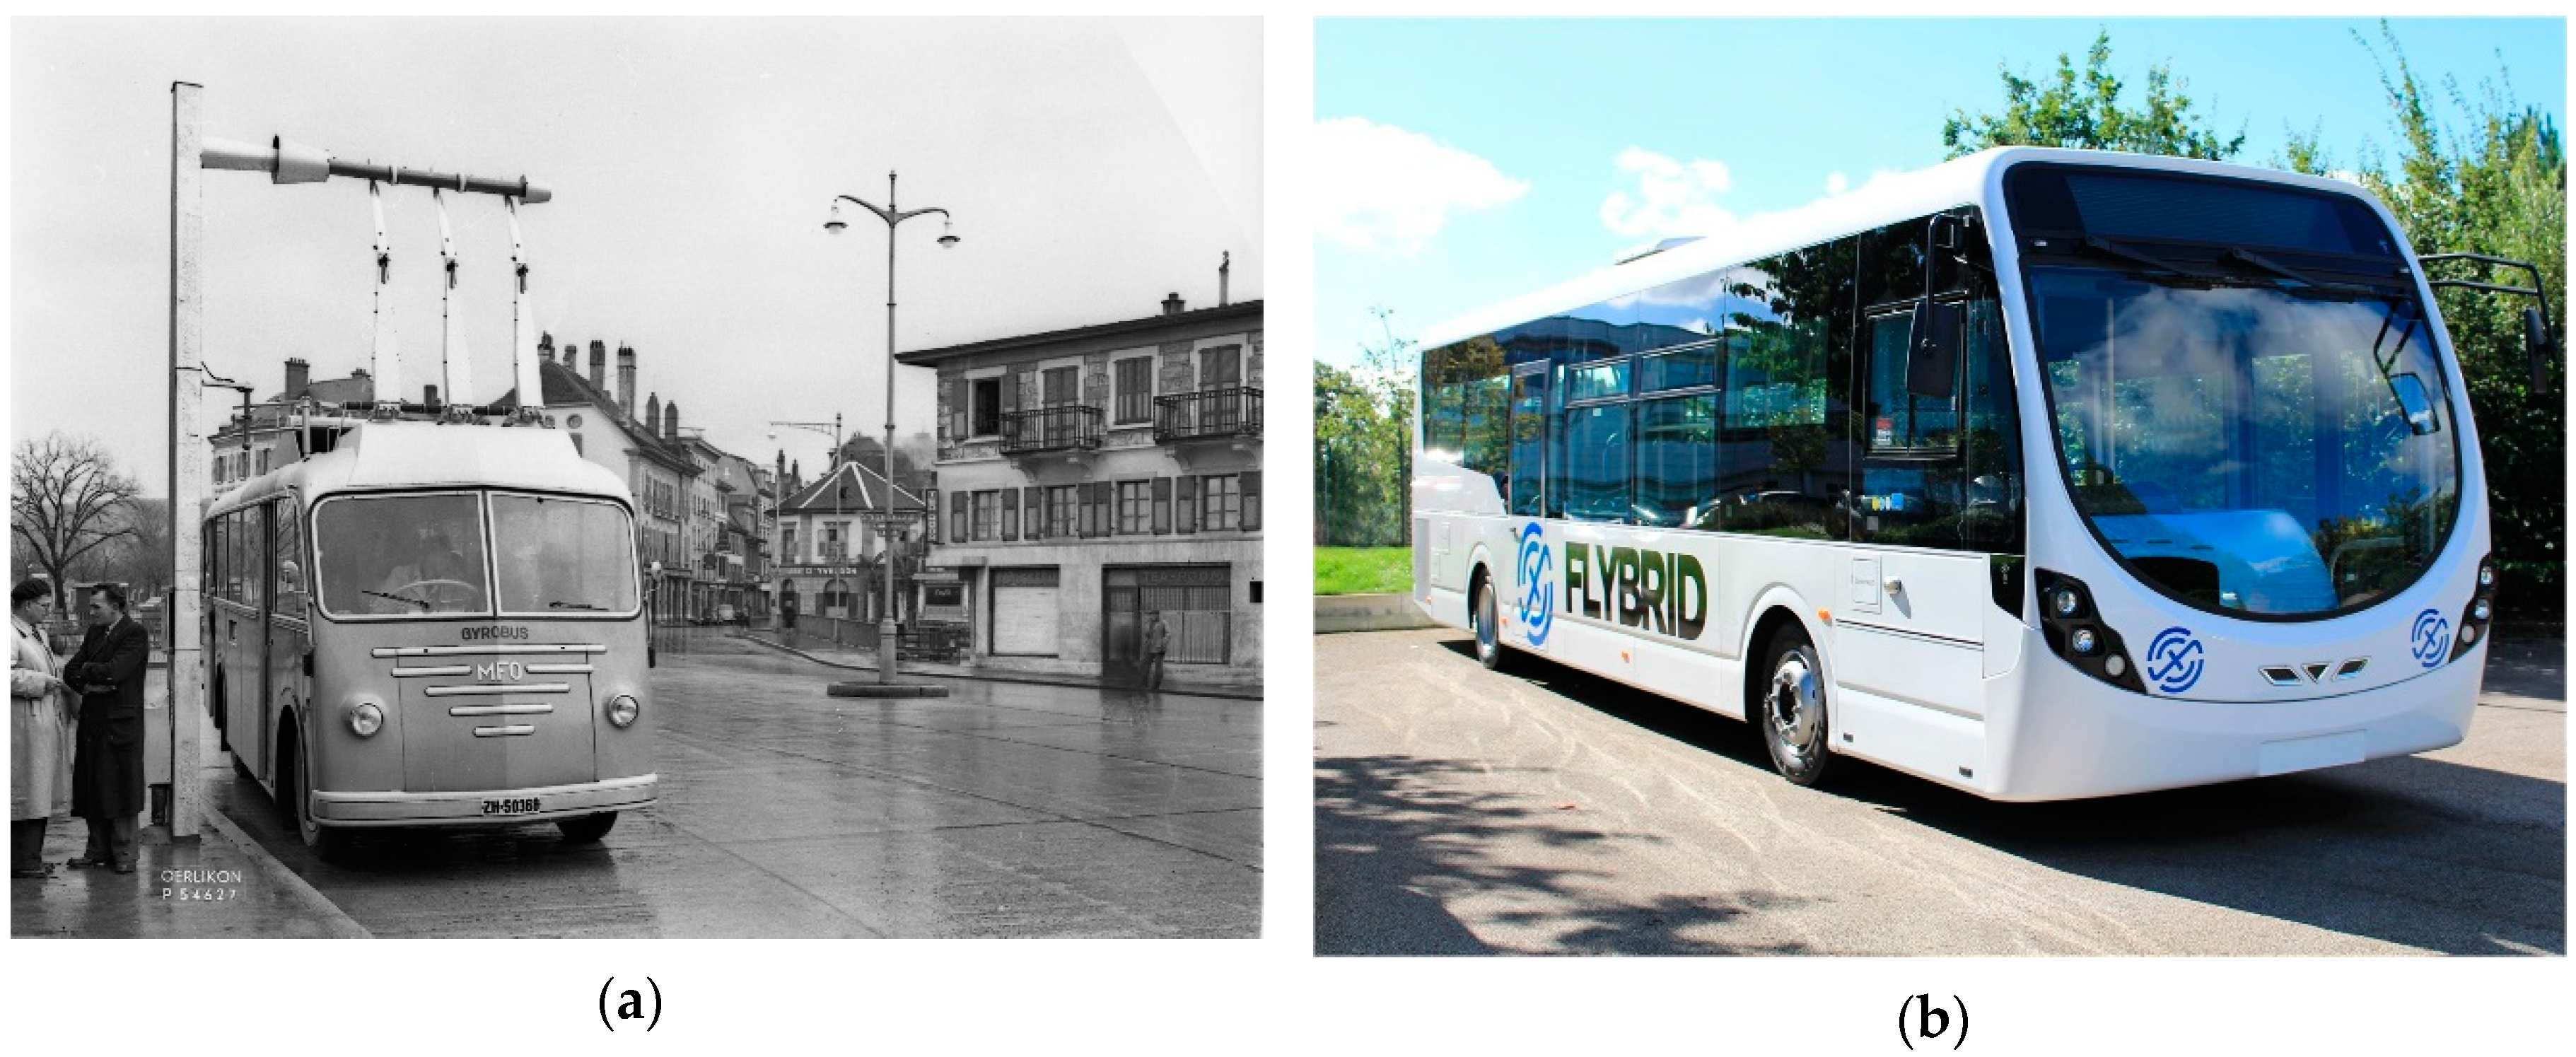
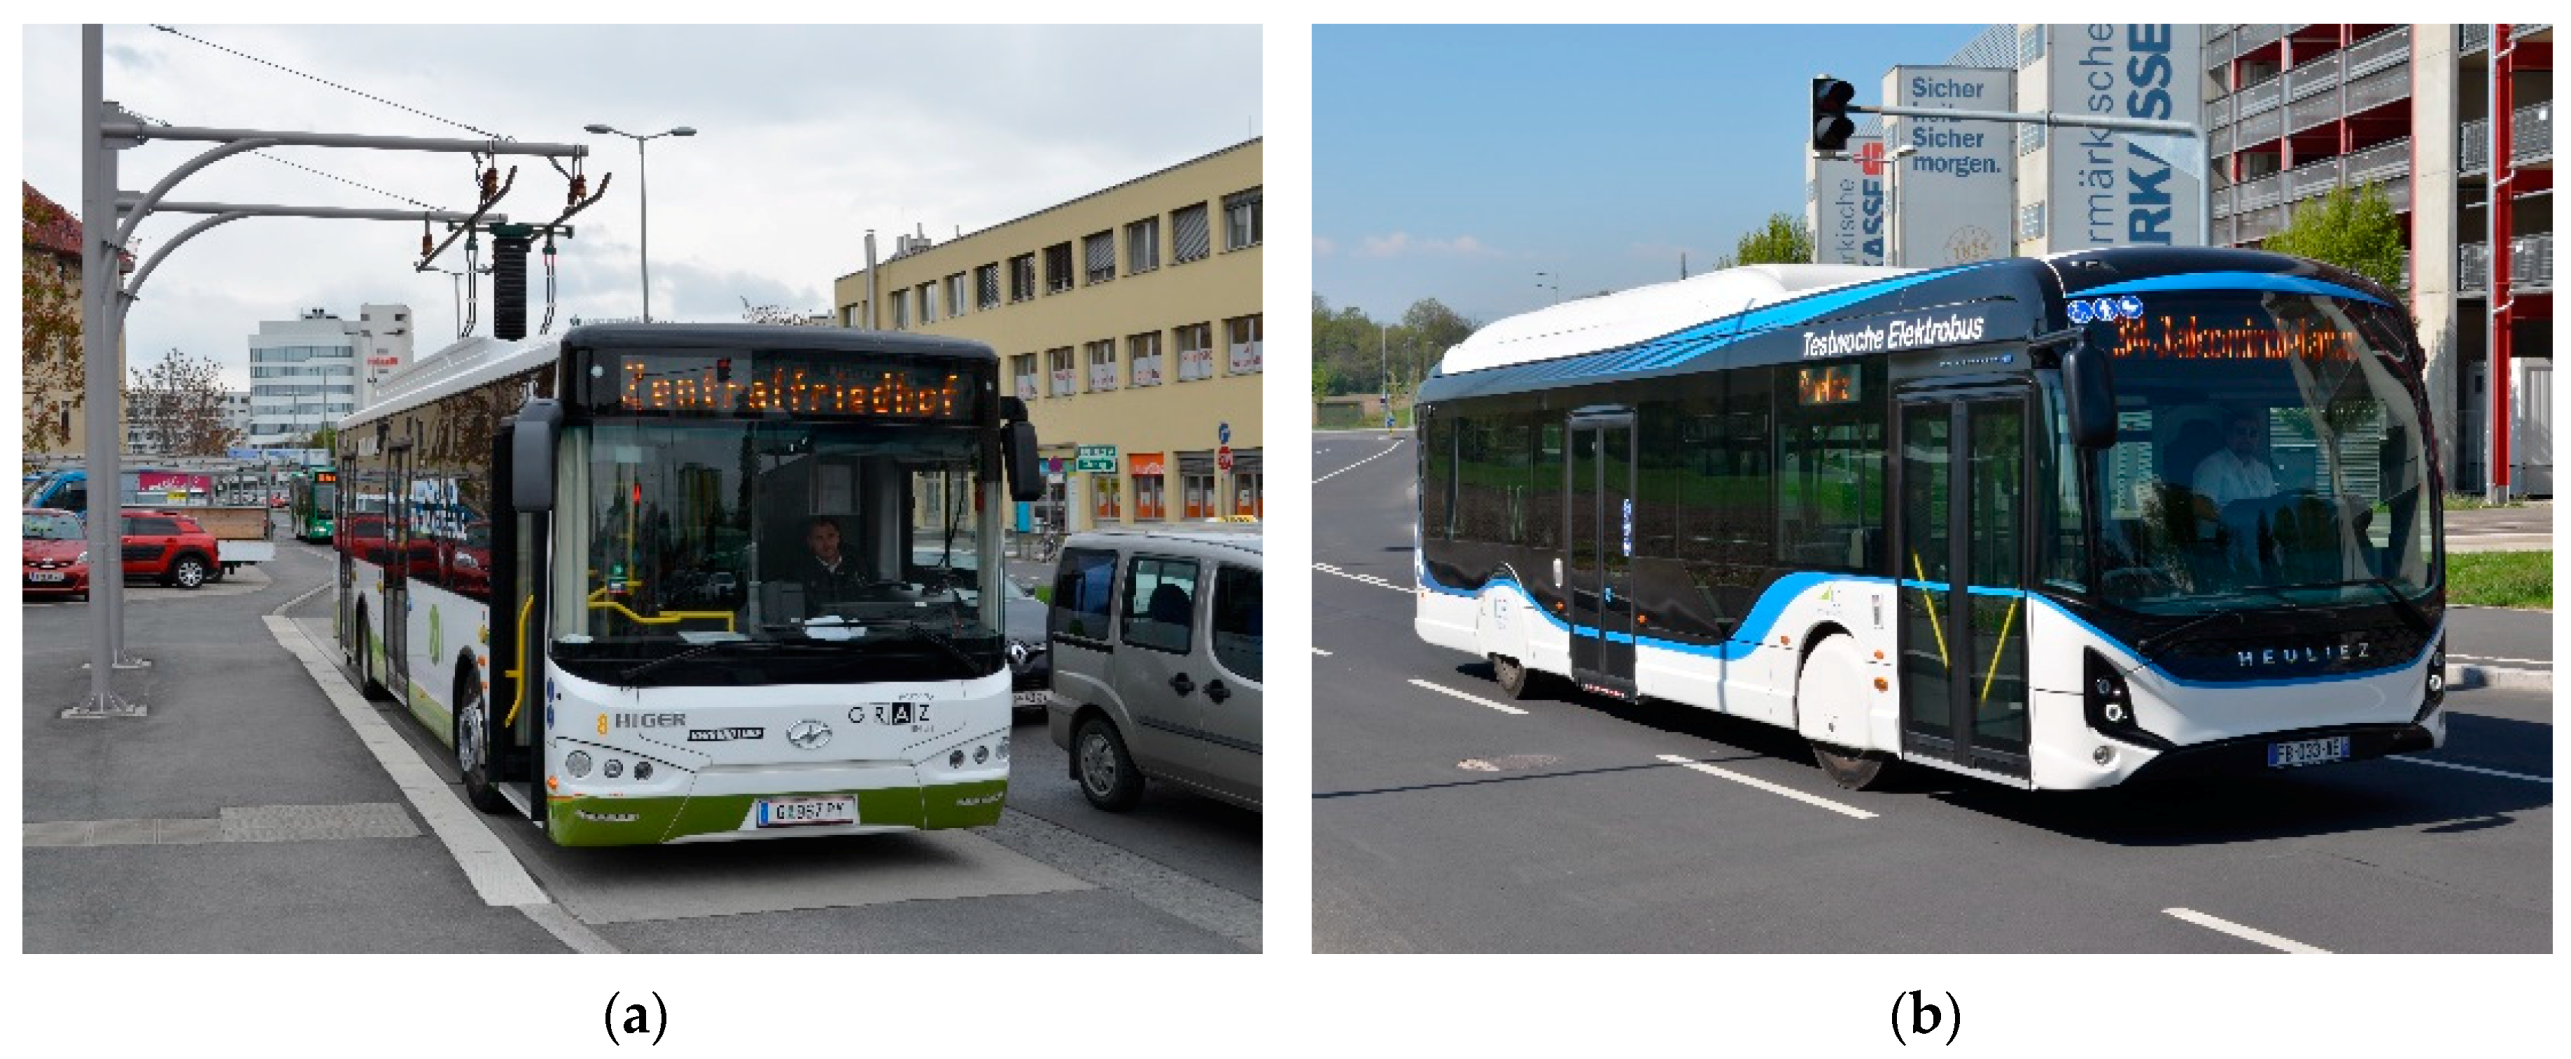
One may think immediately of gyroscopic reactions as a major disadvantage of FESS. This aspect must be considered during system design, but is an issue that can be resolved [20] as they have been used successfully in various transportation applications (see Figure 4).
Flywheel Energy Storage Systems (FESS) has experienced a renaissance in recent years, mainly due to some of their intriguing properties:
  • In principle, an unlimited number of charge/discharge cycles;
  • No capacity fade over time;
  • Power and energy content are independent of each other;
  • Operation at low or elevated temperature is easily possible;
  • Precise state of charge (SOC)/state of health (SOH) determination;
  • No risk during transportation/uncritical deep-discharge (flywheel stands still);
  • No toxicologically critical/limited resources necessarily required.
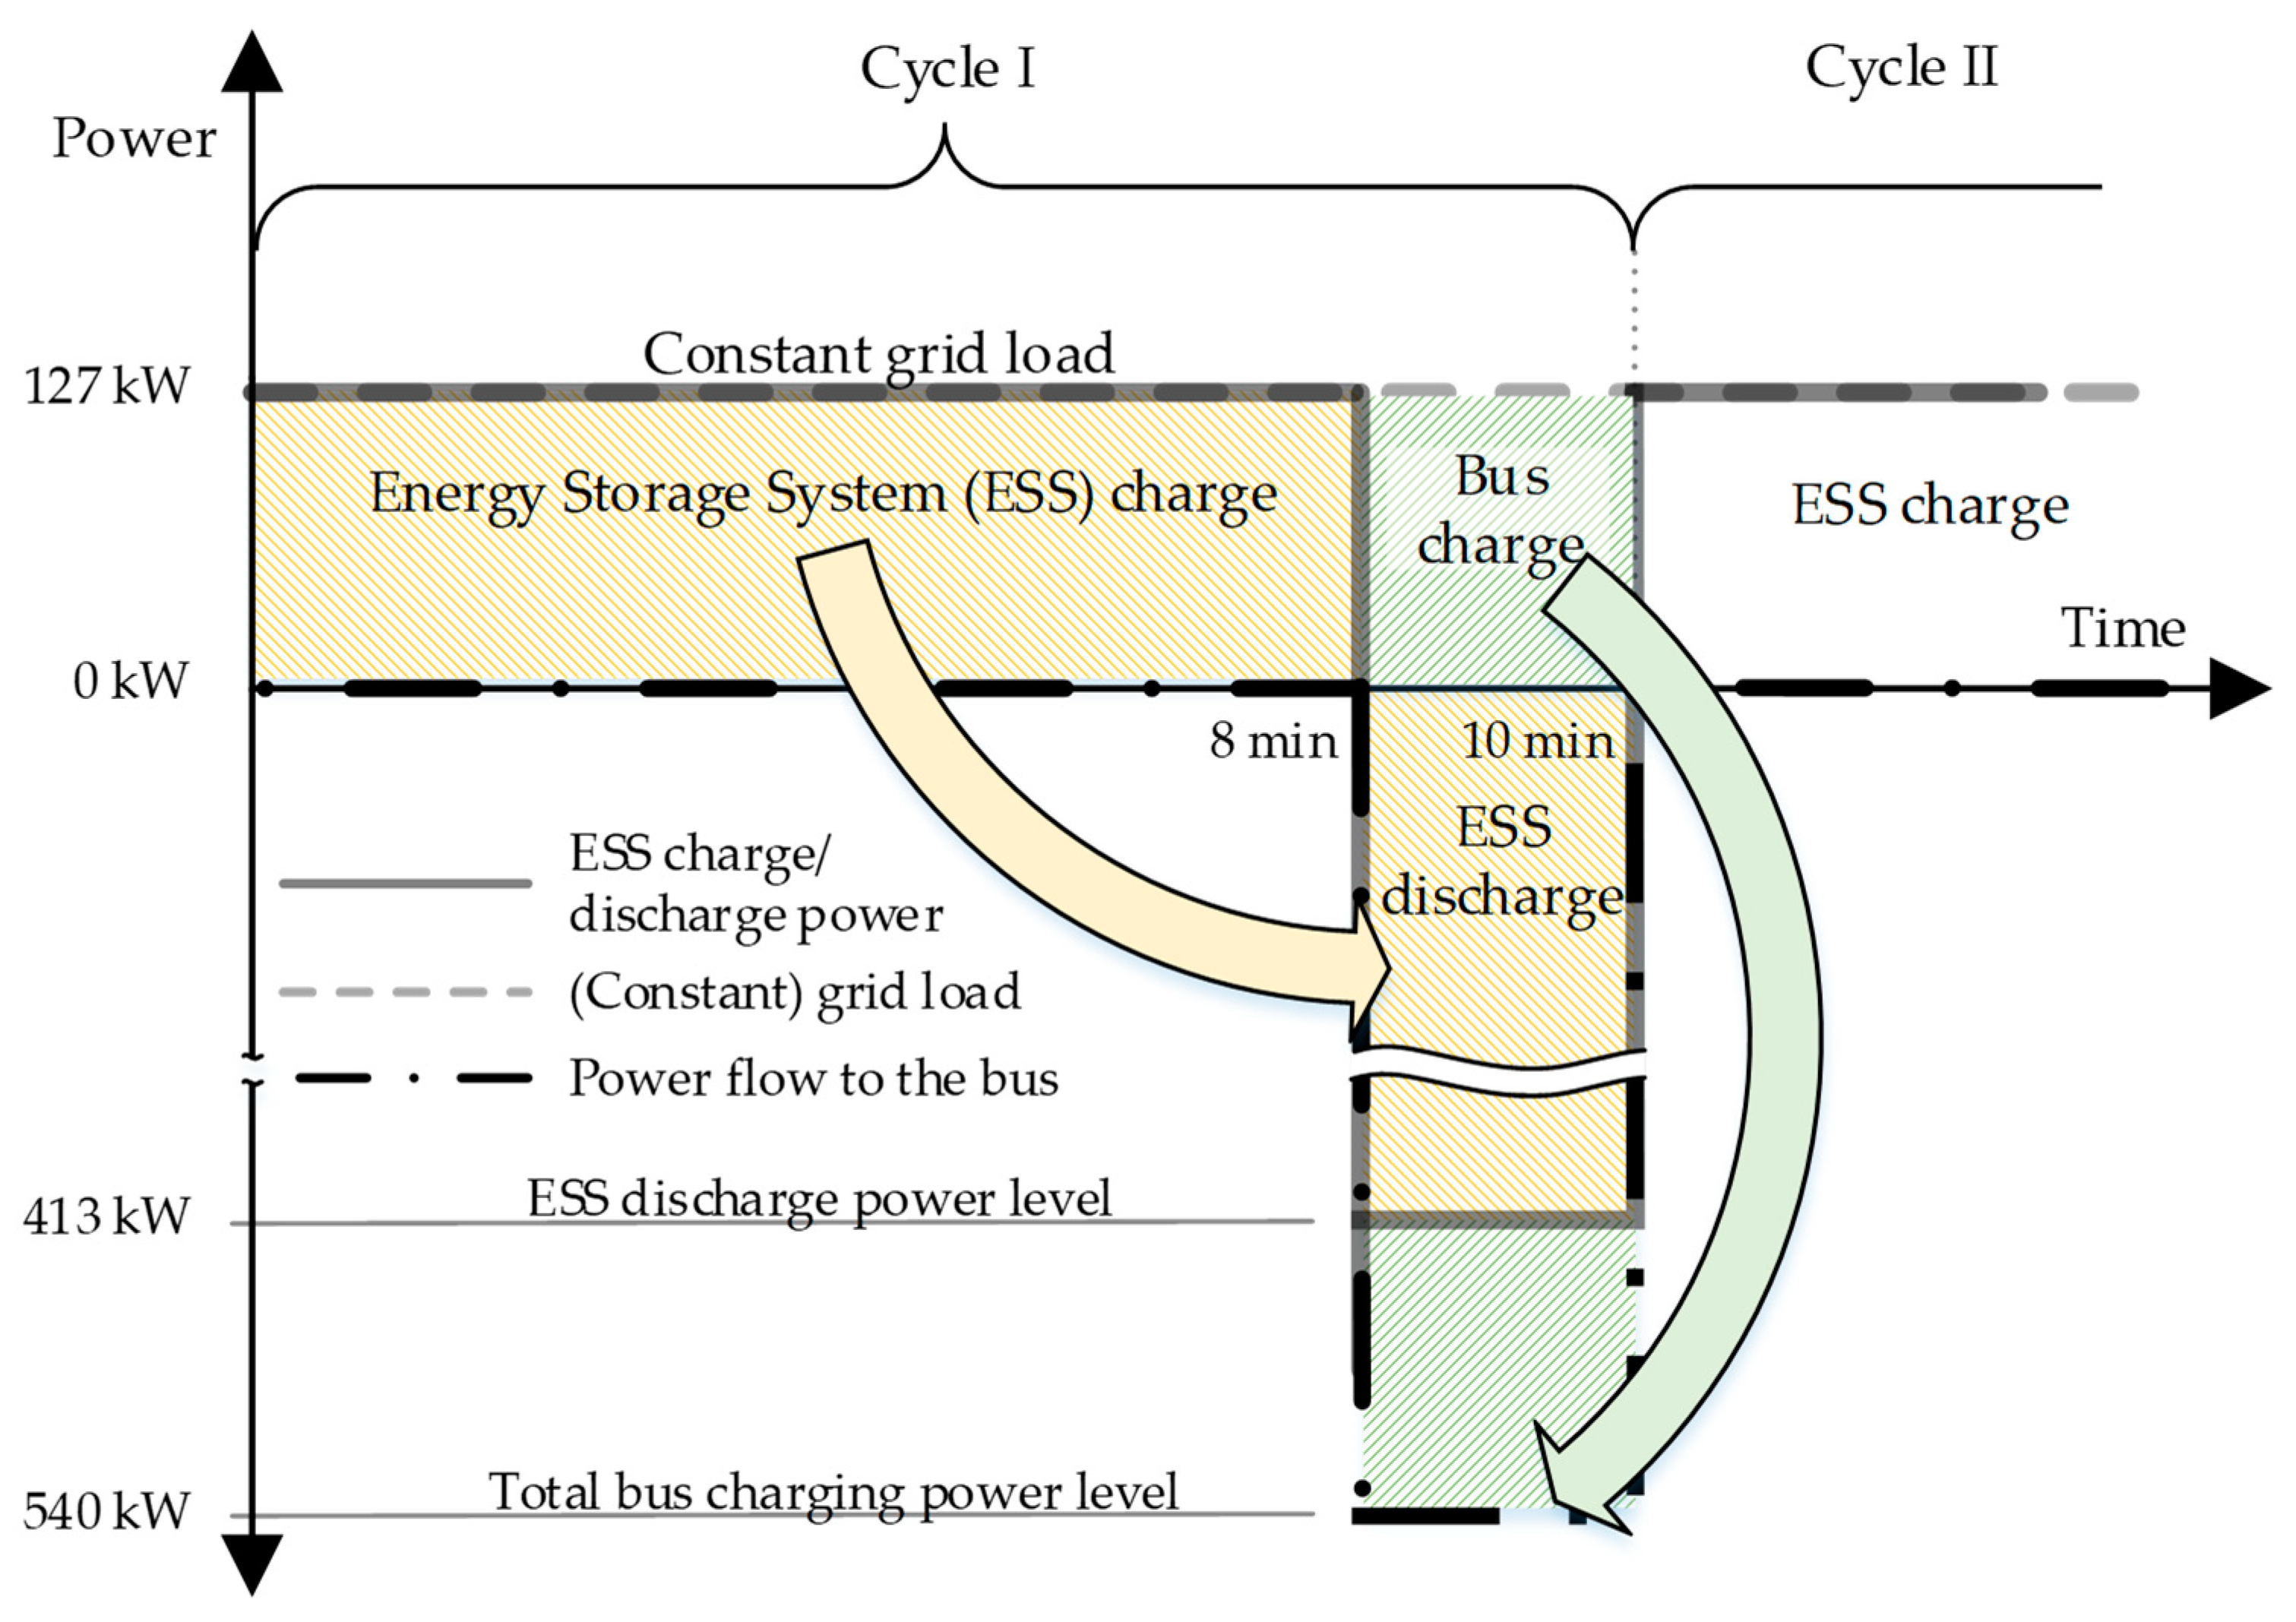
Due to the above-listed properties, FESS are increasingly used for grid stability or fast-charging applications, as proposed in References [21,22]. Another example is the currently ongoing Austrian research project “FlyGrid”, within which a FESS for a fully automated EV charging station will be developed. One module of this prototype will be used as the reference case and will deliver 5 kWh at 100 kW peak power.

2.2.2. FESS Working Principle

In a FESS, energy is stored in kinetic form; the working principle is based on the law of conservation of angular momentum. In electromechanical FESSs an external torque is applied to a rotor by the use of a motor/generator, hence, only an electrical and no direct mechanical connection for power transmission is required. In order to charge the FESS, the applied torque accelerates the spinning mass (rotor). If the spinning mass decelerates, energy is taken out of the system, and the motor acts as a generator. Electrical energy from the grid or other sources can be converted into kinetic energy charging the FESS. In the case of discharge, the motor/generator decelerates the spinning mass converting kinetic energy back to electrical energy. This principle is demonstrated in a video in the Supplementary Materials, that belongs to this publication. The amount of stored energy is defined by the rotor’s moment of inertia and the rotational speed, according to Equation (1).
E K I N = I   *   ω 2 2   ,
E K I N
Kinetic Energy in J
I
  Mass Moment of Inertia of the Spinning Mass/Rotor in kg*m2
ω
   Angular Velocity in rad/s
Different concepts for Flywheel Energy Storage Systems (FESS) exist, but within this publication, only electromechanical FESS are considered, as they are easily comparable to any other energy storage system with electric connection terminals. 
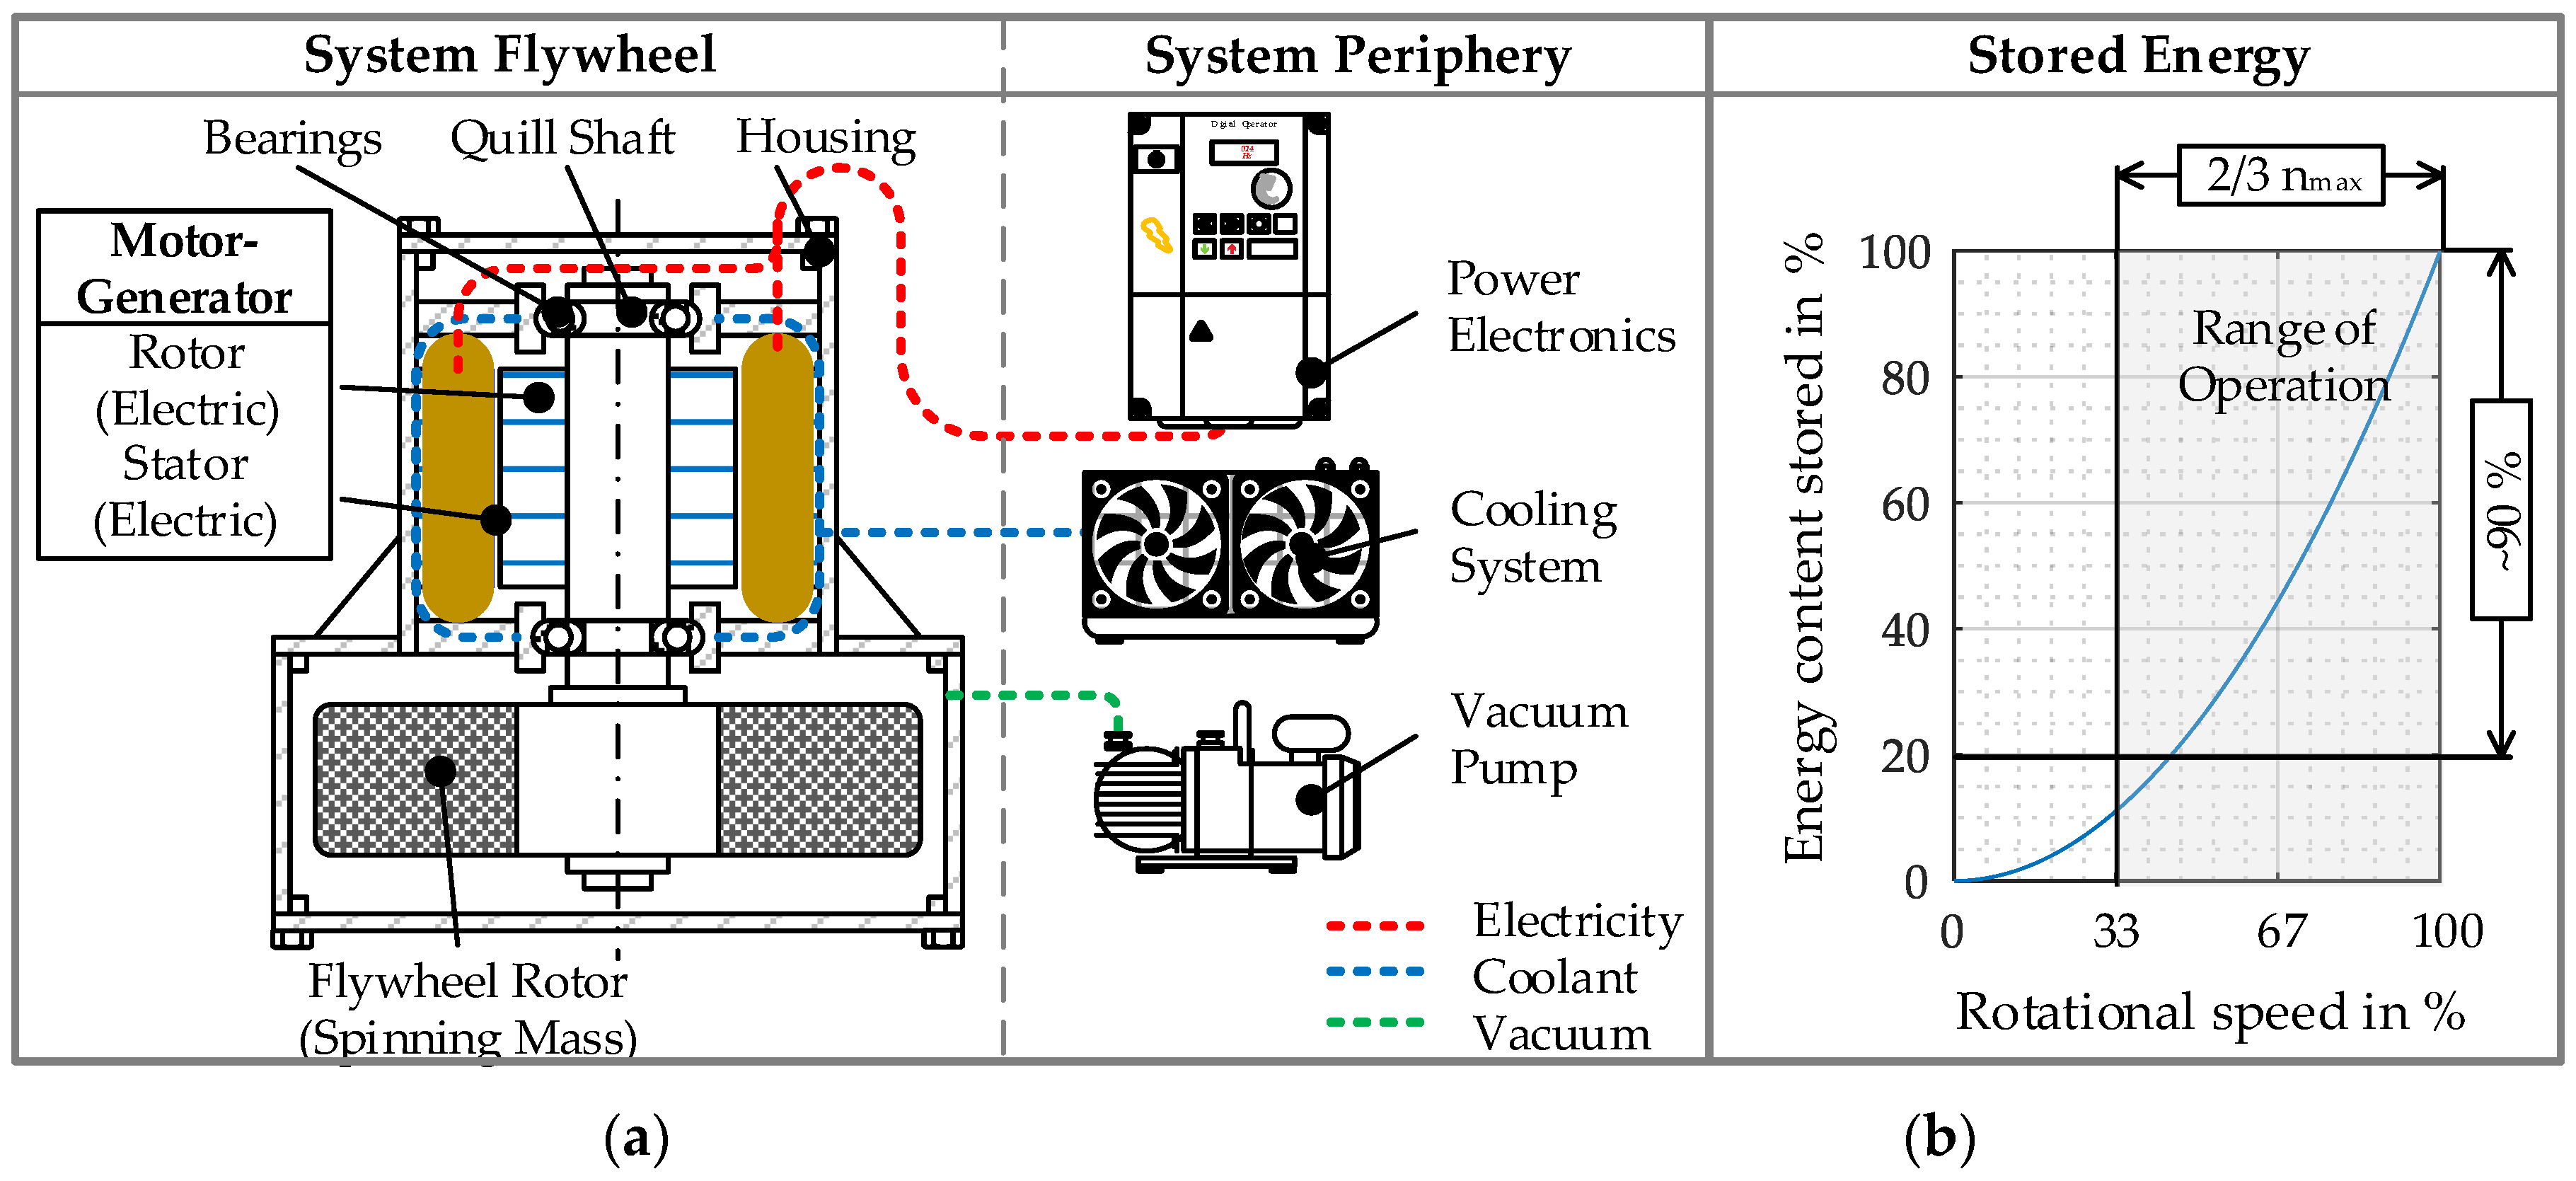
Figure 5a shows a schematic diagram of an electromechanical FESS. It consists of a motor/generator with a shaft and an attached spinning mass. The shaft is supported by bearings, which form the connection to the housing. In Figure 5b, the energy content is plotted over rotational speed visualizing the quadratic increase of stored energy. If high specific energies are desired, FESS must operate at extremely high rotational speeds, optimally exploiting rotor material strength. Within this publication, only FESS with high specific energies is addressed. As mentioned in Section 2.2.1 depth of discharge (DoD) does not influence FESS cycle life.
One effect, which must be considered during FESS design is based on Equation (2)—System power is proportional to motor torque and rotational speed. It can be observed that, when the constant power output is required at low rotational speeds, motor-generator torque will reach unnecessarily high values, resulting in heavier and more expensive electric machines. This is why the minimum operating speed is usually kept at around 1/3 of the maximum rpm value.
P = M   *   ω   ,
P
Power in W
M
Motor Torque in N*m
ω
Angular Velocity in rad/s
Around 89% of the total kinetic energy of the FESS is usable when the system is operated between 33 and 100% of the maximum permissible speed. For that reason, FESS usually operate within a certain bandwidth and do not decelerate down to standstill during regular operation.

2.2.3. Self-Discharge of FESS

Losses have an important influence on the suitability of this technology for different use-cases. The following paragraph gives a short introduction to this topic, starting with the three main causes of FESS self-discharge:
  • Air drag;
  • Bearing torque loss;
  • Power consumption of peripheral components.
Air drag losses during operation are crucial for FESS with high specific energies. Circumferential speeds beyond the speed of sound are common and exceed 1 km/s in some cases, which would cause enormous air drag during operation. This air drag would result in losses and eventually be dissipated into heat, which causes thermal issues leading to system failure. In order to reduce these losses, FESS are usually operated in a vacuum atmosphere, and pressure levels down to 1 µbar are common [23]. At such low-pressure levels, air drag losses play only a minor role. Issues regarding lubrication arising from these vacuum qualities will be addressed in Section 2.2.6. The power consumption of the vacuum pump and other peripheral components must be taken into account when analyzing the overall system losses. The power dissipated in the bearings also plays a crucial role and will be discussed in detail in Section 2.2.5.
Losses do not necessarily represent a problem, when they are below a certain level, but the benchmark for this threshold depends on the actual use-case. With increasing mean power-transfer into and out of the FESS, the acceptable level of system losses increases as well.
This means that for long term storage (low mean power-transfer), the power loss threshold is very low and FESS is not suitable, due to its relatively high self-discharge (hours to days at most). For highly dynamic and predictable load cycles with high mean power-transfer FESS is more suitable. This matter will be demonstrated in Section 3 by means of different use-cases.
In the following sections, crucial FESS components will be dealt with, and details regarding their service life will be discussed.

2.2.4. Rotor Material Selection and Aging

As described in Section 2.2.1 FESS with high energy densities are addressed. Regarding the rotor, rotational speed, and therefore, energy content is limited by permissible stresses ( σ max ) in the rotor. Highest energy densities can be reached when using materials with high σ max ρ ratios, like fiber composite materials [1]. However, other materials like steel are being used in practice as well. Table 4 compares the theoretical specific energies of different rotor materials.
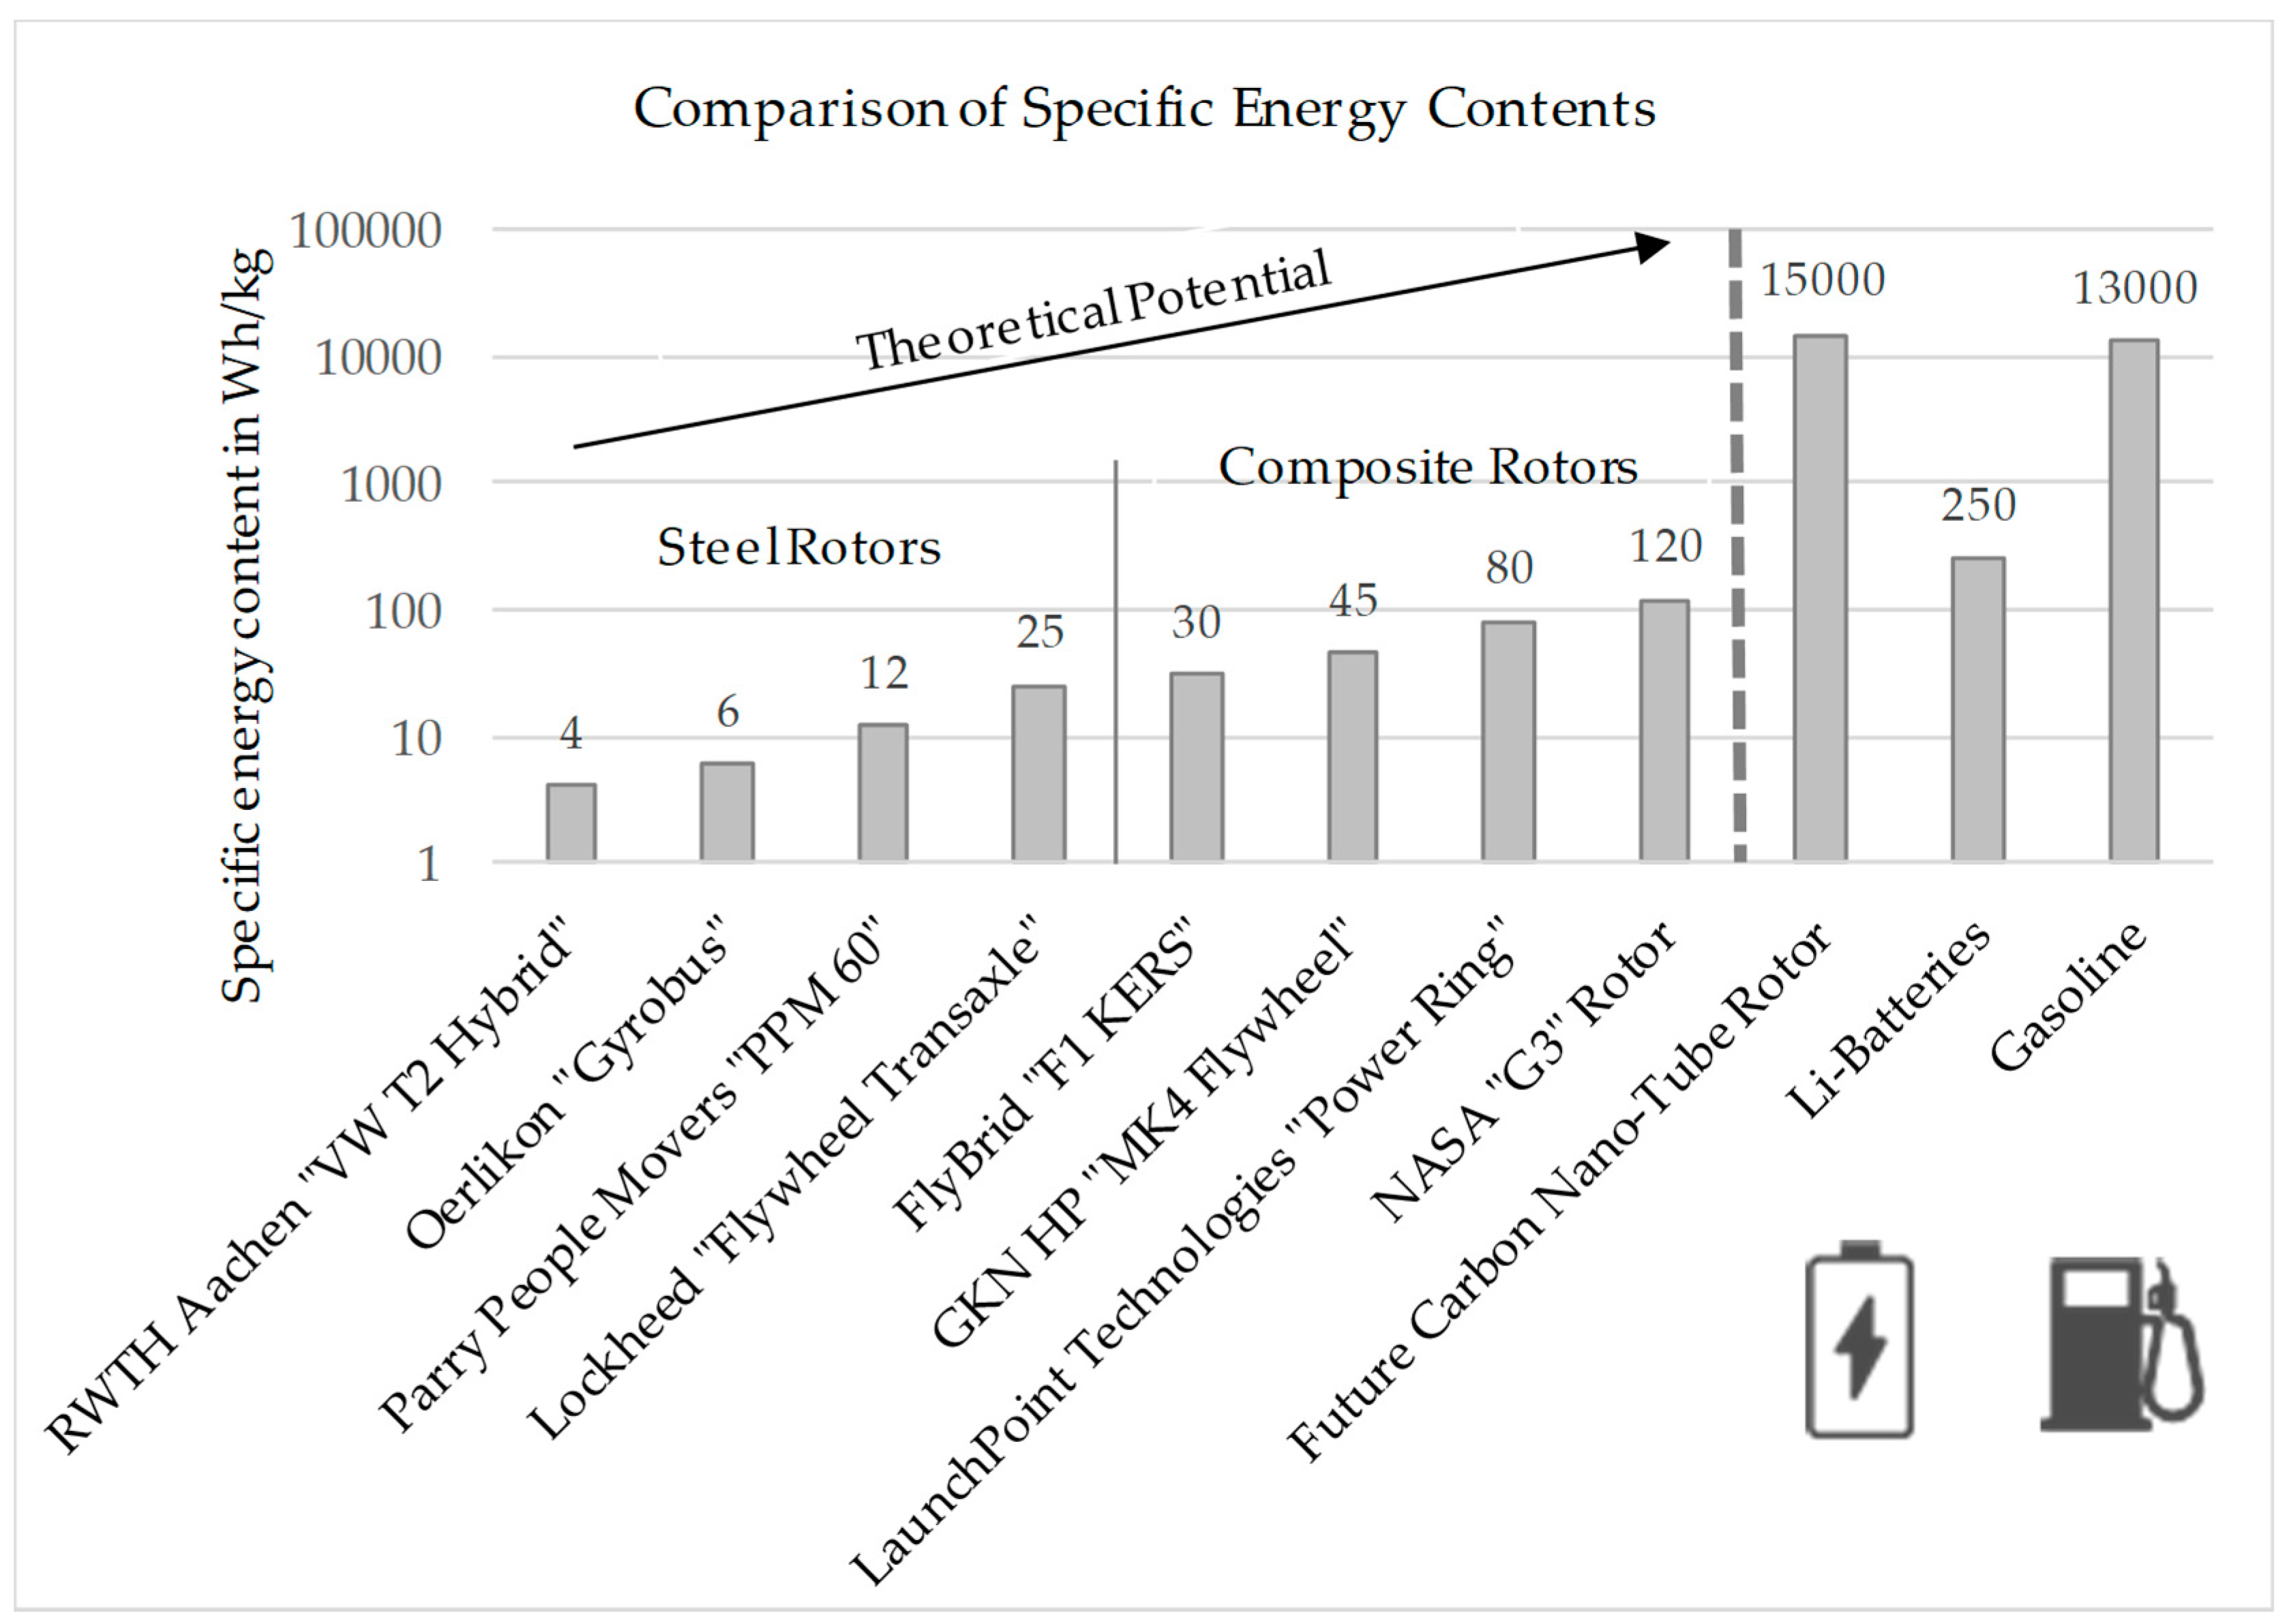
A spinning mass with a kinetic energy content of 5 kWh would weigh around 9 kg when made of carbon fiber reinforced plastic (CFRP) and 137 kg when 42CrMo4 high-strength steel is used, and the material is fully exploited regarding permissible stress. Commercially available systems reach specific energies regarding the rotor up to 50 Wh/kg when using CFRP, for steel flywheels, according to values are much lower.
However, it must be mentioned that the theoretical specific energy values are reduced by design parameters, such as safety factors, stress concentration (notching), etc. Figure 6 depicts the specific energy content of various real flywheel rotors with Li-batteries and fossil fuels. To show the enormous future potential of FESS technology, the theoretical specific energy potential of a rotor made from a material with properties similar to carbo nano-tubes is shown as well.
Usually, the rotor weight is being compensated using a magnet (permanent magnetic thrust bearing), so that the ball bearings are not subjected to the entire rotor weight. The influence of rotor weight compensation is discussed in detail in Section 2.2.5.
While in theory FESS rotors are also subject to aging, due to fatigue stress (or even creep in the case of CFRP rotors) it must be mentioned that these phenomena are usually considered during the design phase by the introduction of a safety factor, and hence, do not result in the capacity fade of the system. In this regard, even rotors made of CFRP can reach high service life when they are designed accordingly, and aging of the matrix is considered [25].

2.2.5. Bearings

In most FESS, two fundamentally different bearing concepts are used: Active magnetic bearings (AMBs) and rolling element bearings (REBs). High costs compared to competing energy storage devices represent one of the major market entry barriers for FESS. For that reason, the upcoming sections focuses on low-cost solutions using REBs. Table 5 gives a brief overview of REBs compared to AMBs.
The REB’s service life mainly depends on the applied loads. Generally, bearing loads are caused by rotor weight and machine dynamics/imbalance forces. There are different approaches to minimize bearing loads:
  • Resilient bearing seat/supercritical rotor operation [26,27];
  • Passive magnetic weight compensation [20,28];
  • Precise rotor balancing [20,29];
  • Active vibration control concepts [30].
Concepts based on active vibration control will not be considered within this publication as they have not reached readiness for marketing in FESS yet [26]. The other three measures are considered and explained briefly in the following paragraph using an example with the specific properties stated in Table 6:
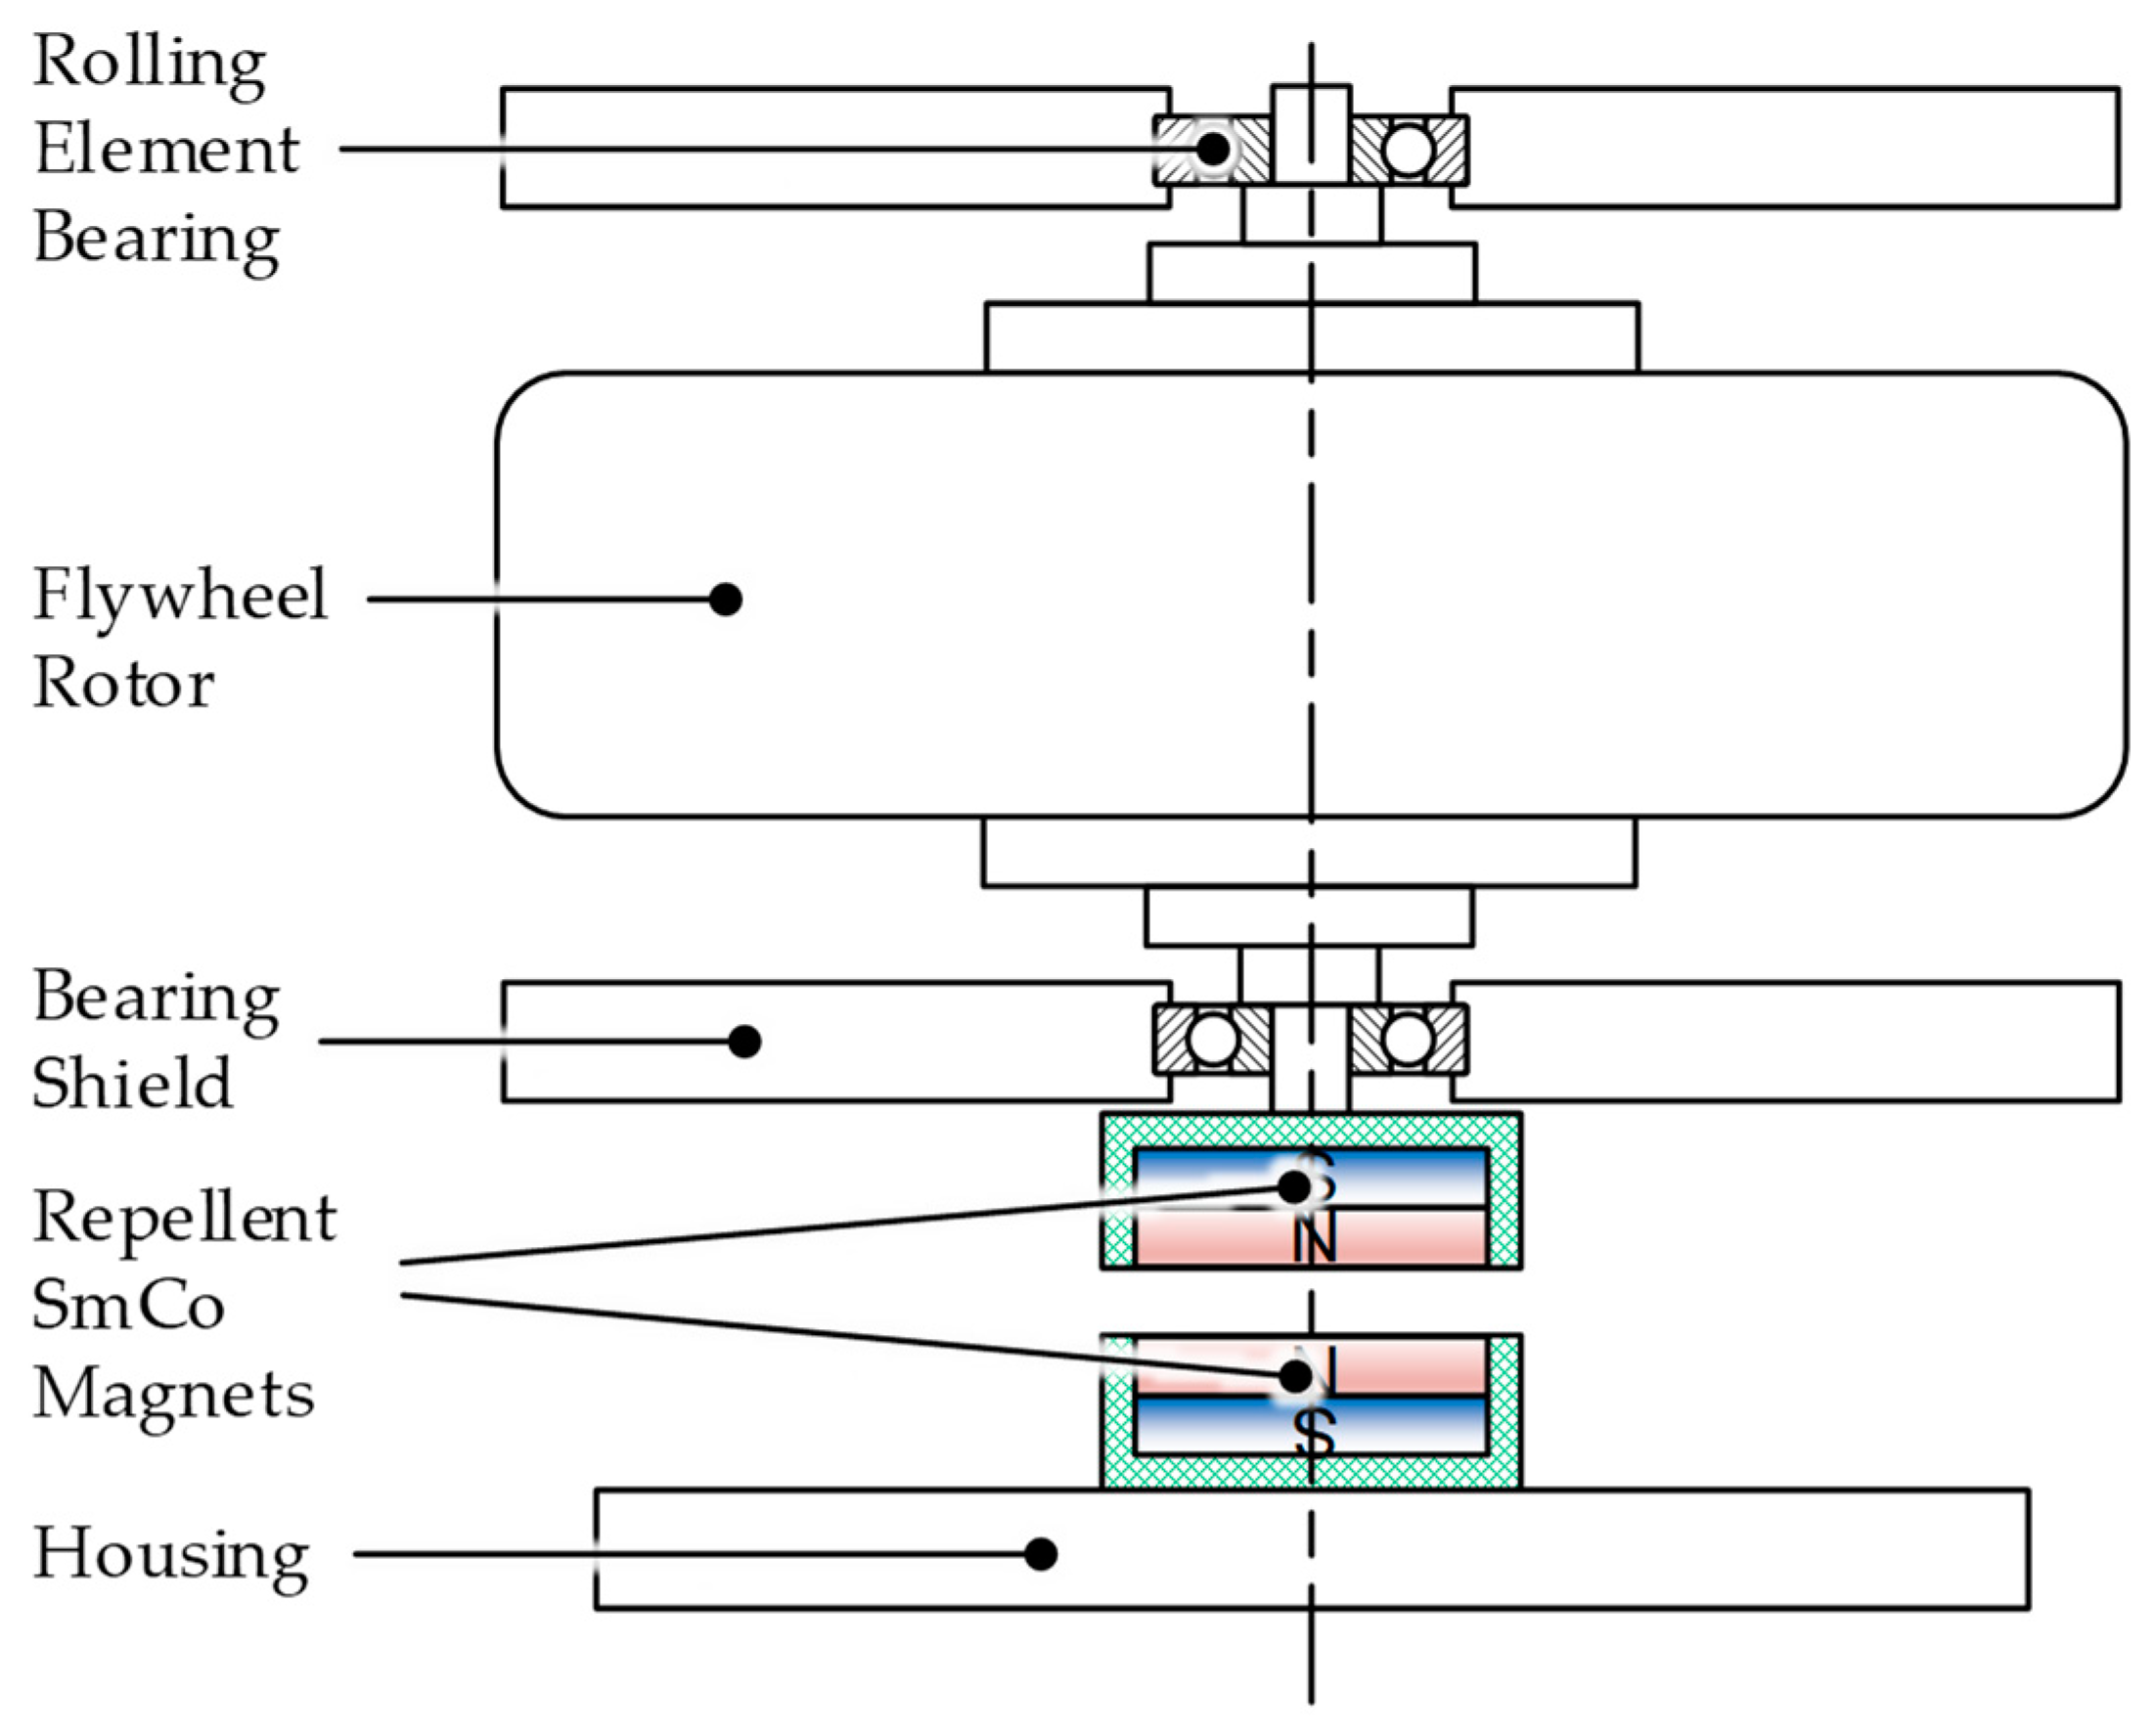
Axial bearing loads can, in fact, be almost entirely compensated by a passive magnetic lifting system, as shown in Figure 7, provided the system is designed with a vertical axis of rotation, which is normally the case. As shown in Figure 8a weight compensation is key to reach reasonable bearing service life. An attracting configuration using a ring magnet that would directly pull a ferromagnetic steel element on rotor upward has some disadvantages because of high eddy current losses at high rotor speeds. Using an additional permanent magnet on the rotor acting as a counter pole, the eddy current losses can be almost eliminated. For the remaining decision of either pulling the rotor on top or pushing it upwards from magnets mounted at the bottom, the latter configuration is preferable, due to its inherent stability of this configuration taking into account the direction of gravity. A demonstration video showing this configuration is uploaded in the Supplementary Materials of this publication.
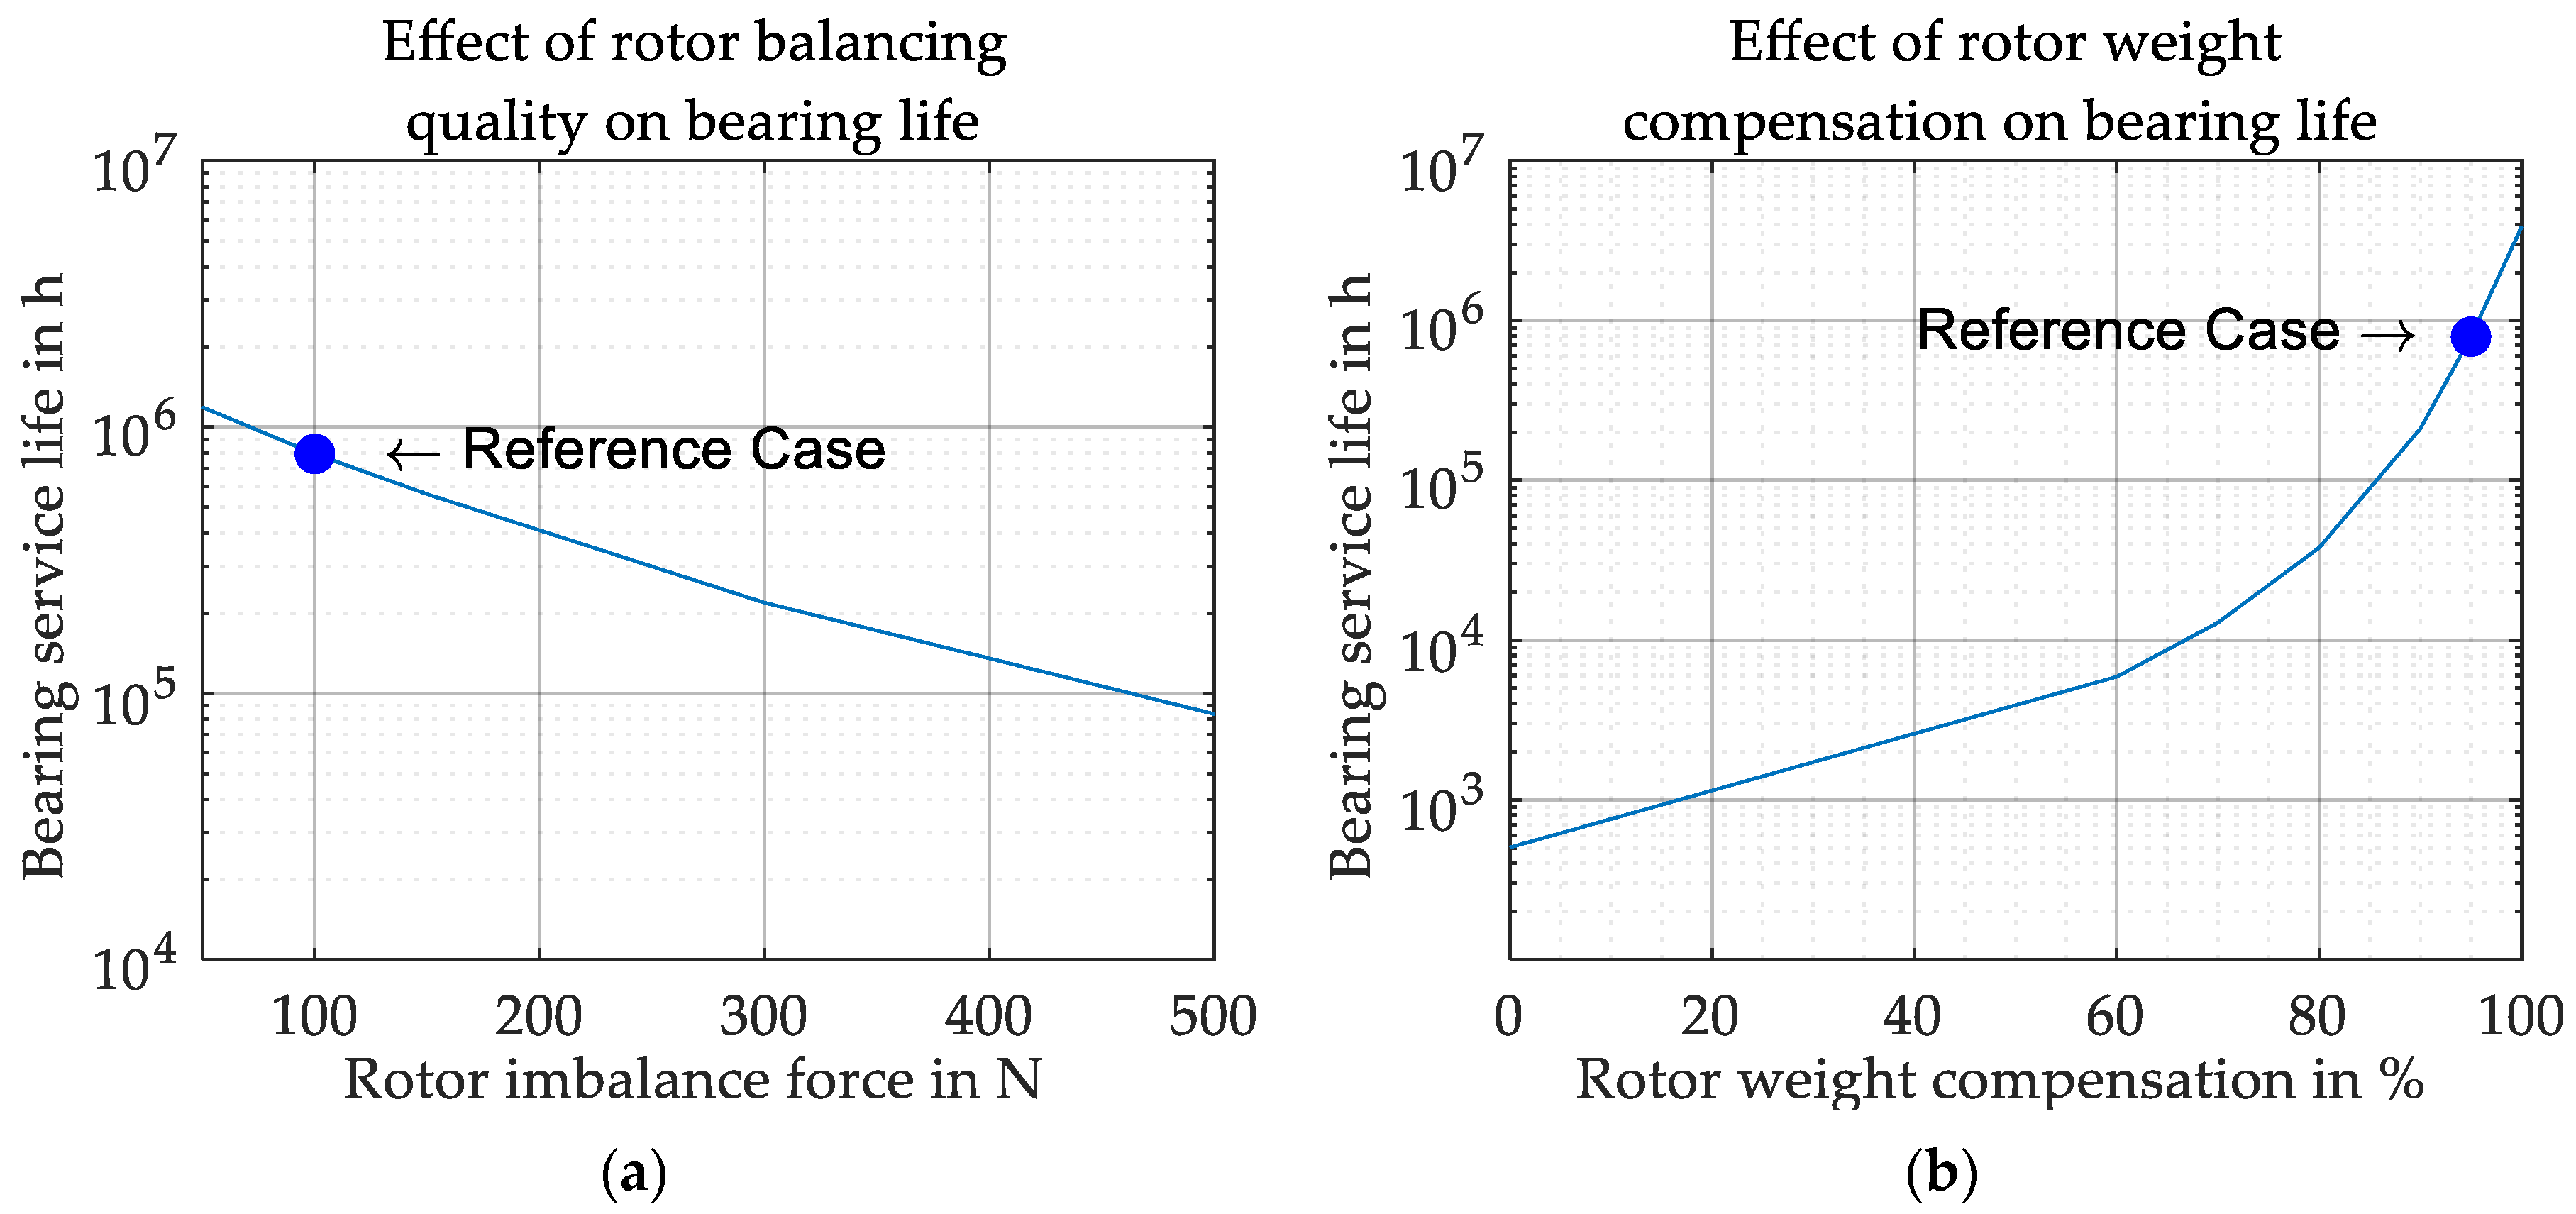
However, even if the rotor weight is nearly entirely compensated, imbalance forces remain. Based on a constant imbalance force of 100 N, bearing life for different compensation levels is shown. Without weight compensation, the bearings last only 21 days, but when 95% of the weight is compensated, bearing life increases up to more than 90 years. It must be noted that at compensation levels above 100% one bearing might be completely relieved which may cause slippage of the balls and lead to rapid system failure [31].
A flexible bearing suspension is used to operate the rotor supercritically. This means that at least the first two eigenfrequencies are surpassed and “self-centering” of the rotor occurs. During supercritical rotor operation bearing primarily loads, depend on the bearing seat’s stiffness and the rotor imbalance and not on rotational speed [26]. Figure 8b shows the decrease of bearing life from 90 years to 25 years, when the rotor imbalance force is increased from 100 N to 300 N. Higher imbalance requires higher axial prestress of the bearing configuration, which is taken into account. For this study a magnetic weight compensation of 95% resulting in a remaining weight load of 74 N is assumed. Still, it must be mentioned that rotor imbalance may change over time, due to creep, wear or setting of joints.
Bearing friction torque is one of the main causes of losses in FESS and is mainly influenced by the following parameters:
● Size and geometry of the bearing
● Applied loads
● Rotational speed
● Lubrication
In order to calculate the resulting power loss bearing friction torque must be multiplied with the rotational speed.
The influence of bearing size, cage material and weight compensation factor on torque loss is a very complex matter and outside the scope of this publication. Detailed studies on the minimization of FESS bearing losses are available in References [1,32,33]. Still, as lubrication strongly affects FESS service life, the effects of lubricant viscosity and minimum quantity lubrication are discussed in the subsequent Section 2.2.7.

2.2.6. Lubrication

Generally speaking, there are three different lubrication principles for high speed rolling element bearings in FESS:
● Grease● Oil● Solid lubrication
For the considered use-cases are only oil and grease lubrication are relevant, as solid lubrication is mainly used when ambient pressures below 0.1 to 0.01 μbar are required [34]. Furthermore, oil and grease have superior service life for application in FESS compared to solid lubrication, and both are applicable for the considered use-cases. It must be noted that special vacuum grease/oil must be used in order to avoid outgassing, which has a detrimental effect on vacuum quality and may even lead to system failure.
Grease lubrication represents the most commonly used lubricating concept because it requires the least constructive and financial effort to implement, but shows some drawbacks regarding service life compared to oil lubrication [35]. Usually, fresh grease is stored in cartridges and extracted on demand. Standard recommended shelf life for grease in closed and sealed cartridges goes up to five years when stored properly [36]. During operation, service life depends strongly on applied loads and temperature. Above the permissible continuous maximum temperature for a specific grease, a temperature rise of 15 °C cuts grease service life in half [32]. Therefore, thermal management is crucial for FESS. In order to reach high service life, ongoing maintenance and grease change is required.
Oil lubrication is superior to grease with respect to service life. The used oil can be filtered continuously, thermally conditioned and may easily be changed on demand. Initial costs and effort to implement an oil lubrication circuit are significantly higher compared to grease. Due to the operation under vacuum, the lubrication concept must meet special requirements. Though the functionality of oil lubrication in FESS has been demonstrated in various research projects [37], these systems are not available off-the-shelf.

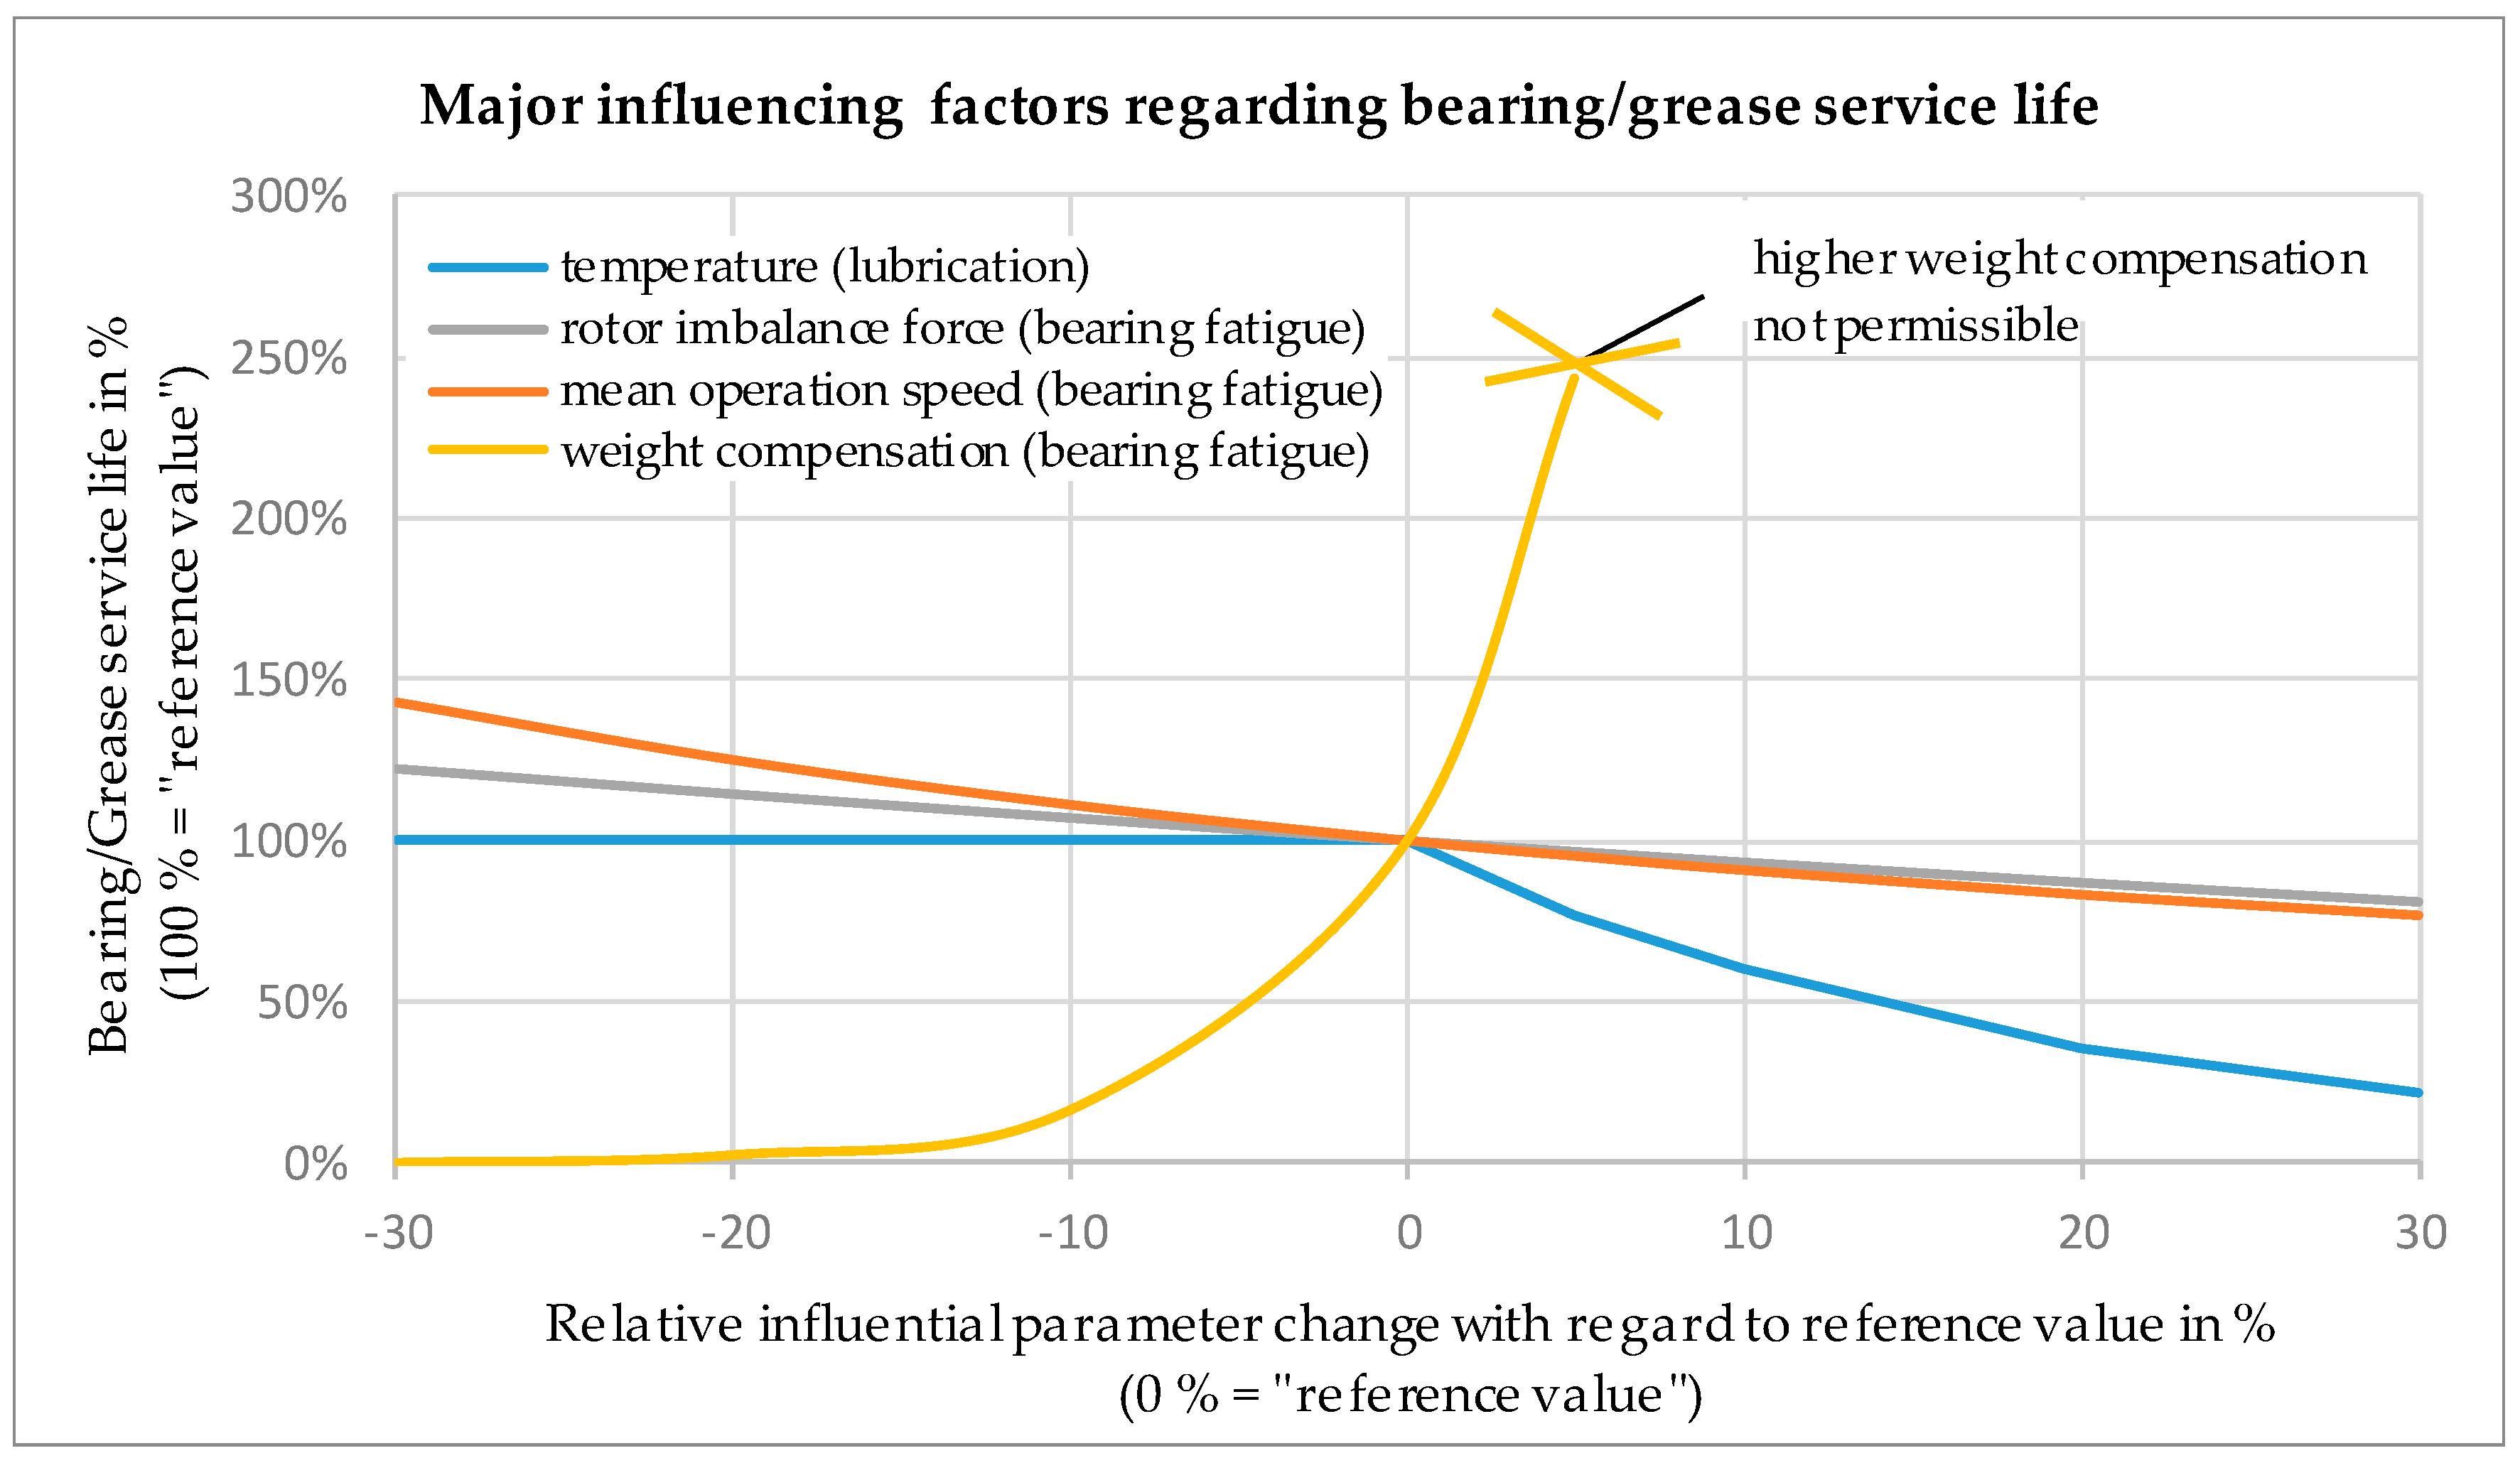
2.2.7. FESS Service Life

Based on the reference system presented in Table 6, Figure 9 summarizes the main influencing factors and their effect on bearing and lubrication service life.
In this example, grease lubrication and operation at the maximum continuous temperature limit are assumed. Therefore, every increase of 15 °C decreases lubrication service life by 50% until the maximum permissible operating temperature is reached (not shown in Figure 9). In short, FESS service life > 25 years is feasible with only minor maintenance effort.

3. Use-Case Analysis and Results

In order to dimension any energy storage device accordingly, the predictability of the duty cycle is absolutely essential. Hence, one of the best predictable use-cases—public transport bus service—was chosen. To be more precise, the case of fully electrified buses with on-board energy storage (no hybrid- or trolley-variants) is considered. To specify the requirements for the energy storage onboard the bus, or possibly inside the charging station as buffer storage for grid load mitigation, the city of Graz in Austria is used as an example:
According to the public transport company (https://www.holding-graz.at/graz-linien) of Graz in Austria, 151 buses (currently mainly equipped with diesel engines) drive an average of 25,000 km per day. In total each bus travels around 0.5–1 million kilometers during its expected lifetime of 10–15 years. Using a representative urban city bus route (“Route 63” in Graz), the typical energetic requirements for a 12-m-bus were derived based on experiences gathered by the operator, and are shown in Table 7.
Operating time during a whole day is around 16–18 h, so around 300 kWh storage would be needed to drive a whole day without any charging stops. For the most part of the day, there are six buses on the route simultaneously. Therefore, a bus arrives at the ‘end-stop’ every 10 min and (depending on traffic) a few minutes are left before it has to leave again. This time (0–5 min) could be used as a ‘charging-window’. Assuming a 2-min charging window at the 10 min end stop (The actual duration of the end stop may vary depending on traffic; hence, a minimum of 2 min is assumed for charging.), an average power of 540 kW would be needed to transfer the previously calculated 18 kWh. Figure 10 shows two electric buses during operation in Graz.
On-board Energy Storage:
In principle, three different scenarios for the in-bus (onboard) energy storage have to be considered:
  • ‘large energy storage’—the energy storage capacity is large enough, so that the bus could travel the whole day without recharging. The bus may be charged in the bus garage overnight, or partially at the end-stop during the day.
  • ‘medium energy storage’—the bus can travel a few round trips without recharge, but not the whole day. The bus can be charged at the end-stop only, or partially at the end-stop—slowly depleting the storage during the day—followed by a full charge overnight in the bus garage. The rush-hour can be handled without recharging the storage, and thus, the timetable can be met easily. Compared to scenario 1, this concept offers some advantages regarding weight and storage costs.
  • ‘small/minimum energy storage’—the capacity is enough for a single loop, and the bus has to be recharged every time at the end-stop. However, the energy storage size depends on the route (travel distance, duration), weather conditions (heating/cooling energy need), traffic conditions (especially congestion), etc. making it nearly impossible to design a universally applicable cost-effective solution. Today, typically a combustion engine is added to the vehicle for this scenario leading to a hybrid electric vehicle (HEV) solution.
Due to the limitations of the ‘small/minimum storage’ scenario and the exclusion of hybrid solutions, for further calculations, only case 1 and 2 are taken into account.
Charging Station Energy Storage:
In terms of the integration of renewables into the grid, two aspects are important:
  • The bus-recharge should be performed during the day, due to solar power availability. (Even though a bus route in Austria was selected and Austria has a lot of hydro power, the general use-case is relevant to any country, and since the global solar power potential is higher than the present world energy consumption [38], the solar peak should be considered)
  • A uniform grid load should be pursued to avoid thermal overload, instabilities, voltage drop, etc.
This can be achieved by utilizing an energy storage device located directly at the charging station, as it was proposed and tested in References [11,16,39] and depicted in Figure 11.
Given the previous example of 2-min-long 540 kW charge pulses every 10 min, an energy storage enhanced charging station with 90% efficiency would smooth out the power drawn from the grid to a continuous value of around 130 kW. This would lower the demand on the grid by avoiding possible (thermal) overloads of the powerlines and keeping voltage and frequency within the required specifications. During an entire day, around 100 charging processes are performed accumulating to about 35,000 cycles per year. An additional advantage of storage enhanced charging station is the reduced grid power compared to overnight charge: A single bus needs about 300 kWh per day. Therefore, charging all six buses in about 5 h overnight needs about 360 kW—around three times more compared to the previously calculated 130 kW.
The high demands regarding power, cycle life and energy content of energy storage for professional use in public transportation require careful evaluation of the underlying aging processes, as discussed in Section 2. For the considered on-board use-cases (‘medium’ and ‘large’ energy storage) supercaps and flywheels were ruled out for the following reasons:
(a)
The high required energy makes supercaps too heavy and expensive.
(b)
FESS have major drawbacks regarding self-discharge behavior, as well as cost and weight, which represent the main requirements for transportation applications.

3.1. On-Board ‘Large’ Energy Storage

For the given the example, a 300 kWh energy storage device is needed to allow operation for an entire day. To keep the weight within limits energy storage with high specific energy should be used, e.g., an NCA or NMC Li-Ion battery. Since the battery deteriorates during usage, and 300 kWh is needed at EOL, the BOL capacity must be accordingly higher. Using a capacity deterioration of 33% to define the EOL state, the BOL capacity must be increased to 450 kWh.
With respect to lifetime analysis, cycle life will be dealt with at first. If the battery is charged overnight, it is cycled only once a day, resulting in a high DOD each day. Over the duration of 10 to 15 years, this leads to about 3000–5000 cycles, or an energy throughput of 1–1.6 GWh. Normally, high energy cells are not capable of sustaining that many cycles. Typically, they are able to deliver only 500–1000 cycles (100% DOD), which for the 450 kWh battery would give an energy throughput of about 0.23–0.45 GWh until EOL. Therefore, they would have to be exchanged one or more times over the lifetime of the bus. However, if the operating regime is changed to intermediate charging at the end station, the DOD is significantly lowered. In the given use-case the energy transferred for a single cycle is 18 kWh. Compared to the battery capacity of 450 kWh this corresponds to a DOD of only 4%. As previously shown, the possible energy throughput during a battery’s lifetime depends tremendously on the DOD—for some batteries, the manufacturers claim an inverse proportional behavior on DOD [10,14]. That means, for a DOD of 4% an increase of cycle life by a factor of 25 would be achievable, resulting in a possible energy throughput of 6–11 GWh, far exceeding the needed 1–1.6 GWh previously shown. So, even if the actual battery does not scale as well, a (cycle) lifetime of 10 to 15 years should still be feasible.
Of course, another possibility is to use cells with higher cycle life to enable the possibility of overnight charge. Those could either be a different battery technology (e.g., LTO or LFP), or they could still be of NCA or NMC type (but optimized for longer life). In both cases, the disadvantage would be a higher battery weight, due to lower specific energy of the cells.
Taking into account the calendar life as well, a significant additional decrease in capacity would occur during those 10–15 years. Hence, most likely, the battery would still need to be replaced after about 5–10 years. Still, to reach such high lifetime in this heavy-duty application thermal conditioning to low operating temperatures (around 20 °C) is mandatory. Table 8 summarizes the above elaborations.

3.2. On-Board ‘Medium’ Energy Storage

Using energy storage with less capacity can save cost and weight. For the example considered, a BOL capacity of 90 kWh (80% reduction in respect to the previous example) is assumed. Given the recharge power of 540 kW, this corresponds in a charging C-rate of 6, too high for a ‘high energy’ optimized battery. Moreover, since the energy storage has less capacity than in the above example, the cell must have a much higher cycle life, as is the case with LFP and LTO cells. These cells have less specific energy, reducing the possible weight savings, but still, an improvement by a factor 2–3 would be possible compared to the ‘large’ energy storage case.
Using an AMP20m1HD-A cell as an example (LFP cell from A123 [9]), the cell loses 10% capacity after 2700 cycles (100% DOD, 23 °C, 5 C charge- and 1 C discharge-rate). Since the DOD of the considered use-case is only 20% (18 kWh/90 kWh), it can be assumed that after an energy throughput of 1–1.6 GWh (cycling during 10–15 years) the cell has lost about 10–15% capacity. Due to the calendar aging additionally about 15–25% capacity is lost after 10–15 years (at 23 °C), resulting in about 25–40% overall capacity loss. Still, even the 40% loss after 15 years (with ~54 kWh remaining) would enable the bus to drive 3 whole rounds. Table 9 summarized the key findings explained in the paragraph above.

3.3. End-Stop Charge Station Energy Storage

In contrast to the on-board energy storage, which is charged once a day or every hour at the bus-stop, the charge station’s energy storage is cycled every 10 min, resulting in about 35,000 cycles per year. Assuming a charge transfer efficiency of 90%, during the charge duration of 8 min 127 kW are drawn from the power grid, charging about 15 kWh into the energy storage. Afterwards, the energy storage is discharged within 2 min with a power of 413 kW. With the additionally 127 kW still drawn from the grid, the bus is charged with the desired 540 kW, as shown in Figure 12.
Using a chemical battery as buffer stationary storage in this scenario, a technology with very high cyclability (e.g., LTO) is necessary. For example, a 100 kWh battery built with Altairnano’s LTO technology [10,40] would have 25 years calendar life or sustain about half a million cycles at 15% DOD (both values at 25 °C). In combination, this would give about 10–15 years of service life. Using supercaps could increase this interval to about 15–25 years [8]. However, like for the on-board energy storage scenarios, the thermal conditioning to 20–25 °C (max.) is absolutely necessary to achieve those long lifetimes for electrochemical energy storage.
Alternatively, using a FESS could tremendously extend the achievable service life, well beyond 25 years. Of course, there are some components, which may need to be replaced during the systems life span, like grease and oil in the case of mechanical bearings, the necessary maintenance of the vacuum pump or the exchange of electronic components. However, the main parts (flywheel mass, housing, electric motor), which also represent the main cost factors of the energy storage system are characterized by excellent longevity and do not need to be replaced. An additional advantage of FESS compared to electrochemical energy storage systems is the insensitivity to temperature—especially regarding lifetime—enabling the usage of simple water cooling circuits instead of costly chilling systems.

4. Summary

Within this study, energy storage for sustainable transport applications was investigated with respect to service life. The theoretical background of different energy storage systems, as well as different use-cases were described in detail. For exemplary energy storage comparison and benchmarking, the use-case of a fully electric transit bus operating in urban public transportation was selected, whereas onboard energy storage and buffer energy storage inside the fast-charging station were considered. From a great variety of options, three established and feasible energy storage systems were chosen for a more detailed analysis. For energy storage inside the fast-charging station, it was shown that high demand on cycle life and other requirements, such as short storage time, high power and long targeted service life clearly favor flywheel energy storage systems (FESS) over supercapcitors or batteries. However, fewer load cycles and long-time storage onboard the transit bus calls out for state of the art Li-Ion batteries rather than supercaps or FESS. Hence, which energy storage technology is most suitable strongly depends on the envisioned use-case and consequently the actual duty cycle.
A representative FESS module (5 kWh, 100 kW peak) was analyzed for the proposed use-cases and measures to improve/maximize service life was suggested. For the same use-case, a comparable battery system was analyzed, showing that battery size, and therefore, DOD (depth of discharge) is crucial for battery life. Beyond that, the battery solution requires accurate thermal conditioning and monitoring as calendar and cycle life are strongly affected when operated outside a narrow temperature band.
In this context, the great potential of FESS was shown. It is to be expected that in future some of the major advantages of FESS will be exploited, e.g., nearly unlimited cycle and calendar life, easy state of charge determination, independence from limited resources, etc. FESS-specific drawbacks, such as self-discharge, weight and cost may be detrimental to mobile (onboard) applications, but can be mitigated or neglected in some stationary applications, such as EV charging stations. Hence, FESS represent a valuable contribution to the energy revolution by increasing grid stability and facilitating the integration of renewables into the grid.

Supplementary Materials

The following are available online at https://www.mdpi.com/2071-1050/11/23/6731/s1, Video S1: passive magnetic weight compensation demonstrator, Video S2: Basic principle of flywheel energy storage.

Author Contributions

Conceptualization, P.H., A.B. and H.W.; Writing—Original Draft Preparation P.H.; Methodology, P.H., H.W. and B.S.; Software, Validation, Formal Analysis and Investigation, P.H. and B.S.; Data Curation, M.B.; Visualization, P.H., M.B. and A.B.; Project Administration, A.B.; Supervision, Funding Acquisition and Resources, H.W.

Funding

This research was conducted within the Project FlyGrid, funded by the Austrian Research Promotion Agency (FFG) within the Electric Mobility Flagship Projects, 9th call, grant number 865447. Open Access Funding by Graz University of Technology.

Acknowledgments

The authors would like to thank Myonic GmbH for their support regarding the service life of rolling element bearings and their lubrication, as well as Holding Graz for their input regarding urban bus fleet operation.

Conflicts of Interest

The authors declare no conflict of interest.

Abbreviations

AMBActive Magnetic Bearing
BOLBegin of Life
CFRPCarbon Fiber Reinforced Plastic
DLCDouble Layer Capacitor
DODDepth of Discharge
EOCEnd of Charge
EOLEnd of Life
EVElectric Vehicle
ESSEnergy Storage System
FESSFlywheel Energy Storage System
GVBGraz Public Transport Services
HEVHybrid Electric Vehicle
ITInformation Technology
Li-IonLithium Ion
LCOLithium Cobalt Oxide
LFPLithium Iron Phosphate
LMOLithium Manganese Oxide
LTOLithium Titanate
NCALithium Nickel Cobalt Aluminum Oxide
NMCLithium Nickel Manganese Cobalt Oxide
REBRolling Element Bearing
SMESSuperconducting Magnetic Energy Storage
SOCState of Charge
SOHState of Health

References

  1. Buchroithner, A. Schwungradspeicher in der Fahrzeugtechnik; Springer: Berlin/Heidelberg, Germany, 2019. [Google Scholar]
  2. MacKay, D. Sustainable Energy—Without the Hot Air; UIT Cambridge Ltd.: Cambridge, UK, 2009. [Google Scholar]
  3. Patrick, J.G.; Moseley, T. Electrochemical Energy Storage for Renewable Sources and Grid Balancing; Elsevier Ltd.: Amsterdam, The Netherlands, 2014. [Google Scholar]
  4. Xue, X.D.; Cheng, K.W.E.; Sutanto, D. A study of the status and future of superconducting magnetic energy storage in power systems. Supercond. Sci. Technol. 2006, 19, R31. [Google Scholar] [CrossRef]
  5. Global Energy Network Institute (GENI). Energy Storage Technologies & Their Role in Renewable Integration; Springer International: Cham, Switzerland, 2012. [Google Scholar]
  6. Luo, X.; Wang, J.; Dooner, M.; Clarke, J. Overview of current development in electrical energy storage technologies and the application potential in power system operation. Appl. Energy 2015, 137, 511–536. [Google Scholar] [CrossRef]
  7. Weber, E.R. Frauenhofer-Institute for Solar Energy systems ISE and Albert Ludwigs University Freiburg, Energy Storage Technologies on the Way to the Global Market. In Proceedings of the 8th International Renewable Energy Storage Conference IRES 2013, Berlin, Germany, 18–20 November 2013. [Google Scholar]
  8. AVX Corporation. High Capacitance Cylindrical Super Capacitors, SCC Series Super Capacitors. 2019. Available online: http://datasheets.avx.com/AVX-SCC.pdf (accessed on 4 October 2019).
  9. A123 Energy Solutions. Battery Pack Design, Validation, and Assembly Guide Using A123 Systems Nanophosphate Cells, Document No. 493005-002. Available online: https://www.buya123products.com/uploads/vipcase/48ccae4db85064588e3d82c105ab4247.pdf (accessed on 4 October 2019).
  10. Altairnano. PowerRack Description. 2019. Available online: https://altairnano.com/products/powerrack (accessed on 4 October 2019).
  11. Makohin, D.; Viveiros, F.; Zeni, V.S. Use of lithium iron phosphate energy storage system for EV charging station demand side management. In Proceedings of the IEEE 8th International Symposium on Power Electronics for Distributed Generation Systems (PEDG), Florianopolis, Brazil, 17–20 April 2017. [Google Scholar]
  12. Maxwell Technologies. Datasheet: 3.0V 3400F Ultracapacitor Cell—BCAP3400 P300 K04/05. Available online: https://www.maxwell.com/images/documents/3V_3400F_datasheet.pdf (accessed on 2 October 2019).
  13. Panasonic. NCR20700B Data Sheet. Available online: http://www.batteryspace.com/prod-specs/10873%20specs%20.pdf (accessed on 3 October 2019).
  14. Saft. Evolion Li-Ion Battery—Technical Manual; Document No. 21880-2-0115. Available online: https://www.manualslib.com/manual/1132262/Saft-Evolion.html (accessed on 30 September 2019).
  15. Samsung SDI. Specification of Product for Lithium-Ion Rechargeable Cell, Model Name: INR18650-35E. Available online: https://www.bto.pl/pdf/08097/INR18650-35E.pdf (accessed on 1 October 2019).
  16. Zhao, H.; Burke, A. An intelligent solar powered battery buffered EV charging station with solar electricity forecasting and EV charging load projection functions. In Proceedings of the IEEE International Electric Vehicle Conference (IEVC), Florence, Italy, 17–19 December 2014. [Google Scholar]
  17. Maxwell Technologies. Product Guide—Maxwell BOOSTCAP Ultracapacitors; Document No. 1014627.1. Available online: https://www.maxwell.com/images/documents/PG_boostcap_product_guide.pdf (accessed on 2 October 2019).
  18. U.S. Department of Energy. Office of Energy Efficiency & Renewable Energy. Available online: Fueleconomy.gov (accessed on 4 December 2018).
  19. Buchroithner, A.; Wegleiter, H.; Schweighofer, B. Flywheel Energy Storage Systems Compared to Competing Technologies for Grid Load Mitigation in EV Fast-Charging Applications. In Proceedings of the 27th International Symposium on Industrial Electronics (ISIE), Cairns, Australia, 13–15 August 2018. [Google Scholar]
  20. Buchroithner, A.; Brandstätter, A.; Recheis, M. Mobile Flywheel Energy Storage Systems: Determining Rolling Element Bearing Loads to Expand Possibilities. IEEE Veh. Technol. Mag. 2017, 12, 83–94. [Google Scholar] [CrossRef]
  21. Karrari, S.; Noe, M.; Geisbuesch, J. High-speed Flywheel Energy Storage System (FESS) for Voltage and Frequency Support in Low Voltage Distribution Networks. In Proceedings of the IEEE 3rd International Conference on Intelligent Energy and Power Systems (IEPS), Kharkiv, Ukraine, 10–14 September 2018. [Google Scholar]
  22. Sbordone, D.; Bertini, I.; Di Pietra, B.; Falvo, M.C.; Genovese, A.; Martirano, L. EV fast charging stations and energy storage technologies: A real implementation in the smart micro grid paradigm. Electr. Power Syst. Res. 2015, 120, 96–108. [Google Scholar] [CrossRef]
  23. Genta, G. Kinetic Energy Storage—Theory and Practice of Advanced Flywheel Systems; Butterworth & Co. Ltd.: London, UK, 1985. [Google Scholar]
  24. Buchroithner, A.; Haidl, P.; Birgel, C.; Zarl, T.; Wegleiter, H. Design and Experimental Evaluation of a Low-Cost Test Rig for Flywheel Energy Storage Burst Containment Investigation. Appl. Sci. 2018, 8, 2622. [Google Scholar] [CrossRef]
  25. Bai, Z.; Wang, J.; Ning, K.; Hou, D. Contact Pressure Algorithm of Multi-Layer Interference Fit Considering Centrifugal Force and Temperature Gradient. Appl. Sci. 2018, 8, 726. [Google Scholar] [CrossRef] [Green Version]
  26. Haidl, P.; Zisser, M.; Buchroithner, A.; Schweighofer, B.; Wegleiter, H.; Bader, M. Improved Test Rig Design for Vibration Control of a Rotor Bearing System. In Proceedings of the 23rd International Congress on Sound and Vibration, Athens, Greece, 10–14 July 2016. [Google Scholar]
  27. DellaCorte, C. Novel Super-elastic Materials for Advanced Bearing Applications. In Proceedings of the CIMTEC International Ceramics Conference, Montecatini Terme, Italy, 8–13 June 2014. [Google Scholar]
  28. Buchroithner, A.; Haan, A.; Preßmair, R.; Bader, M.; Schweighofer, B.; Wegleiter, H.; Edtmayer, H. Decentralized Low-Cost Flywheel Energy Storage for Photovoltaic Systems. In Proceedings of the International Conference on Sustainable Energy Engineering and Application (ICSEEA), Jakarta, Indonesia, 3–5 October 2016. [Google Scholar]
  29. Buchroithner, A.; Andrasec, I.; Bader, M. Optimal system design and ideal application of flywheel energy storage systems for vehicles. In Proceedings of the 2012 IEEE International Energy Conference and Exhibition (Energycon), Florence, Italy, 9–12 September 2012. [Google Scholar]
  30. Zisser, M.; Haidl, P.; Schweighofer, B.; Wegleiter, H.; Bader, M. Test Rig for Active Vibration Control with Piezo Actuators. In Proceedings of the 22nd International Congress on Sound and Vibration, Florence, Italy, 12–16 July 2015. [Google Scholar]
  31. SKF Gruppe. SKF Hochgenauigkeitslager der Reihe “Super-Precision Bearings”. Available online: https://www.skf.com/binary/78-129877/0901d19680363d4d-13383_1-DE---Super-precision-bearings.pdf (accessed on 30 September 2019).
  32. Schäffler Technologies AG & Co. KG. Wälzlagerpraxis: Handbuch zur Gestaltung und Berechnung von Wälzlagerungen; Vereinigte Fachverlage GmbH: Mainz, Germany, 2015. [Google Scholar]
  33. Buchroithner, A.; Voglhuber, C. Enabling Flywheel Energy Storage for Renewable Energies—Testing of a low-cost, low-friction bearing configuration. In Proceedings of the 12th VDI-Fachtagung Gleit-und Wälzlagerungen, Schweinfurt, Germany, 27–28 June 2017. [Google Scholar]
  34. Birkhofer, H.; Kümmerle, T. Feststoffgeschmierte Wälzlager—Einsatz, Grundlagen und Auslegung; Springer: Berlin/Heidelberg, Germany, 2012. [Google Scholar]
  35. Schaeffler Technologies Ag & Co. KG. Schmierung von Wälzlagern. Available online: https://www.schaeffler.com/remotemedien/media/_shared_media/08_media_library/01_publications/schaeffler_2/tpi/downloads_8/tpi_176_de_de.pdf (accessed on 15 September 2019).
  36. SKF. SKF Maintenance and Lubrication Products. Available online: https://www.skf.com/binary/21-163650/03000EN.pdf (accessed on 10 September 2019).
  37. Rosseta Technik GmbH. Energiespeicher für das Straßenbahnnetz. Available online: http://www.rosseta.de/texte/bahnsr.pdf (accessed on 20 September 2019).
  38. Trieb, F.; Schillings, C.; O’Sullivan, M.; Pregger, T.; Hoyer-Klick, C. Global Potential of Concentrating Solar Power. In Proceedings of the 15th SolarPaces Conference, Berlin, Germany, 15–18 September 2009. [Google Scholar]
  39. Renewable Energy World. Energy Storage for EV Charging in Canada to Combat Range Anxiety. Available online: http://www.renewableenergyworld.com/articles/2017/07/energy-storage-for-ev-charging-in-canada-to-combat-range-anxiety.html (accessed on 26 July 2016).
  40. Altairnano. 24 V, 60 Ah Battery Module Datasheet; Document No. 3336145 R2. 2012. Available online: http://altairnano.com/wp-content/uploads/2015/11/24V-60Ah-BATTERY-MODULE-Data-Sheet.pdf (accessed on 7 October 2019).
Figure 1. Classification of energy storage systems according to energy type, including examples.
Sustainability 11 06731 g001
Figure 2. Power rating, energy capacity and discharge time of different energy storage systems for stationary and mobile transportation applications. Data based on References [6,7].
Sustainability 11 06731 g002
Figure 3. Expected supercap life depending on temperature and maximum voltage. (With kind permission by AVX Corporation) [8].
Sustainability 11 06731 g003
Figure 4. (a) The famed Gyrobus by Maschinenfabrik Oerlikon in 1953 powered solely by a 1500 kg electromechanical steel flywheel. (Image credit by Historisches Archiv ABB Schweiz, N.3.1.54627); (b) A modern transit bus accommodating a hybrid drive train with a flywheel energy recovery system by PUNCH Flybrid. (Image credit PUNCH Flybrid Ltd., Silverstone, UK).
Sustainability 11 06731 g004
Figure 5. (a) Schematics of a flywheel energy storage system, including auxiliary components; (b) Energy content as a function of rotational speed.
Sustainability 11 06731 g005
Figure 6. The specific energy content of selected real world flywheel rotors compared to future rotor potential and other energy storage [24].
Sustainability 11 06731 g006
Figure 7. Cartoon image of low-cost, low-loss bearing configuration, including passive magnetic rotor weight compensation.
Sustainability 11 06731 g007
Figure 8. Influence of weight compensation (a) and rotor balancing quality (b) on bearing life (based on the reference case, shown in Table 6.).
Sustainability 11 06731 g008
Figure 9. Major influencing factors (temperature, imbalance force, operational speed, weight compensation) on bearing and lubrication service life for the reference case listed in Table 6.
Sustainability 11 06731 g009
Figure 10. Fully electric buses operating in Graz, Austria: (a) Bus equipped with supercaps at the pantograph charging station (Route 50); (b) Bus with Lithium-Ion batteries (Route 34).
Sustainability 11 06731 g010
Figure 11. Electric vehicle charging station concept with built in buffer storage. (Photos with kind permission by SECAR Technologie GmbH and PUNCH Flybrid).
Sustainability 11 06731 g011
Figure 12. Grid load and charging power level of the load cycle for the “end-stop charge station use-case” shown for two consecutive charging cycles.
Sustainability 11 06731 g012
Table 1. General characteristic and economic properties of different energy storage technologies relevant to sustainable transport applications.
Energy Storage TechnologySpecific Energy (Wh/kg)Specific Power (kW/kg)Temp. Range (°C)Cycle life (-)
Mechanical Energy Storage
Flywheel Energy Storage Systems (FESS)10–100>10−30 °C to +70 °Climitless
Chemical Energy Storage (only Li-Ion Batteries)
Lithium Iron Phosphate (LFP)90–1204−20 °C to +60 °C5000–6000
Lithium Titanate LTO60–801−30 °C to +75 °C>15,000
Lithium Nickel Cobalt Aluminum oxide (NCA)200–3001−20 °C to +60 °C500
Lithium Cobalt Oxide (LCO)150–2001−20 °C to +60 °C500–1000
Lithium Manganese Oxide (LMO)100–1504−20 °C to +60 °C300–700
Lithium Nickel Manganese Cobalt oxide (NMC)150–2801–4−20 °C to +55 °C3000–4000
Electrical Energy Storage
Double Layer Capacitor (DLC)5–10>10−20 °C to +60 °C1 million
Hybrid Capacitor10–20>10−20 °C to +60 °C>50,000
Values refer to cell-level for batteries/supercaps and the rotor only for FESS, neglecting periphery and auxiliary systems. Some properties strongly depend on operating conditions, such as ambient temperature. Therefore, it must be mentioned that representative average characteristic values based on References [6,8,9,10,11,12,13,14,15,16,17] were used.
Table 2. Temperature dependence of cycle life of an LFP cell from A123 (AMP20 [9]).
Effect of Temperature for 1 C/−C, 100% DOD Cycling for AMP20 Cells
Cycle Count for Different Remaining Capacities at Different Temperatures
Capacity25 °C35 °C45 °C55 °C
90%26001450850400
80%515031002000850
70%7700 *500030501200
* Estimate, based on logarithmic extrapolation.
Table 3. EOC-voltage depending on the application of a Li-Ion cell (Samsung—INR18650-35E) [15].
Standard Charging Voltage: Battery—4.20 V Cell (Samsung INR 18650-35E)
ApplicationEOC-VoltageApplicationEOC-Voltage
Portable IT4.20 VE-Bike/E-Scooter4.10 V
Power-Tool4.20 VElectric Vehicle4.10 V
Medical4.10 VEnergy Storage4.00 V
Table 4. Possible FESS rotor materials and associated theoretical specific kinetic energy content.
MaterialTensile Strength σmaxDensity ρEnergy Density σmax/ρ
N/mm2 (MPa)Kg/dm3Wh/kg
Mild Steel3407.812.1
Standard Electrical Sheet400813.9
Alloy Special Steel (42CrMo4)11007.836.6
Birchwood1370.6558.5
Aluminum (“Ergal 65”)6002.7261.3
Titanium (“ZK 60”)11505.162.6
High Strength Steel (AlSi 4340)17907.8363.5
Metal Matrix Composite14503.3122
Fiber reinforced plastic (E-Glass/EP 60%) *9602.2132
Kevlar (“Aramid 49EP”/60%) *11201.33234
Carbon Fiber (“M60J”) *20101.5372
Carbon Fiber (“T1000G”) *30401.5563
* For composite materials a ratio of 60% fibers and 40% (matrix/resin) was assumed.
Table 5. Comparison of active magnetic bearing and rolling element bearing concepts.
TypeActive Magnetic BearingRolling Element Bearing
Image Sustainability 11 06731 i001 Sustainability 11 06731 i002
CostVery HighLow
StiffnessLowHigh
Friction LossesVery LowHigh (Load and Speed-dependent)
Additional auxiliary energy supplyHighNot Required
Space requirementHighLow
LifespanVery highHigh (Load Dependent)
Table 6. Properties of a reference FESS for parameter study regarding bearing life.
Specification of Reference System for Parameter Study *
Energy Content5 kWh
Peak Power100 kW
Rotor Weight130 kg
Bearing ConfigurationHybrid Spindle Bearings Myonic 30550 VA—Contact Angle: 15°, (X-Arrangement)
Mean Rotational Speed20,000 rpm
Radial Bearing Load due to Imbalance (Reference)100 N
Magnetic Rotor Weight Compensation (Reference)95% (= 65 N axial load)
* Reference FESS module specifications based on the research project FlyGrid.
Table 7. Energetic properties of the reference use case for energy storage analyses.
Average Values Used as Reference Based on a Representative Bus Route (“Route 63” in Graz)
Daily Mileage per Bus150–200 kmTypical Round Trip Duration1 h
Expected Lifetime10–15 yearsAverage Energy Consumption1.5 kWh/km *
Typical Round Trip Distance12 kmEnergy Consumption per Loop18 kWh
*… Value based on operator experience, including energy demand for heating and cooling.
Table 8. Comparison of charging regimes for the use-case of ‘large’ on-board energy storage.
Use-Case: On-Board ‘Large’ Storage
Battery (NCA or NMC—Cell): Intermediate ChargingBattery (NCA or NMC—Cell): Only Overnight Charging
Calendar Life a20–25 years20–25 years
Cycle life12,500–25,000
4% DOD-cycles
500–1000
100% DOD-cycles
Service Life b10–15 years3.5–4.5 years
Required Capacity (BOL)450 kWh450 kWh
Charge540 kW75 kW
a how long the storage is expected to last in terms of calendar years. Excludes influence of charge/discharge. b how long the storage is expected to last in the real application, including influences of charge/discharge and device temperature based on an EOL capacity fade of 33%.
Table 9. Summary for the use-case ‘medium’ on-board energy storage.
Use-Case: On-Board ‘Medium’ Storage
Battery (LFP Cell)
Calendar Life a10–15 years
Cycle life8000–10,000 cycles
Service Life b10–15 years
Required Capacity (BOL)90 kWh
Charge540 kW
a how long the storage is expected to last in terms of calendar years. Excludes influence of charge/discharge. b how long the storage is expected to last in the real application, including influences of charge/discharge and device temperature based on an EOL capacity fade of 33%.

