Article

Use of FTIR Spectroscopy and Chemometrics with Respect to Storage Conditions of Moldavian Dragonhead Oil

by
Arkadiusz Matwijczuk
1,*,
Tomasz Oniszczuk
2,*,
Alicja Matwijczuk
1,
Edyta Chruściel
1,
Anna Kocira
3,
Agnieszka Niemczynowicz
4,
Agnieszka Wójtowicz
2,
Maciej Combrzyński
2 and
Dariusz Wiącek
5
1
Department of Biophysics, University of Life Sciences in Lublin, 20-950 Lublin, Poland
2
Department of Thermal Technology and Food Process Engineering, University of Life Sciences in Lublin, 20-612 Lublin, Poland
3
Institute of Agricultural Sciences, State School of Higher Education in Chelm, 22-100 Chelm, Poland
4
Department of Analysis and Differential Equations, University of Warmia and Mazury, 10-710 Olsztyn, Poland
5
Department of Physical Properties of Plant Materials, Institute of Agrophysics, Polish Academy of Sciences, 20-290 Lublin, Poland
*
Authors to whom correspondence should be addressed.
Sustainability 2019, 11(22), 6414; https://doi.org/10.3390/su11226414
Submission received: 17 August 2019 / Revised: 25 October 2019 / Accepted: 10 November 2019 / Published: 14 November 2019
(This article belongs to the Special Issue Sustainable Development of the Bioeconomy—Challenges and Dilemmas)

Abstract

:
Oils often have similar properties and can be difficult to identify based on color, smell or taste alone. The present paper suggests the use of Fourier-transform infrared spectroscopy (FTIR) in combination with chemometric methods to explore similarities and differentiate between samples of Moldavian dragonhead oil subjected to different storage conditions. Dragonhead is a plant characterized by very good honey output and ease of cultivation. Principal component analysis (PCA) was applied to a standard, full range of FTIR spectra. Additionally, hierarchical cluster analysis (HCA) was employed to explore the organization of the samples in groups relative to their “proximity” (similarity), by way of Euclidean distance measurement. PC1 and PC2 accounted respectively for 85.4% and 10.1% of the total data variance. PC1 and PC2 were strongly, negatively correlated within the entire spectral range; the only exception was the region corresponding to νs(-C-Hvst, -CH2) vibrations (aliphatic groups in triglycerides), where PC2 was positively correlated. The use of FTIR spectral analysis revealed noticeable differences in the intensity of bands characteristic of the ageing processes (markers of oxidative processes, etc.) taking place in oleaginous samples and related to the processes of fatty acids oxidation.

1. Introduction

One of the aspects of sustainable food production is the widest possible use of raw materials with health-promoting properties. Currently, the bioeconomy is becoming increasingly globalized. As a result of globalization processes, many previously new products now appear on European markets, including plant products such as fruit or seeds, which have valuable antioxidative properties and can potentially offer considerable health benefits to consumers. At the same time, growing health awareness and the general problem of ageing societies dictate the direction of research related to functional food intended for particular age groups. Maintaining a well-balanced diet largely based on plant products, often those advocated by traditional medicine, is fast becoming one of the key concerns in our everyday lives. Apart from fruit, the production of functional food largely depends on oils cold-pressed from seeds. Such oils provide considerable food energy as well as essential unsaturated fatty acids (UFA), phytosterols, and liposoluble vitamins. Cold-pressed oils are considered more nutritious due to their antioxidant and provitamins content, e.g., carotenoids, tocopherols, polyphenols. Oils obtained exclusively from pressing are characterized by a lower content of oxyphitosterols, carcinogenic and mutagenic compounds, as well as the absence of fatty acid trans isomers [1,2]. The sensory quality of oil depends on a number of factors such as exposure to light and oxygen, and time and temperature of storage. Auto- and photo- oxidative processes lead to the oxidation of unsaturated fatty acids, and consequently, to the formation of fatty acid hydroperoxides. It is important that the oil is pressed under appropriate conditions, and stored and packed in an appropriate way.
Moldavian dragonhead (Dracocephalum moldavica L.) is a plant endemic to the Himalayas and southern Siberia, which has been used for medicinal purposes in Central Asia since the Middle Ages. The species is a fragrant, annual plant producing essential oils with a strong, lemony scent, commonly cultivated for ornamental, melliferous, and medicinal purposes [3,4]. Its florescence usually takes place in June. It produces violet or white flowers located at the top of the shoot in the form of an apparent ear composed of pseudowhorls. The essential oils produced by the flowers, stem, and leaves, as well as its sugar-rich nectar, render this plant particularly attractive for pollinating insects [5]. The plant’s essential oils contain e.g., citral, geranial, neral, geraniol, and geranyl acetate [6]. Its above ground parts have been identified as a source of flavones, terpenes, proteins, polypeptides, and 16 amino acid. In August, the plant produces fruit, i.e., schizocarps containing 4 seeds each. The plant is relatively undemanding in terms of its cultivation, and does not require particularly fertile or nutrient-rich soils; however, calcium-rich soils and well-maintained cultures are preferred. Furthermore, cultivation in sun-filled areas facilitates higher concentrations of the essential oil in the flowers and stalks [1]. The seed yield depends on the method of cultivation, and the plant’s botanical form and can vary from 2500 to 2800 kg ha−1 for the white and blue cultivar, respectively [3]. The seeds contain 18–29% of fatty oils rich in essential unsaturated fatty acids (approx. 90%): α-linolenic (61.0%), linoleic (20%), oleic (8.5%), palmitic (6.5%), and stearic (5.0%) [7]. The seeds also contain 21% protein, with a desirable amino acid composition, mucilage with a soluble dietary fiber fraction, and essential oil [8]. Moldavian dragonhead oil is considered very valuable due to its chemical composition; indeed, with its high content of UFAs, the oil obtained from Dracocephalum moldavica seeds may be classified as one of the most sought after biooils in phytomedicine and cosmetology. For this reason, the extracts and oil obtained from this plant are commonly used in the pharmaceutic, cosmetic, and food industries [3].
The widespread use of dragonhead oil has drawn the attention of researchers to the problems related to its storage and the influence of various factors affecting its quality.
A multivariate data analysis allows us to model the chemical and physical properties of simple and complex compounds on the basis of spectroscopic data. The scope and applicability of qualitative and quantitative analyses employing infrared spectroscopy can be enhanced by embracing a statistical methodology in approaching certain research problems. Researchers working in a variety of fields are increasingly encouraged to take advantage of this analytical tool, which further confirms its great scientific potential.
Spectroscopic analyses in the infrared range entail the measurement of the vibration frequencies in the chemical bonds of functional groups such as e.g., C-C, C-H, O-H, C-O, or N-H, following the absorption of radiation [9,10]. The measured values are processed by applying a number of mathematical procedures (including Fourier transform) to the registered absorption spectrum, which is, in turn, correlated to the actual concentration of respective ingredients in the sample in a process of calibration. The data were compressed and further processed statistically using multivariate chemometric techniques, including Principal Component Analysis (PCA) and Hierarchical Cluster Analysis (HCA).
In the last few years, numerous scientific publications have demonstrated the usefulness of spectroscopic methods in the study of the properties of vegetable oils and, above all, the assessment of the quality of edible oils [11,12]. It has been recognized that these methods are valuable for monitoring the quality of edible oils. The study of oils can be carried out with the use of absorption spectroscopy (UV-VIS) [13,14,15] and infrared spectroscopy (IR) [16,17,18,19,20,21]. The latter method can be applied for qualitative and quantitative measurements of parameters of edible oils such as free fatty acid [22], peroxide value [23], iodine and anisidine value [24,25], lipid classes, and fatty acid composition [26,27].
The application of chemometric tools for the description, classification, organization, determination, and exploration of geographic origin and quality control of food products has recently become a very active research area (e.g., [28,29] and references therein). Many authors have attempted to use these tools to classify plant foods or other objects. For example, in [30] the authors applied chemometrics to classify pomegranate juices on the basis of their antioxidant activity. They reported the main determinant of this parameter to be cultivar. In [31], Wang and coauthors carried out PCA to gain an overview of the similarities and differences among 10 algal species, and also investigated the relationships between total phenolic content and different antioxidant activity assays. There are many examples of such research directions at present.
The present study involved the use of multivariate PCA and HCA analyses to identify the main sources of variance between the Moldavian dragonhead oil samples stored under different conditions. The PCA and HCA results were used for the purposes of early classification and interpretation of differing oil samples in the analyzed set.
The main goal of the study presented in the present paper was to analyze the usability of FTIR spectroscopy combined with chemometrics for the purposes of controlling the quality of oil obtained from Moldavian dragonhead seeds, relative to the time and conditions of its storage. Moreover, relevant spectra were analyzed in detail with the use of the aforementioned analytical methods to attempt to identify the spectroscopic (infrared) markers (relevant bands) which reflect the varying rate of ageing processes relative to the conditions under which a given product is stored and the external stimuli to which it is exposed.

2. Materials and Methods

The research material consisted of oil pressed from the seeds of Moldavian dragonhead (Dracocephalum moldavica L.). Before pressing, the seeds were stored in bags at room temperature. Both unheated and thermally-processed seeds were used. The heat treatment entailed heating seeds to 70 °C, 100 °C, and 130 °C, on a metal tray placed in a laboratory drier for a period of 1 h. The oil pressing process was conducted using a DUO screw press by Farmet (Czech Republic) with an efficiency of 18 to 25 kg·h−1 and an engine speed of 1500 rpm. A 10 mm nozzle was used. After pressing, the oil was left for 2 days to allow natural sedimentation to occur, after which it was placed in 10 cm3 dark-glass bottles which were impenetrable by sunlight. Some samples were placed in an argon atmosphere, while others were exposed to oxygen. Directly prior to pressing, control samples were collected for the respective temperatures of seed drying and pressing atmospheres. The remaining 80 samples were stored at two different temperatures: 7 °C (refrigerator) and 20–22 °C (air-conditioned laboratory room) for a period of 1, 2, 3, or 6 months, with and without exposure to light.
The four samples selected for the study were characterized by constant pressing temperature, i.e., 130 °C, and storage temperature, i.e., refrigerated at 7 °C. Therefore, the variables were: the storage atmosphere (argon or oxygen), the color of the bottle (dark or clear), and the storage time.
The oil obtained from pressing was analyzed in terms of its fatty acids profile, acid value (AV), peroxide value (PV), anisidine value (AnV), and iodine value (IV). The general color (GC) was determined, along with the content of carotenoid and chlorophyll pigments, β-carotene, tocopherols, and PC-8.
The fatty acids profile was determined with the use of gas chromatography combined with mass spectrometry. The oil samples were used to obtain methyl esters in accordance with PN-EN ISO 12966-2, and their division was conducted using a Trace GC Ultra chromatograph with an ITQ 1100 spectrometer (Thermo Scientific, USA) with the use of a Rtx-2330 column (105 × 0.25 × 0.25 μm) by Restek. The carrier gas was helium, applied at a constant flow-through rate of 1mL/min.; the temperature range was from 60 to 250 °C (5 °C/min.), and the injection temperature was 250 °C.
FTIR Measurements: Measurements of ATR-FTIR background corrected spectra (25 scans for each sample) were carried out with a HATR Ge trough (45° cut, yielding 10 internal reflections) crystal plate at 20 °C, and were recorded with a 670-IR spectrometer (Agilent Technologies, Santa Clara, CA 95051, USA). The Ge crystal was cleaned with ultra-pure organic solvents (Sigma-Aldrich, Darmstadt, Germany). The instrument was continuously purged with argon for 40 min before and during measurements. Absorption spectra at a resolution of one data point per 1 cm−1 were obtained in the region between 4000 and 400 cm−1. Scans were Fourier-transformed and averaged with Grams/AI 8.0 software (Thermo Electron Corporation; Waltham, MA, United States, USA).
Chemometric analysis: All the registered spectra were subjected to multivariate analyses, specifically, hierarchical cluster analysis (HCA) and principal component analysis (PCA), conducted with the use of the OriginPro software (OriginLab, Northampton, MA, USA) and PCA for spectra application. The numbers associated with the names of every sample in the chemometrics analysis correspond to the conditions of FTIR spectra measurements, that is, number 1 corresponds to the conditions described on Figure 1 and Figure 2, etc.

3. Results and Discussion

The cold-pressed Moldavian dragonhead oil was characterized by a unique content of fatty acids [1,2]. Over 90% of the fatty acids present in this oil are unsaturated, of with over 80% are polyunsaturated fatty acids. The content of palmitic acid (C16:0) was 3.84%, palmitoleic acid (C16:1)–0.19%, stearic acid (C18:0)–1.71%, oleic acid (C18:1)–6.81%, linoleic acid (C18:2 (9,12), n-6 omega-6 fatty acid)–19.01%, α-linolenic acid ALA (C18:3 (9,12,15), n-3 omega-3 fatty acid)–67.91 %, and other acids approx. 0.54%. The results showed that the three predominant fatty acids in the Moldavian dragonhead oil were linolenic (67.9%), oleic (6.8%) and linoleic (19.0%) acids. The content of saturated fatty acids was very low (less then 6%), whereas the oil was rich in unsaturated ones. The contents of mono and polyunsaturated fatty acids were 7.0% and 86.9%, respectively. Compared to other important high-linolenic oils, such as flax and chia oils, the linolenic acid content in Moldavian dragonhead seed oil was higher than that of flax (50%) and chia (62%) oils. The n-3 to n-6 ratio (3.5) was higher than that of flax (3.3) and chia (3.2) oils. The human body cannot synthesize linolenic acid, and therefore, it is known, along with linoleic acid, as an essential fatty acid*. Due to the high content of this fatty acid and high ratio of n-3/n-6, Moldavian dragonhead seed and the extracted oil can be used as a food supplement, where enrichment with omega-3 fatty acids is needed.
Figure 1, Figure 2, Figure 3 and Figure 4 present the ATR-FTIR spectra for the analyzed samples of the oil obtained from Moldavian dragonhead seeds stored at 7 °C (refrigerated) in an Ar or O2 atmosphere, in a dark or clear bottle, respectively: a—immediately after pressing, b—two weeks after pressing, c—four weeks after pressing, d—10 weeks after pressing. The oil was pressed at a temperature of 130 °C. The experimental constants were the oil pressing temperature (130 °C) and the particular storage conditions. The samples were spread on a Zn–Se crystal and analyzed under a N2 atmosphere.
Table 1 and Tables S1–S3 (in Supplementary Materials) provide a description of all the characteristic bands present in the oil samples selected for the study, along with the related vibrations of particular functional groups.

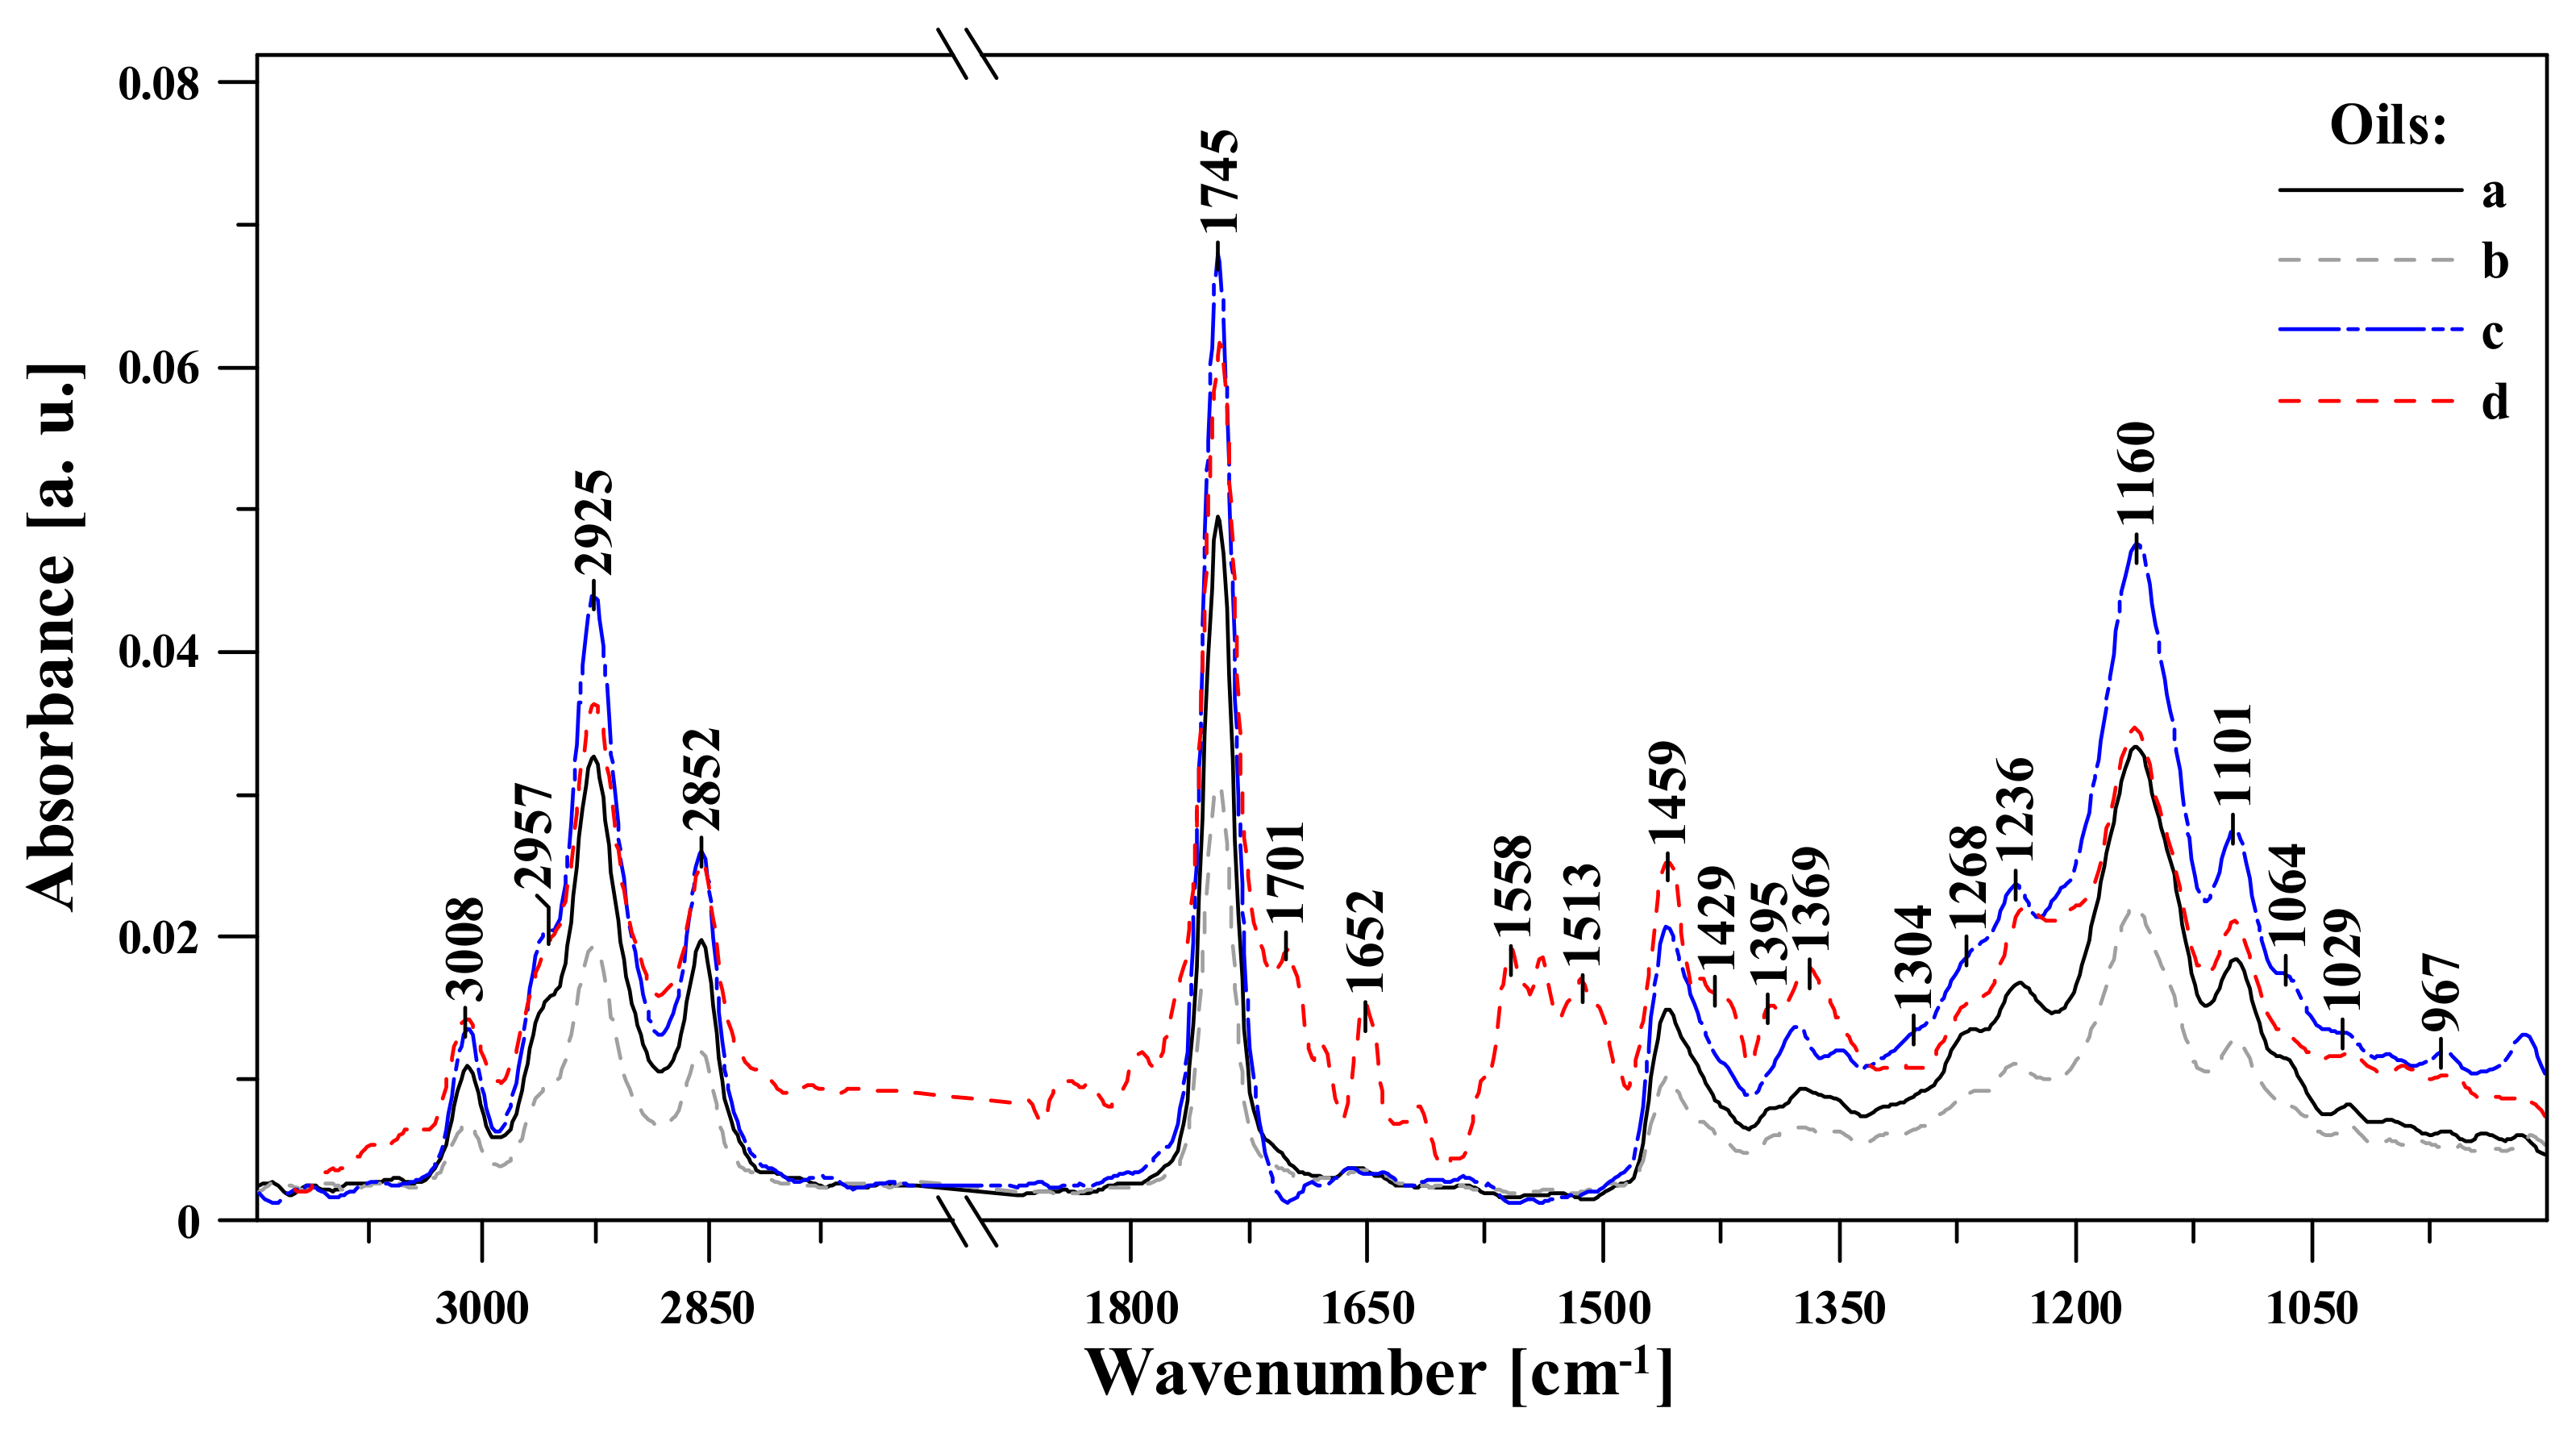
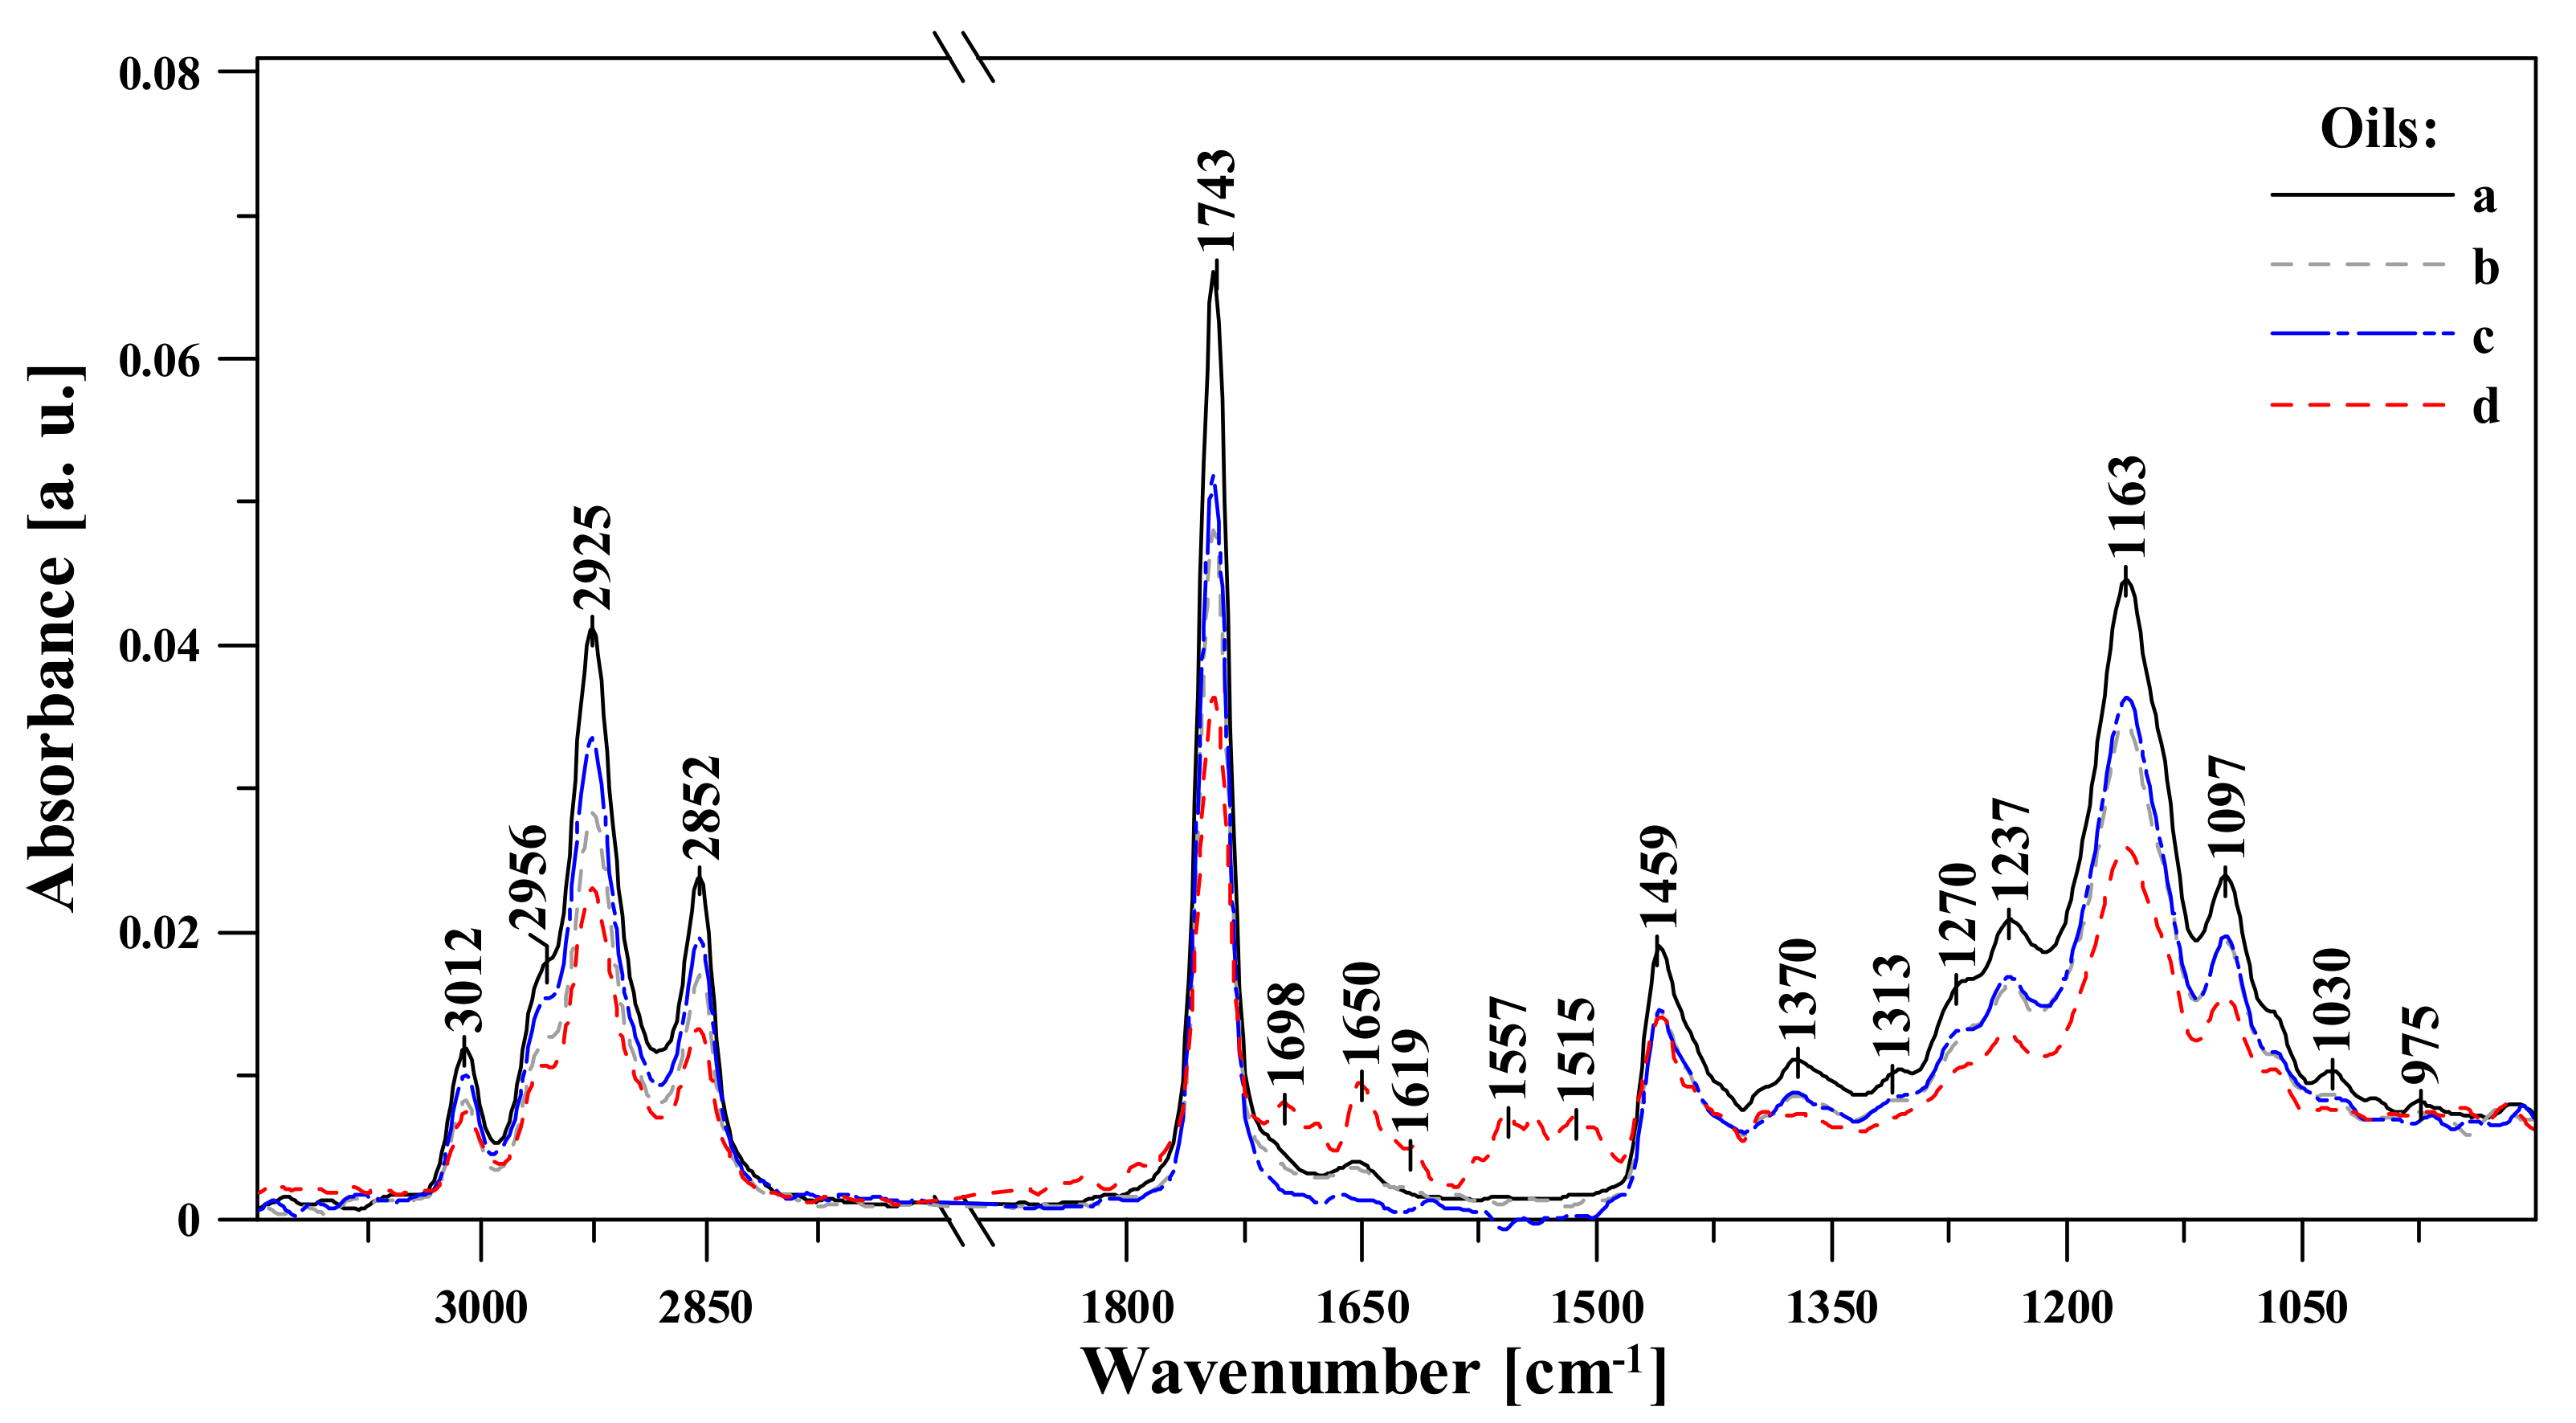
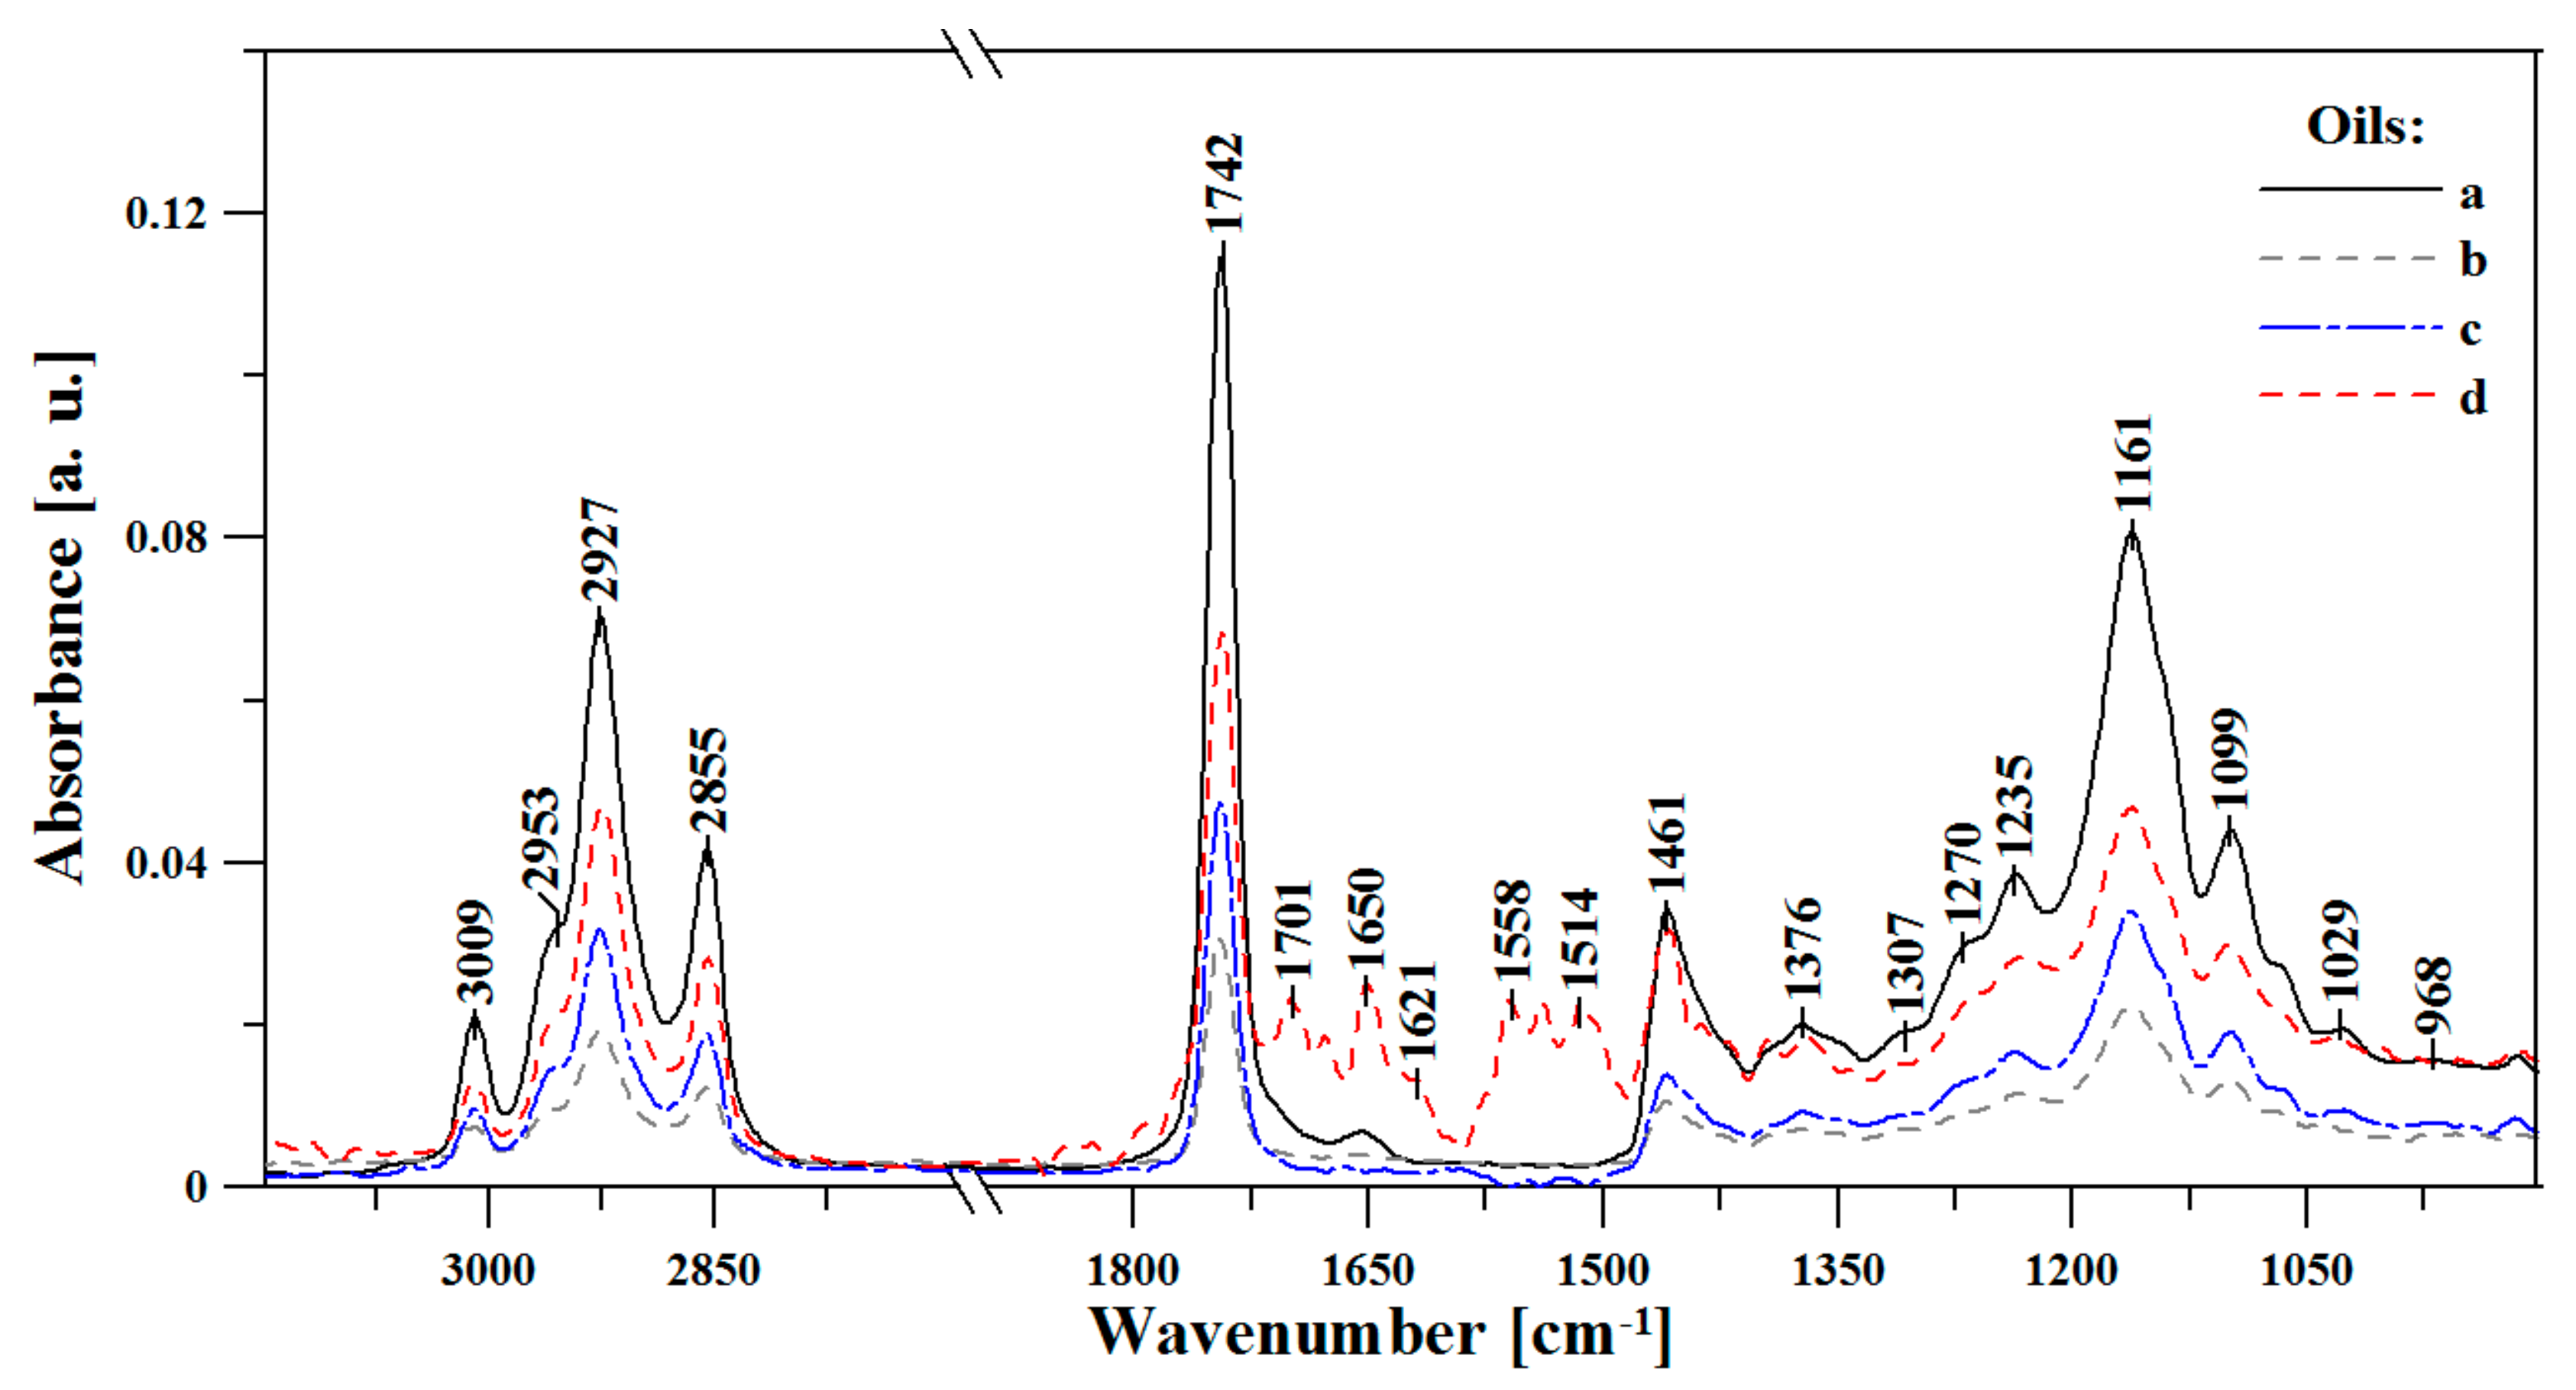
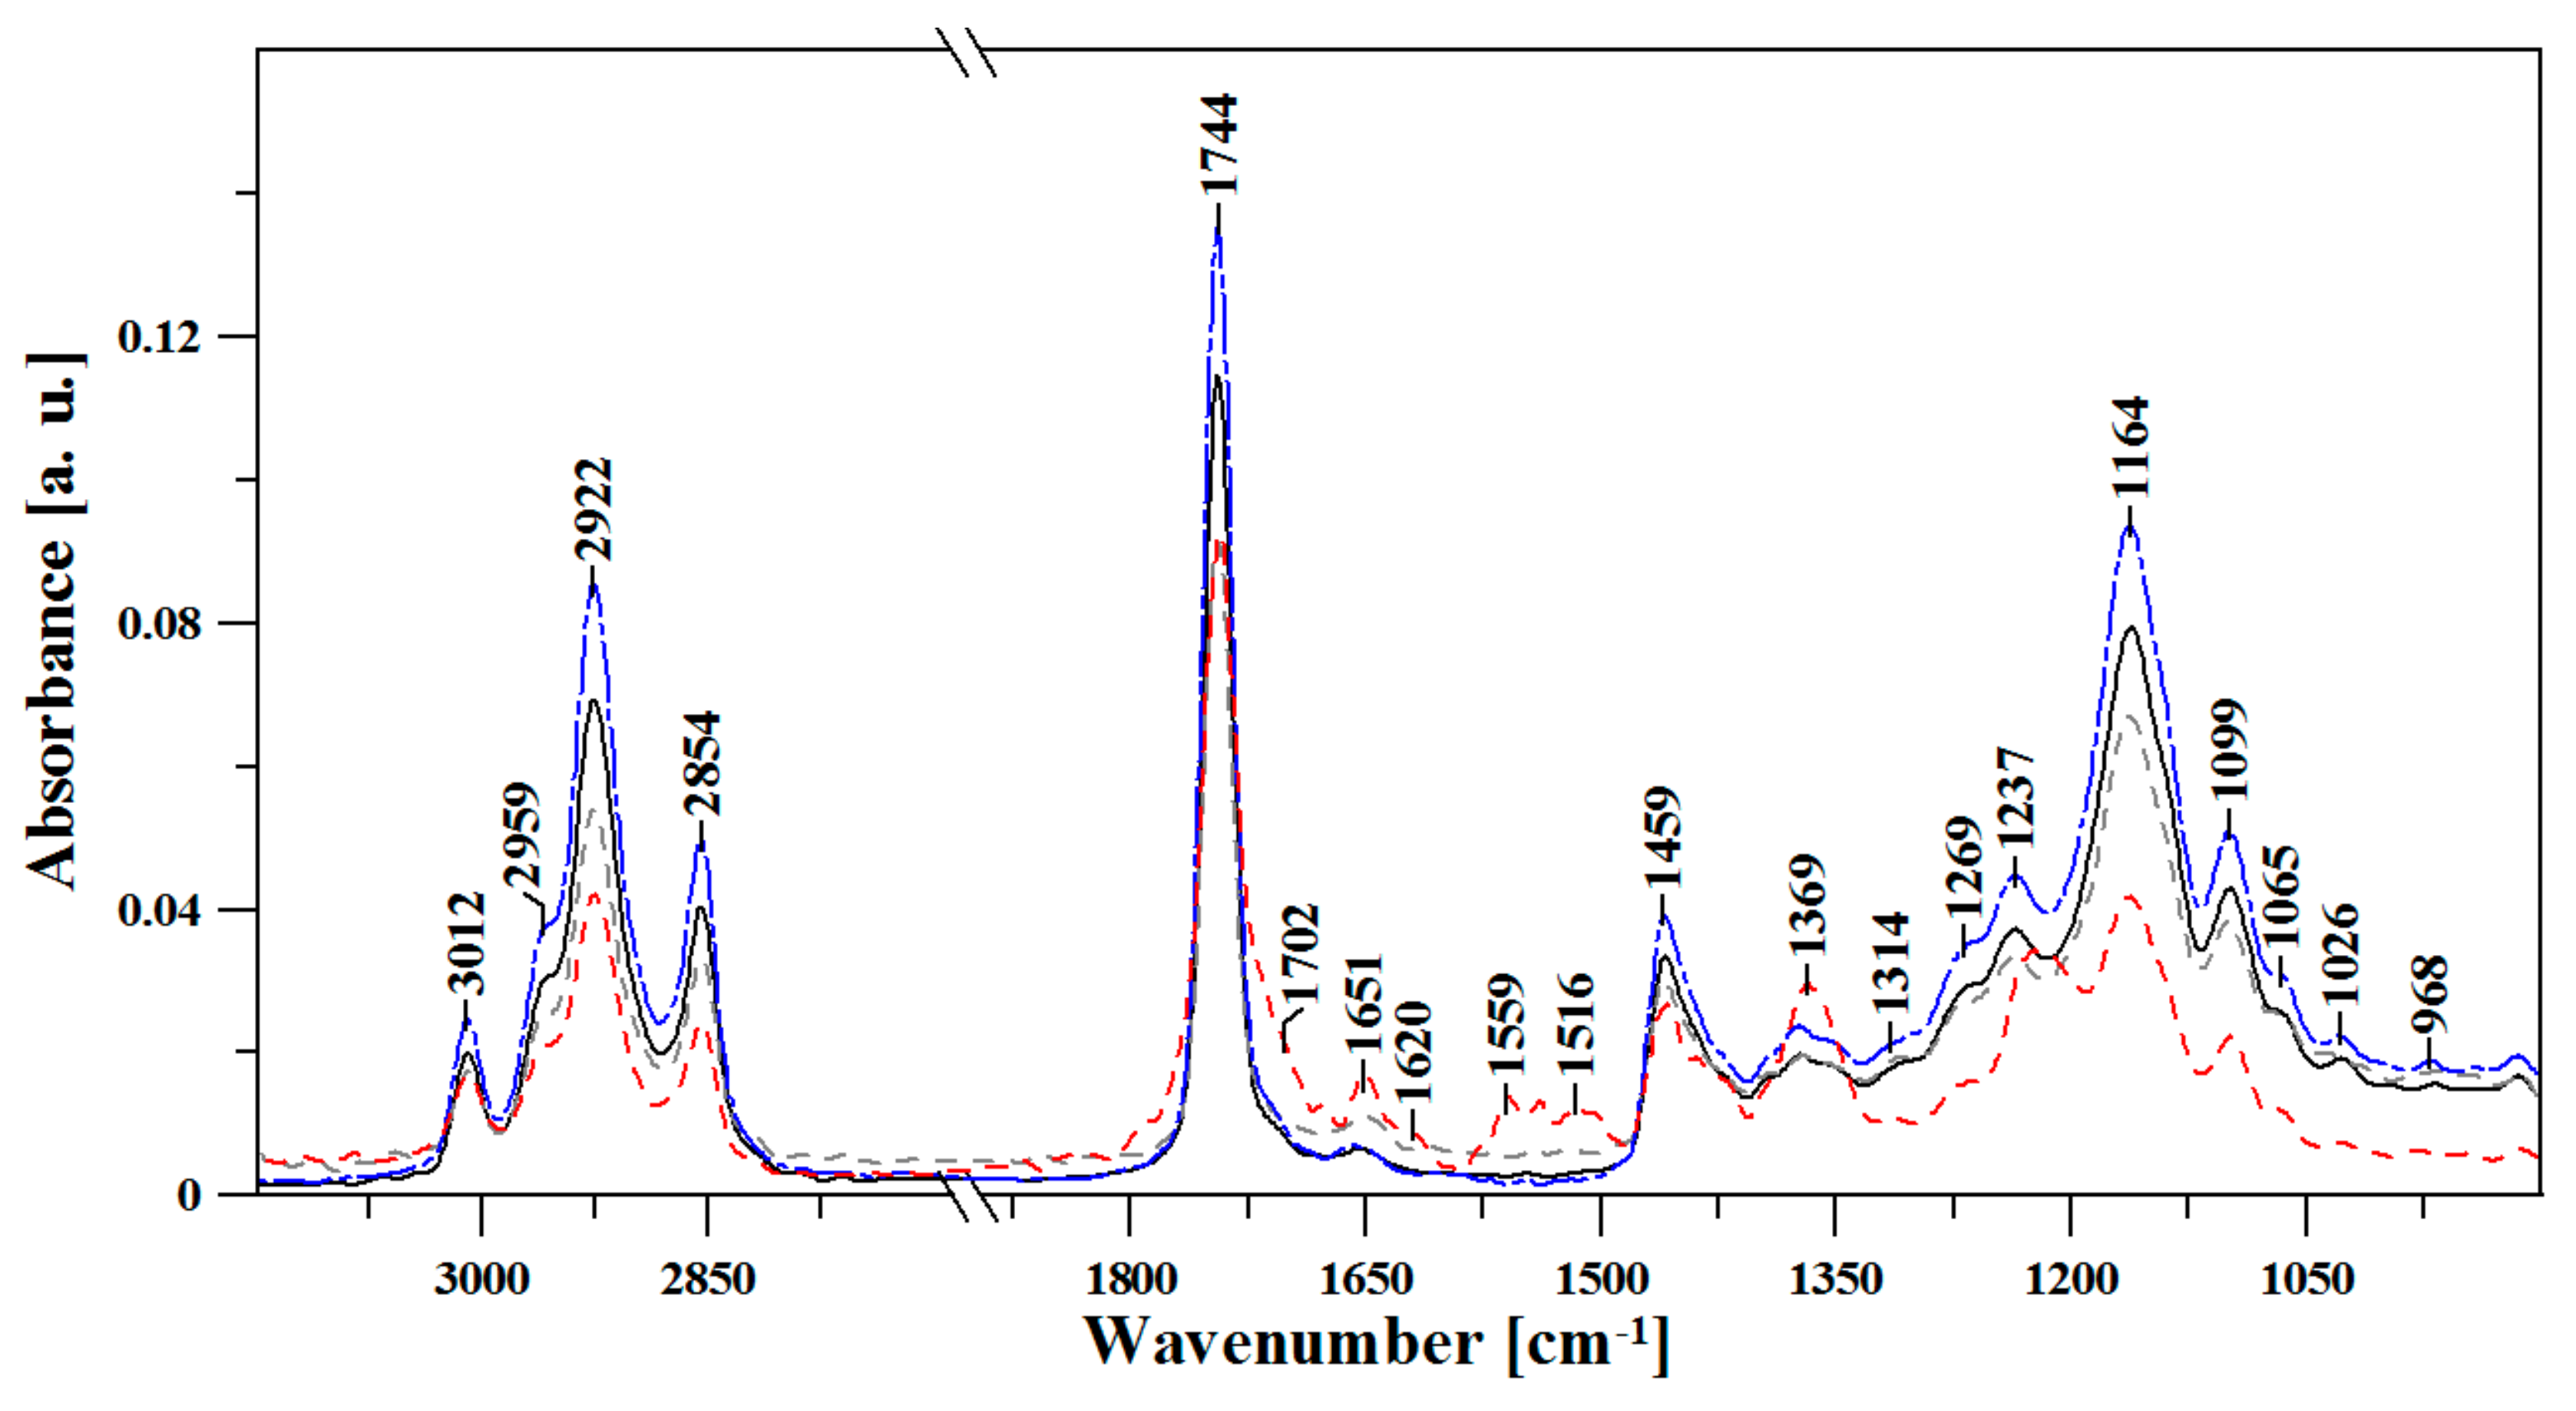
3.1. FTIR Spectroscopic Analysis of Moldavian Dragonhead Oil Samples

All the infrared (FTIR) spectra for the selected Moldavian dragonhead oil samples revealed very intensive bands which correspond to specific vibrations of the respective functional groups contained in ingredients typically found in this type of food. Plant fats and potential oleaginous materials are substances composed primarily of various fractions of triglyceride groups, mainly differing in terms of the degree and form of the acyl groups’ unsaturation, as well as the length of their chains [9]. Numerous publications provide the appropriate associations of the particular spectral bands in oils, both animal and vegetable, and other fats [10,32,33,34] with specific vibrations in particles or groups thereof, although many bands are not easily assigned to respective functional groups. Table 1 and Tables S2 and S3 (in Supplementary Materials) present in detail the frequencies of characteristic spectra, including the most significant broadenings/enhancements of the respective spectral bands for the four analyzed time-frames of oil sample storage, as well as their association with the respective functional groups (with a detailed review and comparison with data available from the literature [9,35,36,37]. The subscript text indicates the intensity of the observed bands within typical IR spectra for this type of biological sample. It should be pointed out that, in this case, the association of the maxima corresponding to the mode of stretching vibrations in the IR spectra of the analyzed samples is considerably easier than assigning the bands corresponding to deformation vibrations. This is due to the fact that bands corresponding to the vibrations of the latter type often tend to overlap. The presented FTIR spectra reveal vibrations of the methylene group, located in the spectral range from 1350 to 1150 cm−1 [9]. They are stretching vibrations of the -C-H group bonded with CH3 (approx. 1350–1360 cm−1, in out samples 1370 cm−1), as well as deformation vibrations in this group (~1160 cm−1, in our samples 1159–1165 cm−1). In this case, the stretching vibrations of the ester bond ν(C-O) are a combination of two asymmetric vibrations, namely those of C-C(=O)-O and O-C-C [10,38]. The former vibrations are typically considerably more intensive [12]. The bands are located at approx. 1300 (as C-C(=O)-O, in our case, approx. 1270 cm−1, as visible enhancement of the band with the maximum at 1235–9 cm−1) and at approx. 1000 cm−1 (in our case 1028 to 1036 cm−1 for these groups).
In turn, bands related to the vibrations of saturated esters C-C(=O)-O occur between 1240 and 1160 cm−1 (in our case approx. 1234–40 cm−1) [39], whereas for unsaturated esters, the vibrations are more often generated at lower frequencies [9]. On the other hand, the O-C-O band originating from primary alcohols appears in the region from 1100 to 1020 cm−1 (in our case approx. 1029–31 cm−1, as mentioned above), whereas in the case of secondary alcohols, the band usually appears with the maximum at approx. 1100 cm−1 (in our case 1090–1093 cm−1). Both types of esters descried above are present in triglyceride particles. In the literature, the mentioned band (at approx. 1239–4 cm−1) has been associated exclusively with out-of-plane bending vibrations of the methylene group [40].
Another two bands presented in Table 1 and Tables S1–S3 (in Supplementary Materials) (as well as in Figure 1 and Figure 2) are somewhat more difficult to identify: the maximum of the first band is at approx. 1416–18 cm−1, and that of the second at approx. 1320 cm−1 (most likely a band broadening, see Figure 1, Figure 2, Figure 3 and Figure 4). The first group of vibrations with the maximum at approx. 1416–18 cm−1 (depending on the duration of the experiment) is often assigned to the vibrations of the methyl groups in the aliphatic chains of the analyzed oils [36,40]. The second group of bands (most likely band broadening or enhancement) with the maximum at approx. 1320 cm−1 (in all the samples—not shown so as not to obscure the presentation) is observed simultaneously with the bands with the maximum at approx. 980 cm−1 and lower wave numbers. It should be noted that the band at approx. 920 cm−1 (depending on duration of the experiment, i.e., more or less intensive), which appears in all oil samples, is related to the stretching vibrations of cis-substituted olefin groups [35], or can be connected with the vibrations of the vinyl group.
The oil samples examined at the initial stages of the experiment produced largely similar spectra in the infrared range. Depending on the duration of the experiment (storage time, irrespective of analogous storage conditions), the particular spectra started to reveal significant differences in terms of the intensity and position of the respective bands (the shifts were not large but very important; discussed further in the text). In each case, we observed the maximum absorbance, which was clearly correlated to the particular storage conditions (i.e., duration/atmosphere and bottle color). All spectra in Figure 1, Figure 2, Figure 3 and Figure 4 are shown analogically, and indicate very evident ageing effects in the case of Moldavian dragonhead oil samples.
Other very important vibration regions were also observed with respect to the bands with maxima at approx. 1745-1 cm−1, which were typical of the stretching vibrations of the carbonyl C=O group [9] in ester groups. Next to the band (characteristic of the vibrations of the carbonyl group in esters), we observed, on the lower wavenumber side, a clearly-visible enhancement with the maximum at approx. 1700-15 cm−1 (whose intensity also increased together with the ageing effect), which corresponded to the vibrations of a carbonyl group, but in this case, found in the acidic groups of the analyzed samples [9].
The next band, with a maximum at 1655-3 cm−1, corresponded to the stretching vibrations of the -C=C- group (particularly the cis-transformation) [33]. It is noteworthy that the intensity of those bands increased with longer storage times of the respective samples, which clearly evidences ongoing ageing processes (discussed further in the text). A very characteristic region was also observed for the vibrations with the maximum at 1461–3 cm−1 and originating from the -C-H deformation vibrations in CH2 and CH3 groups (bending vibrations). One should also mention the vibrations in the region from 900 to 650 cm−1 (partially not presented due to low intensity) corresponding, in the analyzed case, to the characteristic deformation vibrations of the -HC=CH- groups (out-of-plain cis-conformation) and ring vibrations of the aforementioned groups (δ(-(CH2)n- and -HC=CH- (cis-)) [9].
The next very important band corresponded to the =C-H stretching vibrations (trans-transformation) with a maximum at approx. 3063–4 cm−1 (not shown), which originated from the vibrations of triglyceride fractions [34]. With respect to the =C-H stretching vibrations in the cis-configuration, very characteristic and intensive vibrations were observed with the maximum at approx. 3007/12 cm−1 (Figure 1 and Figure 4, Table 1 and Tables S1–S3 (in Supplementary Materials)). Vibrations with the maxima at approx. 2952/8, 2922/8, and 2852/7 cm−1 originated, respectively, from the -C-H stretching vibrations in -CH3, CH2 groups belonging to the aliphatic groups in triglycerides [34,41].
It should be emphasized that the spectra of the analyzed oil samples revealed clear discrepancies in the shape of the bands, particularly in the region from 1780 to 1670 cm−1 [36]. Most of the analyzed samples showed a clearly-defined, slight enhancement of the band at 1743/6 cm−1 (corresponding to the vibrations of the C=O group, as discussed above) on the lower wavenumber side, with a clear maximum at approx. 1700–16 cm−1 [42], which can be associated with the formation of a hydrogen bond between C=O…H-O-H groups. Simultaneously to the emergence of the band at 1700–16 cm−1, we observed an increase in intensity at approx. 1350–70 cm−1 [22,42], which can also be associated with the stretching vibrations of C-O and C-C groups (as described above). Furthermore, the area between 1100 and 1300 cm−1 also corresponded to stretching vibrations of the C-O group, but the same indicated minor discrepancies between the analyzed oil samples, regardless of the storage time. The bands may display a slight increase in intensity with the decreasing affinity of the particles that generate them toward for the formation of the hydrogen bond between C=O…H-O-H, and, as such, constitute a perfect marker of the preliminary ageing processes taking place in the analyzed samples.
In summary, the results of the spectroscopic studies revealed significant differences with respect to certain bands which constitute important spectroscopic markers of the ageing processes taking place in the analyzed oil samples. In particular, the observation of spectra within the range from 1715 to 1500 cm−1 in the samples stored for 8 weeks revealed significant changes in terms of the position and intensity of the band characteristic of the carbonyl group, with the maximum at approx. 1744 cm−1. The region from 1715 to 1500 cm−1 is related mainly to various vibrations originating from the C-C and C=C groups and evidencing the progress of ageing processes (with the oxygenation of fatty acids contained therein). One should also mention the band with a maximum at approx. 1426 cm−1, related to the vibrations of C-H groups in acids. Very significant changes, particularly in the 8th month of the experiment, were observed in the shape of the band with the maximum at approx. 1369 cm−1, as well as with regard to the shift of the band at 1237 cm−1, which also reflected the aforementioned changes. The impact of the manner of storage was also noticeable: significant spectral changes were correlated with the varying storage conditions. This confirms the significant impact of storage conditions on the quality and durability of the product.

3.2. Chemometrics Studies

The HCA analysis allows for the visualization of the group and sub-group arrangement of the spectra. The HCA (Figure 5) revealed the intragroup similarity within the considered samples and generated clusters in each group. The difference in the spectral range was established by considering similar areas of groups in all the samples. While the HCA dendrogram indicates differences in the groups of investigated samples of oils, there are important questions that remain unanswered. For example, which variations in the functional group between the samples bring about the difference in the HCA analysis? How do vibrations of different functional groups in samples vary in the terms of their intensity and shift? These questions need to be considered to specify the measurement of the FTIR data. Therefore, PCA was used further in order to get answers to the aforementioned questions.
A principal component analysis (PCA) [43] allowed us to visualize a given dataset with respect to several main components, while accounting for possibly the highest possible percentage of the set’s variance. After applying the PCA, the initial set of variables is reduced to a number of hidden variables of principal components (PC) [44,45,46]. The scree plot (Figure 6) reveals that the greatest impact on the variance of the analyzed spectra registered for our oil samples was related to the first three principal components. Figure 7 and Figure 8 present the score plot for the principal components PC1 vs. PC2 in the PCA model corresponding to the Moldavian dragonhead oil samples stored under various conditions. The results for all samples and the first two principal components PC1 and PC2, which jointly accounted for 95.5% of the data matrix variance, are presented in Figure 7 and Figure 8. Oil samples were clearly classified into three groups (Figure 6, Figure 7 and Figure 8). The first, Group A, includes oil samples a1, i.e., immediately after pressing (argon, clear bottle), and d1, i.e., 8 weeks after pressing (argon, clear bottle). The above were samples where no enhancement was observed of the band at 1743 cm−1, characteristic of the vibrations of the C=O group in esters. However, in the remaining bands (Table 1), clear differences in terms of their intensity and position could be identified.
A sample from Group C, d2, i.e., oil sample stored in an argon atmosphere, in a clear bottle, analyzed 8 weeks after pressing, clearly stood out from the other samples. This sample formed its own, one-element cluster. Such an organization into groups of the samples stems from the measurements of the sample spectra [47]. When analyzing the spectra of all oil samples stored in an oxygen atmosphere and in clear bottles (a2, b2, c2, d2), we concluded that the highest intensity was observed for oil sample d2. On the other hand, the remaining oil samples analyzed after 8 weeks in storage (d3, d4) revealed significant similarities, as evidenced by their relative proximity on the dendrogram (Figure 5). It can be observed that oils d3 and d4, constituting a subgroup of Group C, were located in the vicinity of oil d2 (Group C), which indicated significant similarity. At the same time, sample d1, included in Group A, revealed the highest spectral intensity of all oil samples analyzed after 8 weeks of storage.
The remaining oil samples were classified under Group B. This distribution could be the result of their particular physicochemical properties. Moreover, an analysis of the loading plot (Figure 9 and Figure 10) reveals that PC1 was negatively correlated with all the characteristic spectra of the oil samples, whereas PC2 was positively correlated only with the νs(-C-Hvst, -CHa) vibrations (aliphatic groups in triglycerides) (approx. 2854 cm−1).

4. Conclusions

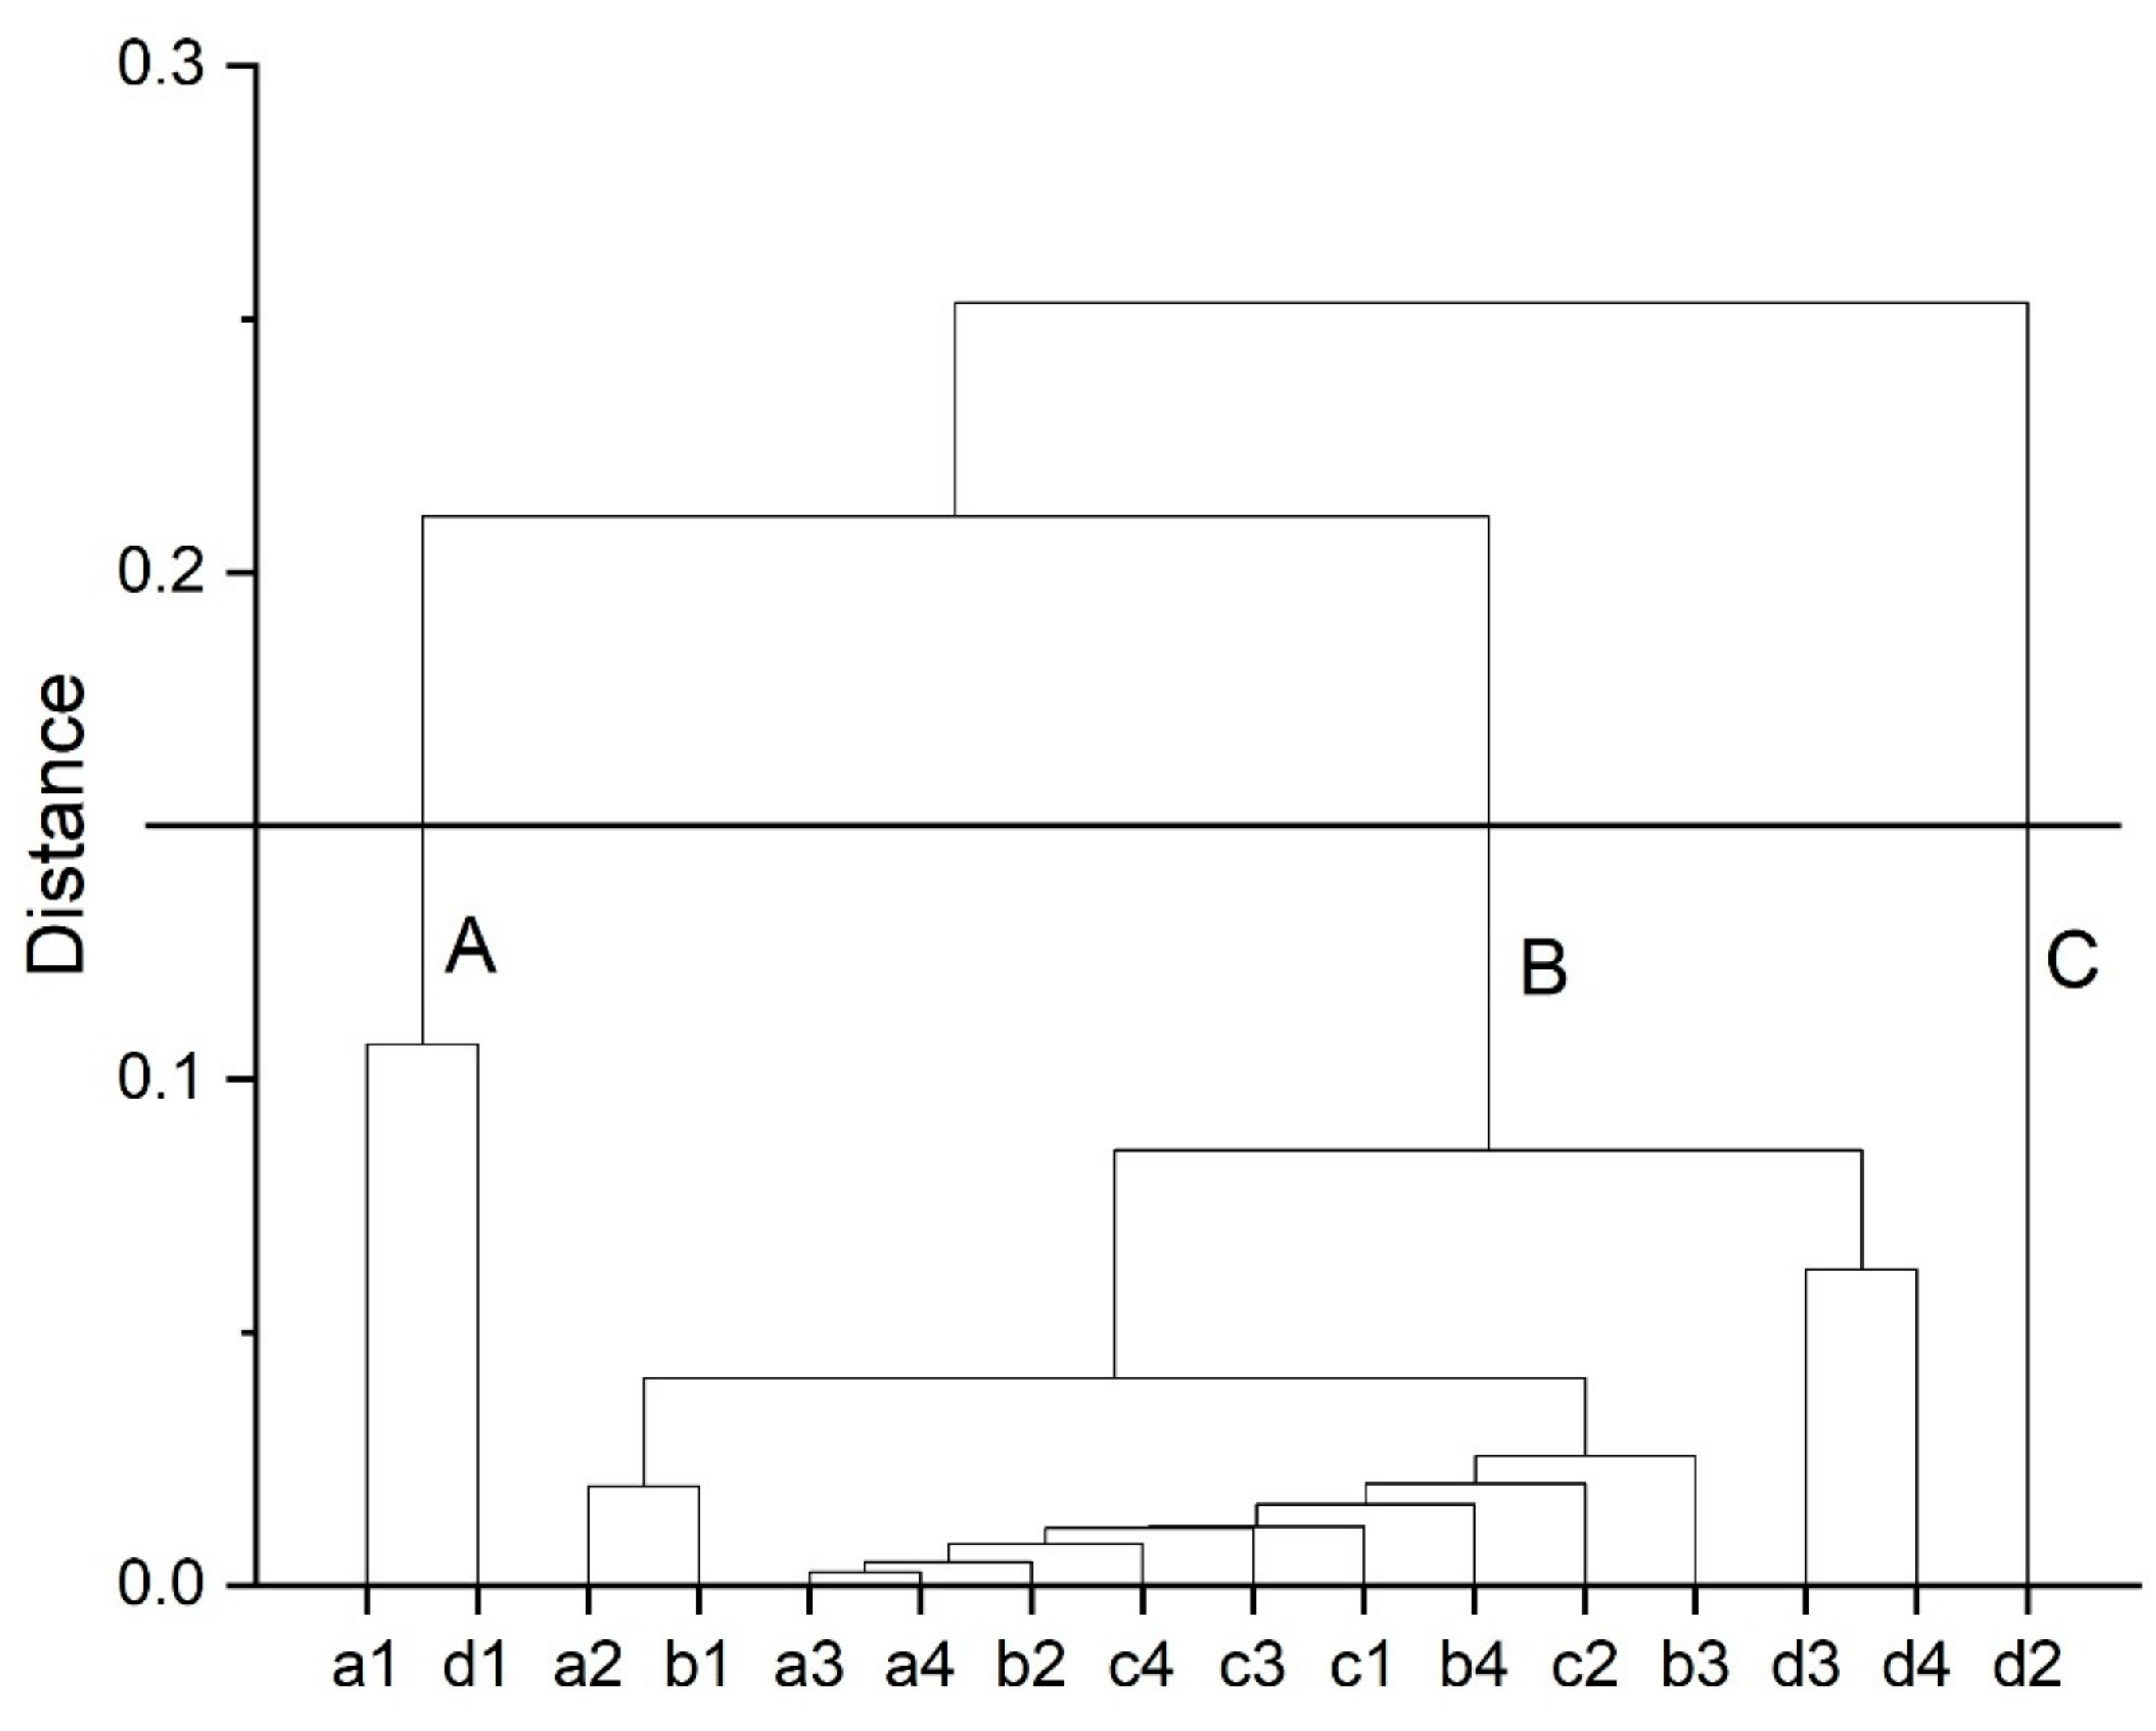
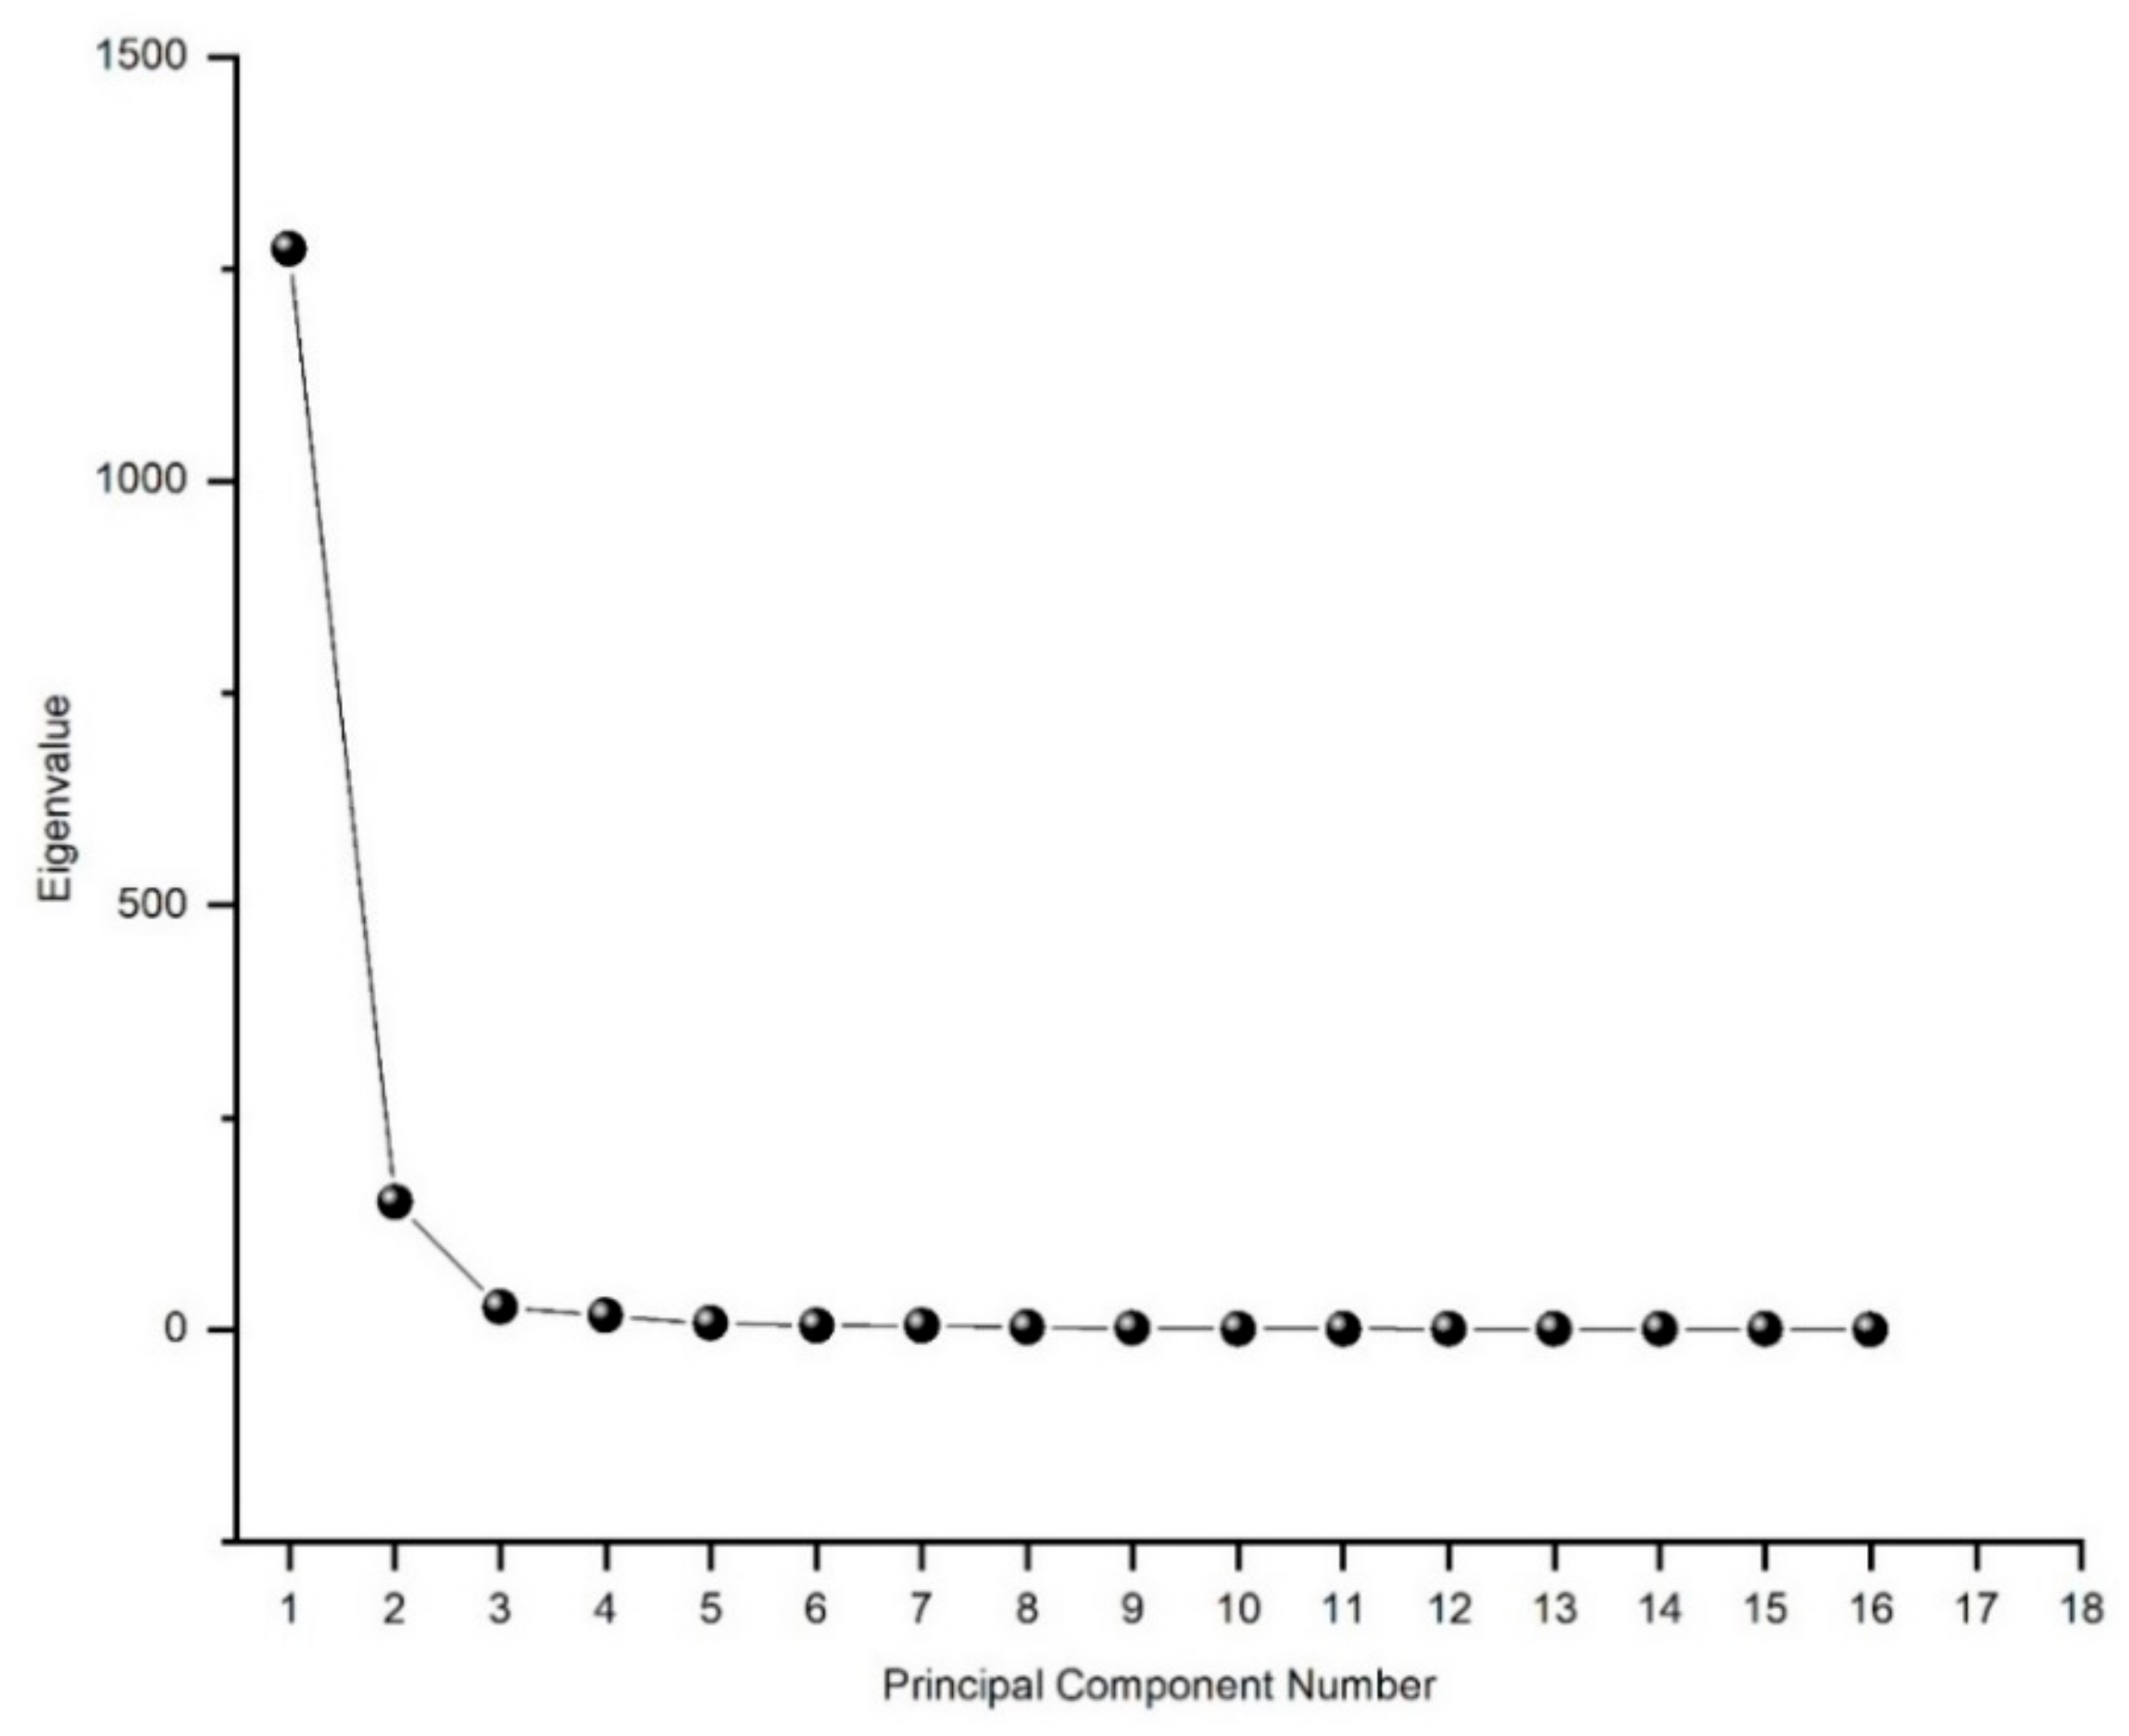
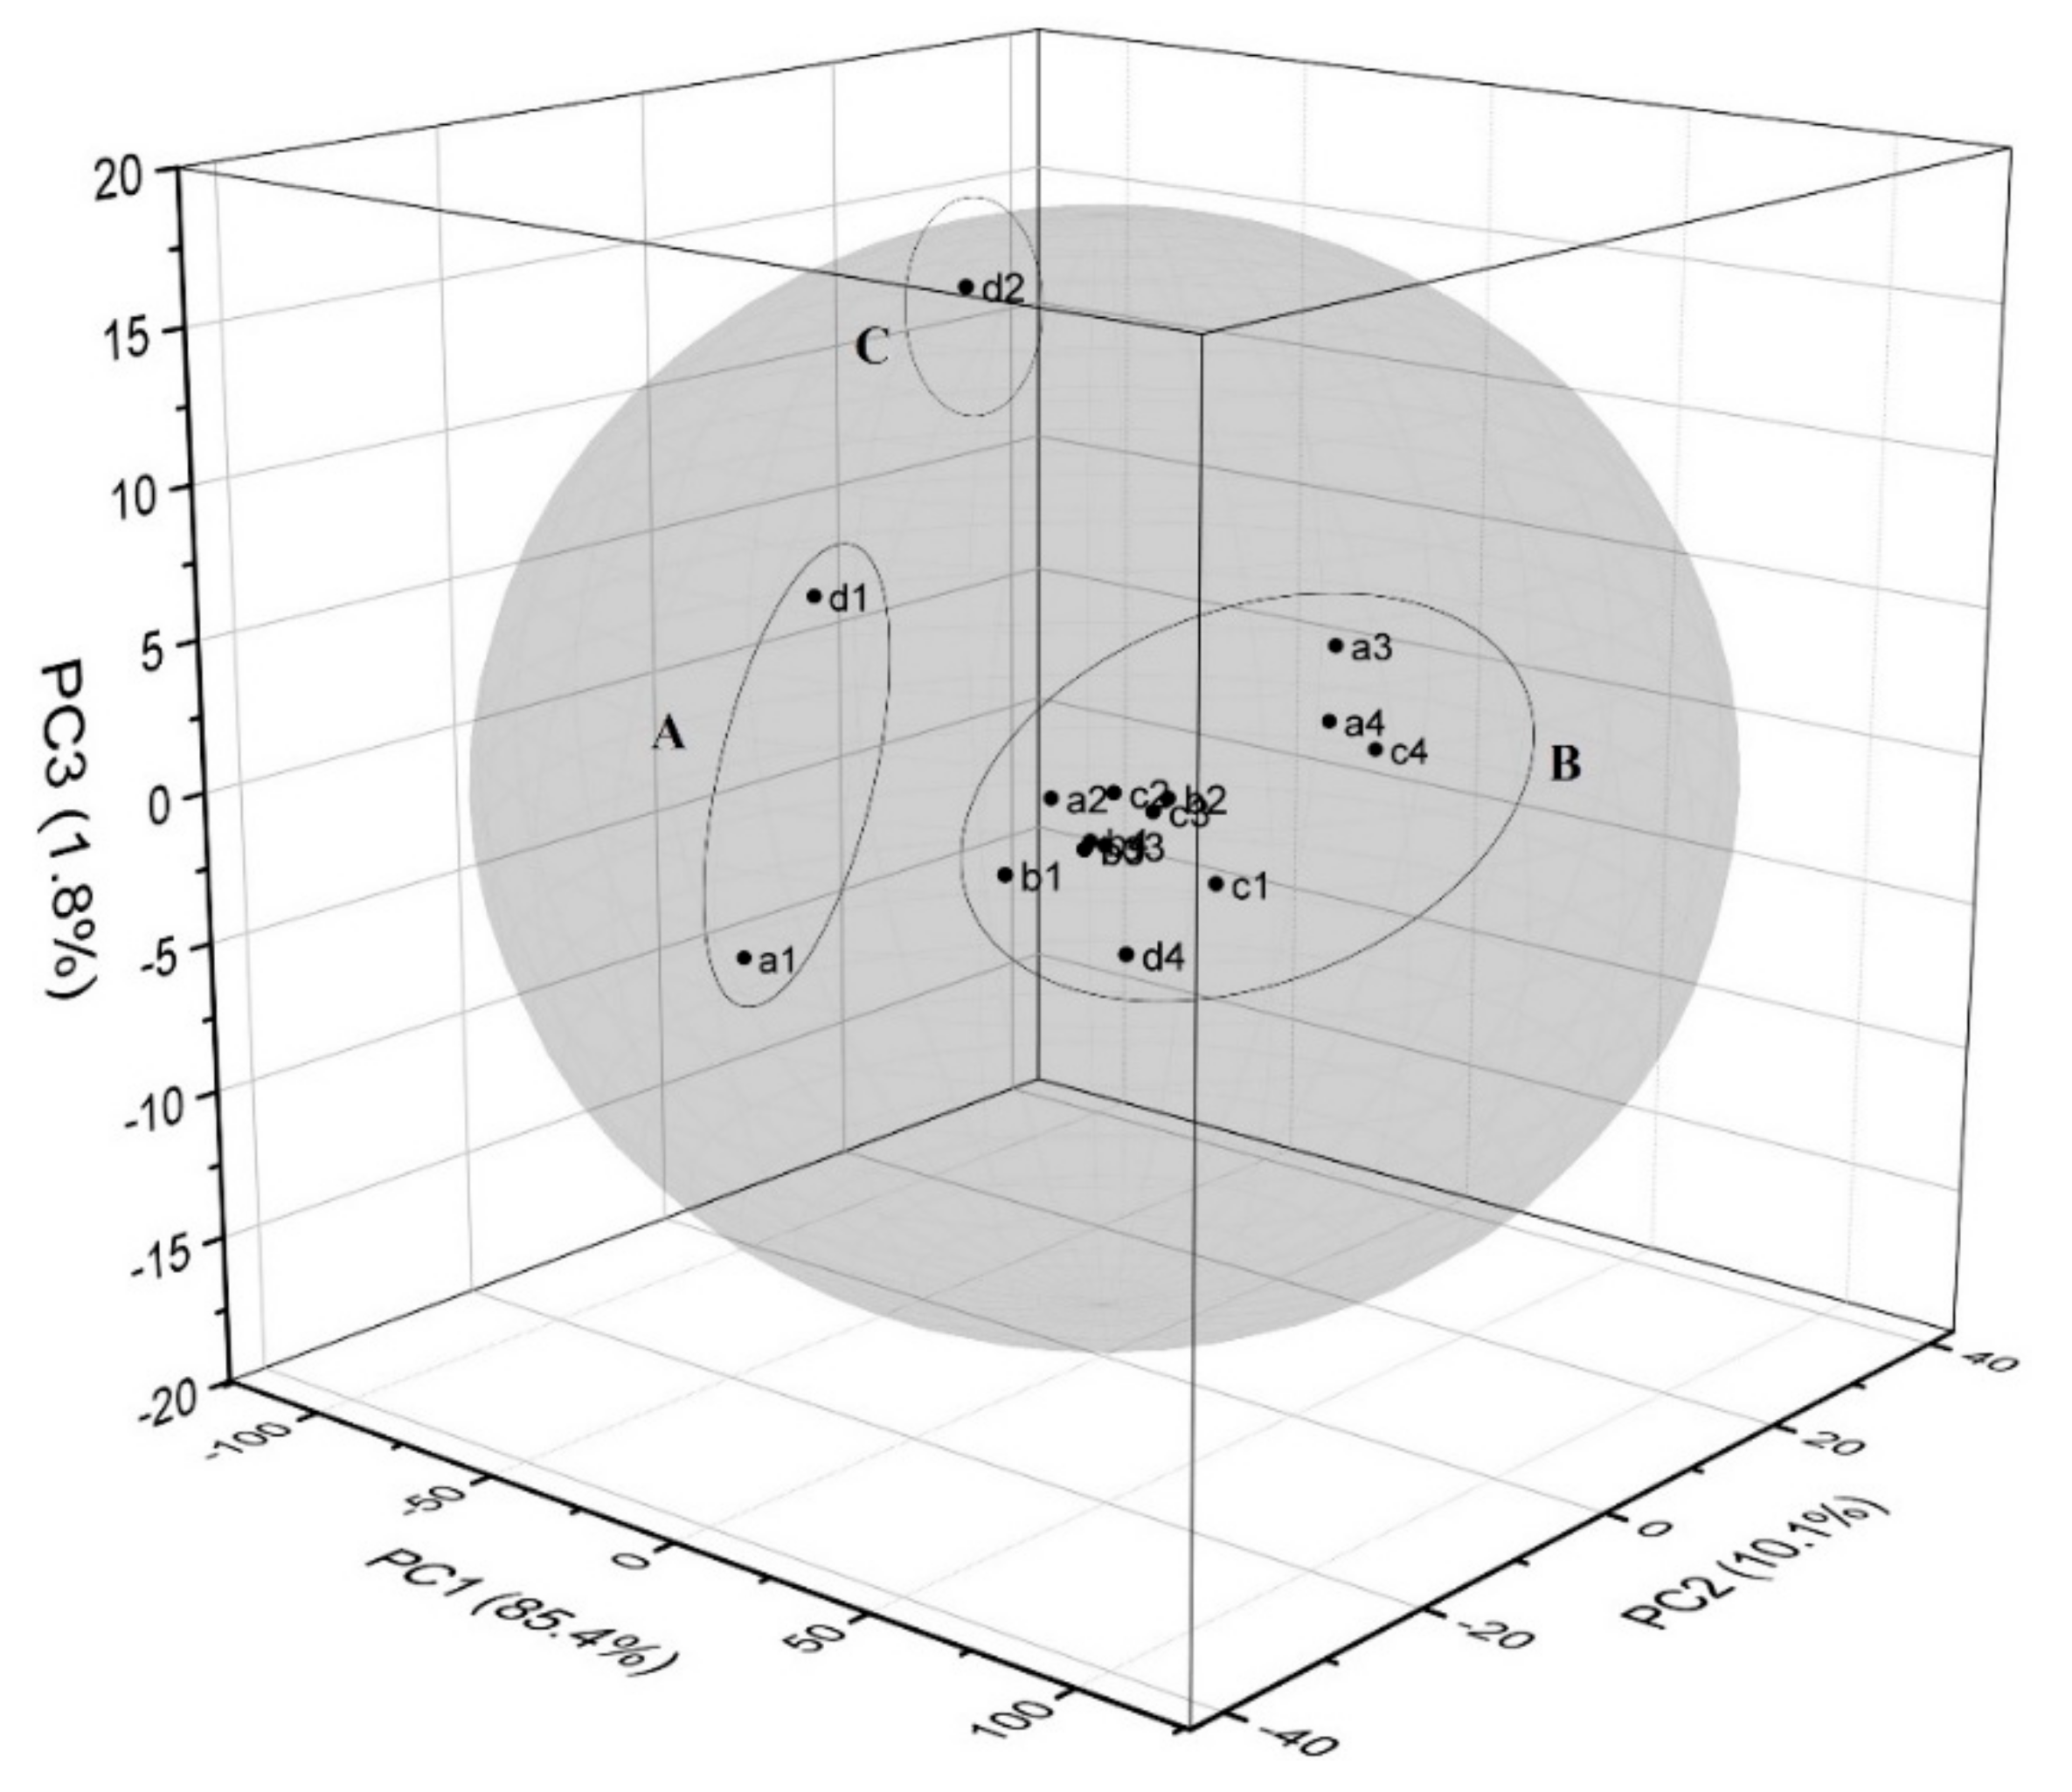
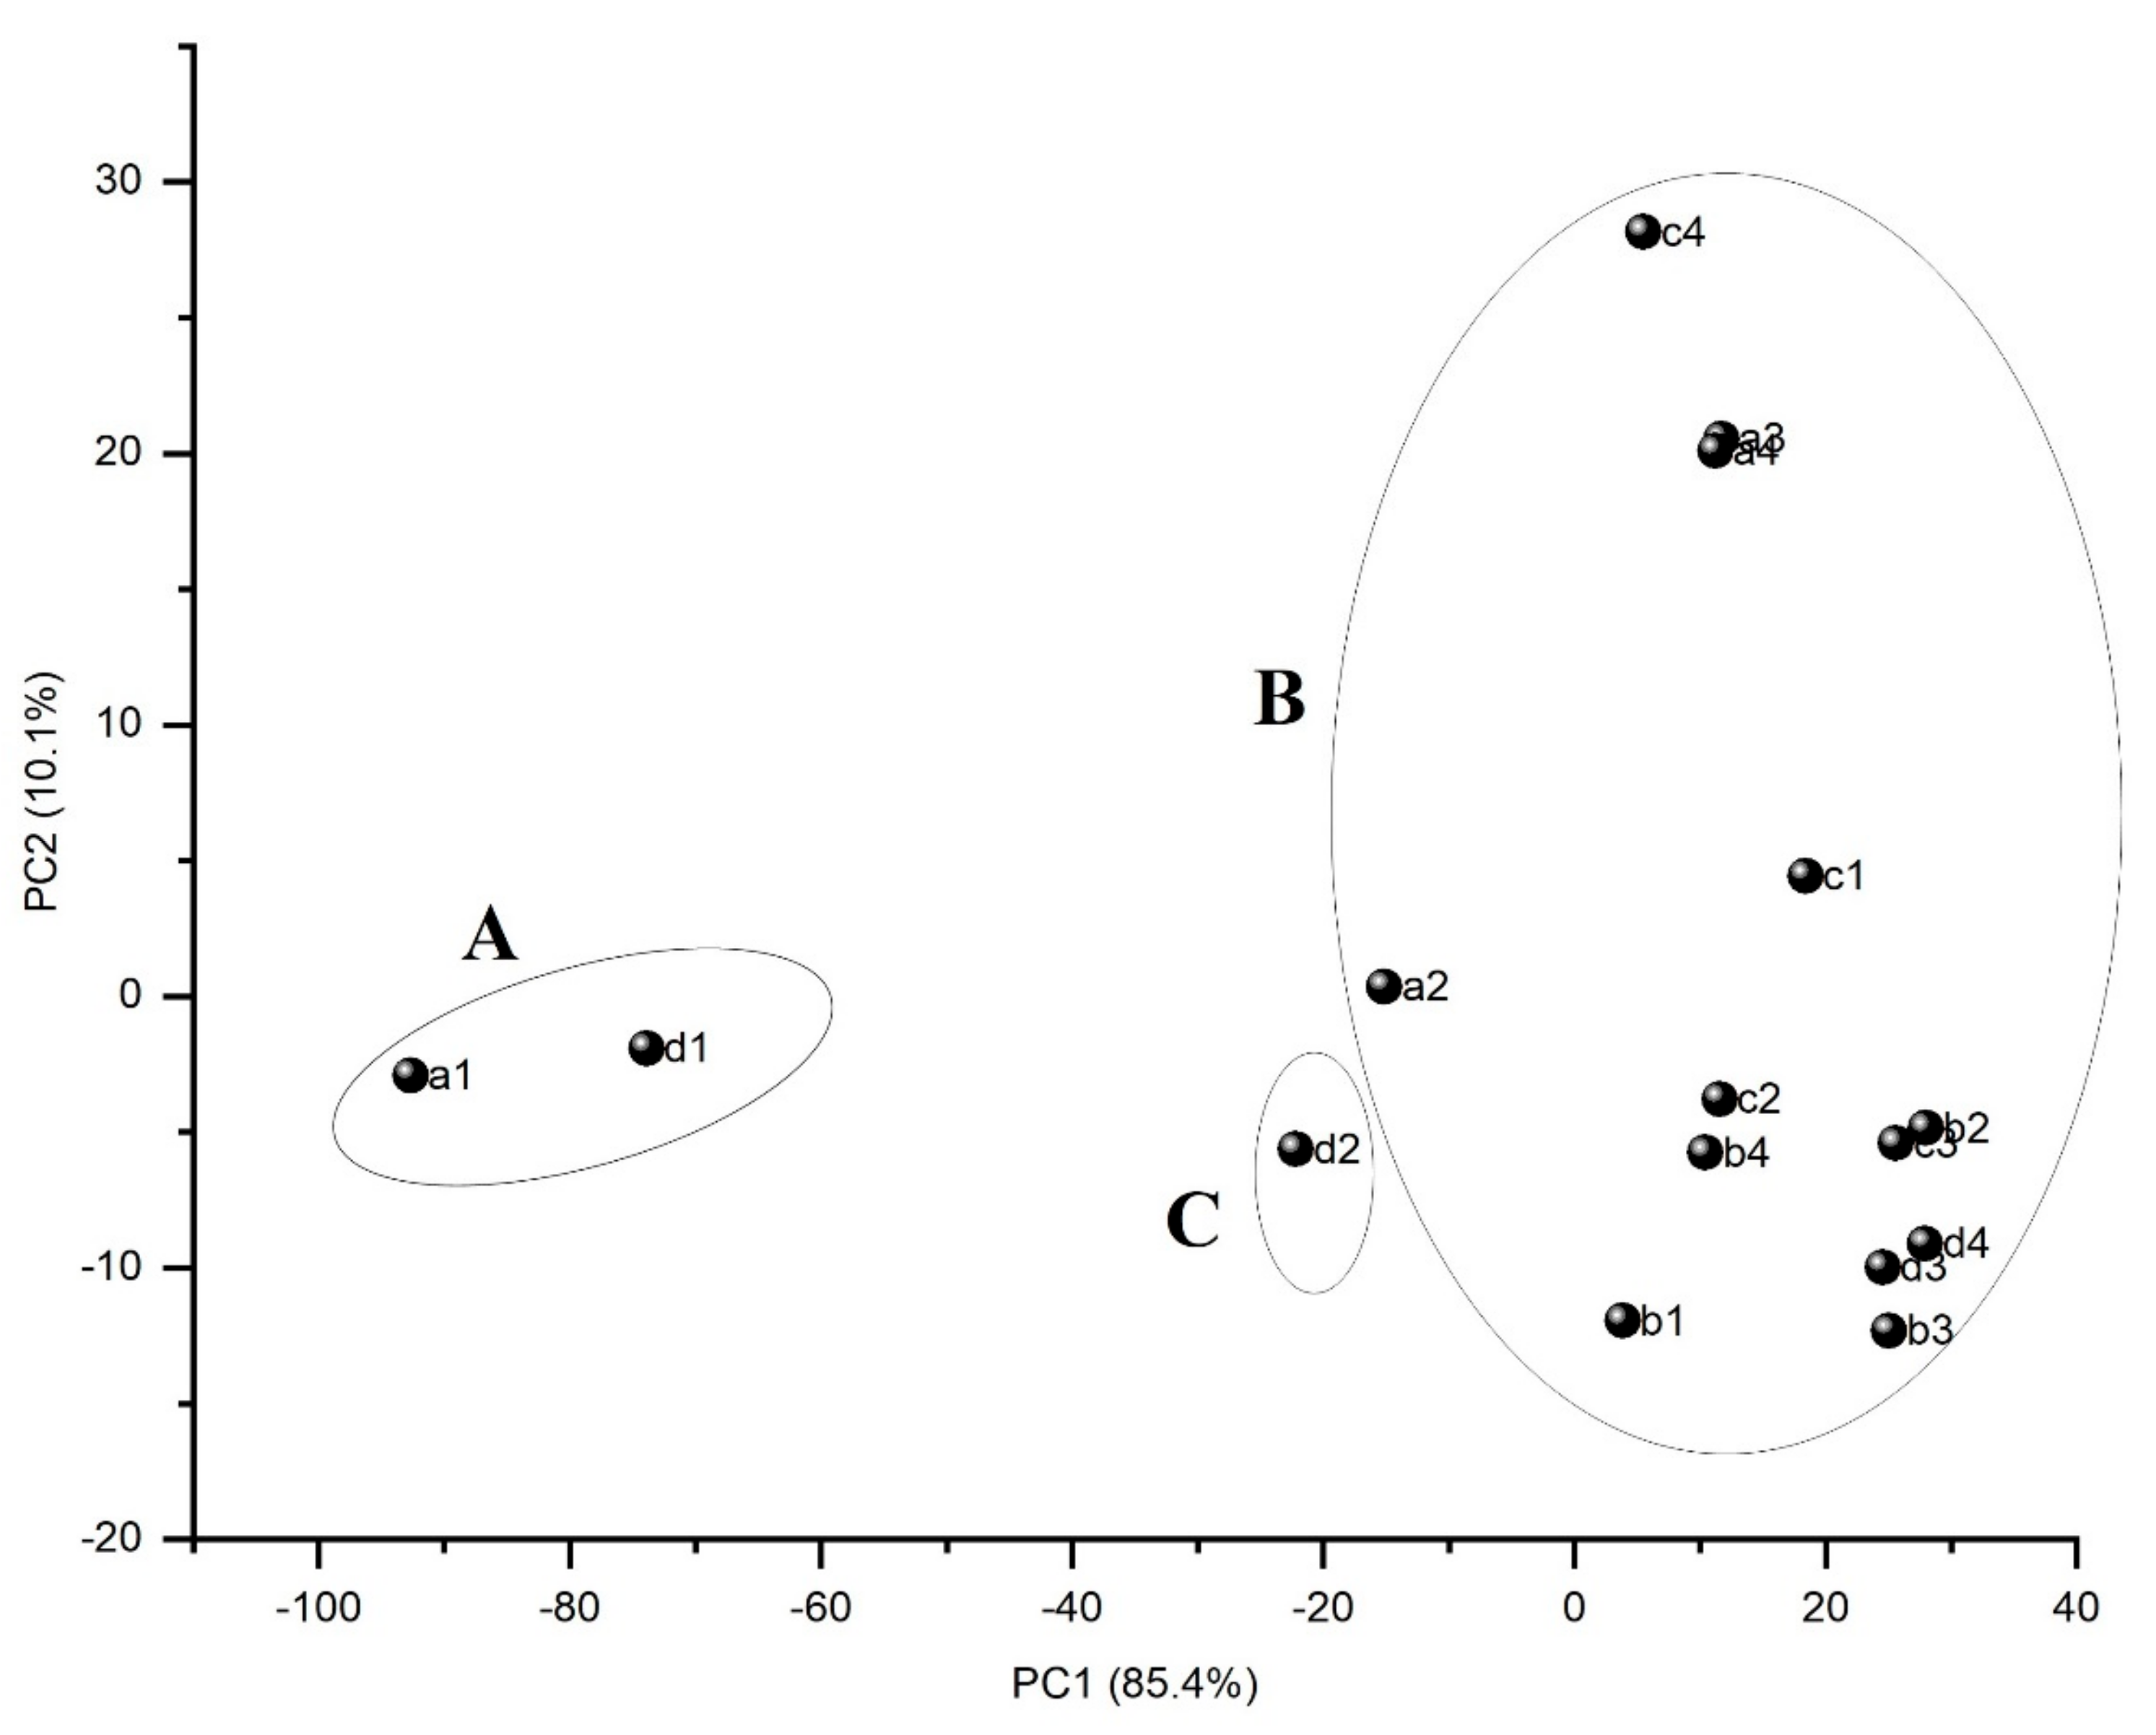
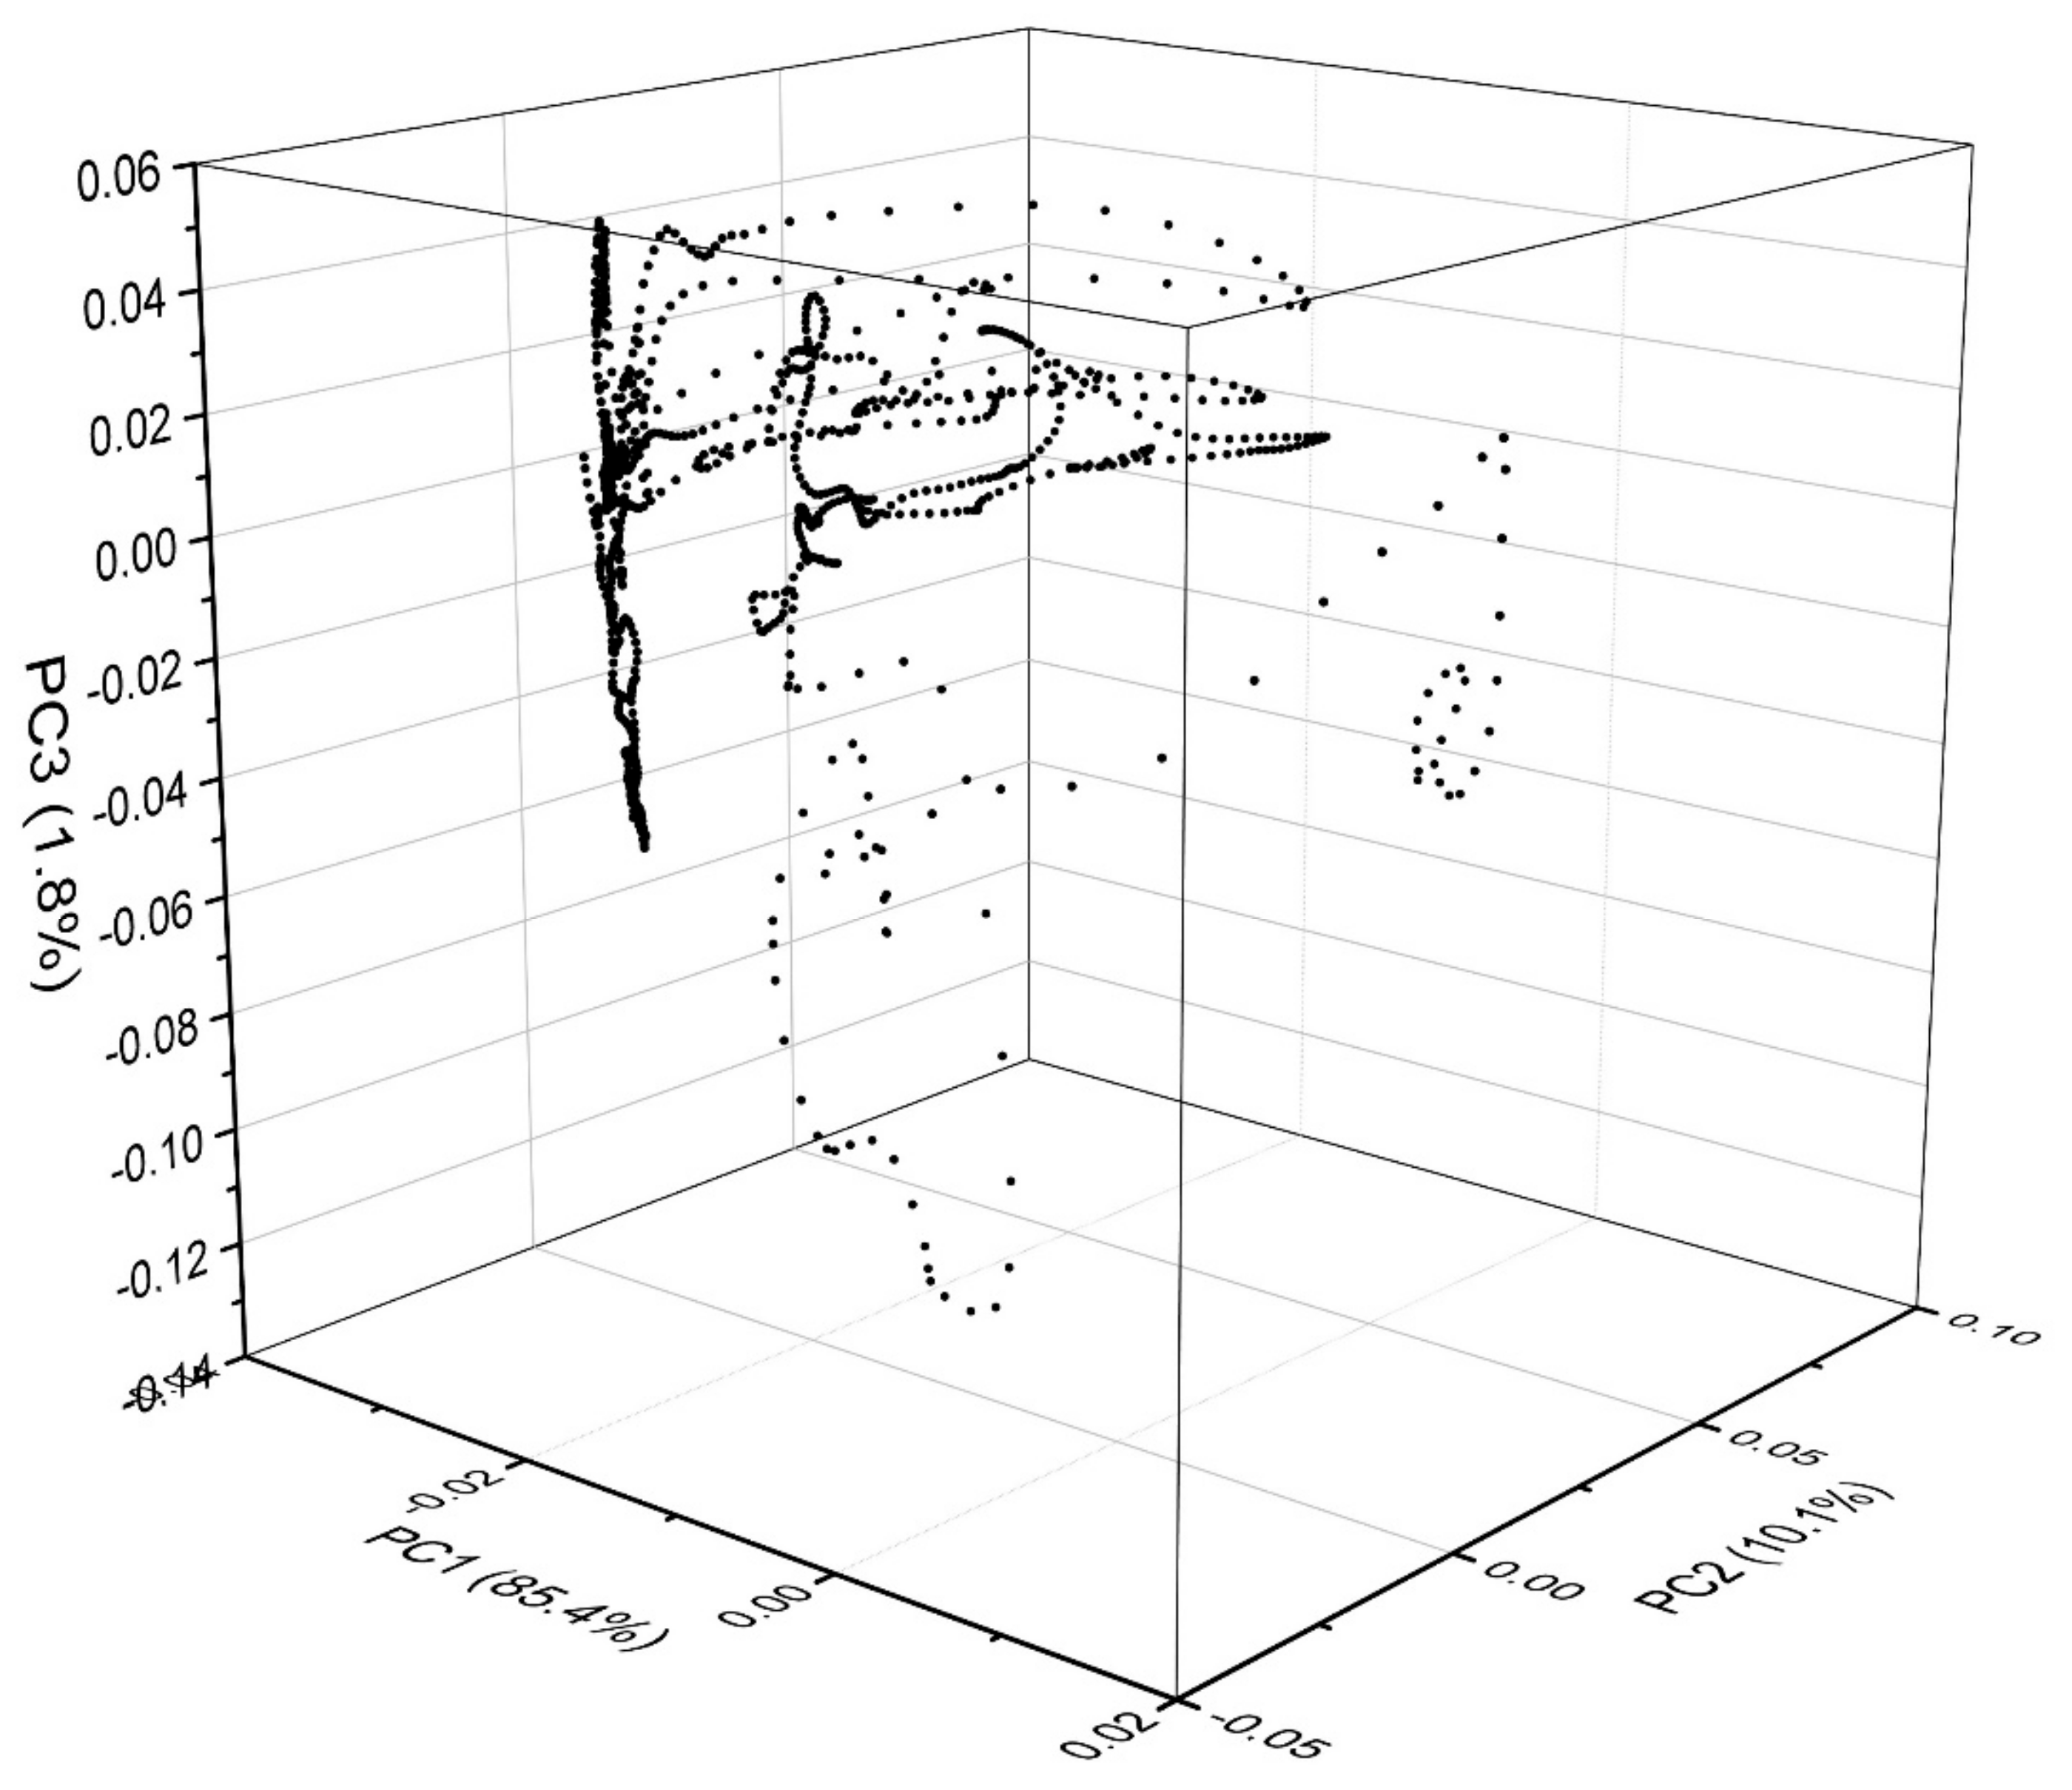
  • Principal component analysis (PCA) was used to identify the main sources of variance in the Fourier-transforms infrared (FTIR) spectra of oil samples obtained from Moldavian dragonhead seeds and stored under different conditions. PCA combined with HCA allowed the samples to be explored in terms of their similarities, relative to the storage method with respect to their FTIR spectra. Due to its inherent simplicity, quick and non-invasive character, this method may prove useful in monitoring the physicochemical changes in oils or e.g., the oxidative state in oils relative to the time and conditions under which they are stored.
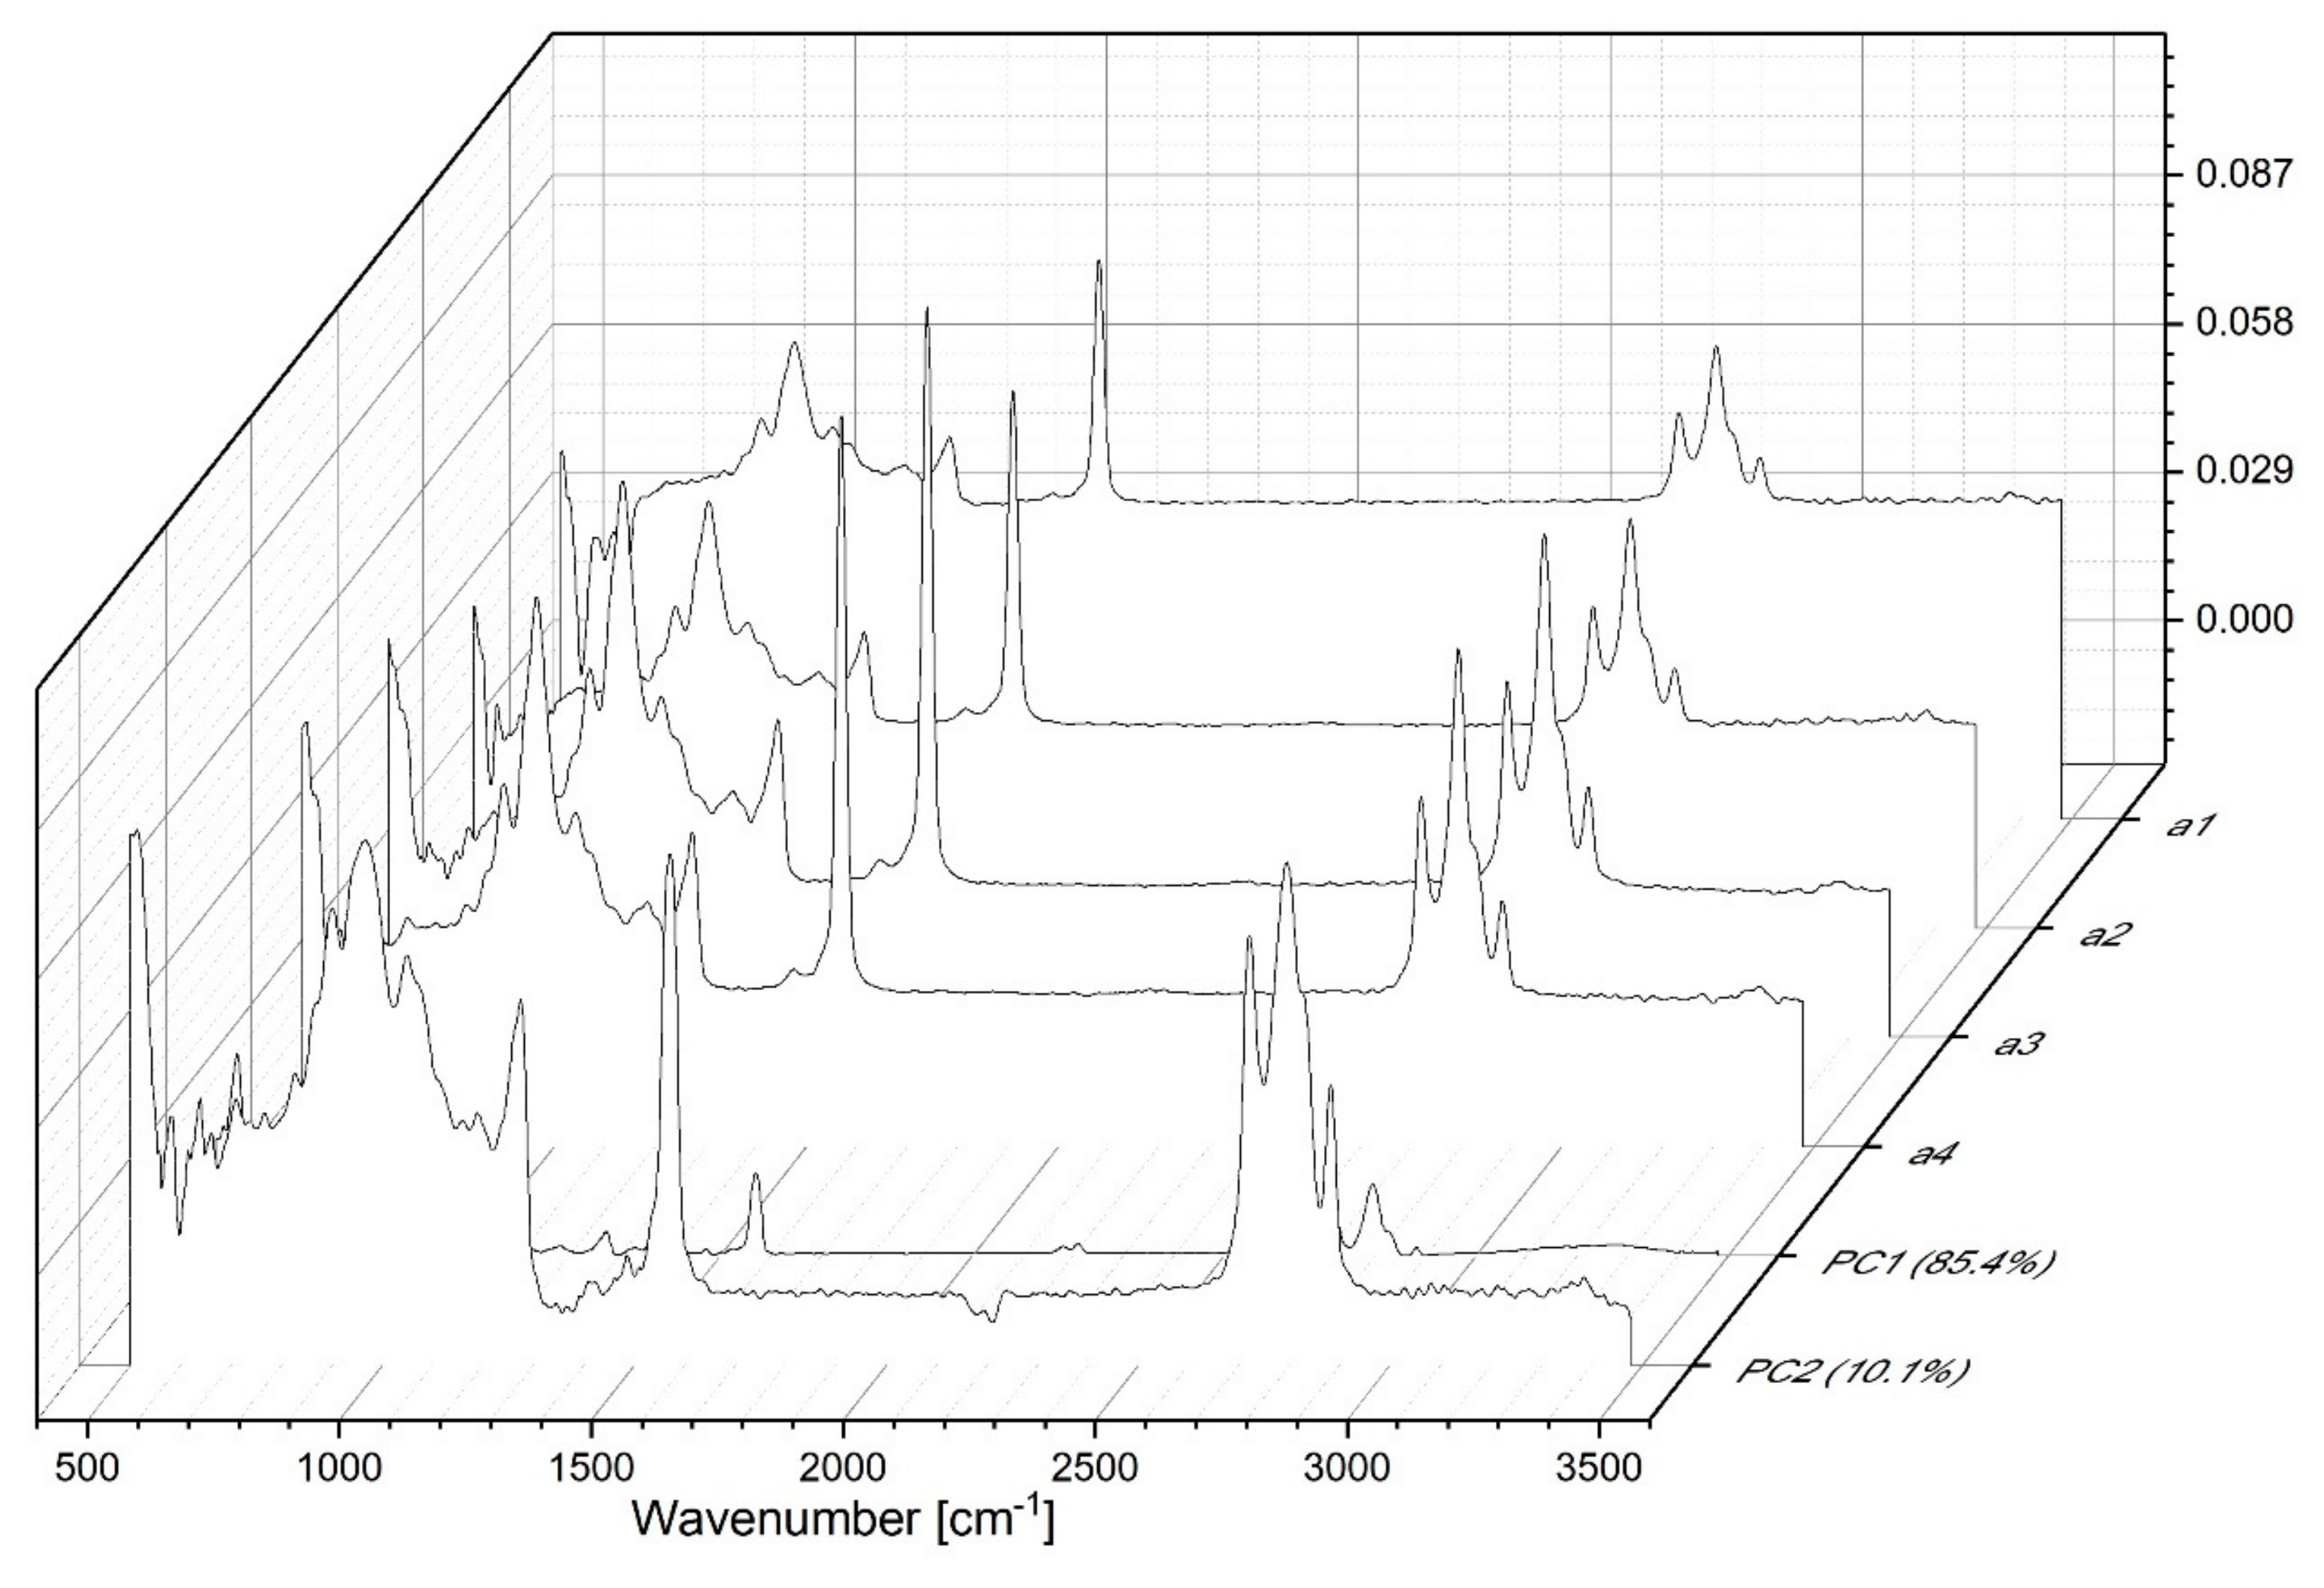
  • The analyzed oil samples were characterized by a very good fatty acids profile, which confirmed their value as food products with significant health benefits. Spectral analysis revealed significant changes with respect to bands associated in the literature to various fat fractions contained in the oil. The noticeable changes occurring after 8 weeks in storage in infrared spectra located within the ranges of 1720–1500 cm−1 and ~1426 cm−1, 1369 and 1237 cm−1, constituted markers which are evidence of the advancement of the ageing processes in the analyzed samples. Changes related to aging of the sample were related to the intensification of bands reflecting the vibrations of C-C, C=C, and C=O groups; as such, they constitute perfect marker bands which can be easily correlated with the given oil’s shelf life and the oxidative processes that affect it. However, only a detailed chemometric analysis allowed us to complement and fully follow differences between the respective samples which reflected the particular storage conditions.
  • The advent of FTIR with multivariate analysis has revolutionized many research fields. FTIR offers unique advantages, as it reflects the overall vibrations of the components and their interactions within the samples as spectra, in addition to being non-invasive and label-free, unlike conventional methods of this kind.
In this study, we utilized technique FTIR to analyze oil samples from Moldavian dragonhead seeds. This technique, combined with chemometric analysis, was capable of differentiating the sample response in relation their similarity and value as food products with significant health benefits. It is expected that the presented results may prove useful in defining the spectroscopic markers of the ageing processes that take place in oil samples, which significantly affect the quality and shelf-life of oil products. Moreover, the study illustrated a reliable, quantitative method of detecting preliminary differences between oil samples without the need to resort to costly, standard chemical methods.

Supplementary Materials

The following are available online at https://www.mdpi.com/2071-1050/11/22/6414/s1.

Author Contributions

Conceptualization, A.M. (Arkadiusz Matwijczuk), T.O. and A.K.; methodology, A.M. (Arkadiusz Matwijczuk), T.O. and A.M. (Alicja Matwijczuk); validation, A.W., E.C. and M.C.; formal analysis, A.M. (Arkadiusz Matwijczuk), A.W., D.W. and A.N; data curation. A.M. (Arkadiusz Matwijczuk), T.O., A.K., A.M. (Alicja Matwijczuk), A.N., A.W. and D.W. writing—original draft, A.M. (Arkadiusz Matwijczuk), T.O., A.K., A.M. (Alicja Matwijczuk), A.N., A.W. and D.W. All authors read and approved the final manuscript.

Funding

This research received no external funding.

Acknowledgments

The part of research of Agnieszka Niemczynowicz in publication was written as a result internship in Valencia, Spain, co-financed by the European Union under the European Social Fund (Operational Program Knowledge Education Development), carried out in the project Development Program at the University of Warmia and Mazury in Olsztyn (POWR.03.05. 00-00-Z310/17). The authors Agnieszka Niemczynowicz and Arkadiusz Matwijczuk acknowledge the Cost project CA 15126 and CA15216.

Conflicts of Interest

The authors declare no conflict of interest.

References

  1. Oniszczuk, A.; Olech, M.; Oniszczuk, T.; Wojtunik-Kulesza, K.; Wójtowicz, A. Extraction methods, LC-ESI-MS/MS analysis of phenolic compounds and antiradical properties of functional food enriched with elderberry flowers or fruits. Arab. J. Chem. 2016, in press. [Google Scholar] [CrossRef]
  2. Wójtowicz, A.; Oniszczuk, A.; Oniszczuk, T.; Kocira, S.; Wojtunik, K.; Mitrus, M.; Kocira, A.; Widelski, J.; Skalicka-Wożniak, K. Application of Moldavian dragonhead (Dracocephalum moldavica L.) leaves addition as a functional component of nutritionally valuable corn snacks. J. Food Sci. Technol. 2017, 54, 3218–3229. [Google Scholar] [CrossRef]
  3. Wolski, T.; Kwiatkowski, S. Biology of growth and development of Moldavian dragonhead (Dracocephalum moldavica L.)–aromatic and medicinal plant. Post. Fitoter. 2006, 1, 2–10. [Google Scholar]
  4. Kocira, S.; Sujak, A.; Kocira, A.; Wójtowicz, A.; Oniszczuk, A. Effect of Fylloton application on photosynthetic activity of Moldavian dragonhead (Dracocephalum moldavica L.). Agric. Agric. Sci. Procedia 2015, 7, 108–112. [Google Scholar] [CrossRef]
  5. Dmitruk, M.; Weryszko-Chmielewska, E.; Sulborska, A. Flowering and nectar secretion in two forms of the Moldavian dragonhead (Dracocephalum moldavica L.)—A plant with extraordinary apicultural potential. J. Apic. Sci. 2018, 62, 97–110. [Google Scholar] [CrossRef]
  6. Ehsani, A.; Alizadeh, O.; Hashemi, M.; Afshari, A.; Aminzare, M. Phytochemical, antioxidant and antibacterial properties of Melissa officinalis and Dracocephalum moldavica essential oils. Vet. Res. Forum 2017, 8, 223–229. [Google Scholar] [PubMed]
  7. Domokos, J.; Peredi, J.; Halasz-Zelnik, K. Characterization of seed oils of dragonhead (Dracocephalum moldavica L.) and catnip (Nepeta cataria var. citriodora Balb.). Ind. Crop. Prod. 1994, 3, 91–94. [Google Scholar] [CrossRef]
  8. Dziki, D.; Miś, A.; Gładyszewska, B.; Laskowski, J.; Kwiatkowski, S.; Gawlik-Dziki, U. Physicochemical and grinding characteristics of dragonhead seeds. Int. Agrophys. 2013, 27, 403–408. [Google Scholar] [CrossRef]
  9. Guillén, M.D.; Cabo, N. Relationships between the composition of edible oils and lard and the ratio of the absorbance of specific bands of their Fourier transform infrared spectra. Role of some bands of the fingerprint region. J. Agric. Food Chem. 1998, 46, 1788–1793. [Google Scholar] [CrossRef]
  10. Rohman, A.; Man, Y.C. Fourier transform infrared (FTIR) spectroscopy for analysis of extra virgin olive oil adulterated with palm oil. Food Res. Int. 2010, 43, 886–892. [Google Scholar] [CrossRef]
  11. Nawrocka, A.; Lamorska, J. Determination of food quality by using spectroscopic methods. In Advances in Agrophysical Research; Intech Open: Rijeka, Croatia, 2013; pp. 347–368. [Google Scholar] [CrossRef]
  12. Yasushi, E. Analytical methods to evaluate the quality of edible fats and oils: The JOCS standard methods for analysis of fats, oils and related materials (2013) and advanced methods. J. Oleo Sci. 2018, 67, 1–10. [Google Scholar] [CrossRef] [PubMed]
  13. Gonçalves, R.P.; Março, P.H.; Valderrama, P. Thermal edible oil evaluation by UV–Vis spectroscopy and chemometrics. Food Chem. 2014, 163, 83–86. [Google Scholar] [CrossRef] [PubMed]
  14. Leder, P.J.S.; Porcu, O.M. The importance of UV-Vis spectroscopy: Application in food products characterization. Scholar. J. Food Nutr. 2018, 1. [Google Scholar] [CrossRef]
  15. Kruzlcova, D.; Mocak, J.; Katsoyannos, E.; Lankmayr, E. Classification and characterization of olive oils byUV-Vis absorption spectrometry and sensorial analysis. J. Food Nutr. Res. 2008, 47, 181–188. [Google Scholar]
  16. Alexa, E.; Dragomirescu, A.; Pop, G.; Jianu, C.; Drago, D. The use of FT-IR spectroscopy in the identification of vegetable oils adulteration. J. Food Agric. Environ. 2009, 7, 20–24. [Google Scholar] [CrossRef]
  17. Nigri, S.; Oumeddour, R. Fourier transform infrared and fluorescence spectroscopy for analysis of vegetable oils. MATEC Web Conf. 2013, 5, 04028. [Google Scholar] [CrossRef]
  18. Kluczyk, D.; Matwijczuk, A.; Górecki, A.; Karpińska, M.M.; Szymanek, M.; Niewiadomy, A.; Gagoś, M. Molecular organization of dipalmitoylphosphatidylcholine bilayers containing bioactive compounds 4-(5-heptyl-1, 3, 4-thiadiazol-2-yl) benzene-1, 3-diol and 4-(5-methyl-1, 3, 4-thiadiazol-2-yl) benzene-1, 3-diols. J. Phys. Chem. B 2016, 120, 12047–12063. [Google Scholar] [CrossRef]
  19. Rohman, A. Infrared spectroscopy for quantitative analysis and oil parameters of olive oil and virgin coconut oil: A review. Int. J. Food Prop. 2017, 20, 1447–1456. [Google Scholar] [CrossRef]
  20. Siddiqui, N.; Ahmad, A. Infrared spectroscopic studies on edible and medicinal oils. Int. J. Sci. Environ. Tech. 2013, 2, 1297–1306. [Google Scholar]
  21. Karim, M.M.; Karim, S.F.E.; Rana, A.A.; Masum, S.M.; Mondol, A.; Israt, S.S. ATR-FTIR spectroscopy and chemometric techniques for the identification of edible vegetable oils. Bangladesh J. Sci. Ind. Res. 2015, 50, 233–240. [Google Scholar] [CrossRef]
  22. Al-Alawi, A.; Van De Voort, F.R.; Sedman, J.; Ghetler, A. Automated, FTIR analysis of free fatty acids or moisture in edible oils. J. Assoc. Lab. Autom. 2006, 11, 23–29. [Google Scholar] [CrossRef]
  23. Hayati, I.N.; Che Man, Y.B.; Tan, C.P.; Aini, I.N. Monitoring peroxide value in oxidized emulsions by Fourier transform infrared spectroscopy. Eur. J. Lipid Sci.Technol. 2005, 107, 886–895. [Google Scholar] [CrossRef]
  24. Hendl, O.; Howell, J.A.; Lowery, J.; Jones, W. A rapid andsimple method for the determination of iodine values usingderivative Fourier transform infrared measurements. Anal. Chim. Acta 2001, 427, 75–81. [Google Scholar] [CrossRef]
  25. Dubois, J.; Van De Voort, F.R.; Sedman, J.; Ismail, A.A.; Ramaswamy, H.R. Quantitative Fourier transform infrared analysis for anisidine value and aldehydes in thermally stressed oils. J. Am. Oil Chem. Soc. 1996, 73, 787–794. [Google Scholar] [CrossRef]
  26. Sherazi, S.T.H.; Talpur, M.Y.; Mahesar, S.A.; Kandhro, A.A.; Arain, S. Main fatty acid classes in vegetable oils bySB-ATR-Fourier transform infrared (FTIR) spectroscopy. Talanta 2009, 80, 600–606. [Google Scholar] [CrossRef]
  27. Maggio, R.M.; Kaufman, T.S.; Del Carlo, M.; Cerretani, L.; Bendini, A.; Cichelli, A.; Compagnone, D. Monitoring of fatty acid composition in virgin oliveoil by Fourier transformed infrared spectroscopy coupled with partial least squares. Food Chem. 2009, 114, 1549–1554. [Google Scholar] [CrossRef]
  28. Alonso-Salces, R.M.; Herrero, C.; Barranco, A.; López-Márquez, D.M.; Berrueta, L.A.; Gallo, B.; Vicente, F. Polyphenolic compositions of Basque natural ciders: A chemometric study. Food Chem. 2006, 97, 438–446. [Google Scholar] [CrossRef]
  29. Woodcock, T.; Downey, G.; Kelly, J.D.; O’Donnell, C. Geographical classification of honey samples by near-infrared spectroscopy: A feasibility study. J. Agric. Food Chem. 2007, 55, 9128–9134. [Google Scholar] [CrossRef]
  30. Çam, M.; Hışıl, Y.; Durmaz, G. Classification of eight pomegranate juices based on antioxidant capacity measured by four methods. Food Chem. 2009, 112, 721–726. [Google Scholar] [CrossRef]
  31. Wang, T.; Jonsdottir, R.; Ólafsdóttir, G. Total phenolic compounds, radical scavenging and metal chelation of extracts from Icelandic seaweeds. Food Chem. 2009, 116, 240–248. [Google Scholar] [CrossRef]
  32. Silverstein, R.M.; Webster, F.X.; Kiemle, D.J. Spectrophotometric Identification of Organic Compounds, 7th ed.; Wiley: New York, NY, USA, 2005. [Google Scholar]
  33. Yang, H.; Irudayaraj, J. Comparison of near-infrared, Fourier transform-infrared, and Fourier transform-Raman methods for determining olive pomace oil adulteration in extra virgin olive oil. J. Amer. Oil Chem. Soc. 2001, 78, 889. [Google Scholar] [CrossRef]
  34. Vlachos, N.; Skopelitis, Y.; Psaroudaki, M.; Konstantinidou, V.; Chatzilazarou, A.; Tegou, E. Applications of Fourier transform-infrared spectroscopy to edible oils. Anal. Chim. Acta 2006, 573, 459–465. [Google Scholar] [CrossRef] [PubMed]
  35. Dupuy, N.; Duponchel, L.; Huvenne, J.P.; Sombret, B.; Legrand, P. Classification of edible fats and oils by principal component analysis of Fourier transform infrared spectra. Food Chem. 1996, 57, 245–251. [Google Scholar] [CrossRef]
  36. Guillén, M.D.; Cabo, N. Infrared spectroscopy in the study of edible oils and fats. J. Sci. Food Agric. 1997, 75, 1–11. [Google Scholar] [CrossRef]
  37. Elzey, B.; Pollard, D.; Sayo, O.F. Determination of adulterated neem and flaxseed oil compositions by FTIR spectroscopy and multivariate regression analysis. Food Control 2016, 68, 303–309. [Google Scholar] [CrossRef]
  38. Rohman, A.; Che Man, Y.B. Analysis of cod-liver oil adulteration using Fourier transform infrared (FTIR) spectroscopy. J. Am. Oil Chem. Soc. 2009, 86, 1149. [Google Scholar] [CrossRef]
  39. Hirri, A.; Bassbasi, M.; Platikanov, S.; Tauler, R.; Oussama, A. FTIR spectroscopy and PLS-DA classification and prediction of four commercial grade virgin olive oils from Morocco. Food Anal. Methods 2016, 9, 974–981. [Google Scholar] [CrossRef]
  40. Gurdeniz, G.; Ozen, B. Detection of adulteration of extra-virgin olive oil by chemometric analysis of mid-infrared spectral data. Food Chem. 2009, 116, 519–525. [Google Scholar] [CrossRef] [Green Version]
  41. Lai, Y.W.; Kemsley, E.K.; Wilson, R.H. Potential of Fourier transform infrared spectroscopy for the authentication of vegetable oils. J. Agric. Food Chem. 1994, 42, 1154–1159. [Google Scholar] [CrossRef]
  42. Bendini, A.; Cerretani, L.; Di Virgilio, F.; Belloni, P.; Bonoli-Carbognin, M.; Lercker, G. Preliminary evaluation of the application of the FTIR spectroscopy to control the geographic origin and quality of virgin olive oils. J. Food Qual. 2007, 30, 424–437. [Google Scholar] [CrossRef]
  43. De Luca, M.; Restuccia, D.; Clodoveo, M.L.; Puoci, F.; Ragno, G. Chemometric analysis for discrimination of extra virgin olive oils from whole and stoned olive pastes. Food Chem. 2016, 202, 432–437. [Google Scholar] [CrossRef] [PubMed]
  44. Luca, M.; Terouzi, W.; Ioele, G.; Kzaiber, F.; Oussama, A.; Oliverio, F.; Tauler, R.; Ragno, G. Derivative FTIR spectroscopy for cluster analysis and classification of morocco olive oils. Food Chem. 2011, 124, 1113–1118. [Google Scholar] [CrossRef]
  45. Cebia, N.; Yilmaz, M.T.; Sagdic, O.; Yuce, H.; Yelboga, E. Prediction of peroxide value in omega-3 rich microalgae oil by ATR-FTIR spectroscopy combined with chemometrics. Food Chem. 2017, 225, 188–196. [Google Scholar] [CrossRef] [PubMed]
  46. Mahboubifar, M.; Hemmateenejad, B.; Javidnia, K.; Yousefinejad, S. Evaluation of long-heating kinetic process of edible oils using ATR–FTIR and chemometrics tools. J. Food Sci. Technol. 2017, 54, 659–668. [Google Scholar] [CrossRef] [Green Version]
  47. Granato, D.; Santos, J.S.; Escher, G.B.; Ferreira, B.L.; Maggio, R.M. Use of principal component analysis (PCA) and hierarchical cluster analysis (HCA) for multivariate association between bioactive compounds and functional properties in foods: A critical perspective. Trends Food Sci. Technol. 2018, 72, 83–90. [Google Scholar] [CrossRef]
Figure 1. ATR-FTIR spectra for selected Moldavian dragonhead oil samples stored at 7 °C (refrigerated) in an argon atmosphere in a clear bottle, respectively: a—immediately after pressing, b—two weeks after pressing, c—four weeks after pressing, d—8 weeks after pressing. The spectra are presented with the spectral range of 900–3150 cm−1.
Sustainability 11 06414 g001
Figure 2. ATR-FTIR spectra for selected Moldavian dragonhead oil samples stored at 7 °C (refrigerated) in an O2 atmosphere in a clear bottle, respectively: a—immediately after pressing, b—two weeks after pressing, c—four weeks after pressing, d—8 weeks after pressing. The spectra are presented with the spectral range of 900–3150 cm−1.
Sustainability 11 06414 g002
Figure 3. ATR-FTIR spectra for selected Moldavian dragonhead oil samples stored at 7 °C (refrigerated) in an argon atmosphere in a dark bottle, respectively: a—immediately after pressing, b—two weeks after pressing, c—four weeks after pressing, d—8 weeks after pressing. The spectra are presented with the spectral range of 900–3150 cm−1.
Sustainability 11 06414 g003
Figure 4. ATR-FTIR spectra for selected Moldavian dragonhead oil samples stored at 7 °C (refrigerated) in an O2 atmosphere in a dark bottle, respectively: a—immediately after pressing, b—two weeks after pressing, c—four weeks after pressing, d—8 weeks after pressing. The spectra are presented with the spectral range of 900–3150 cm−1.
Sustainability 11 06414 g004
Figure 5. Hierarchical Cluster Analysis (HCA) for FTIR Spectra of all oil samples.
Sustainability 11 06414 g005
Figure 6. Plot of eigenvalues for PCA of FTIR spectra.
Sustainability 11 06414 g006
Figure 7. 3D Score plot of PCA.
Sustainability 11 06414 g007
Figure 8. 2D score plot of PCA. PC1 vs. PC2.
Sustainability 11 06414 g008
Figure 9. 3D loading plot of PCA.
Sustainability 11 06414 g009
Figure 10. Loading plot of PC1 and PC2 for reference spectrum a1, a2, a3, a4.
Sustainability 11 06414 g010
Table 1. Positions of the maxima of absorption spectra and assignment to the relevant vibrations as recorded for Moldavian dragonhead oil samples stored at 7 °C (refrigerated), in an argon atmosphere and a clear bottle, respectively: a—immediately after pressing, b—two weeks after pressing, c—four weeks after pressing, d—8 weeks after pressing.
FTIRType and Origin of Vibrations
Position of Bands (cm−1)
abcd
3010300830073013ν(=C-Hm, cis-)
2956296329652961νas(-C-Hvst, -CHa) and νs(-C-Hvst, -CHa) (aliphatic groups in triglycerides)
2926292629252928
2853285328522854
1743174217431743ν(-C=Ovst) in esters
1708170117091701ν(-C=Ovw) in acids
1656164716561651νvw(-C=C-, cis-)
158859116001613
--15891557
---1540
---1515
1459146014601457δvw(-C-H) w CH2 and in CH3, groups, deformation (scissoring) νvw(-C-H, cis-) deformation (ring)
--14291428
1373137513751369/1393νw, m, vw (-C-H, -CH3) and deformation
130213181304/1348-δm(-C-H, -CH3)
1271126212681267νm(-C-O) or δm(-CH2-)
123612401237-νm(-C-O) or δm(-CH2-)
1161115911601161νm(-C-O)
1097109911001098νm,vw(-C-O)
1067102510651028
1027-1030-
966968964964δw(-HC=CH-, trans-) out-of-plain deformation
ν—stretching vibrations, δ—deformation vibrations, s—symmetric, as—asymmetric, st—strong, w—weak.

