1. Introduction
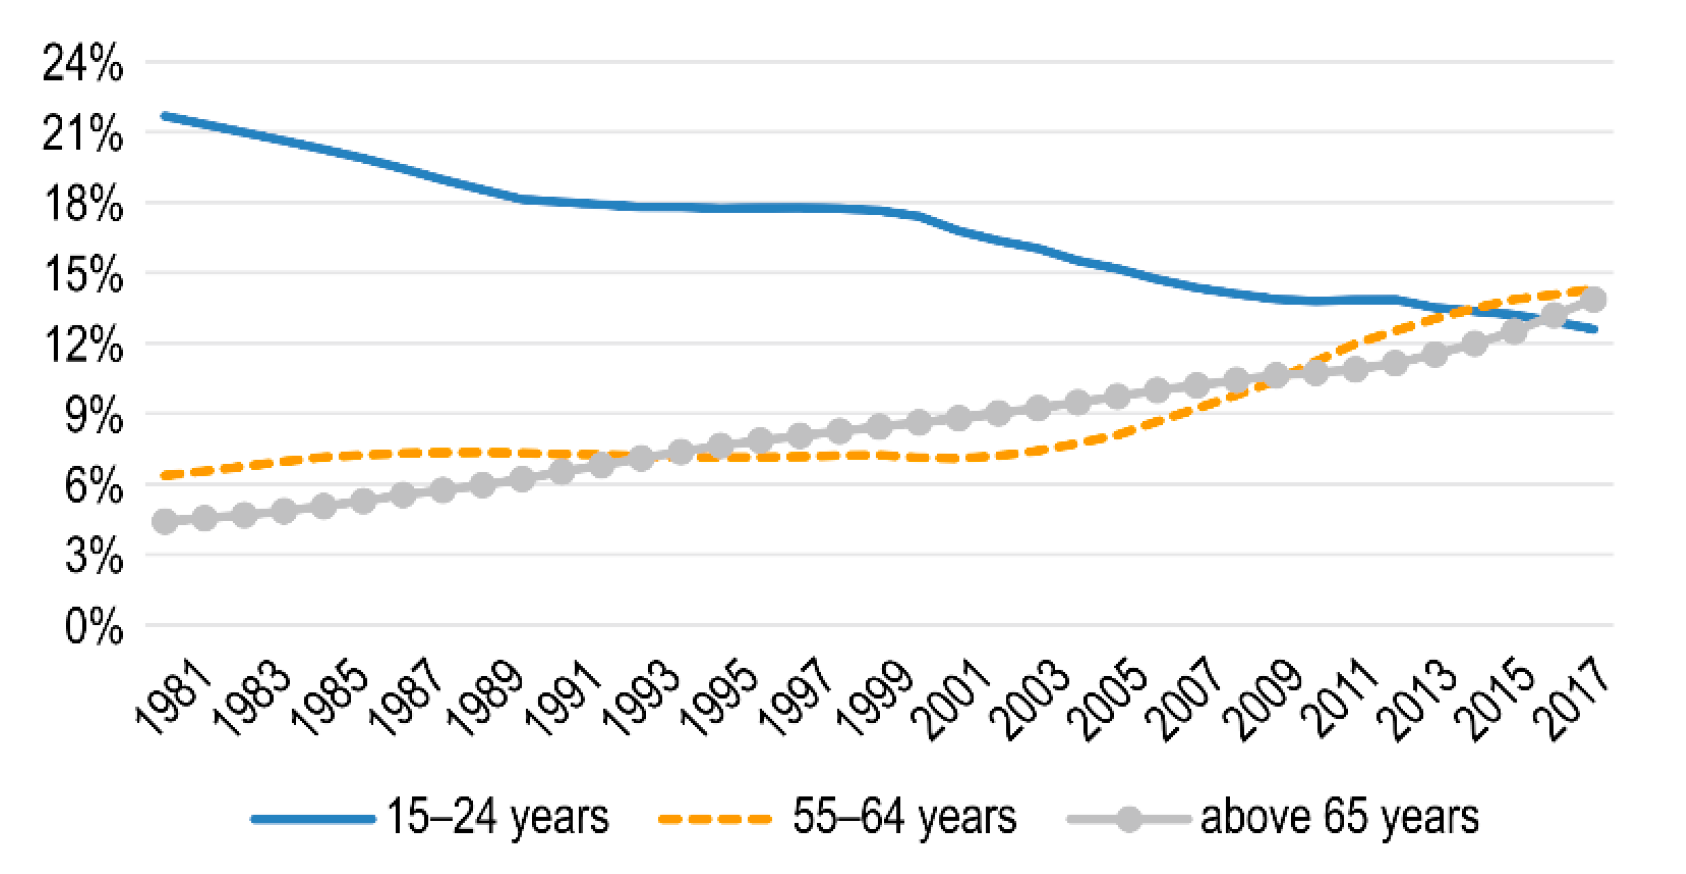
The World Health Organization (WHO) defines an aging society as one where more than 7% of the population is aged 65 years or above, an aged society as one in which this age group accounts for more than 14% of the total population, and a hyper-aged society as one wherein this rate is greater than 20%. Taiwan became an aging society in 1993 (
Figure 1), and in April 2018, the Ministry of the Interior officially announced that Taiwan had become an aged society. At the end of March in the same year, those aged 65 years and above accounted for 14.05% of Taiwan’s total population, indicating that one in every seven persons was a senior citizen. According to the Population Projections for R.O.C. (Taiwan): 2016–2061 published by the National Development Council, Taiwan is expected to become a hyper-aged society by 2026.
Taiwan’s population is aging at a fast pace, and its aged society is expected to transition into a hyper-aged society within eight years. According to estimates by the National Development Council, Taiwan’s aging rate is significantly greater than those in Japan (11 years), Canada (14 years), the United States (16 years), France (29 years), Germany (37 years), and the United Kingdom (51 years). South Korea (9 years) reports a similar aging rate (see
Table 1).
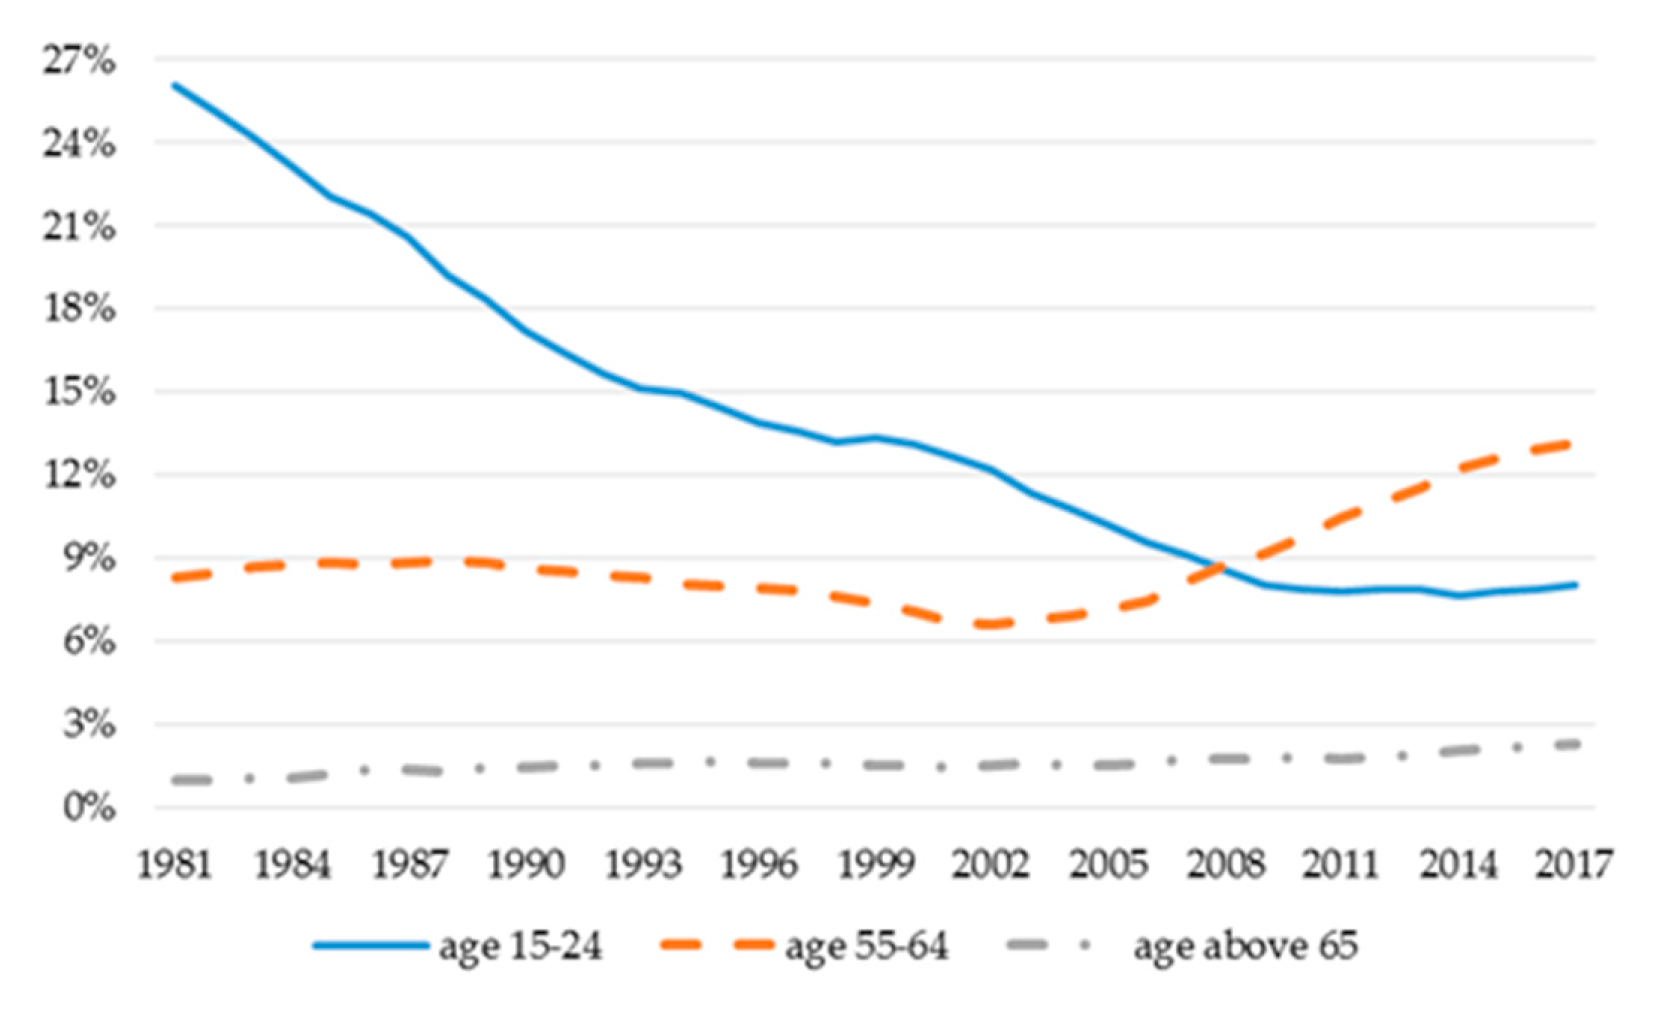
With rapid demographic changes over the past 20 years, the closely related labor market has also experienced significant changes. With the Taiwanese society experiencing population aging and sub-replacement fertility, the ratio of the youth workforce to total population continues to decline, while that of individuals aged 55 years and above is increasing (see
Figure 2). Numerous studies explore the impact of population aging on productivity and economic development. Aiyar et al. [
1], for example, find that workforce aging in Europe negatively impacts the economic growth rate. Similarly, Bloom et al. [
2] and Maestas et al. [
3] suggest that population aging negatively affects economic growth in Asia and the United States. By contrast, Börsch-Supan and Weiss [
4] state that while aging employees tend to commit more mistakes, there is no visible decline in their productivity. Likewise, Burtless [
5] indicates that aging employees help increase productivity. Prettner [
6] notes that whether extended life expectancy negatively impacts economic growth is dependent on the relative value of the death and birth rates. In sum, the literature offers inconsistent conclusions. This study aims to address this inconsistency by investigating the impact of population aging and human resources aging on Taiwan’s economy.
The continued increase in Taiwan’s elderly population has made the government and society aware of the age group’s need for medical care, welfare, and long-term care. In 2008, the Taiwanese government implemented the first generation of the ten-year long-term care plan, and in 2017, it initiated the second generation of the plan, also referred to as Long-Term Care 2.0. The objectives of the policy are to combine public and private resources at all levels and integrate resources for medical care, long-term care, and preventive healthcare to perfect community care systems and mechanisms and create qualitative, affordable, and accessible long-term care services.
This study empirically analyzes 1981–2017 data published by the Taiwanese government (e.g., PC-AXIS database) and related entities including the Department of Household Registration Affairs, Ministry of the Interior; Department of Statistics, Ministry of Health and Welfare; and Directorate-General of Budget, Accounting and Statistics, Executive Yuan. The analysis focus on the impact of workforce aging and the population dependency ratio on economic growth, the primary channel through which population and workforce aging impacts economic growth, and the influence of government policies for eldercare and medical expenses on economic growth. The results show that an aging workforce is significantly and positively related to GDP growth rate. A decomposition of the dependency ratio suggests that the old-age dependency ratio has a significantly negative effect, while the youth dependency ratio has no significant effect. Since productivity is an accumulation of different economic factors [
7,
8], this study decomposes productivity into real capital, human capital, and total factor productivity (TFP). The empirical findings indicate that human capital is essential for total factor productivity (TFP) growth and that an aging workforce and population mainly impact productivity through TFP. In addition, the integration of policy factors into the model shows that increasing the supply of eldercare workforce and foreign manpower contributed to counter the negative impact caused by population aging on national economic growth.
This remainder of this paper is organized as follows.
Section 2 reviews the literature on population and workforce aging.
Section 3 describes the research design, including the data and empirical models used in this study.
Section 4 discusses the empirical results and analysis.
Section 5 provides concluding remarks.
2. Literature Review
There are several discussions on the ambiguous effect of population aging on productivity and economic growth. Lindh and Malmberg [
9] analyze 1950–1990 data for OECD countries and find that workers aged 50–64 years help increase productivity, workforce members aged 65 years and above negatively impact productivity, and the younger workforce has no significant impact on productivity. Aiyar et al.’s [
1] cross-country empirical research analyzes the impact of labor force aging on workforce productivity using OECD data for 28 European countries from 1950 to 2014. Their results suggest that an increasing proportion of employees aged 55–64 years significantly reduces total productivity, while the old-age dependency ratio and the young-age dependency ratio have no significant impact. Manabu and Hosoyama [
10] indicate that population aging leads to a reduction in the growth rate of the labor force and capital stock (due to the reduction of savings rate). And, the accompanied situation is a downward pressure on the real return to physical capital, and upward pressure on real wage rates. They conclude the demographic shock leads to an increase in tax and pension burdens, decreases net economic welfare, and negatively affects the economic growth rate. Furthermore, they suggest that the government could make adjustments to important elements of pension systems (e.g., raise the saving incentives and saving rate) and could mitigate negative impacts of population aging and improve economic welfare for future generations. Batini et al. [
11] suggest that population aging could reduce aggregate growth in the United States, Japan, and other industrial countries; however, it contributes to the economic growth of developing countries as the relative size of their working-age population increases. Bloom et al. [
2] analyze the impact of demographic changes on economic growth in Asia from 1960 to 2005. Their results reveal that while the young-age dependency ratio has a significant and positive impact on economic growth, the old-age dependency ratio has a significantly negative effect on short-term economic growth but an insignificantly negative effect on long-term growth. They analyze the various behavioral responses that come with the shift in age structure: an increase in female labor force participation as fertility declines, an increase in savings, and an increase in education. These factors act together and may offset any negative effects of a shift in the age structure; thus, an insignificant effect of rising elderly shares on economic performance has been observed.
Prettner [
6] points out that a shift in age structure results in a shift of resources to R&D and consequently fosters per capita output growth. When intertemporal knowledge spillovers are strong, the growth effect would be long-lasting. He proposes that ongoing demographic changes do not necessarily hamper technological progress and, therefore, economic prosperity. Simultaneously decreasing birth and death rates can even lead to an increase in the economic growth rate. Similar insights are provided by Aksoy et al. [
12]. They provide empirical evidence of the link between demographic structure and innovation activity. The patent application is positively affected by middle-aged cohorts (working-age cohorts) and negatively by retirees. The innovation activities can serve as a channel, being particularly important for generating reduced long-term output growth due to aging.
From labor supply and human capital accumulation perspectives, Burtless [
5] shows that in the United States, the productivity of workers aged 60–74 years is not lower than that of those aged 25–59 years. He concludes that workers with lower productivity exit the workforce at a younger age, while more productive ones remain in the workforce into old age. Lee and Mason [
13] also highlight the linkage between human capital investments and economic growth. They propose that as fertility falls in other Asian countries, spending per child will rise, with beneficial effects for future labor productivity and economic growth. To some degree, the population aging effects are reserved as the quality of labor will be substituted for quantity of labor. Börsch-Supan and Weiss [
4] examine productivity data for a large-scale car assembly plant in Germany and conclude that employees continue to report increasing productivity until the age of 60 years. In addition, even in environments requiring intensive physical work, the decline in the physical ability of aging workers is compensated for by traits that appear to increase with age, such as the experience and ability to function within a team in high-pressure situations. Bloom et al. [
14] indicate that increased longevity—a key driver of population aging—can change life-cycle behavior, leading to a longer working life, higher savings, and more investment in human capital. Benhabib and Spiegel [
15] find that human capital positively influences TFP growth. Human capital not only facilitates domestic technological innovation but also speeds up the adoption of foreign technology. In addition, human capital can serve as an agent in attracting physical capital accumulation. Panda [
16] indicates the positive externalities associated with college education on TFP growth and provides insights related to the importance of schooling. Lee and Mason [
13] also highlight the linkage between human capital investments and economic growth. They propose that as fertility falls in other Asian countries, spending per child will rise, with beneficial effects for future labor productivity and economic growth. To some degree, the quality of labor will be substituted for quantity of labor. Chanda and Panda [
17] confirm the positive role of human capital contributing to higher productivity growth.
From the foreign manpower perspectives, Hui and Hashi [
18] identify that foreign labor and immigration are major contributions to population and economic growth in Singapore. Harper [
19] proposes that immigration has the potential to prevent population decline, maintain the size of the labor force (and thus the support ratio), and slow population aging. There are also the indirect effects of migration on innovation, economic growth, employment, and welfare. Felbermayr et al. [
20], Jaumotte et al. [
21], Boubtane et al. [
22], Borjas [
23], Aleksynska and Tritah [
24] also point out that immigrants’ human capital can mitigate domestic labor shortage level and positively impact economic growth.
Bloom et al. [
14] suggest the important roles played by the policy and institutional environment in determining the economic growth effects of population aging. Aiyar et al. [
1] propose that policies, such as increasing effective access to healthcare services, improving vocational training, and boosting innovation activities, can help mitigate the negative productivity impact of an aging workforce. Vogel et al. [
25] address three adjustment channels, i.e., investing abroad, endogenous human capital formation, and increasing the retirement age, that can mitigate the detrimental effects of aging. Combining endogenous human capital formation with an increasing retirement age could reduce the welfare loss of population aging.
4. Empirical Results and Analysis
4.1. Results of Unit Root Tests
The results of unit root tests are reported in
Table 3. We implement the augmented Dickey–Fuller (ADF) [
26], Phillips–Perron (PP) [
27], and Kwiatkowski–Phillips–Schmidt–Shin (KPSS) [
28] tests. In the level form, the ADF, PP, and KPSS tests all indicate the time series is non-stationary for all the variables except for Invest. We transform variables into first-order differential forms and the results of unit root tests confirm the stationarity at the first differences.
4.2. Descriptive Statistics
Table 4 presents the descriptive statistics for all the variables employed in this research. The mean of the quarterly real GDP per worker (
WGDP) is NT
$217,345, and it ranges between NT
$82,433 and NT
$364,239 with a median of NT
$221,978. During the sample period, from 1981 to 2017, the quarterly ratio of workers aged 55–64 years and above to the total workforce (
AgeWorker) reports a minimum value of 6.61% in the fourth quarter of 2002 and a maximum value of 13.20% in the fourth quarter of 2017. The old-age dependency ratio (
OADR) shows an increasing pattern with rising life expectancy, whereas the youth dependency ratio (
YADR) indicates a substantially decreasing trend with a declining fertility rate. The ratio of the eldercare workforce demonstrates a continually increasing trend over the research period.
Table 3 presents
AgeWorker, OADR, YADR, Elder_Care,
Employ, WHEDU, Invest, and
ForWorker as ratios, and thus, the values are relatively small. The values for the remaining economic variables, that is,
WGDP and
KW, are relatively large. To reduce the variation in the numerical scale, the analysis employs the natural logarithm for these variables to enhance homogeneity.
4.3. Regression Analysis: Impact of Population and Workforce Aging on GDP
Table 5 reports the results of regressing the aging population and workforce on GDP. In column (1), the significantly positive coefficient for
indicates that individuals aged 55 years and above in the workforce positively contribute to the GDP growth rate in Taiwan. The negative coefficient for the rate of change in the old-age dependency ratio (
OADR) shows that the increasing aging population might slow down economic development.
Life expectancy in Taiwan has been steadily increasing over the decades. The longer the lifespan, the greater the incentive for workers to increase the number of work years. The ratio of workers aged 55–64 years shows an upward trend in recent years. Prior research documents that a continually aging workforce could be detrimental to economic productivity (e.g., [
1,
2,
10,
11]). By contrast, our empirical results reveal that workforce aging does not have a negative impact, but a beneficial one, and is consistent with insights of Börsch-Supan and Weiss [
4] and Malmberg and Halvarsson [
29] indicate that older workforce influence and enhance the ability to learn among both young and prime-age workers. This creates a kind of learning-by-seeing or learning-by-interacting relationship between workers of different age groups and is good for productivity. Börsch-Supan and Weiss [
4] show that the average age-productivity profile of individual workers is increasing until age 65. They point out the older worker’ experience is the crucial characteristic that keeps their productivity from falling and suggest that older workers are especially able to grasp difficult situations in vital tasks. Despite the preconceived notions and myths about an elderly workforce, a growing number of management and HR professionals believe older employees positively contribute to an organization’s development goals. According to surveys conducted by Paullin [
30] and the Transamerica Center for Retirement Studies [
31], the most frequently mentioned advantages of having older employees are greater wisdom and maturity, professionalism, work ethics, and loyalty, and reliability; moreover, they are a valuable institutional knowledge resource in training and mentoring the younger workforce. The UK government, for example, implemented the Fuller Working Lives: a partnership approach policy in 2017 to incentivize employers to recruit, retrain, and retain older workers. The government further commits to introducing policies that not only support lifelong learning but also promote social connectedness and reduce loneliness and social isolation for older workers.
The empirical results presented thus far suggest that the aging workforce in Taiwan has a significantly positive impact on economic growth. However, the old-age dependency ratio has a significantly negative effect. According to the Population Projections for R.O.C. (Taiwan): 2016–2061, Taiwan has a constrictive population pyramid characterized by a rapidly declining birth rate and insufficient human resources. While aging workers are still considered to improve productivity, the rapid increase in the old-age dependency ratio will create a social burden. To mitigate the economic issues caused by this phenomenon, the government has implemented related policies. For instance, since the launch of the Senior Citizens Welfare Act in 1980, the government has been implementing welfare and care policies targeted at the elderly. The National Health Insurance (NHI) set up in 1995 covers medical expenses such as elderly care and has helped further improve the quality of healthcare and reduced the burden on families. In 2008, the Cabinet introduced a 10-year program to transform the nation’s long-term care system. This plan has led to the implementation of Taiwan’s first national-level, long-term care network for the elderly. In 2017, the Taiwanese government initiated the second generation of the plan, Long-Term Care 2.0., that greatly expands the scope of services provided by the government to care for the elderly. The changes to eldercare are aimed at easing the burden for more seniors and their families while generating greater efficiencies. Column (2) includes the eldercare workforce ratio (Elder_Care) to proxy the eldercare policy effect. To analyze the effectiveness of this policy implemented to address population aging, the interaction term is included in the regression model.
The significantly positive coefficient for the interaction term highlights that the expanding long-term care for the elderly can significantly mitigate the negative impact of a high old-age dependency ratio. Long-Term Care 2.0 implemented in 2017 by the Ministry of Health and Welfare prioritizes eldercare with the objective of expanding and improving existing in-home care services. Traditionally, offspring are expected to care for their elders; however, work schedules and the lack of healthcare knowledge and professional abilities tend to be hindering factors. In-home care can compensate for the dearth of caregivers during the day and offspring’s work schedule, allowing the elderly to live in their own homes instead of unfamiliar environments.
In column (3), we adopt the ratio of foreign workers with residency (
ForWorker) to capture the foreign manpower effect. From the significantly positive coefficient on the interaction term
, we find that introducing immigration and foreign labor force can partially address the negative impact of population aging. Hui and Hashi [
18] identify that foreign labor and immigration are major contributions to population and economic growth in Singapore. Harper (2014) proposed that immigration has the potential to prevent population decline, maintain the size of the labor force (and thus the support ratio), and slow population aging. There are also the indirect effects of migration on innovation, economic growth, employment, and welfare. Felbermayr et al. [
20], Jaumotte et al. [
21], Boubtane et al. [
22], Borjas [
23], Aleksynska and Tritah [
24] also point out that immigrants’ human capital can mitigate domestic labor shortage level and positively impact economic growth.
4.4. Regression Analysis: Channels Through which Population and Workforce Aging Impact GDP
To further explore the various channels through which population and workforce aging impact the real output, an aggregate production function is employed to facilitate the empirical analysis. Hall and Jones [
8] incorporate the concept of human capital in the Solow growth model [
7] and extend the production function as
,, where
At and
Ht denote the TFP index and human capital index in period t. Dividing both sides of the equation by total labor produces
, for which the natural logarithm is as follows:
As shown in equation (2), the real output is a result of accumulations from various channels. The analysis employs the national average real GDP per worker, WGDP, to measure real output, y. A is the TFP index; k measures the average net real capital per worker, KW; and h is average human capital, WHEDU. The domestic population with a tertiary or higher education is used as a proxy for human capital level.
Since real output is accumulated from various channels, this analysis isolates each channel as a dependent variable to observe the relationship among the individual channel,
AgeWorker, and the old-dependency ratio.
Table 6 reports the regression results. Column (1) presents the results for WGDP listed in
Table 5 and columns (2)–(4) decompose the impact into TFP, net capital per worker (
KW), and human capital (
WHEDU). In column (2), the coefficient for
is significantly positive and, thus, an increase in the aging worker ratio may enhance TFP growth. Aksoy et al. [
12] find that innovation activities are positively affected by middle-aged workers, not young workers. The reason might be middle-aged workers have accumulated adequate knowledge, practical experience, and professionalism. Columns (3) and (4) show significantly negative and insignificant coefficients for
. This result suggests that the main channel through which aging workers can improve the GDP growth rate is an enhancement in TFP growth. We also find that the ratio of workforce with college or higher education attainment positively related to economic and TFP growth rate. The TFP index is a productivity index that measures the ratio of total output to total factor input. This ratio is based on technological progress, innovation, specialization, and efficiency improvement. Chanda and Panda [
17] confirm the positive role of human capital contributing to higher productivity growth. Benhabib and Spiegel [
15] point out that human capital positively influences TFP growth through facilitating domestic technological innovation and accelerating the adoption of foreign technology. Panda [
16] suggests the importance of education on TFP growth. Lee and Mason [
13] also highlight the linkage between human capital investments and economic growth. They propose that declining birth rate might boost the spending per child and have beneficial effects for future labor productivity and economic growth.
5. Conclusions
This research aims to analyze the impact of Taiwan’s aging population and aging workforce on its economic growth. In particular, it examines the impact of an aging workforce and the old-age dependency ratio on the growth rate of GDP. It also identifies the channels through which population aging influences GDP growth rate and explores the effectiveness of related government policies.
The empirical results for 1981–2017 highlight an increasing aging workforce that has significantly and positively impacted productivity. Nevertheless, the increase in the old-age dependency ratio has a significantly negative effect on the GDP growth rate, and this is mainly because of the decline in TFP. Accounting for policy factors, the empirical results suggest that improving healthcare and increasing the supply of the eldercare workforce and foreign manpower contribute toward countering the negative impact of an aging population on national economic growth. While numerous developed and developing countries are facing the challenge of an aging population, Taiwan is aging at a faster rate than Japan, Canada, the United States, Germany, and the United Kingdom, among others. The Taiwanese government should, therefore, implement policies to improve the elderly’s long-term care and to properly relax restrictions on foreign manpower. Social welfare support must also become an important aspect of Taiwan’s social security framework. Economic development strategies must be adjusted to the reality of a falling birth rate and an increasing elderly population. In response to its aging human resources, the Taiwanese government should allocate resources to help labor-intensive and low-skilled industries transform into more innovation-oriented and knowledge-intensive ones.
Due to imperfections in the employment policy scheme for elders previously implemented by the government, such as lack of flexible scope of work and no subsidy scheme for the employer, most of the elderly population is still facing a low employment rate today. The government is advised to have a further understanding of the employment issues faced by the elderly population with different educational or skill levels and is also advised to implement policies that will be enforced in employment services and job training for respective elderly populations in the future. If workforce aging is good for productivity growth, policies should be targeted as finding a means to stimulate continued labor-participation among older workers.
Planning of employment policy for the elderly population is advised as follows: first, the government should establish a more comprehensive database for elderly employees in order to draft up proper policy based on such a database. It should be noted that elderly population nowadays might have a relatively low educational level; however, due to the expected significant advances in educational systems in the future, elderly populations of future generations may have better skill-sets and a healthier physical status than the present generation, as such their opinions on elderly employment may differ greatly. Therefore, the policy-making strategy for elderly employment based on the present statistical research shall also include the possible varied conditions of elderly citizens in the future generation. Second, the government should implement supporting measures for postponing retirement, and reduce the age restrictions on the employment of the middle-aged and elderly workforce. In view of the obvious trend of an aging society and retirement at a younger age, the government should modify the laws based on the fiscal scheme and the needs of labor resources. Such laws are aimed to create more beneficial working conditions for the elderly workforce and are expected to encourage the elderly employee to stay in their job position for a longer time. Furthermore, it is advised to expedite the drafting of an employment policy with more flexible conditions, as well as a gradual or staged scheme for retirement of the elderly, to modify relevant labor laws by reducing age restrictions for middle-aged and elderly population, and introduce employment services for elderly citizens whose age is more than 65 years old. Third, an aging society and low birth rate have resulted in a change of demographic structure. Labor resources at ages between 15 to 64 years old have continued to decrease. The labor force participation rate shall be increased for all ranges of working ages in order to mitigate the risk of labor resource shortage in the near future. People who have already retired at a young age or who are middle-aged/elderly retirees but still have sufficient physical capacity, skills, experience, and willingness to return-to-work should be encouraged to enter re-employment. Fourth, middle-aged and elderly employees usually face the problems of age-discrimination, declined physical status, and stereotyping within society. Therefore, the government should implement policies that include the prohibition of age-discrimination, provisions of job stabilization, and re-employment measures for the jobless, so as to raise the participation rate of middle-aged citizens. For the elderly workforce, the government should implement policies such as reducing restrictions through a Regular Contract for elderly citizens of more than 65 years old, subsidizing the employer who hires or re-employs elderly retirees, expanding the subsidy scope for employment facilitation, and establishing a human resource database of retirees. All these measures are expected to enhance re-employment for the elderly population. Fifth, as indicated by Bloom et al. [
14], to address the funding gap caused by the intergenerational transfers implicit pension systems is an important policy consideration. Pay-as-you-go pension systems mean that an increasingly small share of working-age people will make transfers to an increasingly large share of the elderly. Policies that can help reduce social burden include adjusting premiums and benefits or making a transition to full funded systems, whereby individuals effectively draw at least part of their pensions from investments made during their time in work. Coping with an aged society will require a concerted effort that includes comprehensive pension restructuring by the government, calculated savings and investment strategies by the aging and elderly, support from the working-age population, and coordinated measures from financial-planning industries. More education is needed on the importance of investment and savings for old age. Finally, improvements in the quality of elder healthcare and related social welfare programs must become an essential aspect of a national social security system. Policymakers should thoroughly review and develop policies that address the changing demographic needs.


