Perceptions of Pedestrian and Cyclist Environments, Travel Behaviors, and Social Networks

Abstract
1. Introduction
2. Literature Review
2.1. Psychological Background
2.2. Previous Studies
3. Research Focus and Conceptual Framework
4. Materials and Methods
4.1. Survey Description and Data Collection
4.2. Analysis and Measurements
Variables and Measurements
- Demographics and socio-economic characteristics
- Companions
- Built environment characteristics
- (a)
- Degree of transport sustainability. This indicator ranges from 1 to 6 and it is the sum of 3 equally weighted factors:
- -
- Public transport availability (=2 if the tram, metro or train station is located at less than 10 min walking distance; =1.5 if any of these stations is located between 10 and 20 min walking distance; =1.0 in cases where there is not rail transport available, but there is at least one bus stop within 10 min walking distance).
- -
- Bicycle infrastructure availability (=2 where bicycle lanes are safe, convenient and have continuity along the entire area; =1.5 if bicycle lanes are on or alongside main roads or where such lanes are almost nonexistent, but the low traffic flow allows for safe cycling; =1 if urban design is not convenient or safe for bicycles).
- -
- Pedestrian conditions (=2 if pedestrian areas are wide and connected or urban design is mainly focused on pedestrians; =1.5 if pedestrian areas are less connected or urban design purpose is mixed; =1 if urban structure is car-oriented and pedestrian facilities are poor).
- (b)
- Degree of centrality. This variable indicates how far the individual’s home is from the city center. It ranges from 1 to 5 (=1 if it is in an isolated or badly connected areas; =2 if it is in a metropolitan area farther than 15 km from the city center; =3 if it is in a metropolitan area up to 15 km from the city center; =4 if it is at the periphery of the city; and =5 if it is in the city center).
- Perceptions of the pedestrian and cycling-specific environments
5. Results
5.1. Sample Characteristics
5.2. Descriptive, Exploratory and Confirmatory Factor Analysis
5.3. Model Estimation and Results
5.3.1. Models 1a and 1b: Use of Private Vehicle (PV) during Weekends
5.3.2. Model 2: Use of Public Transport (PT) during Weekends
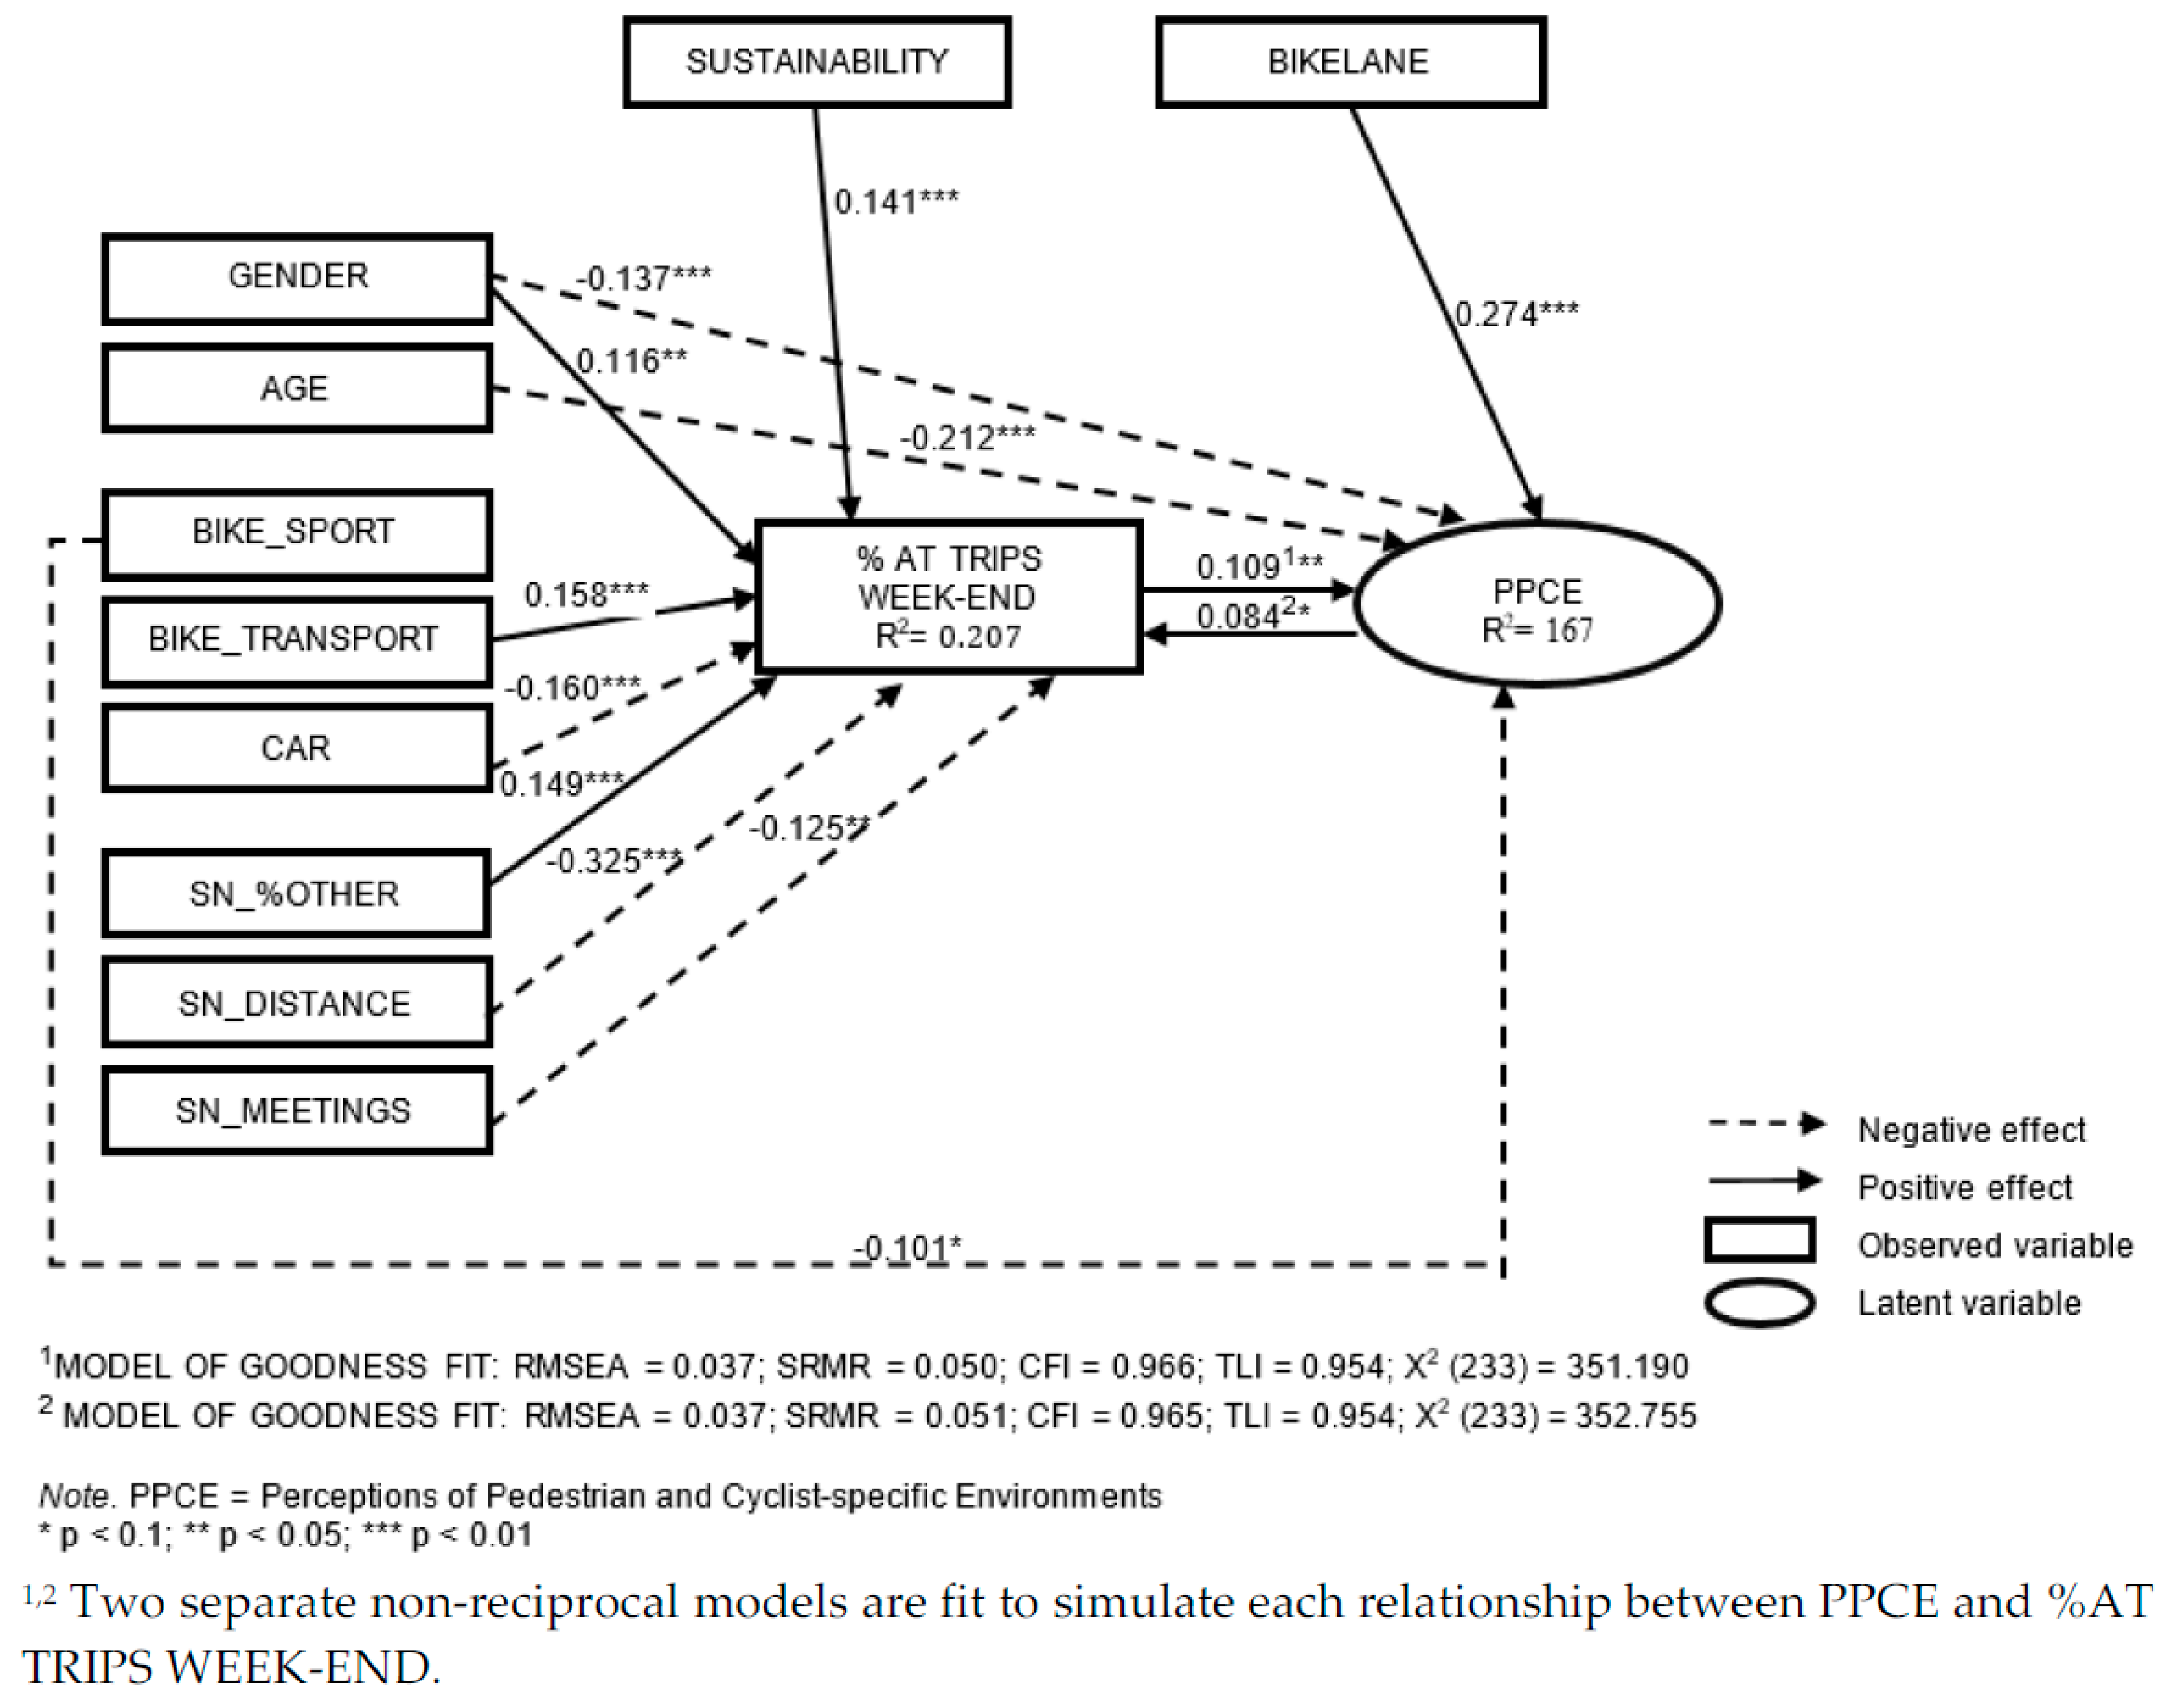
5.3.3. Models 3a and 3b: Use of Active Transport (AT) during Weekends
6. Discussion
6.1. Travel Behavior and the PPCE and the Disaggregated Perceptions
6.2. Social Networks and Perceptions
6.3. Built Environment, Sociodemographics, Travel Characteristics and Perceptions
6.4. Social Networks and Travel Behavior
6.5. Built Environment, Sociodemographics, Travel Characteristics and Travel Behavior
7. Conclusions
8. Ethical Code
Author Contributions
Funding
Conflicts of Interest
References
- Paulssen, M.; Temme, D.; Vij, A.; Walker, J.L. Values, attitudes and travel behavior: A hierarchical latent variable mixed logit model of travel mode choice. Transportation 2014, 41, 873–888. [Google Scholar] [CrossRef]
- Axhausen, K.W. Social factors in future travel: A qualitative assessment. IEE Proc. Intell. Transp. Syst. 2006, 153, 156–166. [Google Scholar] [CrossRef]
- Lindsay, P.H.; Norman, D.A. Human Information Processing; Academic Press: New York, NY, USA, 1977. [Google Scholar]
- Assael, H. Consumer Behavior and Marketing Action, 5th ed.; South Western College Publishing: Nashville, TN, USA, 1995. [Google Scholar]
- Sherif, M.; Cantril, H. The psychology of attitudes: I. Psychol. Rev. 1945, 52, 295–319. [Google Scholar] [CrossRef]
- Neumann, O. Beyond Capacity: A Functional View of Attention. In Perspectives on Perception and Action; Heuer, H., Sanders, A.F., Eds.; Erlbaum: Hillsdale, NJ, USA, 1987; pp. 361–394. [Google Scholar]
- Bronfenbrenner, U. Toward an experimental ecology of human development. Am. Psychol. 1977, 32, 513–531. [Google Scholar] [CrossRef]
- Bronfenbrenner, U. The Ecology of Human Development: Experiments by Nature and Design; Harvard University Press: Cambridge, UK, 1979. [Google Scholar]
- Bandura, A.; National Inst of Mental Health. Prentice-Hall Series in Social Learning Theory. Social Foundations of Thought and Action: A Social Cognitive Theory; Prentice-Hall: Englewood Cliffs, NJ, USA, 1986. [Google Scholar]
- Ajzen, I. From intentions to actions: A theory of planned behavior. In Action Control: From Cognition to Behavior; Kuhl, J., Beckmann, J., Eds.; Springer: Berlin/Heidelberg, Germany, 1985; pp. 11–39. [Google Scholar]
- Ajzen, I. The theory of planned behavior. Organ. Behav. Hum. Decis. Process. 1991, 50, 179–211. [Google Scholar] [CrossRef]
- Barton, B.K.; Kologi, S.M.; Siron, A. Distracted pedestrians in crosswalks: An application of the Theory of Planned Behavior. Transp. Res. Part F 2016, 37, 129–137. [Google Scholar] [CrossRef]
- Festinger, L. A Theory of Cognitive Dissonance; Stanford University Press: California, CA, USA, 1957. [Google Scholar]
- Hägerstrand, T. What about People in Regional Science? Pap. Reg. Sci. 1970, 24, 7–21. [Google Scholar] [CrossRef]
- Dill, J.; Voros, K. Factors affecting bicycling demand: Initial survey findings from the Portland, Oregon region. Transp. Res. Rec. 2007, 2031, 9–17. [Google Scholar] [CrossRef]
- Hull, A.; O’Holleran, C. Bicycle infrastructure: Can good design encourage cycling? Urban Plan. Transp. Res. 2014, 2, 369–406. [Google Scholar] [CrossRef]
- Ma, L.; Dill, J.; Mohr, C. The objective versus the perceived environment: What matters for bicycling? Transportation 2014, 41, 1135–1155. [Google Scholar] [CrossRef]
- Ma, L.; Cao, J. How perceptions mediate the effects of the built environment on travel behavior? Transportation 2017. [Google Scholar] [CrossRef]
- Miller, E.J.; Roorda, M.J. Prototype model of household activity-travel scheduling. Transp. Res. Rec. 2003, 1831, 114–121. [Google Scholar] [CrossRef]
- Habib, K.N.; Carrasco, J.A. Investigating the role of social networks in start time and duration of activities: A trivariate simultaneous econometric model. Transp. Res. Rec. 2011, 2230, 1–8. [Google Scholar] [CrossRef]
- Neutens, T.; Schwanen, T.; Miller, H.J. Dealing with timing and synchronization in opportunities for joint activity participation. Geogr. Anal. 2010, 42, 245–266. [Google Scholar] [CrossRef]
- Silvis, J.; Niemeier, D.; D’Souza, R. Social Networks and Travel Behavior: Report from an Integrated Travel Diary. Presented at the 11th International Conference on Travel Behavior Research, Kyoto, Japan, 16–20 August 2006. [Google Scholar]
- Van den Berg, P.E.W.; Arentze, T.A.; Timmermans, H.J.P. A path analysis of social networks, telecommunication and social activity-travel patterns. Transp. Res. Part C 2013, 26, 256–268. [Google Scholar] [CrossRef]
- Sandri, A.M.; Lee, S.; Ukkusuri, S.V. Modeling Social Network Influence on Joint Trip Frequency for Regular Activity Travel Decisions. Trans. Res. Rec. 2016, 2495, 83–93. [Google Scholar] [CrossRef]
- Arroyo, R.; Ruiz, T.; Mars, L.; Serna, A. Web-based survey to measuring social interactions, values and attitudes, and travel behavior. Presented at the 11th International Conference on Transport Survey Methods, Estérel, QC, Canada, 24–29 September 2017. [Google Scholar]
- Schwartz, S.H. Are there universal aspects in the structure and contents of human values? J. Soc. Issues 1994, 50, 19–45. [Google Scholar] [CrossRef]
- Field, A. Discovering Statistics Using SPSS for Windows; Sage publications: London, UK; Thousand Oaks, CA, USA; New Delhi, India, 2000. [Google Scholar]
- Rietveld, T.; Van Hout, R. Statistical Techniques for the Study of Language and Language Behaviour; Mouton de Gruyter: Berlin, Germany; New York, NY, USA, 1993. [Google Scholar]
- Child, D. The Essentials of Factor Analysis, 2nd ed.; Cassel Educational Limited: London, UK, 1990. [Google Scholar]
- Böcker, L.; Dijst, M.; Faber, J.W. Transport mode choices and emotional travel experiences. Transp. Res. Part A 2016, 94, 360–373. [Google Scholar] [CrossRef]
- Brende Lind, H.; Nordfjærn, T.; Halvard Jørgensen, S.; Rundmo, T. The value-belief-norm theory, personal norms and sustainable travel mode choice in urban areas. J. Environ. Psychol. 2015, 44, 119–125. [Google Scholar] [CrossRef]
- Dinga, C.; Wangb, D.; Liuc, C.; Zhangd, Y.; Yang, J. Exploring the influence of built environment on travel mode choice considering the mediating effects of car ownership and travel distance. Transp. Res. Part A 2017, 100, 65–80. [Google Scholar] [CrossRef]
- Sharmeena, F.; Arentze, T.; Timmermans, H. An analysis of the dynamics of activity and travel needs in response to social network evolution and life-cycle events: A structural equation model. Transp. Res. Part A 2014, 59, 159–171. [Google Scholar] [CrossRef]
- Tae-Hyoung, T.G. SEM application to the household travel survey on weekends versus weekdays: The case of Seoul, South Korea. Eur. Transp. Res. Rev. 2018, 10, 11. [Google Scholar] [CrossRef]
- Ye, R.; Titheridge, H. Satisfaction with the commute: The role of travel mode choice, built environment and attitudes. Transp. Res. Part D 2017, 52, 535–547. [Google Scholar] [CrossRef]
- Hox, J.J.; Bechger, T.M. An introduction to structural equation modeling. Fam. Sci. Rev. 1998, 11, 354–373. [Google Scholar]
- Yuan, K.-H.; Bentler, P.M. Three likelihood-based methods for mean and covariance structure analysis with nonnormal missing data. In Sociological Methodology; Sobel, M.E., Ed.; American Sociological Association: Washington, DC, USA, 2000; pp. 165–200. [Google Scholar]
- White, H. A heteroskedasticity-consistent covariance matrix estimator and a direct test for heteroskedasticity. Econometrics 1980, 48, 817–838. [Google Scholar] [CrossRef]
- Bollen, K.A. Structural Equations with Latent Variables; John Wiley and Sons, Inc.: New York, NY, USA, 1989. [Google Scholar]
- Hu, L.; Bentler, P.M. Cutoff criteria for fit indexes in covariance structure analysis: Conventional criteria versus new alternatives. Struct. Equ. Model. 1999, 6, 1–55. [Google Scholar] [CrossRef]
- Browne, M.; Cudeck, R. Alternative ways of assessing model fit. In Testing Structural Equation Models; Bollen, K., Long, S., Eds.; Sage: Newbury Park, NJ, USA, 1993. [Google Scholar]
- Vandenberg, R.J.; Lance, C.E. A review and synthesis of the measurement invariance literature: Suggestions, practices, and recommendations for organizational research. Org. Res. Methods 2000, 3, 4–69. [Google Scholar] [CrossRef]
- Kroesen, M.; Handy, S.; Chorus, C. Do attitudes cause behavior or vice versa? An alternative conceptualization of the attitude-behavior relationship in travel behavior modeling. Transp. Res. Part A Policy Prac. 2017, 101, 190–202. [Google Scholar] [CrossRef]
- De Vos, J.; Mokhtarian, P.L.; Schwanen, T.; Van Acker, V.; Witlox, F. Travel mode choice and travel satisfaction: Bridging the gap between decision utility and experienced utility. Transportation 2016, 43, 771–796. [Google Scholar] [CrossRef]
- Goldstein, E.B. Sensation and Perception, 8th ed.; Wadsworth: Pacific Grove, CA, USA, 2010. [Google Scholar]
- Ferrer, S.; Ruiz, T.; Mars, L. A qualitative study on the role of the built environment for short walking trips. Transp. Res. Part F 2015, 33, 141–160. [Google Scholar] [CrossRef]


| Variables | Description | Type |
|---|---|---|
| Demographics | ||
| Gender | 0 = male; 1 = female | Categorical |
| Age | Age of the respondent | Continuous |
| Transport Pass | 1 = respondent has an integrated public transport pass; 0 = otherwise | Categorical |
| Car | Car availability (0 = low to 5 = high) | Continuous |
| Bike | Bicycle availability (0 = low to 5 = high) | Continuous |
| Motorbike | Motorbike availability (0 = low to 5 = high) | Continuous |
| Bikes in HH | Number of bicycles available in the household | Continuous |
| Cars in HH | Number of cars available in the household | Continuous |
| Marital status | 1 = single; 2 = married; 3 = civil partner; 4 = couple; 5 = widow; 6 = divorced; 7 = other | Categorical |
| Education level | 1 = no studies; 2 = primary level; 3 = vocational training; 4 = secondary level; 5–6 = higher education; 7 = university degree or higher | Categorical |
| Occupation | 1 = student only; 2 = employed; 3 = self-employed; 4 = student and employed; 5 = unemployed; 6 = retired; 7 = housekeeper; 8 = other | Categorical |
| Income | 1 = any income; 2 = less than 500 €; 3 = 500–1000 €; 4 = 1000–1500 €; 5 = 1500–2000 €; 6 = 2000–2500 €; 7 = 2500–3000 €; 8 = more than 3000 € (net monthly) | Categorical |
| Bicycle Use | ||
| Bike transport | 1 = bicycle used mainly for travel; 0 = otherwise | Categorical |
| Bike sport | 1 = bicycle used mainly for sport; 0 = otherwise | Categorical |
| Built Environment and Accessibility | ||
| Bike lane | 1 = bicycle lane available in the respondent’s residence area; 0 = otherwise | Categorical |
| Centrality | Degree of centrality of the respondent’s residence area. (See indicator definition) | Continuous |
| Sustainability | Degree of transport sustainability of the respondent’s residence area. (See indicator definition) | Continuous |
| Metro | Walking distance to the closest metro station: 1 = less than 5 min; 2 = 5–10 min; 3 = 10–15 min; 4 = 15–20 min; 5 = 20–30 min; 6 = more than 30 min | Categorical |
| Bus | Distance to the closest bus stop: 1 = less than 5 min; 2 = 5–10 min; 3 = 10–15 min; 4 = 15–20 min; 5 = 20–30 min; 6 = more than 30 min | Categorical |
| Companions | ||
| SN size | Number of companions | Continuous |
| SN %male | Percentage of males in the companions | Continuous |
| SN %family | Percentage of family members companions | Continuous |
| SN %other | Percentage of not family members companions | Continuous |
| SN distance | Average distance of residence between the respondent and his/her companions | Continuous |
| SN meetings | Frequency of face-to-face meeting with companions | Continuous |
| SN age | Average age of companions | Continuous |
| SN connectivity | Connection degree among companions (0 = low to 5 = high) | Continuous |
| HH minors | Number of persons under 18 living in the household | Continuous |
| HH members | Number of people living in the household | Continuous |
| SN influence | Average degree of influence of companions in the ego’s mobility | Continuous |
| Respondents | Percentage | |
|---|---|---|
| Gender | ||
| Male | 182 | 45.1% |
| Female | 222 | 54.9% |
| Age | ||
| 16–25 | 144 | 35.6% |
| 26–35 | 100 | 24.7% |
| 36–50 | 102 | 25.2% |
| >50 | 58 | 14.3% |
| Occupation | ||
| Student only | 141 | 34.9% |
| Employed | 188 | 46.5% |
| Student & employed | 40 | 9.9% |
| Unemployed | 19 | 4.7% |
| Retired | 7 | 1.7% |
| Other | 9 | 2.2% |
| Trips | Trips/Person | Trips/Person-Day | Percentage | |
|---|---|---|---|---|
| Modal Split | ||||
| Private Vehicle | 1132 | 2.802 | 1.401 | 35.62% |
| Public Transport | 372 | 0.921 | 0.460 | 11.71% |
| Cycling | 217 | 0.537 | 0.269 | 6.83% |
| Walking | 1437 | 3.557 | 1.778 | 45.22% |
| Other | 20 | 0.050 | 0.025 | 0.63% |
| Companions | ||||
| Trips with companions | 1453 | 3.60 | 1.80 | 45.72% |
| Solo trips | 1725 | 4.27 | 2.13 | 54.28% |
| Total | ||||
| 3178 | 7.87 | 3.93 | 100% | |
| Statistic | EFA | CFA | |||||
|---|---|---|---|---|---|---|---|
| Variable | Item | Mean | SD | Median | Mode | Factor Loading | STDYX Standardized Loadings (S.E.) |
| Perception of Sidewalks | |||||||
| A111 | Width and length are appropriate | 3.67 | 1.19 | 4 | 4 | 0.751 | 0.733 (0.030) |
| A114 | Maintenance conditions are good | 3.53 | 1.18 | 4 | 4 | 0.811 | 0.806 (0.031) |
| A117 | They are free of any obstacle | 3.12 | 1.30 | 3 | 4 | 0.721 | 0.714 (0.034) |
| A123 | Urban furniture is appropriate | 3.50 | 1.18 | 4 | 4 | 0.684 | 0.695 (0.037) |
| Perception of Bicycle Pahts | |||||||
| A112 | Width and length are appropriate | 2.92 | 1.37 | 3 | 2 | 0.846 | 0.804 (0.022) |
| A115 | Maintenance conditions are good | 3.26 | 1.32 | 3 | 4 | 0.835 | 0.861 (0.022) |
| A118 | They are free of any obstacle | 3.15 | 1.34 | 3 | 4 | 0.747 | 0.770 (0.029) |
| A124 | Urban furniture is appropriate | 3.12 | 1.32 | 3 | 4 | 0.749 | 0.749 (0.031) |
| A126 | They are placed conveniently | 2.94 | 1.34 | 3 | 4 | 0.794 | 0.790 (0.028) |
| A129 | They have sufficient continuity | 2.73 | 1.41 | 3 | 1 | 0.815 | 0.784 (0.026) |
| Perception of Pedestrian Crossings | |||||||
| A113 | Width and length are appropriate | 3.85 | 1.03 | 4 | 4 | 0.691 | 0.716 (0.032) |
| A116 | Maintenance conditions are good | 3.70 | 1.06 | 4 | 4 | 0.764 | 0.807 (0.025) |
| A119 | They are free of any obstacle | 3.78 | 1.13 | 4 | 4 | 0.699 | 0.684 (0.039) |
| A125 | Urban furniture is appropriate | 3.67 | 1.07 | 4 | 4 | 0.773 | 0.726 (0.032) |
| A127 | They are placed conveniently | 3.70 | 1.07 | 4 | 4 | 0.762 | 0.731 (0.033) |
| A128 | Traffic light scheduling is adequate | 3.57 | 1.19 | 4 | 4 | 0.644 | 0.651 (0.041) |
| Correlations—Disaggregated Perceptions | |||||||
| Bicycle paths WITH Sidewalks | 0.618 (0.045) | ||||||
| Pedestrian crossings WITH Sidewalks | 0.837 (0.028) | ||||||
| Pedestrian crossings WITH Bicycle paths | 0.711 (0.035) | ||||||
© 2018 by the authors. Licensee MDPI, Basel, Switzerland. This article is an open access article distributed under the terms and conditions of the Creative Commons Attribution (CC BY) license (http://creativecommons.org/licenses/by/4.0/).
Share and Cite
Arroyo, R.; Mars, L.; Ruiz, T. Perceptions of Pedestrian and Cyclist Environments, Travel Behaviors, and Social Networks. Sustainability 2018, 10, 3241. https://doi.org/10.3390/su10093241
Arroyo R, Mars L, Ruiz T. Perceptions of Pedestrian and Cyclist Environments, Travel Behaviors, and Social Networks. Sustainability. 2018; 10(9):3241. https://doi.org/10.3390/su10093241
Chicago/Turabian StyleArroyo, Rosa, Lidón Mars, and Tomás Ruiz. 2018. "Perceptions of Pedestrian and Cyclist Environments, Travel Behaviors, and Social Networks" Sustainability 10, no. 9: 3241. https://doi.org/10.3390/su10093241
APA StyleArroyo, R., Mars, L., & Ruiz, T. (2018). Perceptions of Pedestrian and Cyclist Environments, Travel Behaviors, and Social Networks. Sustainability, 10(9), 3241. https://doi.org/10.3390/su10093241