Impact of Population Aging on Carbon Emission in China: A Panel Data Analysis


Abstract
1. Introduction
2. Influencing Factors Analysisof Carbon Emission
3. Materials and Methods
3.1. The Model
3.2. Data Source
3.3. Model Test
3.4. Model Estimation
4. Results and Discussion
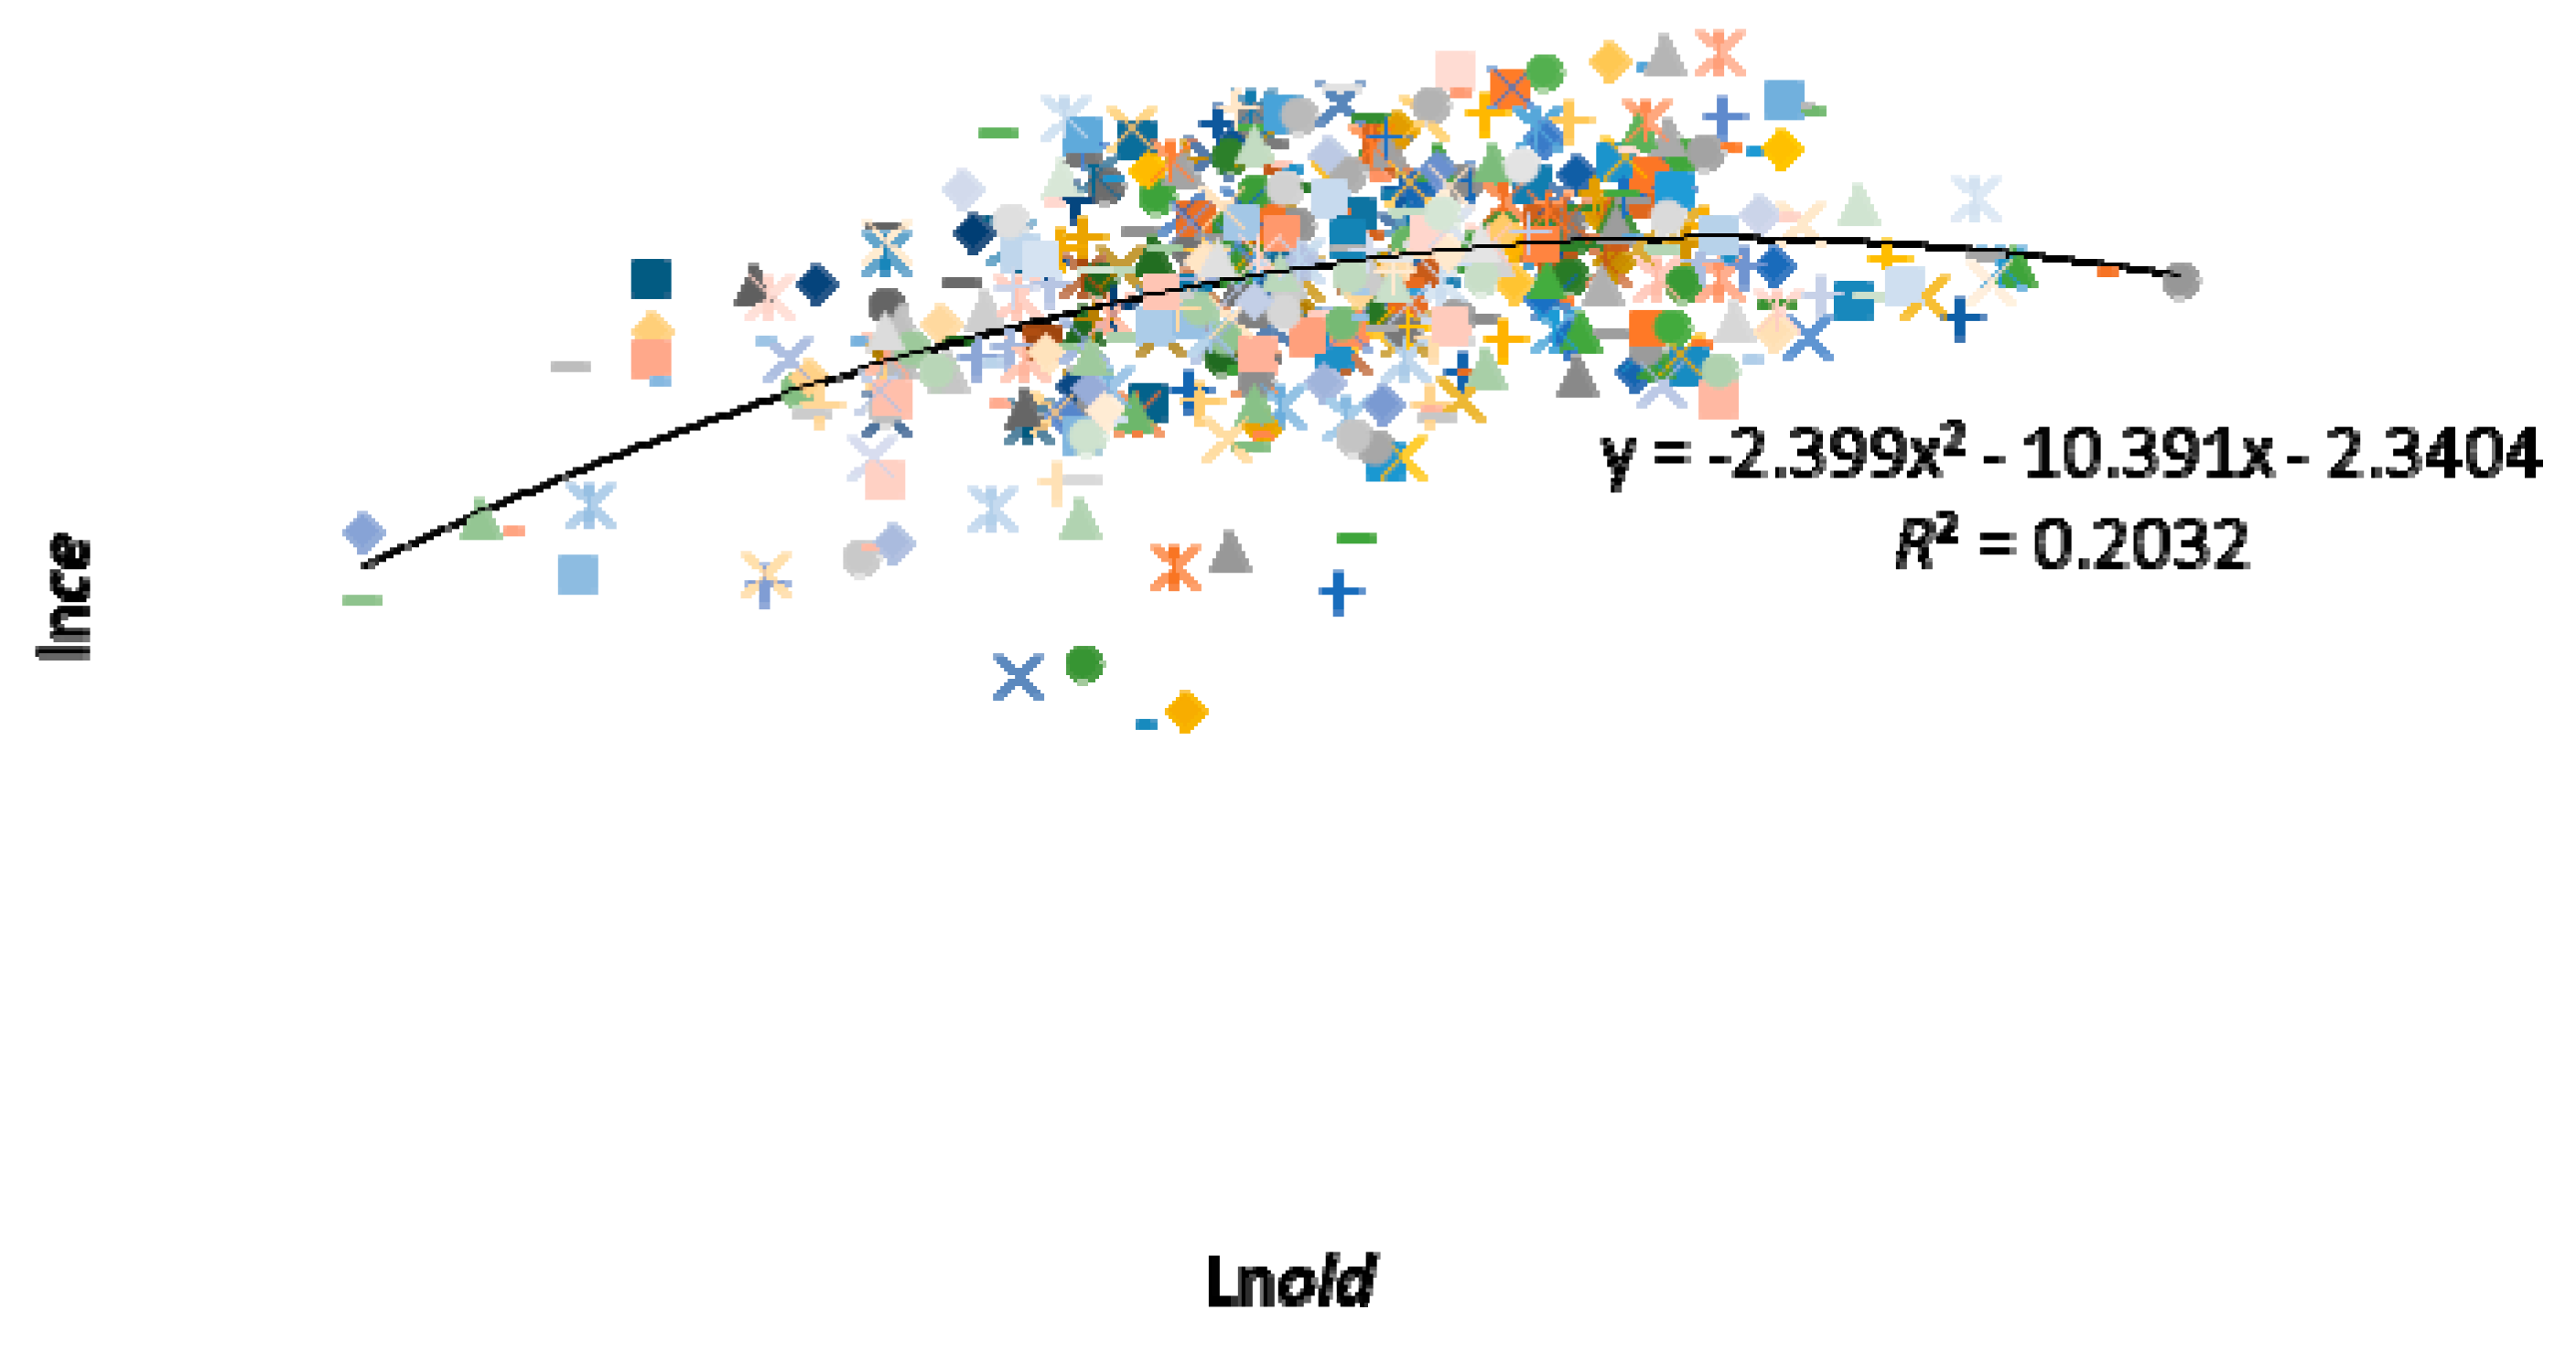
4.1. Results and Discussion about Models for China
4.2. Results and Discussion about Models for Different Regions
5. Conclusions
Author Contributions
Funding
Acknowledgments
Conflicts of Interest
References
- IPCC. Fifth Assessment Report (AR5). Available online: http://www.ipcc.ch/report/ar5/index.shtml (accessed on 18 January 2018).
- Peters, G.P.; Andrew, R.M.; Boden, T.; Canadell, J.G.; Ciais, P.; Le Quéré, C.; Marland, G.; Raupach, M.R.; Wilson, C. The challenge to keep global warming below 2 °C. Nat. Clim. Chang. 2012, 3, 4–6. [Google Scholar] [CrossRef]
- Data Source. Available online: http://www.globalcarbonatlas.org/en/CO2-emissions (accessed on 19 January 2018).
- NRDC PRC. National Plan for Addressing Climate Change (2014–2020). Available online: http://www.ndrc.gov.cn/gzdt/201411/t20141104_643314.html (accessed on 19 January 2018).
- Data Source. Available online: http://www.stats.gov.cn/tjsj/ndsj/ (accessed on 20 January 2018).
- Shao, W.; Wu, D.; Fang, L.; Tong, A.; Li, W. China Report of the Development on Siliver Industry (2014); Social Sciences Academic Press: Beijing, China, 2014; pp. 10–15. ISBN 978-7-5097-6281-3. [Google Scholar]
- United Nations Population Fund. The State of World Population. 2009. Available online: https://www.unfpa.org/publications/state-world-population-2009 (accessed on 19 January 2018).
- Dalton, M.; O’Neill, B.; Prskawetz, A.; Jiang, L.; Pitkin, J. Population aging and future carbon emissions in the United States. Energy Econ. 2008, 30, 642–675. [Google Scholar] [CrossRef]
- Grossman, G.M.; Krueger, A.B. Economic growth and the environment. Q. J. Econ. 1997, 110, 353–377. [Google Scholar] [CrossRef]
- Stern, N. Stern Review on the Economics of Climate Change; Cambridge University Press: Cambridge, UK, 2007; pp. 5–10. [Google Scholar]
- Yeh, J.-C.; Liao, C.-H. Impact of population and economic growth on carbon emissions in Taiwan using an analytic tool STIRPAT. Sustain. Environ. Res. 2017, 27, 41–48. [Google Scholar] [CrossRef]
- Zhang, C.; Tan, Z. The relationships between population factors and China’s carbon emissions: Does population aging matter? Renew. Sustain. Energy Rev. 2016, 65, 1018–1025. [Google Scholar] [CrossRef]
- Menz, T.; Welsch, H. Population aging and carbon emissions in OECD countries: Accounting for life-cycle and cohort effects. Energy Econ. 2012, 34, 842–849. [Google Scholar] [CrossRef]
- Shi, A. The impact of population pressure on global carbon dioxide emissions, 1975–1996: Evidence from pooled cross-country data. Ecol. Econ. 2003, 44, 29–42. [Google Scholar]
- Kronenberg, T. The impact of demographic change on energy use and greenhouse gas emissions in Germany. Ecol. Econ. 2009, 68, 2637–2645. [Google Scholar] [CrossRef]
- Wang, X.; Liu, G. Gansu Province in population size and structure impact on carbon emissions: An Empirical Analysis Based on the extended STIRPAT model. J. Lanzhou Univ. Soc. Sci. Ed. 2014, 1, 127–132. [Google Scholar]
- Lugauer, S.; Mark, N.C. The Role of Household Saving in the Economic Rise of China. In Global Interdependence, Decoupling and Recoupling; CES-ifo Seminar Series; MIT Press: Cambridge, MA, USA, 2013. [Google Scholar]
- Lugauer, S.; Ni, J.; Yin, Z. Chinese household saving and dependent children: Theory and evidence. China Econ. Rev. 2017, in press. [Google Scholar] [CrossRef]
- Lugauer, S.; Jensen, R.; Sadler, C. An estimate of the age distribution’s effect on carbon dioxide emissions. Econ. Inq. 2014, 52, 914–929. [Google Scholar] [CrossRef]
- Ma, X.; Li, Q.; Guo, Y. Effects of population factors on carbon dioxide emissions in China: Based on STIRPAT model. Popul. Econ. 2013, 1, 44–51. [Google Scholar]
- Qu, R.; Quan, J. Effects of population size and structure of regional carbon emissions—Based on the experience of China’s provincial panel data analysis. Popul. Econ. 2012, 2, 10–17. [Google Scholar]
- Zagheni, E. The leverage of demographic dynamics on carbon dioxide emissions: Does age structure matter? Demography 2011, 48, 371–399. [Google Scholar] [CrossRef] [PubMed]
- Duan, H.; Liu, H.; Wang, X. Population factors in the process of industrialization in Japan on carbon emissions. J. Popul. Stud. 2012, 5, 39–48. [Google Scholar]
- Zhu, Q.; Peng, X. The impacts of population change on carbon emissions in China during 1978–2008. Environ. Impact Assess. Rev. 2012, 36, 1–8. [Google Scholar] [CrossRef]
- Liddle, B.; Lung, S. Age-structure, urbanization and climate change in developed countries: Revisiting STIRPAT for disaggregated population and consumption-related environmental impacts. Popul. Environ. 2010, 31, 317–343. [Google Scholar] [CrossRef]
- Jian, Z.; Wang, S.; Gao, Q.; Zhang, X. Study on the relationship between population characteristics, economic growth and carbon emission. J. Wuhan Univ. Philos. Soc. Sci. Ed. 2015, 2, 94–101. [Google Scholar]
- Li, F. Aging, urbanization and carbon emissions—Based on the study of China’s provincial dynamic panel 1995–2012. Popul. Econ. 2015, 4, 9–18. [Google Scholar]
- Wang, F.; Zhou, X. Population structure, urbanization and carbon emissions: An Empirical Study Based on Transnational panel data. China’s Popul. Sci. 2012, 2, 47–56. [Google Scholar]
- Xu, Q.; Dong, Y.; Yang, R. Urbanization impact on carbon emissions in the Pearl River Delta region: Kuznets curve relationships. J. Clean. Prod. 2018, 180, 514–523. [Google Scholar] [CrossRef]
- Zhang, N.; Yu, K.; Chen, Z. How does urbanization affect carbon dioxide emissions? A cross-country panel data analysis. Energy Policy 2017, 107, 678–687. [Google Scholar] [CrossRef]
- Zhao, Y.B.; Wang, S.J. The relationship between urbanization, economic growth and energy consumption in China: An econometric perspective analysis. Sustainability 2015, 7, 5609–5627. [Google Scholar] [CrossRef]
- Fan, Y.; Liu, L.C.; Wu, G.; Wei, Y.M. Analyzing impact factors of CO2: Emissions using the STIRPAT model. Environ. Impact Assess. Rev. 2006, 26, 377–395. [Google Scholar] [CrossRef]
- Ehrlich, P.R.; Holden, J.P. Impact of population growth. Science 1971, 3977, 1212–1217. [Google Scholar] [CrossRef]
- Dietz, T.; Rosa, E. Rethinking the environmental impacts of population, affluence and technology. Hum. Ecol. Rev. 1994, 1, 277–300. [Google Scholar]
- Mi, Z.; Meng, J.; Green, F.; Coffman, D.M.; Guan, D. China’s “exported carbon” peak: Patterns, drivers and implications. Geophys. Res. Lett. 2018, 45, 4309–4318. [Google Scholar] [CrossRef]
- Mi, Z.; Meng, J.; Guan, D.; Shan, Y.; Liu, Z.; Wang, Y.; Feng, K.; Wei, Y. Pattern changes in determinants of Chinese emissions. Environ. Res. Lett. 2017, 12, 074003. [Google Scholar] [CrossRef]
- Mi, Z.; Meng, J.; Guan, D.; Shan, Y.; Song, M.; Weik, Y.; Liu, Z.; Hubacek, K. Chinese CO2 emission flows have reversed since the global financial crisis. Nat. Commun. 2017, 8, 1712. [Google Scholar] [CrossRef] [PubMed]
- York, R. Demographic trends and energy consumption in European Union Nations 1960–2025. Soc. Sci. Res. 2007, 36, 855–872. [Google Scholar] [CrossRef]
- Du, B.; Wang, X. Analysis of evolution, regional differences and influencing factors of health inequality among the elderly. Popul. Res. 2013, 37, 81–90. [Google Scholar]
- Nie, G.; Huang, M. Empirical research on the relationship between population aging and residents’ consumption level based on provincial panel data in China. Consum. Econ. 2015, 2, 19–23. [Google Scholar]
- Li, Y.; Fu, R. Why eastern industries do not move to the west: An explanation based on the theory of spatial economy. J. World Econ. 2010, 8, 59–71. [Google Scholar]
- Yang, B.; Liu, C.; Su, Y.; Jing, X. The Allocation of Carbon Intensity Reduction Target by 2020 among Industrial Sectors in China. Sustainability 2017, 9, 148. [Google Scholar] [CrossRef]
- Wang, F.; Wang, C.; Su, Y.; Jin, L.; Wang, Y.; Zhang, X. Decomposition analysis of carbon emission factors from energy consumption in Guangdong province from 1990 to 2014. Sustainability 2017, 9, 274. [Google Scholar] [CrossRef]


| Energy Type | Standard Coal Coefficient (kg Standard Coal) | Carbon Emission Coefficient (t Carbon/tce) |
|---|---|---|
| Coal (kg) | 0.7143 | 0.7467 |
| Diesel (kg) | 1.4571 | 0.5913 |
| Gasoline (kg) | 1.4714 | 0.5532 |
| Kerosene (kg) | 1.4714 | 0.3416 |
| Crude oil (kg) | 1.4286 | 0.5854 |
| Fuel oil (kg) | 1.4286 | 0.6176 |
| Coke (kg) | 0.9714 | 0.1128 |
| Natural gas (m3) | 1.3300 | 0.4479 |
| Region | Variable | LLC Test | ADF-Fisher Test | 1st Difference | LLC Test | Fisher-ADFTest |
|---|---|---|---|---|---|---|
| Nation | LnC | −2.27 (0.01) | 29.27 (1.0) | dlnC | −15.33 (0.00) | 232.90 (0.00) |
| lnP | −2.99 (0.00) | 92.52 (0.00) | dlnP | −43.23 (0.00) | 339.65 (0.00) | |
| lnA | 4.30 (1.00) | 2.86 (1.00) | dlnA | −16.88 (0.00) | 167.63 (0.00) | |
| lnold | −6.50 (0.00) | 74.79 (0.09) | dlnold | −20.99 (0.00) | 341.65 (0.00) | |
| (lnold)2 | −7.02 (0.00) | 80.32 (0.04) | d(lnold)2 | −21.45 (0.00) | 349.81 (0.00) | |
| lnen | 3.34 (1.00) | 10.17 (1.00) | dlnen | −13.73 (0.00) | 222.20 (1.00) | |
| lnerchan | −3.61 (0.00) | 50.56 (0.80) | dlnerchan | −9.0 (0.00) | 143.66 (0.00) | |
| lnur | −6.08 (0.00) | 86.11 (0.02) | dlnur | −43.48 (0.00) | 284.97 (0.00) | |
| old | −4.96 (0.00) | 66.57 (0.26) | d(old) | −18.73 (0.00) | 316.79 (0.00) | |
| old2 | −3.48 (0.00) | 58.67 (0.57) | d(old)2 | −17.40 (0.00) | 307.94 (0.00) | |
| east | lnC | −3.91 (0.00) | 15.64 (0.90) | dlnC | −9.69 (0.00) | 92.93 (0.00) |
| lnP | −1.24 (0.11) | 20.99 (0.64) | dlnP | −41.96 (0.00) | 157.06 (0.00) | |
| lnA | 2.72 (0.99) | 0.86 (1.00) | dlnA | −12.31 (0.00) | 120.37 (0.00) | |
| lnold | −3.61 (0.00) | 39.40 (0.02) | d(old) | −11.63 (0.00) | 122.43 (0.00) | |
| lnen | 2.10 (0.98) | 4.28 (1.00) | dlnen | −9.05 (0.00) | 94.28 (0.00) | |
| lnerchan | −1.66 (0.05) | 18.65 (0.77) | dlnerchan | −5.31 (0.00) | 55.50 (0.00) | |
| lnur | −2.04 (0.02) | 14.17 (0.94) | dlnur | −12.97 (0.00) | 115.18 (0.00) | |
| Centre | lnC | −0.19 (0.42) | 3.86 (0.99) | dlnC | −7.51 (0.00) | 58.11 (0.00) |
| lnP | −4.82 (0.00) | 56.98 (0.00) | dlnP | −39.81 (0.00) | 107.37 (0.00) | |
| lnA | 1.25 (0.89) | 1.60 (1.00) | dlnA | −8.83 (0.00) | 79.05 (0.00) | |
| lnold | −3.12 (0.00) | 16.38 (0.57) | d(old) | −11.99 (0.00) | 107.18 (0.00) | |
| lnen | 3.30 (0.99) | 0.38 (1.00) | dlnen | −6.90 (0.00) | 63.26 (0.00) | |
| lnerchan | −1.56 (0.06) | 10.80 (0.90) | dlnerchan | −3.75 (0.00) | 32.66 (0.01) | |
| lnur | −5.44 (0.00) | 30.09 (0.04) | dlnur | −12.81 (0.00) | 89.31 (0.00) | |
| West | lnC | 0.31 (0.62) | 9.77 (0.94) | dlnC | −9.18 (0.00) | 81.86 (0.00) |
| lnP | −0.19 (0.43) | 14.55 (0.69) | dlnP | −5.28 (0.00) | 75.21 (0.00) | |
| lnA | 3.76 (0.99) | 0.39 (1.00) | dlnA | −7.34 (0.00) | 68.21 (0.00) | |
| lnold | −4.61 (0.00) | 19.01 (0.39) | d(old) | −12.85 (0.00) | 112.01 (0.00) | |
| lnen | 0.26 (0.60) | 5.51 (0.99) | dlnen | −7.42 (0.00) | 64.66 (0.00) | |
| lnerchan | −3.28 (0.00) | 21.11 (0.27) | dlnerchan | −6.23 (0.00) | 55.49 (0.00) | |
| lnur | −2.98 (0.00) | 41.85 (0.00) | dlnur | −39.62 (0.00) | 80.48 (0.00) |
| Nation | East | Centre | West | ||
|---|---|---|---|---|---|
| Model 4 | Model 5 | Model 4 | Model 4 | Model 4 | |
| ADF p value | −7.49 *** (0.00) | −7.69 *** (0.00) | −6.31 *** (0.00) | −4.22 *** (0.00) | −4.26 *** (0.00) |
| Model 4 | Model 5 | Eastern | Central | Western | |
|---|---|---|---|---|---|
| Constant | −11.114 *** (−105.84) | −12.128 *** (−74.96) | −11.684 *** (−93.91) | −14.022 *** (−35.87) | −14.679 *** (−68.10) |
| lnoldit | 0.171 *** (16.68) | −0.738 *** (−6.36) | 0.411 *** (25.06) | −0.285 *** (−6.33) | −0.207 *** (−5.86) |
| (lnoldit)2 | −0.183 *** (−7.72) | ||||
| lnPit | 0.941 *** (230.74) | 0.934 *** (181.72) | 0.896 *** (168.12) | 0.909 *** (60.52) | 0.948 *** (75.50) |
| lnuit | 0.619 *** (57.33) | 0.625 *** (63.74) | 0.149 *** (10.28) | 0.419 *** (14.55) | 0.396 *** (7.23) |
| lnAit | 1.184 *** (155.38) | 1.179 *** (159.26) | 1.301 *** (168.12) | 1.379 *** (63.66) | 1.436 *** (83.46) |
| lnenit | 1.013 *** (162.59) | 1.016 *** (188.04) | 1.066 *** (176.33) | 1.071 *** (85.86) | 1.036 *** (53.66) |
| lnerchanit | 0.569 *** (83.35) | 0.574 *** (50.68) | 0.493 *** (48.91) | 0.552 *** (14.44) | 0.773 *** (16.83) |
| n | 480 | 480 | 192 | 144 | 144 |
| Hausman test p value | 0.13 | 0.29 | 0.48 | 0.65 | 0.21 |
| Heteroscedasticity test | 0.00 | 0.00 | 0.00 | 0.00 | 0.00 |
| Serial correlation test | 0.00 | 0.00 | 0.00 | 0.00 | 0.00 |
| Estimation method | FGLS | FGLS | FGLS | FGLS | FGLS |
| R2 | 0.925 | 0.924 | 0.960 | 0.957 | 0.952 |
© 2018 by the authors. Licensee MDPI, Basel, Switzerland. This article is an open access article distributed under the terms and conditions of the Creative Commons Attribution (CC BY) license (http://creativecommons.org/licenses/by/4.0/).
Share and Cite
Li, W.; Qi, X.; Zhao, X. Impact of Population Aging on Carbon Emission in China: A Panel Data Analysis. Sustainability 2018, 10, 2458. https://doi.org/10.3390/su10072458
Li W, Qi X, Zhao X. Impact of Population Aging on Carbon Emission in China: A Panel Data Analysis. Sustainability. 2018; 10(7):2458. https://doi.org/10.3390/su10072458
Chicago/Turabian StyleLi, Weidong, Xin Qi, and Xiaojun Zhao. 2018. "Impact of Population Aging on Carbon Emission in China: A Panel Data Analysis" Sustainability 10, no. 7: 2458. https://doi.org/10.3390/su10072458
APA StyleLi, W., Qi, X., & Zhao, X. (2018). Impact of Population Aging on Carbon Emission in China: A Panel Data Analysis. Sustainability, 10(7), 2458. https://doi.org/10.3390/su10072458