The Mediating Role of Perception in the Relationship between Expectation and Satisfaction in Terms of Sustainability in Tourism Education


Abstract
1. Introduction
2. Literature Review
2.1. Sustainability in Tourism Education
2.2. Expectations, Perceptions, and Satisfaction
3. Methodology
3.1. Purpose of the Research
3.2. Data Collection
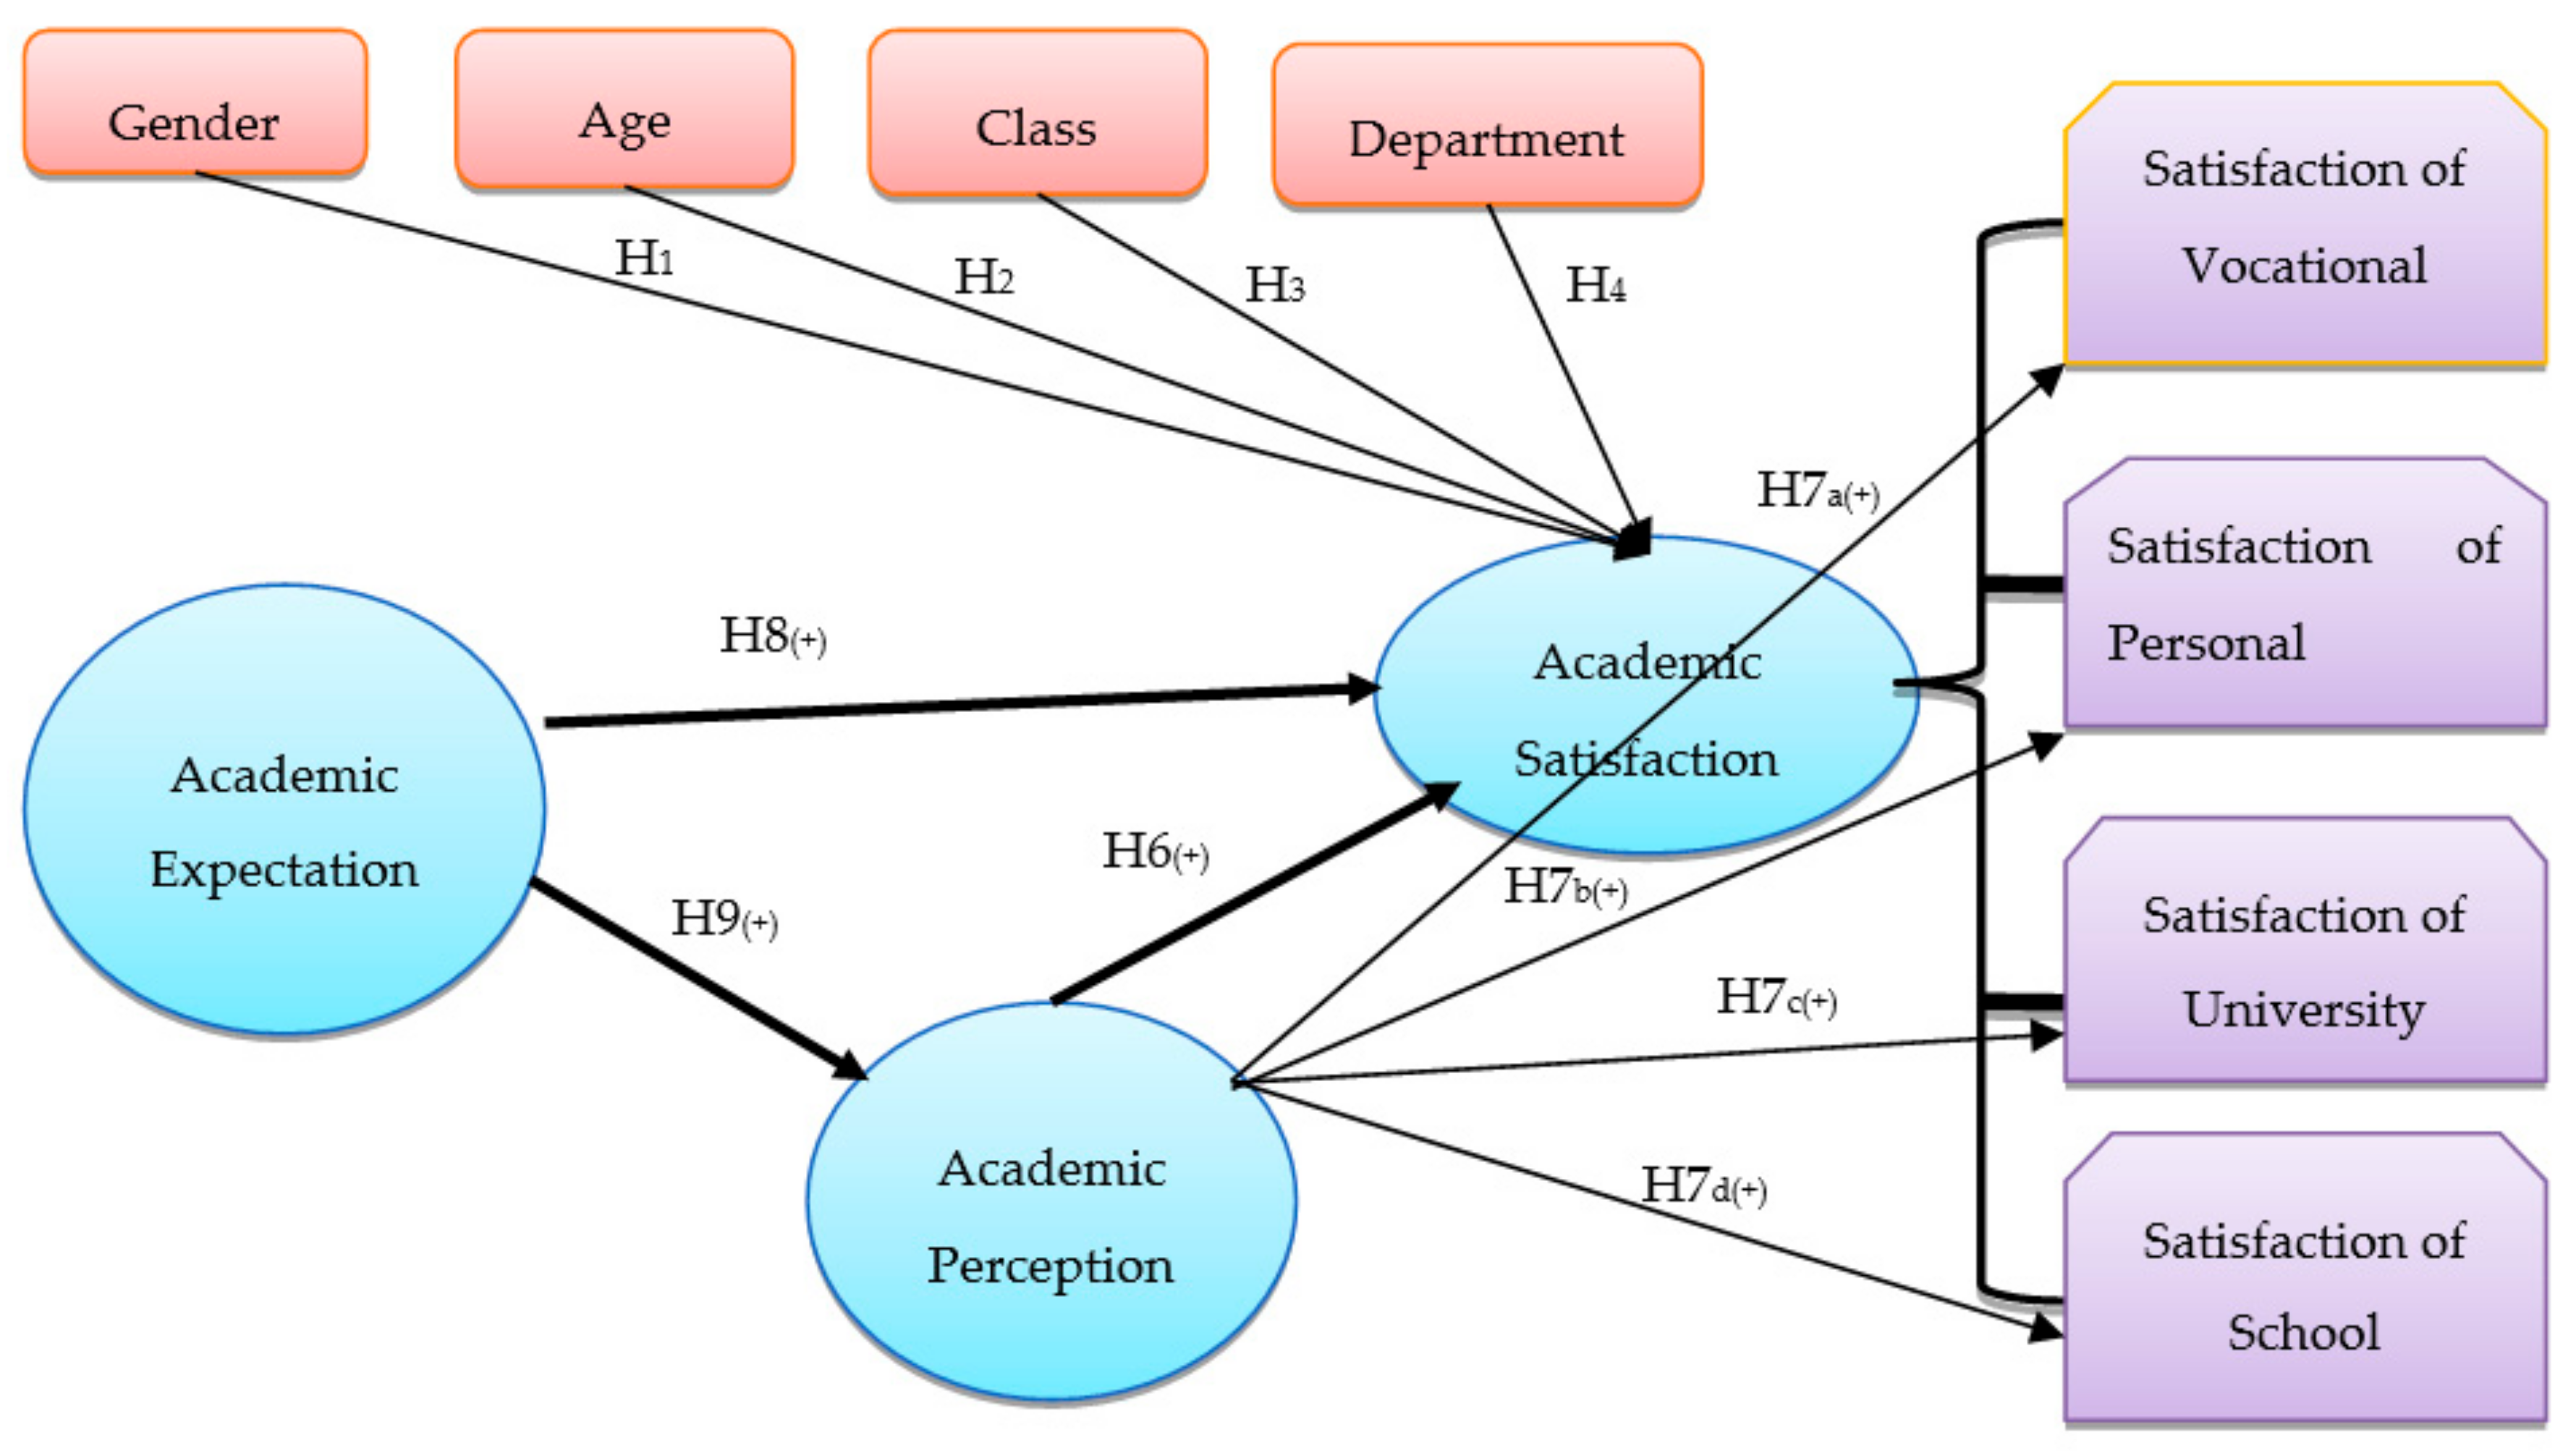
3.3. Research Model
3.4. Data Analysis
4. Findings
4.1. Validity and Reliability Findings
4.2. Factor Analysis for the Satisfaction of Academic Education and Scale Validation Findings
4.3. Findings Concerning Personal Information
4.4. Findings Regarding the Research Hypotheses
4.4.1. The Difference in Satisfaction of Academic Education Based on Gender
4.4.2. The Difference in Satisfaction of Academic Education Based on Age
4.4.3. The Difference in Satisfaction of Academic Education Based on Class
4.4.4. The Difference in Satisfaction of Academic Education Based on Departments
4.4.5. The Relationship between Expectation, Perception, and Satisfaction of Academic Education
4.4.6. The Impact of Perception of Tourism Education on Satisfaction and Its Dimensions of Satisfaction of Academic Education
4.4.7. Regression Analysis of the Mediating Role of Perception in the Relationship between Expectation and Satisfaction
5. Results, Conclusions, and Recommendations
Author Contributions
Funding
Conflicts of Interest
References
- Keung, S.W. Tourist’s perception of hotel frontline employees’ questionable job-related behavior. Tour. Manag. 2000, 21, 121–134. [Google Scholar] [CrossRef]
- Sem, J.; Clements, C.; Bloomquist, P. Tourism and recreation management: Strategies for public lands. Parks Recreat. 1996, 31, 92–104. [Google Scholar]
- Christou, E. Hospitality management education in Greece: An exploratory study. Tour. Manag. 1999, 20, 683–691. [Google Scholar] [CrossRef]
- Alp, T. Türkiye’de Turizm Eğitimin Yapısı, Uygulanan Politikalar ve Sonuçları; Turizm Eğitimi, Turizm Bakanlığı Turizm Eğitimi Genel Müdürlüğü, Yorum Basım Yayın Sanayi Ticaret Şirketi: Ankara, Turkey, 1992. [Google Scholar]
- Ünlüönen, K.; Boylu, Y. Türkiye’de yüksek öğretim düzeyinde turizm eğitimindeki gelişmelerin değerlendirilmesi. Elektron. Sos. Bilim. Derg. 2005, 3, 11–32. [Google Scholar]
- Amoah, V.A.; Baum, T. Tourism education: Policy versus practice. Int. J. Contemp. Hosp. Manag. 1997, 9, 5–12. [Google Scholar] [CrossRef]
- UN-WTO (World Tourism Organization). Tourism Highlights. 2017. Available online: www.e-unwto.org/doi/pdf/10.18111/9789284419029 (accessed on 7 March 2018).
- Johnson, R. Putting the eco into tourism. Asia Mag. 1998, 36, 8–12. [Google Scholar]
- Center for Sustainable Tourism. Sustainable Tourism. 2012. Available online: www.ecu.edu/sustainabletourism/ (accessed on 2 March 2017).
- Hatipoğlu, B.; Ertuna, B.; Sasidharan, V. A Referential Methodology for Education on Sustainable Tourism Development. Sustainability 2014, 6, 5029–5048. [Google Scholar] [CrossRef]
- Baum, T.; Cheung, C.; Kong, H.; Kralj, A.; Mooney, S.; Nguyen, H.; Thanh, T.; Ramachanran, S.; Ruzic, M.D.; Siow, M.L. Sustainability and the Tourism and Hospitality Workforce: A Thematic Analysis. Sustainability 2016, 8. [Google Scholar] [CrossRef]
- Bebko, C.P. Service intangibility and its impact on consumer expectations of servise quality. J. Serv. Mark. 2000, 14, 9–26. [Google Scholar] [CrossRef]
- Clow, K.E.; Kurtz, D.L.; Ozment, J.; Ong, B.S. The antecedents of consumer expectations of services: An emprical study across four industries. J. Serv. Mark. 1997, 11, 230–248. [Google Scholar] [CrossRef]
- Cronin, J.J., Jr; Taylor, S.A. Measuring service quality: A reexamination and extension. J. Mark. 1992, 56, 55–68. [Google Scholar] [CrossRef]
- Grönroos, C. A service quality model and its marketing implications. Eur. J. Mark. 1984, 18, 36–44. [Google Scholar] [CrossRef]
- Lehtinen, U.; Lehtinen, J.R. Service Quality: A Study of Quality Dimensions; Unpublished Working Paper; Service Management Institude: Helsinki, Finland, 1982. [Google Scholar]
- Parasuraman, A.; Zeithaml, V.A.; Berry, L.L. A conceptual model of service quality and its implications for future research. J. Mark. 1985, 49, 41–50. [Google Scholar] [CrossRef]
- Tse, D.K.; Wilton, P.C. Models of consumer satisfaction formation: An extension. J. Mark. Res. 1988, 25, 204–212. [Google Scholar] [CrossRef]
- Ekinci, C.E.; Burgaz, B. Hacettepe üniversitesi öğrencilerinin bazı akademik hizmetlere ilişkin beklenti ve memnuniyet düzeyleri. Hacet. Üniv. Eğit. Fak. Derg. 2007, 33, 120–134. [Google Scholar]
- Kuh, G. The other curriculum: Out-of-class experiences associated with student learning and personal development. J. High. Educ. 1995, 66, 123–155. [Google Scholar] [CrossRef]
- Hallock, D.; Satava, D.; LeSage, T. An exploratory investigation of the potential relationship between student learning styles, course grade, cumulative grade point average and selected demographics in on-line undergraduate business courses. Manag. Res. News 2003, 26, 21–28. [Google Scholar] [CrossRef]
- Bjorklund, S.A.; Parente, J.M.; Sathianathan, D. Effects of faculty interaction and feedback on gains in student skills. J. Eng. Educ. 2004, 93, 153–160. [Google Scholar] [CrossRef]
- Demir, Ş.Ş.; Demir, M. Turizm lisans öğrencilerinin akademik beklenti-memnuniyet düzeyinin kariyer planlamasına etkisi. I. In Proceedings of the Uluslararası Turizm ve Otelcilik Sempozyumu-UTOS’11, Konya, Turkey, 29 September–1 October 2011. [Google Scholar]
- Şahin, G.G. Üniversite düzeyinde turizm eğitiminde hizmet kalitesi beklenti ve algısına yönelik Ankara’da bir araştırma. İşlet. Araşt. Derg. 2011, 3, 49–65. [Google Scholar]
- Sweeney, J.C.; Soutari, G.N. Consumer perceived value: The development of a multiple item scale. J. Retail. 2001, 77, 203–220. [Google Scholar] [CrossRef]
- Halıcı, A.; Delil, Y. Büro yönetimi öğrencilerinin mesleki algılamalarına yönelik bir uygulama. Gazi Üniv. Ticaret Tur. Eğit. Fak. Derg. 2003, 3, 22–37. [Google Scholar]
- Sapri, M.K.; Finch, E. Factors that influence student’s level of satisfaction with regards to higher educational facilities services. Malays. J. Real Estate 2009, 4, 34–51. [Google Scholar]
- Hill, Y.; Lomas, L.; MacGregor, J. Students’ perceptions of quality in higher education. Qual. Assur. Educ. 2003, 11, 15–20. [Google Scholar] [CrossRef]
- Oliver, R.L. Whence consumer loyalty? J. Mark. 1999, 63, 33–44. [Google Scholar] [CrossRef]
- Robbins, S.P.; DeCenzo, D.A.; Coulter, M. Fundamentals of Management, 7th ed.; Pearson Education, Inc.: New Jersey, NJ, USA, 2011. [Google Scholar]
- Kotler, P.; Armstrong, G. Principles of Marketing, 8th ed.; Prentice-Hall Inc.: New York, NY, USA, 1999. [Google Scholar]
- Butt, B.Z.; Rehman, K. A study examining the students satisfaction in higher education. Procedia Soc. Behav. Sci. 2010, 2, 5446–5450. [Google Scholar] [CrossRef]
- Druzdzel, M.J.; Glymour, C. Application of the TETRAD II program to the study of student retention in US colleges. In AAAI-94 Workshop on Knowledge Discovery in Databases; AAAI Tecnical Report WS-94-03; AAAI Press: Menlo Park, CA, USA, 1995; pp. 419–430. [Google Scholar]
- Campbell, T.A.; Campbell, D.E. Faculty/student mentor program: Effects on performance and retention. Res. High. Educ. 1997, 38, 727–742. [Google Scholar] [CrossRef]
- Napoli, A.R.; Wortman, P.M. Psychological factors related to retention and early departure of two-year community college students. Res. High. Educ. 1998, 39, 419–455. [Google Scholar] [CrossRef]
- Mai, L. A comparative study between UK and US: The student satisfaction in higher education and its influential factors. J. Mark. Manag. 2005, 21, 859–878. [Google Scholar] [CrossRef]
- Chiandotto, B.; Bini, M.; Bertaccini, B. Quality Assessment of the University Educational Process: An Application of the ECSI Model. Effectiveness of University Education in Italy: Employability, Competences. In Human Capital; Fabbris, L., Ed.; Physica-Verlag Springer: Berlin/Heidelberg, Germany, 2007; ISBN 978-3-7908-1751-5. [Google Scholar]
- Goodenow, C.; Grady, K.E. The relationship of school belonging and friend’s values to academic motivation among urban adolescent students. J. Exp. Educ. 1992, 62, 60–70. [Google Scholar] [CrossRef]
- Tütüncü, Ö.; Doğan, Ö.İ. Müşteri Tatmini Kapsamında Öğrenci Memnuniyetinin Ölçülmesi ve Dokuz Eylül Üniversitesi Sosyal Bilimler Enstitüsü Uygulaması. Dokuz Eylül Üniv. Sos. Bilim. Enst. Derg. 2003, 5, 130–151. [Google Scholar]
- Guolla, M. Assessing the teaching quality to student satisfaction relationships: Applied customer satisfaction research in the classroom. J. Mark. Theory Pract. 1999, 7, 87–97. [Google Scholar] [CrossRef]
- Şimşek, Ö.M. Yapısal Eşitlik Modellemesine Giriş Temel İlkeler ve LİSREL Uygulamaları; Ekinoks: Ankara, Turkey, 2007; ISBN 9944495077. [Google Scholar]
- Baron, R.M.; Kenny, D.A. The Moderator-Mediator Variable Dinstinction in Social Psychological Research: Conteptual, Strategic, and Statistical Considerations. J. Personal. Soc. Psychol. 1986, 52, 1173–1182. [Google Scholar] [CrossRef]
- Barry, L.M.; Melody, M.L. Motivations, expectations, perceptions, and preferences in secondary school tourism and hospitality curriculum. J. Teach. Travel Tour. 2014, 14, 260–281. [Google Scholar] [CrossRef]
- Sökmen, A. Öğrenci memnuniyetine yönelik Ankara’daki bir meslek yüksekokulunda araştırma. İşlet. Araşt. Derg. 2011, 3, 66–79. [Google Scholar]
- MacKinnon, D.P.; Warsi, G.; Dwyer, J.H. A Simulation Study of Mediated Effect Measures. Multivar. Behav. Res. 1995, 30, 41–62. [Google Scholar] [CrossRef] [PubMed]
- Demir, Ş.Ş. Beklenti, algılanan kalite değer ve memnuniyet ilişkisi: Turizm lisans öğrencileri üzerine bir uygulama. Int. J. Hum. Sci. 2013, 10, 307–324. [Google Scholar]


| Variables | Statements | Factor Loading | Factor Validity | Factor Variance |
|---|---|---|---|---|
| Satisfaction of Vocational Education | 14—I think I have specialized in the program I study at. | 0.756 | 0.82 | 20.405 |
| 15—I think I have learnt an important part of the concepts and applications of my profession. | 0.782 | |||
| 16—I had the opportunity to improve the theoretical knowledge I gained at school through practical application. | 0.778 | |||
| 17—Thanks to my education, I can find a job more easily compared to others. | 0.644 | |||
| Satisfaction of Personal Development | 10—Thanks to my education, my self-confidence has increased. | 0.660 | 0.85 | 19.589 |
| 11—The education I received and the experiences I had at school improved my communication skills. | 0.800 | |||
| 12—I have become a more social and active person. | 0.824 | |||
| 13—The education I received and the experiences I had at school taught me how to lead my life. | 0.735 | |||
| Satisfaction of University | 6—Social and psychological counseling services provided at university are adequate. | 0.751 | 0.73 | 14.258 |
| 7—Many social and cultural activities which draw my interest are organized at my university. | 0.792 | |||
| 8—Academic counseling services provided are adequate. | 0.714 | |||
| Satisfaction of School | 1—Course hours and the program are sufficient and well organized. | 0.817 | 0.70 | 13.476 |
| 2—The courses offered within the program are adequate and organized in accordance with the purpose. | 0.810 | |||
| 18—I believe the language education which will help me do my job easily is provided. | 0.515 | |||
| KMO: 0.906 P: 0.000 (Barlett’s test) | Total Variance: 67.728 | |||
| N | MEAN | Std. Deviation | t | df | p | |
|---|---|---|---|---|---|---|
| Female | 294 | 3.1444 | 0.68725 | −0.551 | 671 | 0.582 |
| Male | 379 | 3.1749 | 0.72968 | 646.365 |
| Sum of Squares | df | Mean Square | F | p | |
|---|---|---|---|---|---|
| Between Groups | 30.223 | 15 | 2.015 | 4.327 | 0.000 |
| Within Groups | 286.371 | 615 | 0.466 | ||
| Total | 316.594 | 630 |
| N | Std. Deviation | Std. Error | Minimum | Maximum | ||
|---|---|---|---|---|---|---|
| 17 | 5 | 4.0790 | 0.59502 | 0.26610 | 3.33 | 4.78 |
| 18 | 83 | 3.4903 | 0.57655 | 0.06328 | 2.44 | 5.00 |
| 19 | 115 | 3.1741 | 0.60487 | 0.05640 | 1.28 | 5.00 |
| 20 | 115 | 3.2152 | 0.60778 | 0.05668 | 1.56 | 4.94 |
| 21 | 139 | 3.1066 | 0.77670 | 0.06588 | 1.00 | 5.00 |
| 22 | 84 | 2.9991 | 0.65118 | 0.07105 | 1.28 | 4.28 |
| 23 | 47 | 2.7790 | 0.86868 | 0.12671 | 1.00 | 4.35 |
| 24 | 18 | 2.8735 | 0.73730 | 0.17378 | 1.00 | 3.78 |
| 25 | 15 | 3.4282 | 0.78348 | 0.20229 | 1.83 | 5.00 |
| 26 | 2 | 4.1111 | 0.70711 | 0.50000 | 3.61 | 4.61 |
| 27 | 3 | 3.0741 | 1.09196 | 0.63045 | 1.83 | 3.89 |
| 28 | 1 | 4.6471 | 4.65 | 4.65 | ||
| 29 | 1 | 3.4444 | 3.44 | 3.44 | ||
| 30 | 1 | 3.2941 | 3.29 | 3.29 | ||
| 33 | 1 | 3.3889 | 3.39 | 3.39 | ||
| 34 | 1 | 3.8333 | 3.83 | 3.83 | ||
| Total | 631 | 3.1671 | 0.70889 | 0.02822 | 1.00 | 5.00 |
| Sum of Squares | df | Mean Square | F | p | |
|---|---|---|---|---|---|
| Between Groups | 25.734 | 3 | 8.578 | 18.121 | 0.000 |
| Within Groups | 317.161 | 670 | 0.473 | ||
| Total | 342.895 | 673 |
| N | Std. Deviation | Std. Error | Minimum | Maximum | ||
|---|---|---|---|---|---|---|
| First | 214 | 3.3328 | 0.65452 | 0.04474 | 1.44 | 5.00 |
| Second | 147 | 3.1580 | 0.66660 | 0.05498 | 1.00 | 4.67 |
| Third | 149 | 3.2857 | 0.57898 | 0.04743 | 1.28 | 4.78 |
| Fourth | 164 | 2.8380 | 0.82679 | 0.06456 | 1.00 | 5.00 |
| Total | 674 | 3.1639 | 0.71379 | 0.02749 | 1.00 | 5.00 |
| Sum of Squares | df | Mean Square | F | p | |
|---|---|---|---|---|---|
| Between Groups | 30.947 | 4 | 7.737 | 16.597 | 0.000 |
| Within Groups | 312.324 | 670 | 0.466 | ||
| Total | 343.272 | 674 |
| N | Std. Deviation | Std. Error | Minimum | Maximum | ||
|---|---|---|---|---|---|---|
| Tourism Management | 390 | 3.3019 | 0.66540 | 0.03369 | 1.28 | 5.00 |
| Gastronomy and Culinary Arts | 114 | 3.1263 | 0.59014 | 0.05527 | 1.00 | 4.67 |
| Tourist Guiding | 35 | 3.3236 | 0.50343 | 0.08510 | 2.44 | 4.94 |
| Hospitality Management | 67 | 2.8316 | 0.89243 | 0.10903 | 1.00 | 5.00 |
| Travel Management | 69 | 2.6966 | 0.76271 | 0.09182 | 1.00 | 4.35 |
| Total | 675 | 3.1648 | 0.71366 | 0.02747 | 1.00 | 5.00 |
| Scale | N | Mean | St | 1 | 2 | 3 | 4 | 5 | 6 | 7 |
|---|---|---|---|---|---|---|---|---|---|---|
| 1. Expectation of Academic Education | 675 | 3.7329 | 0.70924 | 1 | ||||||
| 2. Perception of Academic Education | 675 | 3.4328 | 0.83236 | 0.530 * | 1 | |||||
| 0.000 | ||||||||||
| 3. Satisfaction of Academic Education | 675 | 3.1648 | 0.71366 | 0.478 * | 0.693 * | 1 | ||||
| 0.000 | 0.000 | |||||||||
| 4. Satisfaction of Vocational Education | 675 | 2.9414 | 0.94892 | 0.398 * | 0.540 * | 0.815 * | 1 | |||
| 0.000 | 0.000 | 0.000 | ||||||||
| 5. Satisfaction of Personal Development | 675 | 3.2854 | 0.94494 | 0.391 * | 0.533 * | 0.820 * | 0.619 * | 1 | ||
| 0.000 | 0.000 | 0.000 | 0.000 | |||||||
| 6. Satisfaction of University | 675 | 3.0309 | 0.92627 | 0.293 * | 0.467 * | 0.712 * | 0.428 * | 0.470 * | 1 | |
| 0.000 | 0.000 | 0.000 | 0.000 | 0.000 | ||||||
| 7. Satisfaction of School | 675 | 3.0237 | 1.01091 | 0.347 * | 0.562 * | 0.742 * | 0.511 * | 0.445 * | 0.453 * | 1 |
| 0.000 | 0.000 | 0.000 | 0.000 | 0.000 | 0.000 |
| Dependent Variable | Independent Variable | Coefficient | t | F | R2 | p | |
|---|---|---|---|---|---|---|---|
| β | S. Error | ||||||
| Satisfaction of Academic Education | Fixed Value | 1.127 | 0.085 | 24.790 | 614.566 | 0.480 | 0.000 * |
| Perception of Academic Education | 0.594 | 0.024 | |||||
| Satisfaction of Vocational Education | Fixed Value | 0.839 | 0.131 | 16.544 | 273.693 | 0.291 | 0.001 * |
| Perception of Academic Education | 0.614 | 0.037 | |||||
| Satisfaction of Personal Development | Fixed Value | 1.209 | 0.132 | 16.248 | 264.004 | 0.284 | 0.001 * |
| Perception of Academic Education | 0.605 | 0.037 | |||||
| Satisfaction of University | Fixed Value | 1.243 | 0.135 | 13.621 | 185.536 | 0.218 | 0.001 * |
| Perception of Academic Education | 0.521 | 0.038 | |||||
| Satisfaction of School | Fixed Value | 0.672 | 0.138 | 17.514 | 306.747 | 0.315 | 0.001 * |
| Perception of Academic Education | 0.684 | 0.039 | |||||
| Dependent Variables | Variables | β | S.E. | t | F | R2 | p |
|---|---|---|---|---|---|---|---|
| (c) Satisfaction (dependent variable) | Constant | 1.369 | 0.130 | 10.522 | 197.597 | 0.229 | 0.000 * |
| Expectation | 0.481 | 0.034 | 14.057 | ||||
| Step 1 (a) Perception (dependent variable) | Constant | 1.109 | 0.146 | 7.570 | 260.823 | 0.281 | 0.000 * |
| Expectation | 0.623 | 0.039 | 16.150 | ||||
| Step 2 (b) Satisfaction (dependent variable) | Constant | 1.127 | 0.085 | 13.313 | 614.566 | 0.480 | 0.000 * |
| Perception | 0.594 | 0.024 | 24.790 | ||||
| Step 3 (c’) Satisfaction (dependent variable) Expectation (independent variables) Perception (mediating variables) | Constant | 0.788 | 0.110 | 7.192 | 328.552 | 0.497 | 0.000 * |
| Perception | 0.155 | 0.033 | 4.754 | ||||
| Expectation | 0.424 | 0.028 | 18.831 |
© 2018 by the authors. Licensee MDPI, Basel, Switzerland. This article is an open access article distributed under the terms and conditions of the Creative Commons Attribution (CC BY) license (http://creativecommons.org/licenses/by/4.0/).
Share and Cite
Akinci, Z.; Yurcu, G.; Kasalak, M.A. The Mediating Role of Perception in the Relationship between Expectation and Satisfaction in Terms of Sustainability in Tourism Education. Sustainability 2018, 10, 2253. https://doi.org/10.3390/su10072253
Akinci Z, Yurcu G, Kasalak MA. The Mediating Role of Perception in the Relationship between Expectation and Satisfaction in Terms of Sustainability in Tourism Education. Sustainability. 2018; 10(7):2253. https://doi.org/10.3390/su10072253
Chicago/Turabian StyleAkinci, Zeki, Gulseren Yurcu, and Murad Alpaslan Kasalak. 2018. "The Mediating Role of Perception in the Relationship between Expectation and Satisfaction in Terms of Sustainability in Tourism Education" Sustainability 10, no. 7: 2253. https://doi.org/10.3390/su10072253
APA StyleAkinci, Z., Yurcu, G., & Kasalak, M. A. (2018). The Mediating Role of Perception in the Relationship between Expectation and Satisfaction in Terms of Sustainability in Tourism Education. Sustainability, 10(7), 2253. https://doi.org/10.3390/su10072253