A Study on Needs for Automotive Interiors Based on Lifestyle Characteristics of Taiwanese Female Office Workers


Abstract
1. Introduction
1.1. Research Background and Motivation
1.2. Research Purpose
- Investigate the lifestyle characteristics of female office workers through collecting relevant literature information, conducting interviews with manufactures, and AIO questionnaires (Activity, Interest and Opinion).
- Conclude the needs of female office workers for automotive interiors, as based on the research results of the questionnaires, and analyze the differences in the usage needs for automotive interiors of female office workers of different types.
- Put forward the design factors of female office workers’ needs for automotive interiors by integrating the conclusions of interviews and the questionnaire analysis results for the consideration and reference of the automobile industry in designing automotive interiors.
1.3. Research Scope and Limitations
1.3.1. Research Scope
- As a result of changes in social structure, women’s access to higher education and career is increasing in proportion, thus giving them the right to economic independence. Therefore, this study focuses on the group of female office workers to explore the characteristics of their lifestyle.
- It aims to understand the elementary requirements of this group for interiors by discussing the views and needs of female office workers regarding automotive interiors.
- This paper takes the original interiors of Taiwanese best-selling females’ car models and the commonly used additional interiors in the current market as the basis for discussing the cases of interiors.
1.3.2. Research Limitations
- This paper takes full-time female office workers as the research objects, and those of 20–65 years of age are chosen as the targets of the sample survey, according to the Labor Standards Law that requires the working age of 65 for retirement.
- Considering that there is a wide range of automotive interiors, this paper only focuses on the interiors frequently applied by drivers.
- This paper’s scope of car models is limited to nonprofit self-use small cars with a displacement of less than 2000 cc (inclusive). Business cars and self-use pick-up trucks are not within the scope of this paper since they have specific purposes.
2. Literature Review
2.1. Attributes of Automotive Interior Products
2.2. Female Consumptive Attitude
2.2.1. Psychological Needs in Female Consumption
- Women consumers pay special attention to the emotional factors transmitted by products, and their purchasing motivation can be affected by the appearance, shape, and color of a product. In addition, their purchasing intention can be formed when they are attracted to unique appearances and multiple color styles with mental feelings, such as warm and romantic feelings created by atmosphere.
- Women are attentive; thus, when they are buying a product, they will focus on detail in designs, measure the value of a product by comparing it with other products, and tend to spend a longer time on comparing product characteristics with specific benefits; thus, a good product shall provide women with a tangible experience service.
- Not all women have much time of their own. For example, some married female employees need to sacrifice their time for their families. Therefore, products with easy operation are closer to the needs of women. In fact, women like to pursue changes in stability, as it will promote freshness and creativity in their busy lives.
2.2.2. Definition and Characteristics of Female Office Workers
- Money: The main influence in the changes of women’s lifestyles comes from independence in money, as women own more opportunities to choose free lives for themselves with economic autonomy. In the automobile market, the proportion of female buyers is higher than in the past, as women no longer have to depend on men, but have enough economic ability to buy more expensive products.
- Mind: At present, no matter whether in Asian, European, or American countries, women tend to receive higher education than men, which promotes self-consciousness and social status and allows women to have more opportunities to achieve their ideals and goals. From the perspective of professional specialization, male workers comprise the majority in medicine and finance. However, under the circumstance of improved female education, women begin to be outstanding in these occupations, and there are more and more women employed as senior managers.
- Movement: With economic independence and the promotion of self-consciousness, women begin to expand their social circles and harness domestic and overseas travel to expand their horizons, and all such behaviors allow women to show their own confidence. In addition to their influence on the tourism market, women’s mobility has a close relationship with purchasing behaviors. Consequently, tour operators try to create a scenario of a regional shopping paradise with advertisements to attract female consumers, and department stores have launched many activities related to anniversary celebrations to attract female consumers.
- Marriage: It has been a trend of social patterns that women change from being homemakers to career women, which may cause role overload for women when they have to fulfill multiple roles, which can cause many women who own economic autonomy and freedom of action to have no faith in marriage. As a result, the numbers of unmarried people and people who marry very late have significantly increased. There are great differences in marriage concepts for different women; as a result, some nouns, such as “single noble” and “loser dogs”, have become popular. Therefore, apart from the targeted group of married women, the consuming abilities of single female consumers in the female market shall not be underestimated.
- Me-too: Due to the trend of female economic independence, many dealers have regarded women as their targeted consumer group. In their eyes, as women love to follow the latest trends, with the dissemination of advertising media, they can obtain recognition from many women. Taking female finery and cosmetics as an example, the most common means of dealers is to take advantage of spokeswomen to attract female consumers, which grasps the female mentality of worshipping perfection and trying to benchmark a certain icon.
- Material: Besides general clothing and fittings, the material needs of women have gradually transferred to durable products. Both household appliances and transportation tools are products that require long-time use to achieve familiarity; thus, durability and practicality are consideration factors for women.
- Market: With the change in social status of women in society, many market segments must be changed to meet current market demands. Therefore, if a company wants to receive recognition from consumers, it must continuously understand the needs of consumers and correct market segments to accurately reach the targeted market.
3. Research Method and Process
3.1. Case Interview and Induction
3.2. Analysis of Questionnaires for the Lifestyles of Female Office Workers
3.2.1. Descriptive Analysis of Demographic Variables
- The respondents are mostly aged between 25–34 years old, with 93 persons in total, accounting for 38% of respondents; followed by 35–44 years old, 79 persons in total, accounting for 32%; 45–54 years old, 43 persons in total, accounting for 17%; 55–65 years old, 16 persons in total, accounting for 7%; 20–24 years old, 15 persons in total, accounting for 6%.
- Regarding the frequency distribution result of the “educational level” of respondents, university degrees take up the largest sample number of the questionnaire, with 171 persons in total, accounting for 70% of respondents; followed by master’s degrees, 32 persons in total, accounting for 13%; followed by senior high school degrees, 30 persons in total, accounting for 12%; doctoral degrees, 10 persons in total, accounting for 4%; junior high school (inclusive) degrees below, 3 persons in total, accounting for 1%.
- Regarding the frequency distribution result of the “marital status” of respondents, married women with children take up the largest sample number of the questionnaire, with 132 persons in total, accounting for 54% of respondents; followed by unmarried women, 90 persons in total, accounting for 37%; finally, married women without children, 24 persons in total, accounting for 10%.
- Regarding the frequency distribution result of the “occupation” of respondents, the service industry takes up the largest sample number of the questionnaire, with 53 persons in total, accounting for 22% of respondents; followed by the public education industry, 39 persons in total, accounting for 16%; followed by the financial industry, 36 persons in total, accounting for 15%; the design industry, 29 persons in total, accounting for 12%; traditional industries, 24 persons in total, accounting for 10%; the medical industry, 23 persons in total, accounting for 9%; other industries, 19 persons in total, accounting for 8%; the manufacturing industry, 16 persons in total, accounting for 7%; the electronics industry, 7 persons in total, accounting for 3%.
- Regarding the frequency distribution result of the “personal income” of respondents, NTD 30,001–NTD 40,000 takes up the largest sample number of the questionnaire, with 67 persons in total, accounting for 27% of respondents; followed by NTD 20,001–NTD 30,000, 60 persons in total, accounting for 24%; NTD 40,001–NTD 50,000, 56 persons in total, accounting for 23%; more than NTD 60,001, 30 persons in total, accounting for 12%; NTD 50,001–NTD 60,000, 1 person in total, accounting for 7%; less than NTD 20,000, 15 persons, accounting for 6%.
- Regarding the frequency distribution result of the “residence” of respondents, respondents living in southern downtown take up the largest sample number of the questionnaire, with 101 persons in total, accounting for 41% of respondents; followed by respondents living in central downtown, 50 persons in total, accounting for 20%; respondents living in southern suburbs, 32 persons in total, accounting for 13%; respondents living in northern downtown, 27 persons in total, accounting for 11%; respondents living in central suburbs, 19 persons in total, accounting for 8%; respondents living in northern suburbs, 17 persons in total, accounting for 7%.
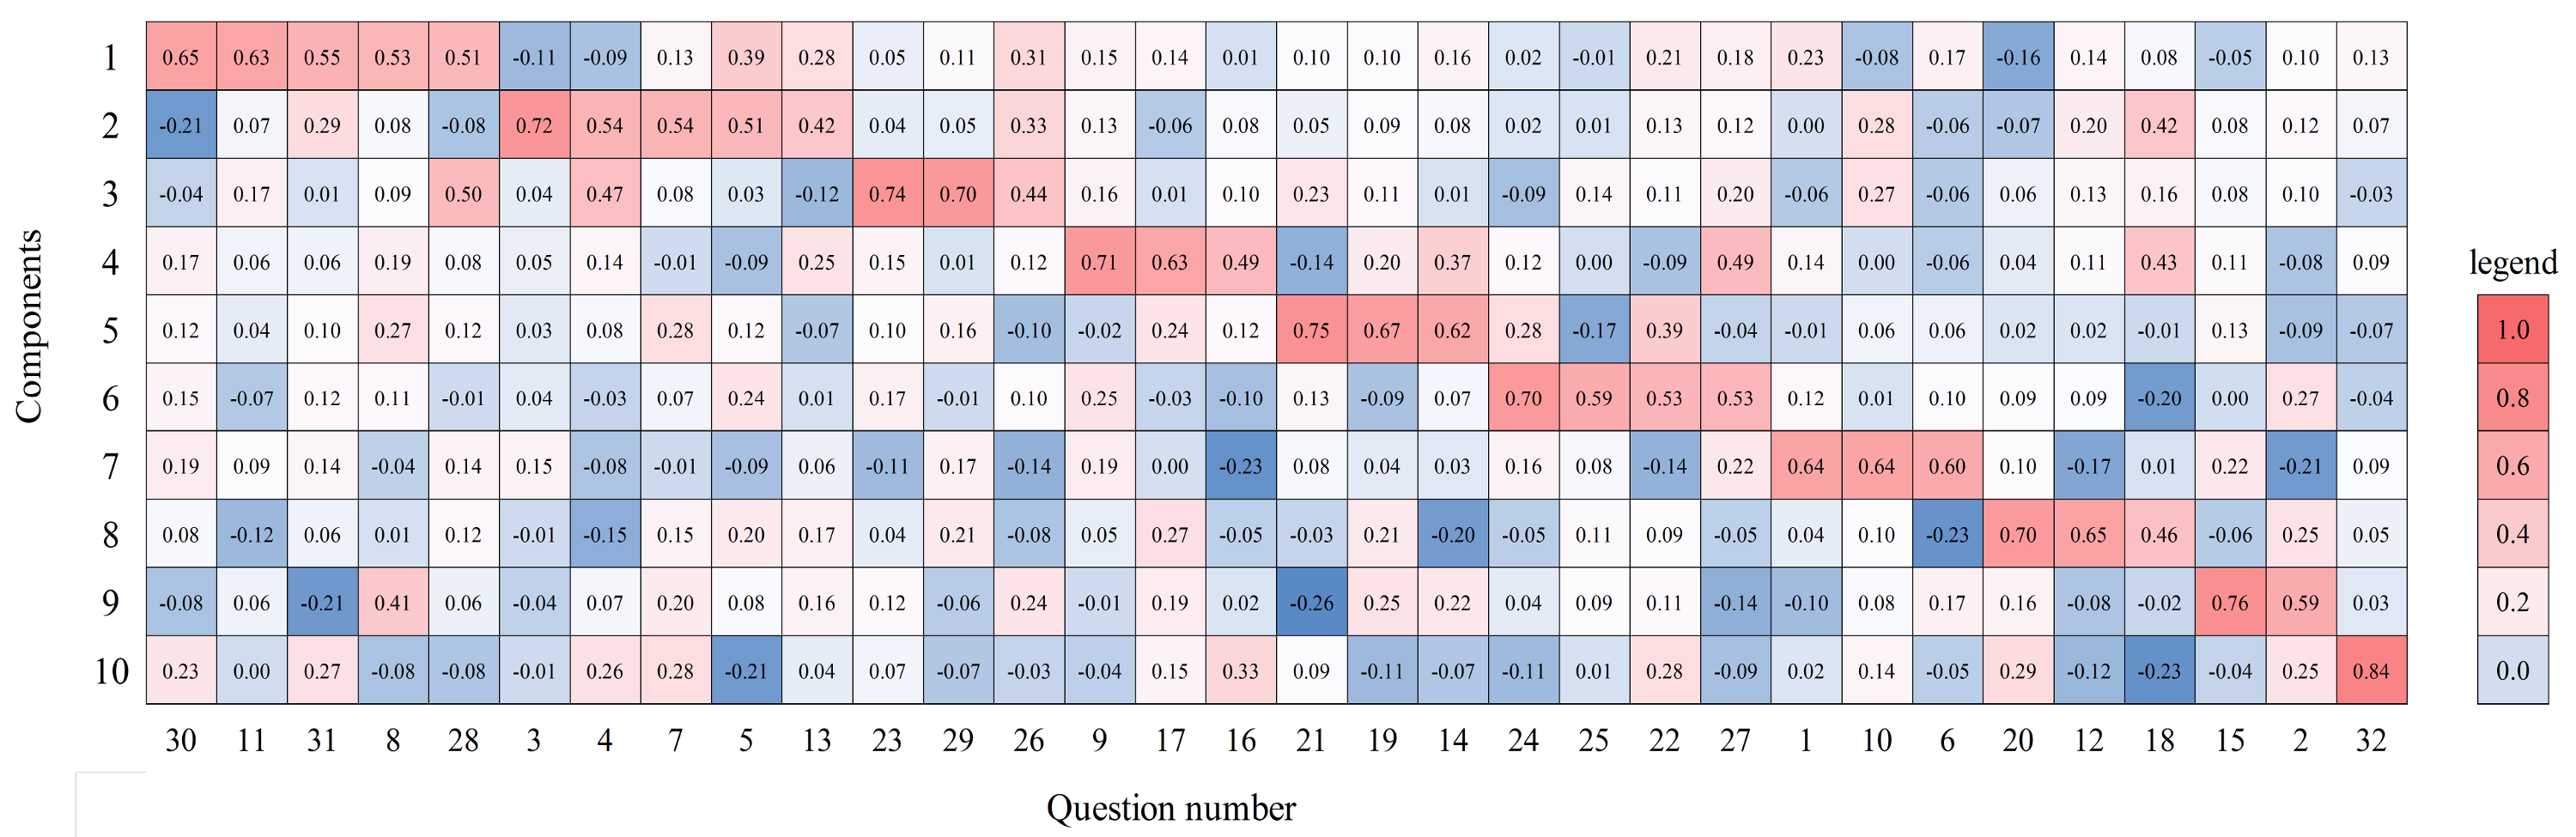
3.2.2. Factor Analysis of Lifestyles and Reliability Test
- Information-Sensitive: This factor includes the 30th, 11th, 31st, 8th, and 28th questions in the lifestyle question items: 5 questions in total. According to the numerical value of this factor, the respondents of this factor take delight in accepting opinions provided by different channels, understanding related current reports, and believing in their own sight and judgment.
- Brand Worship: This factor includes the 3rd, 4th, 7th, 5th, and 13th questions in the lifestyle question items: 5 questions in total. According to the numerical value of this factor, respondents of this factor tend to give priority to brands when they are purchasing products, repeatedly purchase products of the same brand, have faith in familiar brands, believe that brands with high reputation and high prices are better than ordinary brands, and believe that using them is more helpful to promote their social status. In addition, they frequently use their mobile phones to obtain the latest brand information.
- Fashionable Popular: This factor includes the 23rd, 29th, and 26th questions in the lifestyle question items: 3 questions in total. According to the numerical value of this factor, respondents of this factor would focus on their images of dressing properly, even if they do not have to go out to participate in parties or other activities, like purchasing cars of the same brands as their friends, and like purchasing fashionable products with high prices or with texture at department stores and boutiques.
- Early Adopters: This factor includes the 9th, 17th, and 16th questions in the lifestyle question items: 3 questions in total. According to the numerical value of this factor, respondents of this factor are featured by the characteristics of accepting new friends and challenges. Women of this type are easily motivated by novel and interesting things and work overtime from time to time.
- Careful Concerns: This factor includes the 21st, 19th, and 14th questions in the lifestyle question items: 3 questions in total. According to the numerical value of this factor, respondents of this factor are used to putting articles away, neatly placing them after use, and they efficiently use their time to complete goals through careful planning.
- Optimistic Outward: This factor includes the 24th, 25th, 22nd, and 27th questions in the lifestyle question items: 4 questions in total. According to the numerical value of this factor, respondents of this factor are fond of outdoor and social activities, love keeping pets, love planting trees and flowers, and beautify and decorate their own rooms. In conclusion, women of this type enjoy life, experience different activities, and happily face life during their spare time.
- Conservative Nostalgia: This factor includes the 1st, 10th, and 6th questions in the lifestyle question items: 3 questions in total. According to the numerical value of this factor, respondents of this factor highly trust their familiar and previously existing products; thus, they are more willing to use products that they have used before and believe that sturdy and durable products are better than popular products. In conclusion, they are very prudent in purchasing products and pay a great attention to the practicality of products.
- Perceptual Subjective: This factor includes the 20th, 12th, and 18th questions in the lifestyle question items: 3 questions in total. According to the numerical value of this factor, respondents of this factor are featured by the characteristic of emotion surmounting reason and their purchasing choices can be easily affected by advertising media. They also like to provide their opinions and suggestions to their friends.
- Self-Centered: This factor includes the 15th and 2nd questions in the lifestyle question items: 2 questions in total. According to the numerical value of this factor, respondents of this factor are mainly focused on their own ideas and do not care for ideas of others. With strong self-consciousness disposition, they are confident in their own judgment and prefer to determine their purchasing intention based on their own moods at the moment.
- Professional Dependent: This factor only includes the 32nd question in the lifestyle question items, but the coefficient value of this factor is up to 0.840; therefore, this factor is of great significance to this study. Respondents of this factor tend to leave the maintenance and repair of simple products to professionals. Therefore, the respondents of this type are very dependent on assistance from service staff, believe that their usage confusion can be solved, and the working conditions of products can be well maintained when they are in the hands of professionals.
3.2.3. Discussion on Lifestyle Clusters and Grouping of Occupations
- The discerning and intellectual pleasure seekers: It can be learned from Table 3 that cluster 1 and factors “Fashionable Popular” and “Perceptual Subjective” are positive values in the centroid locations of the cluster, while factors “Conservative Nostalgia”, “Self-Centered”, and “Professional Dependent” are negative values in the centroid locations of the cluster, which shows that the higher the positive value of a factor, the more attention is paid to the factor; and the lower the negative value of a factor, the less attention is paid to the factor.
- The regular and easy-going-life seekers: It can be learned from Table 3 that cluster 2 and factors “Careful Concerns”, “Conservative Nostalgia”, “Self-Centered”, and “Professional Dependent” are positive values in the centroid locations of the cluster, while factors “Early Adopters”, “Fashionable Popular”, and “Perceptual Subjective” are negative peaks in the centroid locations of the cluster.
- The modern information seekers: It can be learned from Table 3 that cluster 3 and factors “Information Sensitive”, “Brand Worship”, and “Early Adopters” are positive values in the centroid locations of the cluster, while the factor “Careful Concerns” is a negative peak in the centroid locations of the cluster.
- Cluster 1: The discerning and intellectual pleasure seekers
- Cluster 2: The regular and easy-going-life seekers
- Cluster 3: The modern information seekers
3.3. Automotive Interiors of Female Office Workers
3.3.1. Usage Needs of Automotive Interiors for Female Office Workers
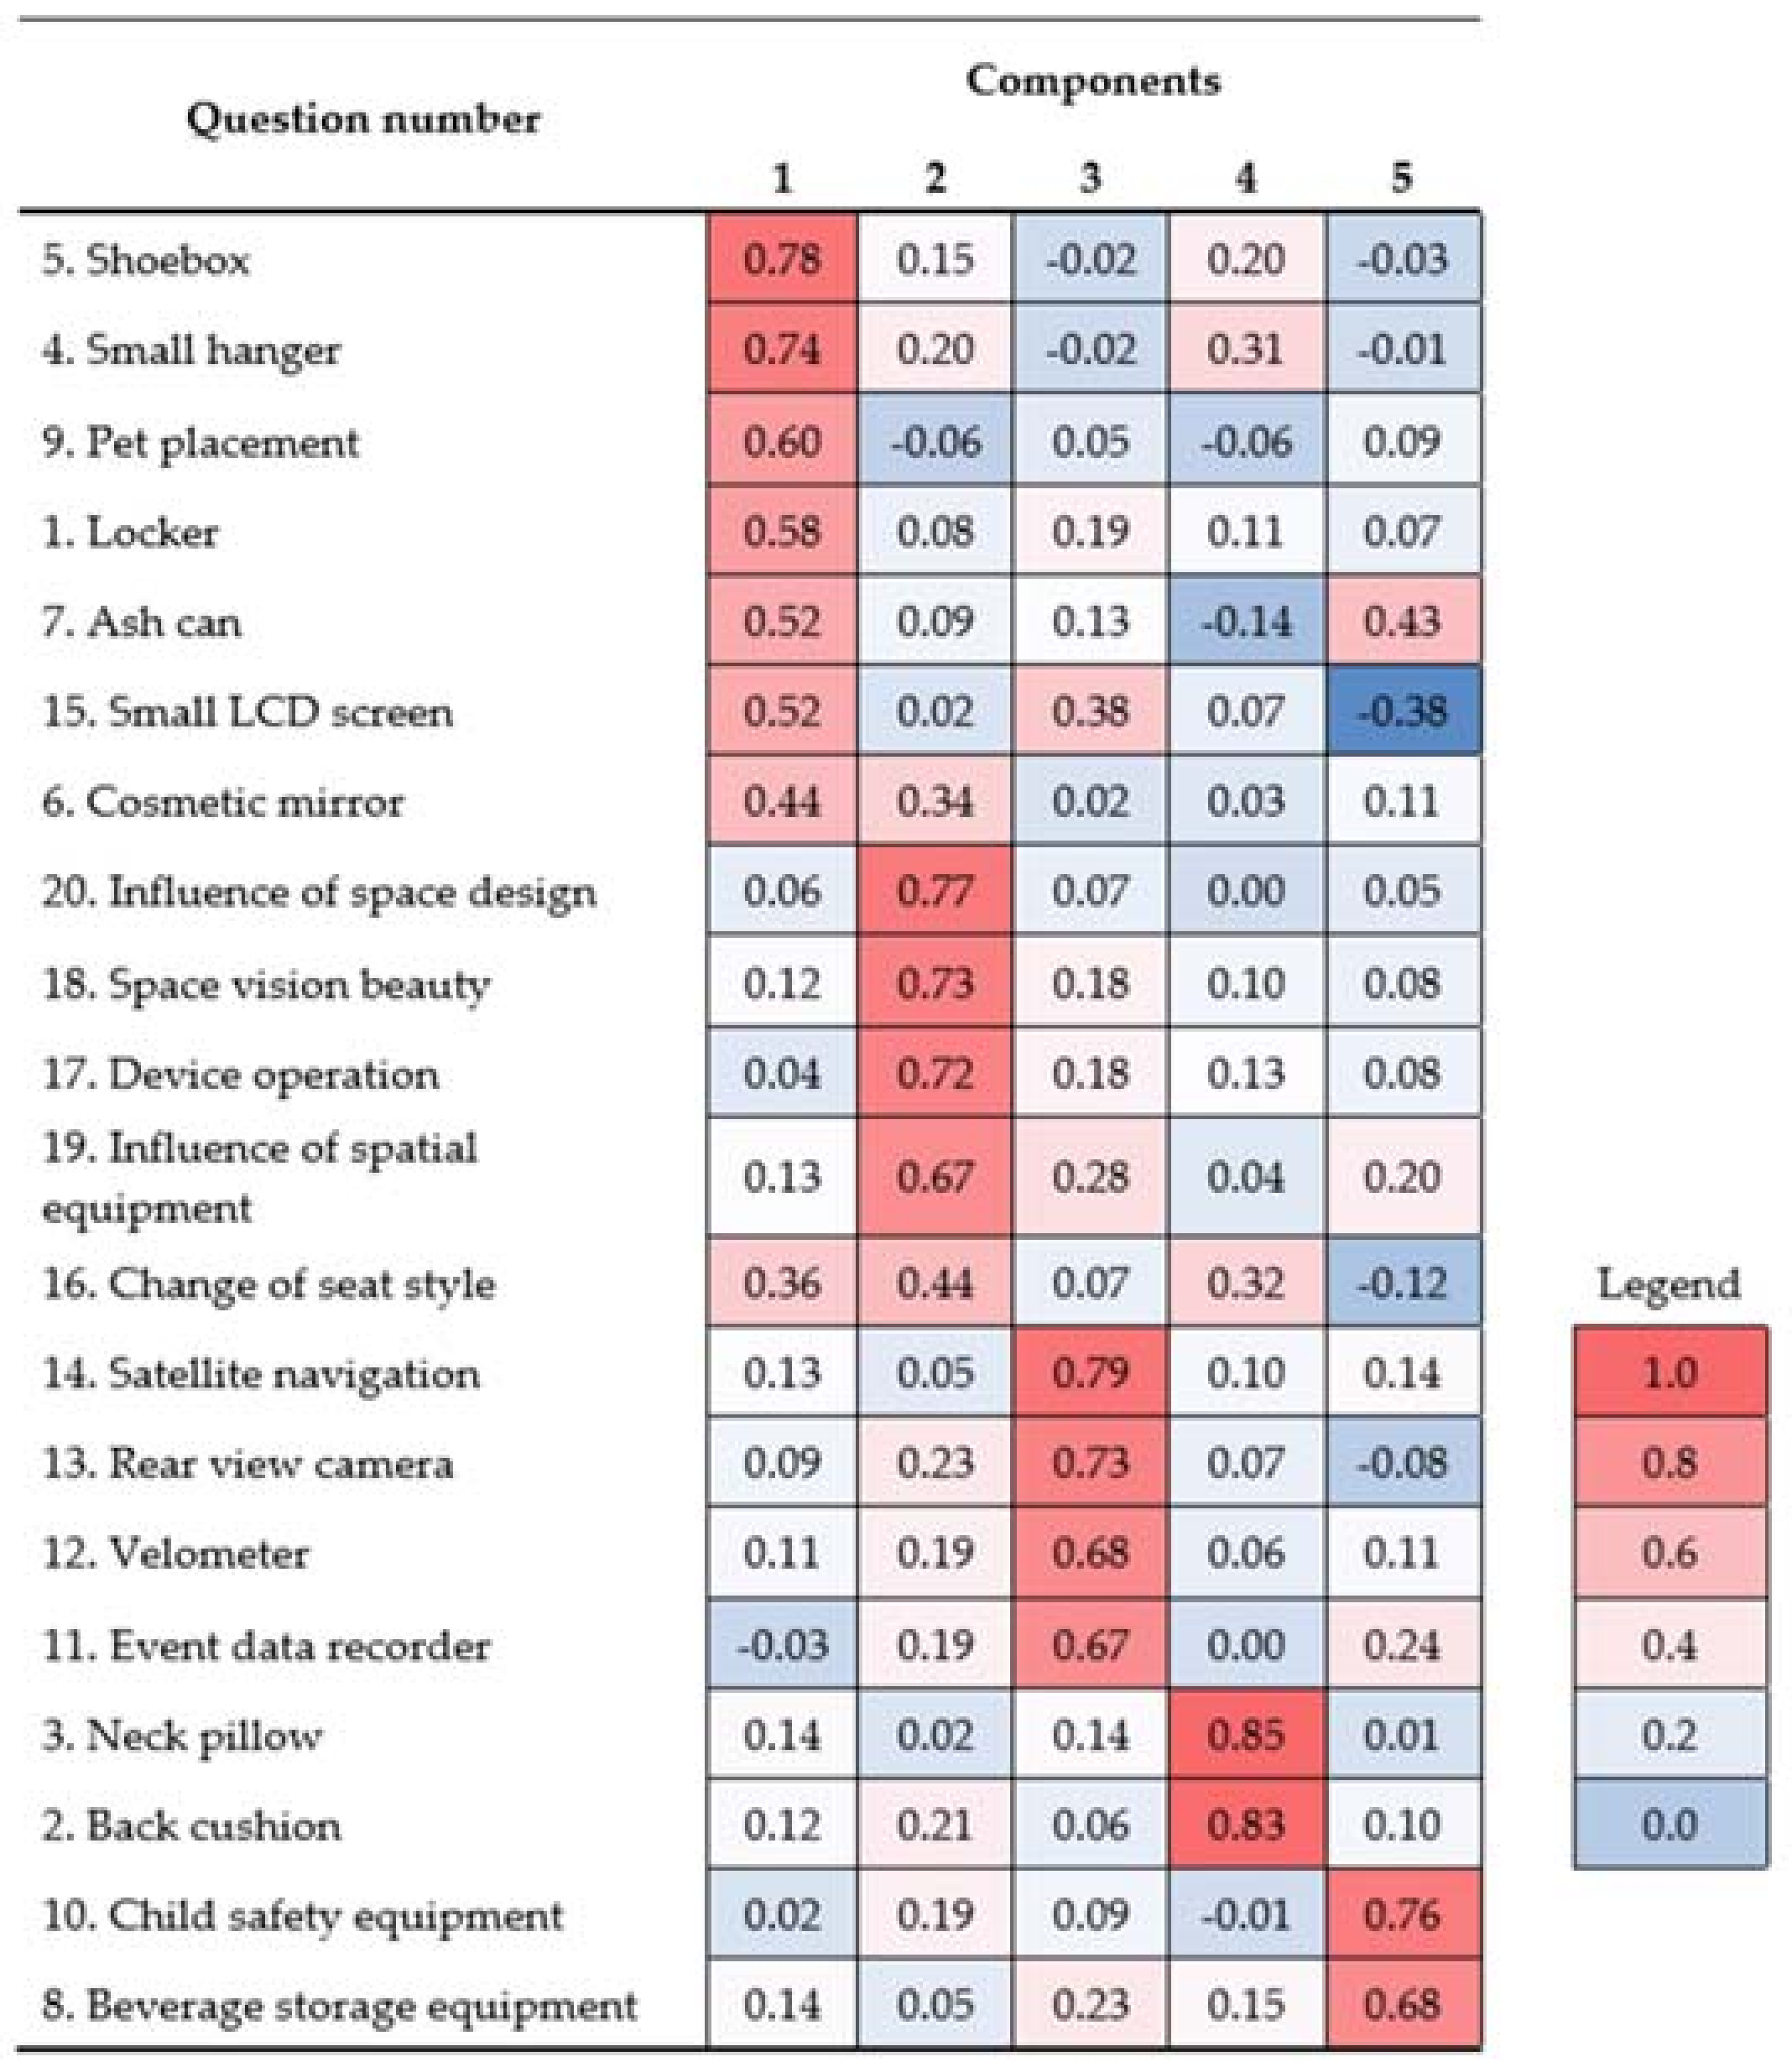
3.3.2. Factor Analysis of Usage Needs for Automotive Interiors and Reliability Testing
- Functional Storage: A total of 6 questions relating to automotive interiors are contained in this factor, and their contents are partial to functional interior equipment and storage equipment.
- Spatial Aesthetics: A total of 5 questions relating to automotive interiors are contained in this factor, and their contents are partial to relevant topics of interior space design and mental feelings of spatial aesthetics inside a car.
- Digital Device: A total of 4 questions relating to automotive interiors are contained in this factor, and their contents are mainly about the relevant digital devices for assisting drivers.
- Comfortable Feeling: A total of 2 questions relating to automotive interiors are contained in this factor, and their contents are about relieving fatigue and providing comfortable feelings for drivers.
- Safety and Cleanliness: A total of 2 questions relating to automotive interiors are contained in this factor, and their contents are about providing safety equipment for children and devices that maintain cleanliness in the car; if there are children, the situation that children can soil the interior space of a car shall be taken into consideration.
3.4. Variance Analysis of Usage Needs of Automotive Interiors for Female Office Workers
3.4.1. Analysis of Differences between Usage Needs for Automotive Interiors and Ages
3.4.2. Variance Analysis of Educational Levels and Usage Needs for Automotive Interiors
3.4.3. Variance Analysis of Marital Status and Usage Needs for Automotive Interiors
3.4.4. Variance Analysis of Personal Monthly Income and Usage Needs for Automotive Interiors
3.4.5. Variance Analysis of Current Residence Income and Usage Needs for Automotive Interiors
3.4.6. Variance Analysis of Occupations Income and Usage Needs for Automotive Interiors
4. Conclusions and Suggestions
4.1. Conclusions
- According to the literature, it can be learned that the psychological influence factors of female consumption mentioned by scholars are related to economic, spiritual, and social influences. Through literature review and interviews with top three car sellers in Taiwan, that is, Toyota, Nissan, and Mitsubishi, we can see that automotive interiors are indeed under the influence of economy, spirit, and social hierarchy mentioned by various women’s consumption theories. This paper believes that female consumers will purchase automotive products out of their basic physiological needs, and those basic interiors will be their first choice. Then, they would consider the automotive interiors for safety and practicality. If the economic condition permits, there can be more choices for the purchase of automotive interiors. For example, it may be required that the interiors of a car not only have a function, but also serve as a beautiful decoration, so that the interiors, both practical and decorative, can highlight personal style and become social symbols as well as a feeling of self-esteem.
- Ten lifestyle factors: (1) Information-Sensitive, (2) Brand Worship, (3) Fashionable Popular, (4) Early Adopters, (5) Careful Concerns, (6) Optimistic Outward, (7) Conservative Nostalgia, (8) Perceptual Subjective, (9) Self-Centered, and (10) Professional Dependent.
- Clusters of female office workers: (1) The discerning and intellectual pleasure seekers, including the occupations of medical and electronics industries; (2) The regular and easy-going-life seekers, including the occupations of public education, financial, manufacturing, and traditional industries; (3) The modern information seekers, including the occupations of service and design industries.
- Factors of needs for automotive interiors: (1) Functional Storage, (2) Spatial Aesthetics, (3) Digital Device, (4) Comfortable Feeling, (5) Safety and Cleanliness.
- Variance analysis of female office workers’ needs for automotive interiors.
- (1)
- Occupational clusters and the five factors of automotive interiors “Functional Storage”, “Spatial Aesthetics”, “Digital Device”, “Comfortable Feeling”, and “Safety and Cleanliness” show significant differences.
- (2)
- Age and the two factors of automotive interiors “Comfortable Feeling” and “Safety and Cleanliness” show significant differences.
- (3)
- Educational level and the factor “Comfortable Feeling” of automotive interiors show significant differences.
- (4)
- Marital status and the two factors of automotive interiors “Functional Storage” and “Digital Device” show significant differences.
- (5)
- Personal monthly income and the factor “Spatial Aesthetics” of automotive interiors show significant differences.
- (6)
- Current residence and the factor “Functional Storage” of automotive interiors show significant differences.
- The discerning and intellectual pleasure seekers:This cluster includes female office workers of medical and electronics industries, who are discerning in fashion, have high demands of living quality and self-image, and like to go shopping in shops with higher prices, such as boutiques and department stores. As female office workers of the two industries own good economic abilities, they think the real enjoyment is experiencing elegant lives. For them, “Safety and Cleanliness” and “Digital Device” are the most needed, while “Comfortable Feeling” draws the least attention from them. Regarding “Safety and Cleanliness”, they think both beverage storage equipment and a small ash can maintain the cleanliness of the interior space of a car. Regarding “Digital Device”, with a relatively strong budget, women of this cluster can install digital devices, such as a navigation system and rear-view camera to assist them in driving, as it makes them feel more at ease.
- The regular and easy-going-life seekers:This cluster includes female office workers of public education, financial, manufacturing, and traditional industries, who are career women with careful concerns. They are very independent and would like to share their ideas. In work, they are very principled and good at using time to finish their jobs. In addition, they think products with practicality and familiarity are durable, and think it is the most reliable choice to have products maintained and repaired by professionals. For them, “Comfortable Feeling” of automotive interiors is most needed, while “Digital Device” draws the least attention from them. Regarding the “Comfortable Feeling” of automotive interiors, they think interior auxiliary equipment, such as neck pillows and back cushions, are better. After all, women of this cluster are very scrupulous and present substantial brains and physical strength in their jobs. Therefore, a comfortable design for automotive interiors, which can relieve their fatigue after a day’s work and provide comfort in driving, can make them more comfortable when driving.
- The modern information seekers:This cluster includes female office workers of service and design industries, who are willing to accept the challenges of fresh and current fashions. To obtain the latest information, they are very dependent on information products, such as mobile phones. In addition, they are very passionate in serving people and think brands can display their own tastes and styles. Therefore, they pay constant attention to the reports of media and magazines, and they think they can only enjoy their lives by embracing freshness and change in their lives. For them, “Functional Storage”, “Spatial Aesthetics”, “Digital Device”, and “Safety and Cleanliness” of automotive interiors are mostly needed, while “Comfortable Feeling” draws the least attention from them. Regarding “Spatial Aesthetics”, they can accept automotive interiors with different style designs. Apart from the practical functions of automotive interiors, they also need decorative functions, as such items can make them feel happier when driving a car.
4.2. Future Work Suggestions
- This paper aims to understand the demand of female consumers for automotive interiors. Due to practical considerations, only women with a fixed income and economic foundation have enough deposits to purchase cars and consider the interiors of their vehicles. Therefore, the paper mainly targets to the group of female office workers for its exploration. However, female office workers already belong to a specific group, so the number of subgroups in the study is not large enough. It is recommended that future researchers may define the objects in a more explicit way if they want to conduct a variance survey targeting to the female group for other industrial categories. For example, they can narrow down the objects to the white-collar group so that the research results can be more effective.
- Limited by factors such as time, manpower, and cost, although this study conducted questionnaire surveys for female office workers in northern, central, and southern Taiwan, there was still a gap between the questionnaire survey and the actual implementation. More copies of questionnaires should be collected, and the female consumers in the eastern Taiwan may be taken into account, or an in-depth survey can be conducted in a single area. Nonetheless, the research methods mentioned in the content may also be applied to other groups or studies on the differences in product requirements.
- In this paper, it can be seen that women do have an influence on the consumer market. This paper believes that the needs and feelings of female consumers should be taken seriously by the automotive industry and other industry categories. In this study, we can learn that different female office workers do have different needs for automotive interiors, and it will make the research more valuable if academic research results can be applied to the product practices in the future. For example, in response to the rise of smartphones and flat-panel displays, the requirements of automotive interiors can be included into the options of exclusive app software to allow consumers to customize their car interiors when purchasing a car. In this way, the user’s needs can be clearly understood and the designs can truly help the users by increasing life convenience and safety. Only in this way can the purpose of designing for a better life be fulfilled.
Author Contributions
Funding
Conflicts of Interest
References
- E-book Platform of Directorate General of Budget, Accounting and Statistics. Available online: http://ebook.dgbas.gov.tw/ct.asp?xItem=33673&ctNode=5971&mp=103 (accessed on 8 September 2013).
- U-CAR Car News. Available online: http://www.u-car.com.tw/ (accessed on 15 March 2014).
- Cunningham, J.; Roberts, P.; Liang, C.C. W Marketing—Penetration into Female Consumption Psychology; Global Publishing: Taipei, Taiwan, 2007; ISBN 9789861851242. [Google Scholar]
- Yang, J.T. A Study of the Relations between the Forms and the Styles of Car-Lighting Based on Female Lifestyle. Master’s Thesis, National Cheng Kung University, Tainan, Taiwan, 2002. [Google Scholar]
- Cheng, S.L. The Research of Design on Motor’s Interiors Assisted with TRIZ. Master’s Thesis, DaYeh University, Changhua, Taiwan, 2004. [Google Scholar]
- Wiseman, F. Segmentation Analysis on Automobiles Buyers During the New Model Year Transition Period. J. Mark. 1971, 35, 42–49. [Google Scholar] [CrossRef]
- Manoj, A.; Brian, R. Estimating Demand Functions for Product Characteristics: The Case of Automobiles. J. Consum. Res. 1980, 7, 249–262. [Google Scholar] [CrossRef]
- Green, P.E.; Tull, D.S. Research for Marketing Decisions, 5th ed.; Prentice-Hall: Englewood Cliffts, NJ, USA, 1988; ISBN 978-0137741755. [Google Scholar]
- Zhou, Z.X. Discussion on Information Collection Model of Car Purchasers. Master’s Thesis, National Chengchi University, Taipei, Taiwan, 1984. [Google Scholar]
- Zheng, C.Q. A Study on Image Sensation and Image Positioning of Domestic Self-Use Small Passenger Car Manufacturers: Application of Non-Metric Multidimensional Scaling. Master’s Thesis, National Chiao Tung University, Hsinchu, Taiwan, 1995. [Google Scholar]
- Chen, S.H. The Automobile Buyers’ Thinking Items and Influence Factors Research. Master’s Thesis, National Cheng Kung University, Tainan, Taiwan, 1997. [Google Scholar]
- Chen, S.W. This Study on Purchasing Behavior of Domestic Automobile Consumers. Master’s Thesis, National Taipei University, Taipei, Taiwan, 2003. [Google Scholar]
- Yu, C.H. A Research of the Relationship between Lifestyle and Product Attribute on the Automobile Consumers—A Case Study for Taipei City. Master’s Thesis, National Taipei University, Taipei, Taiwan, 2004. [Google Scholar]
- Murphy, P. Design Capitalism: Design, Economics and Innovation in the Auto-Industrial Age. She Ji J. Des. Econ. Innov. 2015, 1, 140–149. [Google Scholar] [CrossRef]
- Liang, C.C.; Lee, Y.H.; Ho, C.H.; Chen, K.H. An Investigation on the Automotive Interior with the Kansei Evaluation and Perceived Value Dimensions. J. Kaisei 2016, 4, 56–77. [Google Scholar]
- You, H.C.; Ryu, T.B.; Oh, K.H.; Yun, M.H.; Kim, K.J. Development of customer satisfaction models for automotive interior materials. Int. J. Ind. Ergon. 2006, 36, 323–330. [Google Scholar] [CrossRef]
- Gössling, S. The Psychology of the Car: Automobile Admiration, Attachment, and Addiction; 2—The Psychology of the Car; Elsevier: New York, NY, USA, 2017; pp. 19–46. [Google Scholar]
- Gössling, S. The Psychology of the Car: Automobile Admiration, Attachment, and Addiction; 4—Feelings, Emotions and the Car; Elsevier: New York, NY, USA, 2017; pp. 67–102. [Google Scholar]
- Baltasa, G.; Saridakis, C. An empirical investigation of the impact of behavioral and psychographic consumer characteristics on car preferences: An integrated model of car type choice. Transp. Res. Part A Policy Pract. 2013, 54, 92–110. [Google Scholar] [CrossRef]
- Kuo, F.Y. The Design Works are Basis from Female Life Style. Master’s Thesis, National Yunlin University of Science and Technology, Douliu, Taiwan, 2008. [Google Scholar]
- Bie, L.D.; Chen, C.J.; Chen, F.P. Women Having the Most Money; Shangzhi Culture: Taipei, Taiwan, 2005; ISBN 9789867204066. [Google Scholar]
- Japanese Hakuhodo Institute of Life & Living; Peng, M.L. New Women: Center of Fashion; Shuquan Publishing House: Taipei, Taiwan, 1988. [Google Scholar]
- Guilford, J.P. Psychometric Methods, 2nd ed.; McGraw-Hill Book Company: New York, NY, USA, 1954; ISBN 9781462524778. [Google Scholar]
- Kaiser, H.F. An index of factorial simplicity. Psychometrika 1974, 39, 31–36. [Google Scholar] [CrossRef]
- Hair, J.F.; Anderson, R.E.; Tatham, R.L.; Black, W.C. Multivariate Data Analysis, 5th ed.; Macmillan: New York, NY, USA, 1998; ISBN 978-0138948580. [Google Scholar]
- Wu, M.L. SPSS and Analysis of Application of Statistics; Wu Nan Books: Taipei, Taiwan, 2012; ISBN 9789571163772. [Google Scholar]


| Item of Interior | Function | |
| Practicality | Center console | This function is the core of the overall operation of a car, and all equipment that controls the direction of a car and information equipment are on the center console, such as the steering wheel, instrument panel, acoustic and cooling equipment, etc. It varies according to different car models, and different materials can be chosen as decoration according to different preferences. |
| Steering wheel | It is the most important design factor for controlling a car, as it provides the direction of motion of the car body for drivers and allows a car to run within the range of visibility of drivers. | |
| Instrument panel | It is a display and control panel that allows drivers to know vehicle speed, mileage, and fuel tank status of cars. At present, there are two types of instrument panels, which are traditional indicators and digital panels. | |
| Saddle of center console | It is mounted in the center of the entire interior space, between the driver’s seat and the passenger’s seat, and is equipped with a handbrake and shift lever. It has different design forms according to different models, and it can contain small items and drinks. | |
| Sun visor | It is installed overhead, in front of the driver’s seat and the passenger’s seat, to provide shade from the sun and store cards, and currently, some car models have been designed with a mirror that facilitates putting on makeup. | |
| Rear-view mirror | It allows a driver to clearly see traffic behind and helps a driver to see objects in the rear when reversing. | |
| Door panels | They are installed in the doors in the front and back seats. Usually, there are handles in them to close or open car windows, and with the flute design, they can store small items. | |
| Roof | It is to achieve heat insulation and protection in the entire interior space. At present, open-type roofs are designed, which can adjust the interior space to allow air to circulate. | |
| Door handles | They are mounted in door panels. At present, in consideration of differences in habits of opening the car doors, door handles are designed with different materials. | |
| Seats | They are an important design for drivers to sit in a car, as they provide comfort and safety when driving. Moreover, the heights and distance between the front and back seats can be adjusted according to different heights of passengers, and different materials can be matched to provide comfort and safety for drivers and passengers. | |
| Locker | It is usually installed beneath the center console and beside the driver’s seat. It can store private belongings and is easily used. | |
| Information devices | They are supplementary multimedia devices inside a car, such as sound equipment, GPS satellite navigation system, etc., to provide auxiliary information functions for drivers. | |
| Decoration | Gear panel | Base of the shift level and its material and color can be changed according to different preferences. |
| Door trim panel | Safety belts are installed to provide safety for drivers and passengers, and they can have a decorative effect. | |
| Armrest trim panels | They are installed in door panels, and according to preferences of drivers, they can be matched with different materials to make drivers feel more comfortable. | |
| Shutter | It is used to shelter the back of a car and can be moved and adjusted; thus, it has the function of beautifying the storage space at the back seats. | |
| Vehicle mat | It is placed on the floor spaces of a car to keep them clean, and different materials can be chosen according to the preferences of users; thus, it has the function of beautifying the interior of the car. |
| Factor | Name | Contents | Factor Loadings |
|---|---|---|---|
| Factor 1 | Information Sensitive | 30. You listen to opinions from different people and find out the differences among all brands when buying a car. | 0.645 |
| 11. You like watching news or care about current affairs. | 0.629 | ||
| 31. When an automobile manufacturer offers extra equipment, you are more willing to buy a car. | 0.551 | ||
| 8. You are confident of your own sight and taste. | 0.527 | ||
| 28. You will notice information and reports related to cars in newspapers, magazines, or on television media | 0.514 | ||
| Factor 2 | Brand Worship | 3. When buying products, you care most about brands, rather than the countries manufacturing the products. | 0.722 |
| 4. You often buy products of the same brand. | 0.539 | ||
| 7. You think products of brands with high reputation and high prices are good in quality. | 0.538 | ||
| 5. You think using famous-brand products can promote the user’s social status. | 0.513 | ||
| 13. You are very dependent on your mobile phone, and it is a necessity in your life. | 0.419 | ||
| Factor 3 | Fashionable Popular | 23. You dress yourself up even if you are taking a rest in your own house. | 0.736 |
| 29. You have bought cars of the same brand as most of your friends. | 0.704 | ||
| 26. You love shopping and regularly go to department stores and boutiques. | 0.440 | ||
| Factor 4 | Early Adopters | 9. You are sociable and like to make new friends. | 0.706 |
| 17. You like jobs with challenges and interesting jobs. | 0.630 | ||
| 16. You often work overtime. | 0.494 | ||
| Factor 5 | Careful Concerns | 21. You will put used articles away and place them neatly. | 0.752 |
| 19. You have strong working ability and are very cautious. | 0.672 | ||
| 14. You can generally take efficient advantage of time. | 0.621 | ||
| Factor 6 | Optimistic Outward | 24. You like to participate in outdoor activities to enjoy nature. | 0.701 |
| 25. You keep pets or plant trees and flowers. | 0.594 | ||
| 22. You like to decorate your own room and place decorations to beautify the room. | 0.531 | ||
| 27. You like to participate in social activities. | 0.525 | ||
| Factor 7 | Conservative Nostalgia | 1. You are a prudent purchaser and shop around for the best price. | 0.639 |
| 10. You like to use familiar products or previously existing products. | 0.639 | ||
| 6. Compared with fashionable products, you more like sturdy and durable products. | 0.604 | ||
| Factor 8 | Perceptual Subjective | 20. You are more easily affected by emotion than reason. | 0.698 |
| 12. You can be affected by advertising media when you are buying products. | 0.645 | ||
| 18. You like to control the behaviors of friends and give your opinions to them. | 0.462 | ||
| Factor 9 | Self-Centered | 15. You are very independent and do not care about the opinions of others. | 0.760 |
| 2. You will buy things that you like very much without hesitation. | 0.591 | ||
| Factor 10 | Professional Dependent | 32. You prefer to leave the maintenance and repair of products to professionals, even if they are very easy. | 0.840 |
| Factor | Cluster 1 | Cluster 2 | Cluster 3 | F Value | p Value | <α |
|---|---|---|---|---|---|---|
| Information-Sensitive | 0.38290 | −0.26056 | 0.44004 | 13.714 | 0.000 | * |
| Brand Worship | 0.00209 | −0.43533 | 0.24416 | 4.247 | 0.015 | * |
| Fashionable Popular | 0.28858 | −0.54187 | −0.15884 | 18.280 | 0.000 | * |
| Early Adopters | −0.18035 | −0.99688 | 0.64205 | 36.141 | 0.000 | * |
| Careful Concerns | −0.02057 | 1.22236 | −0.42539 | 28.806 | 0.000 | * |
| Optimistic Outward | −0.03328 | −0.15601 | 0.01150 | 0.247 | 0.782 | |
| Conservative Nostalgia | −0.23372 | 0.46412 | 0.24957 | 12.728 | 0.000 | * |
| Perceptual Subjective | 0.14279 | −0.86919 | 0.05956 | 11.632 | 0.000 | * |
| Self-Centered | −0.27204 | 0.92268 | 0.35470 | 22.995 | 0.000 | * |
| Professional Dependent | −0.20414 | 0.72022 | 0.14801 | 10.257 | 0.000 | * |
| Cluster Name | Cluster 1 The Discerning and Intellectual Pleasure Seekers | Cluster 2 The Regular and Easy-Going-Life Seekers | Cluster 3 The Modern Information Seekers |
|---|---|---|---|
| Influencing factors on lifestyles | Fashionable Popular, Perceptual Subjective | Careful Concerns, Conservative nostalgia, Self-Centered, Professional Dependent | Information-Aensitive, Brand Worship, Early Adopters |
| Occupations | Medical and electronics industries | Public education, financial, manufacturing, and traditional industries | Service and design industries |
| Ample Number | 30 | 116 | 81 |
| Percentage | 13.2% | 51.1% | 35.6% |
| Factor | Name | Contents | Factor Loadings |
|---|---|---|---|
| Factor 1 | Functional Storage | 5. You think placing a shoebox is helpful for storing and changing shoes. | 0.784 |
| 4. You think a small hanger can facilitate storage and a change of clothing. | 0.742 | ||
| 9. You think a pet placement area can make drivers feel at ease and also provide amusement when traveling with pets. | 0.595 | ||
| 1. You think placing a locker in the car is helpful for storing articles in the car. | 0.583 | ||
| 15. You think placing a small LCD screen can facilitate ease in driving, and playing videos can make drivers and passengers feel more at ease. | 0.521 | ||
| 6. You think a car must be equipped with a cosmetic mirror to allow drivers or passengers to fix their make-up during commutes. | 0.44 | ||
| Factor 2 | Spatial Aesthetics | 20. You think the design of interior spaces will affect the mental feelings of drivers when they are driving. | 0.767 |
| 18. You think the design of interior spaces must take visual aesthetics into consideration. | 0.73 | ||
| 17. You think devices in a car must consider the difficulty for women to operate and use. | 0.722 | ||
| 19. You think devices in a car can affect purchasing intention. | 0.673 | ||
| 16. You think changing seat style can beautify the space in a car. | 0.442 | ||
| Factor 3 | Digital Device | 14. You think a GPS satellite navigation system can help drivers to find their destinations. | 0.789 |
| 13. You think a rear-view camera can help drivers to solve the difficulty of parking. | 0.727 | ||
| 12. You think placing a velometer can remind drivers of safe driving speed. | 0.682 | ||
| 11. You think placing event data recorder can provide a guarantee of image recordings when driving. | 0.67 | ||
| Factor 4 | Comfortable Feeling | 3. You think interior auxiliary equipment, such as a neck pillow, can ease neck fatigue when driving. | 0.846 |
| 2. You think interior auxiliary equipment, such as a back cushion, can ease fatigue when driving. | 0.834 | ||
| Factor 5 | Safety and Cleanliness | 10. You think only a car with safety equipment for children can make drivers feel at ease when driving. | 0.757 |
| 8. You think beverage storage equipment in a car can maintain the cleanliness of a car. | 0.683 | ||
| 7. You think placing ash can in a car can maintain the cleanliness of a car. | 0.425 |
| Type of Factor | 20–24 Years Old | 25–34 Years Old | 35–44 Years Old | 45–54 Years Old | Above 55 Years Old | F Value | p Value | <α |
|---|---|---|---|---|---|---|---|---|
| Functional Storage | 0.1969951 | −0.0559549 | 0.0235533 | 0.1151090 | −0.2850951 | 0.693 | 0.597 | |
| Spatial Aesthetics | −0.1633500 | −0.0660153 | 0.1434184 | 0.1332923 | −0.5294969 | 1.95 | 0.103 | |
| Digital Device | 0.2705095 | 0.1829882 | −0.1280502 | −0.1615942 | −0.2506892 | 1.93 | 0.105 | |
| Comfortable Feeling | −0.0903279 | −0.1676546 | 0.0550558 | 0.0482605 | 0.6576365 | 2.56 | 0.039 | * |
| Safety and Cleanliness | −0.5793088 | 0.1148817 | 0.1678719 | −0.2185576 | −0.3661421 | 3.29 | 0.012 | * |
| Sample Number | 15 | 93 | 79 | 43 | 16 |
| Type of Factor | Below Junior High School | Senior High School and Vocational School | College and University | Master’s Degree | Doctoral Degree | F Value | p Value | <α |
|---|---|---|---|---|---|---|---|---|
| Functional Storage | −0.8601484 | −0.0037088 | 0.0572675 | −0.1520454 | −0.2235580 | 1.00 | 0.405 | |
| Spatial Aesthetics | −10.056571 | 0.0904701 | −0.0204036 | 0.0464169 | 0.2459286 | 1.95 | 0.103 | |
| Digital Device | −0.4717988 | −0.3381039 | 0.1115281 | −0.1387513 | −0.3072744 | 1.97 | 0.099 | |
| Comfortable Feeling | 0.9663592 | 0.6315094 | −0.1131704 | −0.0403987 | −0.1199469 | 4.53 | 0.002 | * |
| Safety and Cleanness | −0.4716778 | −0.2486412 | 0.0106850 | 0.2042791 | 0.0510200 | 0.975 | 0.422 | |
| Sample Number | 3 | 30 | 171 | 32 | 10 |
| Type of Factor | Unmarried | Married without Children | Married with Children | F Value | p Value | <α |
|---|---|---|---|---|---|---|
| Functional Storage | 0.3025906 | −0.5681369 | 0.1030141 | 9.28 | 0.000 | * |
| Spatial Aesthetics | −0.0136105 | −0.1741066 | 0.0409356 | 0.481 | 0.619 | |
| Digital Device | 0.2305702 | −0.2839131 | −0.1055864 | 4.20 | 0.016 | * |
| Comfortable Feeling | −0.0982135 | −0.2263647 | 0.1081209 | 1.83 | 0.162 | |
| Safety and Cleanness | −0.0444369 | 0.0768988 | 0.0163163 | 0.176 | 0.839 | |
| Sample Number | 90 | 24 | 132 |
| Type of Factor | Less than NTD 20,000 | NTD 20,001–NTD 30,000 | NTD 30,001–NTD 40,000 | NTD 40,001–NTD 50,000 | NTD 50,001–NTD 60,000 | More than NTD 60,000 | F Value | p Value | <α |
|---|---|---|---|---|---|---|---|---|---|
| Functional Storage | −0.038408 | 0.1766420 | −0.089475 | 0.0020021 | 0.0806439 | −0.186373 | 0.714 | 0.614 | |
| Spatial Aesthetics | 0.2131187 | 0.2718996 | −0.211147 | −0.111029 | −0.316042 | 0.218085 | 2.47 | 0.033 | * |
| Digital Device | −0.069299 | 0.0991098 | 0.2363502 | −0.160394 | −0.096122 | −0.334342 | 1.90 | 0.094 | |
| Comfortable Feeling | 0.4581502 | 0.0195531 | −0.011246 | 0.0370421 | −0.041908 | −0.287065 | 1.15 | 0.332 | |
| Safety and Cleanness | 0.0768301 | −0.016473 | 0.1518594 | −0.050318 | −0.185938 | −0.139128 | 0.594 | 0.705 | |
| Sample Number | 15 | 60 | 67 | 56 | 18 | 30 |
| Type of factor | Northern Downtown | Northern Suburbs | Central Downtown | Central Suburbs | Southern Downtown | Southern Suburbs | F Value | p Value | <α |
|---|---|---|---|---|---|---|---|---|---|
| Functional Storage | −0.264609 | −0.198396 | 0.551743 | −0.101161 | 0.115890 | −0.107595 | 4.19 | 0.001 | * |
| Spatial Aesthetics | 0.1921018 | −0.349992 | 0.1916097 | −0.025866 | −0.10576 | 0.0736443 | 1.25 | 0.285 | |
| Digital Device | 0.1386635 | 0.1980112 | 0.0677869 | 0.4551851 | −0.21763 | 0.0885503 | 2.12 | 0.063 | |
| Comfortable Feeling | −0.171927 | −0.210272 | 0.0649331 | −0.119969 | 0.105654 | −0.106928 | 0.701 | 0.623 | |
| Safety and Cleanness | 0.0166124 | −0.260820 | 0.0963762 | −0.074864 | 0.107749 | 0.1462708 | 0.615 | 0.688 | |
| Sample Number | 27 | 17 | 50 | 19 | 101 | 32 |
| Type of Factor | Cluster 1 (Medical and Electronics Industries) | Cluster 2 (Public Education, Financial, Manufacturing, and Traditional Industries) | Cluster 3 (Service and Design Industries) | F Value | p Value | <α |
|---|---|---|---|---|---|---|
| Functional Storage | −0.4278679 | −0.7133318 | 0.4773128 | 2.380 | 0.023 | * |
| Spatial Aesthetics | −0.1743082 | −0.2726202 | 0.5468624 | 2.911 | 0.006 | * |
| Digital Device | 0.0821610 | −0.9646342 | 0.5289532 | 2.509 | 0.017 | * |
| Comfortable feeling | −0.7434202 | 0.3807332 | −0.0719344 | 2.616 | 0.013 | * |
| Safety and Cleanliness | 0.5246725 | −0.5979415 | 0.1653035 | 2.979 | 0.005 | * |
| Sample Number | 30 | 116 | 81 |
© 2018 by the authors. Licensee MDPI, Basel, Switzerland. This article is an open access article distributed under the terms and conditions of the Creative Commons Attribution (CC BY) license (http://creativecommons.org/licenses/by/4.0/).
Share and Cite
Tu, J.-C.; Yang, C.; Hung, Y.-T. A Study on Needs for Automotive Interiors Based on Lifestyle Characteristics of Taiwanese Female Office Workers. Sustainability 2018, 10, 2168. https://doi.org/10.3390/su10072168
Tu J-C, Yang C, Hung Y-T. A Study on Needs for Automotive Interiors Based on Lifestyle Characteristics of Taiwanese Female Office Workers. Sustainability. 2018; 10(7):2168. https://doi.org/10.3390/su10072168
Chicago/Turabian StyleTu, Jui-Che, Chun Yang, and Yu-Ting Hung. 2018. "A Study on Needs for Automotive Interiors Based on Lifestyle Characteristics of Taiwanese Female Office Workers" Sustainability 10, no. 7: 2168. https://doi.org/10.3390/su10072168
APA StyleTu, J.-C., Yang, C., & Hung, Y.-T. (2018). A Study on Needs for Automotive Interiors Based on Lifestyle Characteristics of Taiwanese Female Office Workers. Sustainability, 10(7), 2168. https://doi.org/10.3390/su10072168