Comprehensive Evaluation of Regional Sustainable Development Based on Data Envelopment Analysis


Abstract
1. Introduction
2. Research Status
3. DEA Evaluation Model
3.1. Super-SBM-Undesirable Evaluation Model
3.2. DEA-Malmquist Productivity Index Evaluation Model
4. Examples of Application—Comprehensive Evaluation of Sustainable Development of the Yangtze River Economic Belt
4.1. Establishing an Evaluation Index System
4.2. Construction of DEA Input and Output Comprehensive Index
4.2.1. Data Acquisition and Standardization
4.2.2. Determining Index Weight
- ➢
- Determination of objective weight. The objective weights of four third level indices, namely, , , , , are obtained by the entropy method;
- ➢
- Determination of subjective weight. By referring to relevant literature and consulting experts’ opinions, the subjective weights of the three-level indices, namely, , ,, and were obtained.
- ➢
- Final determination of index weight. By synthesizing subjective and objective weights, we can get the weights of the three-level indicators under the secondary indicators of urban development: .
4.2.3. Determining Composite Index Values
4.3. Result Evaluation Analysis
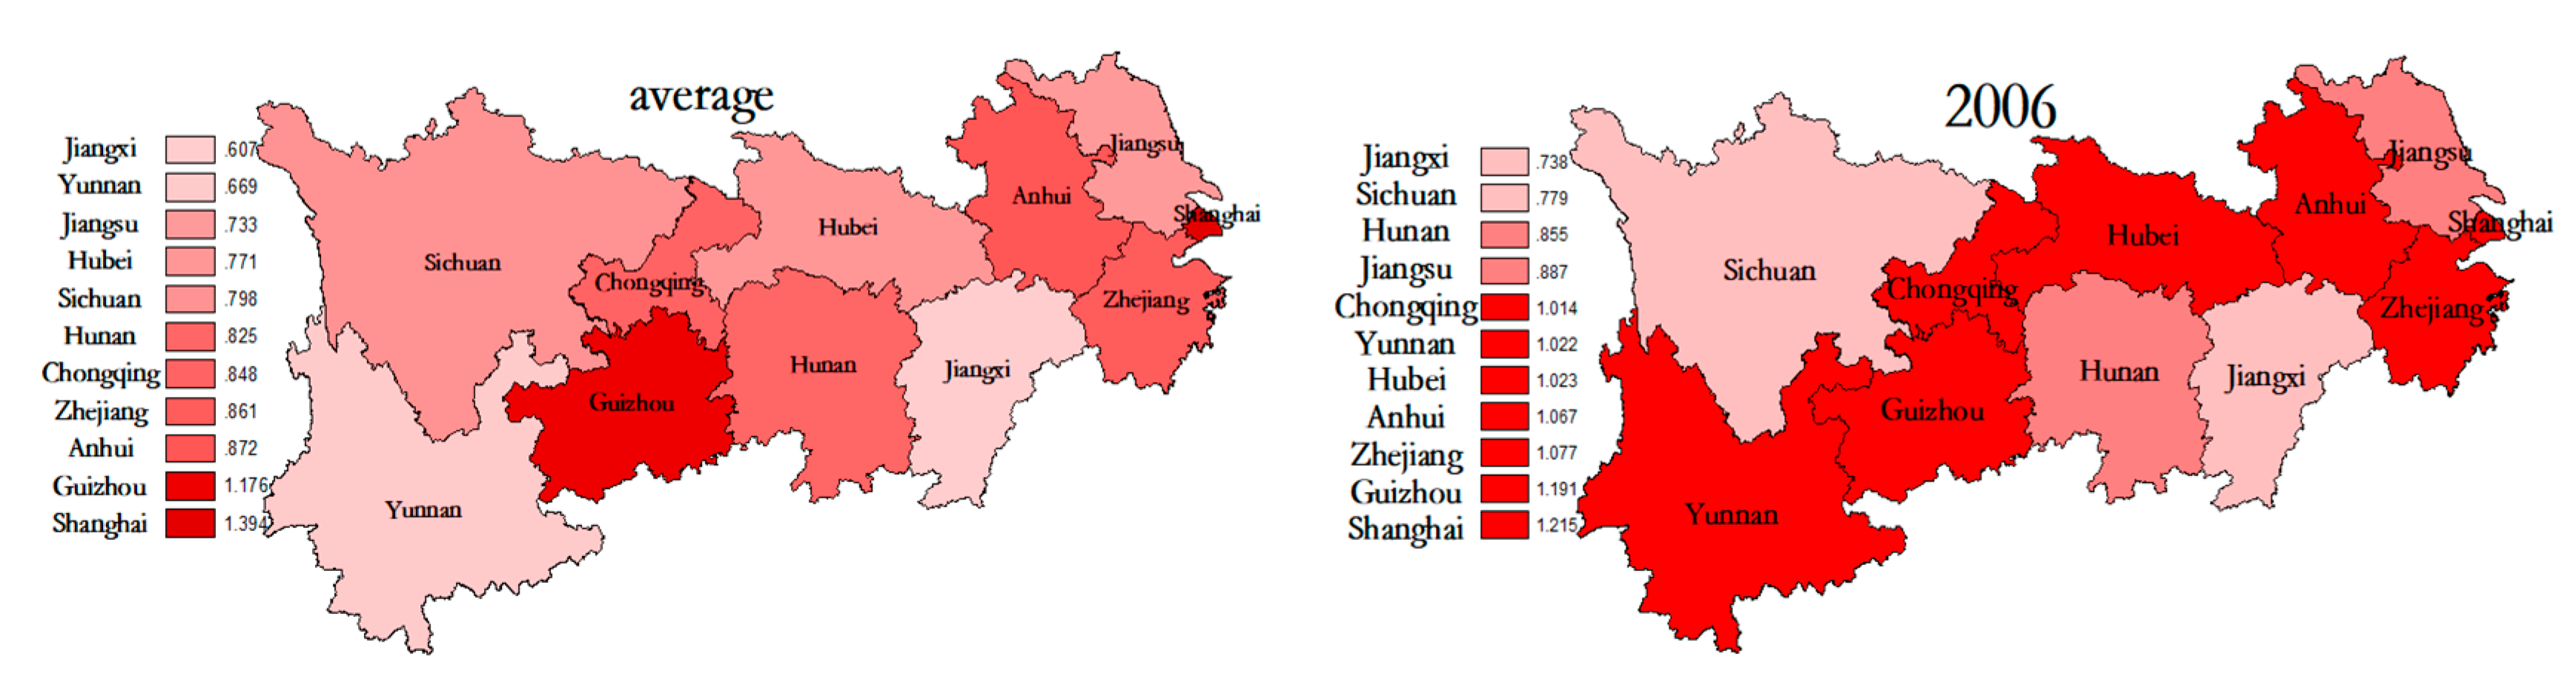
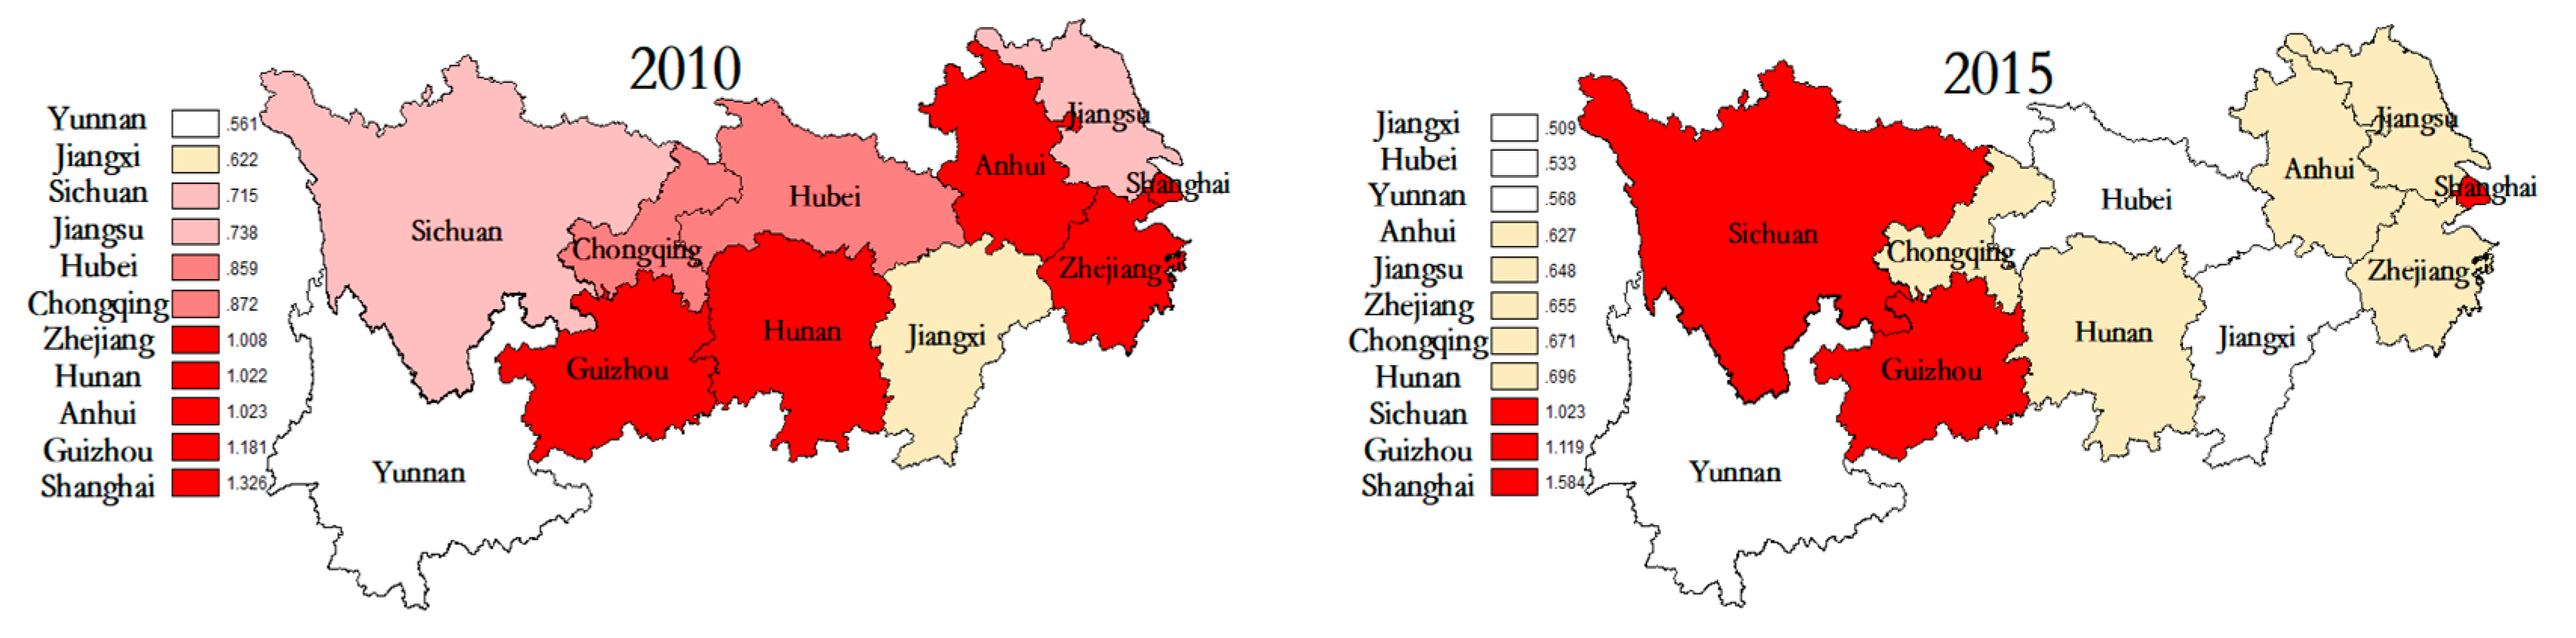
4.3.1. Result Analysis of Technical Efficiency of Time Cross Section
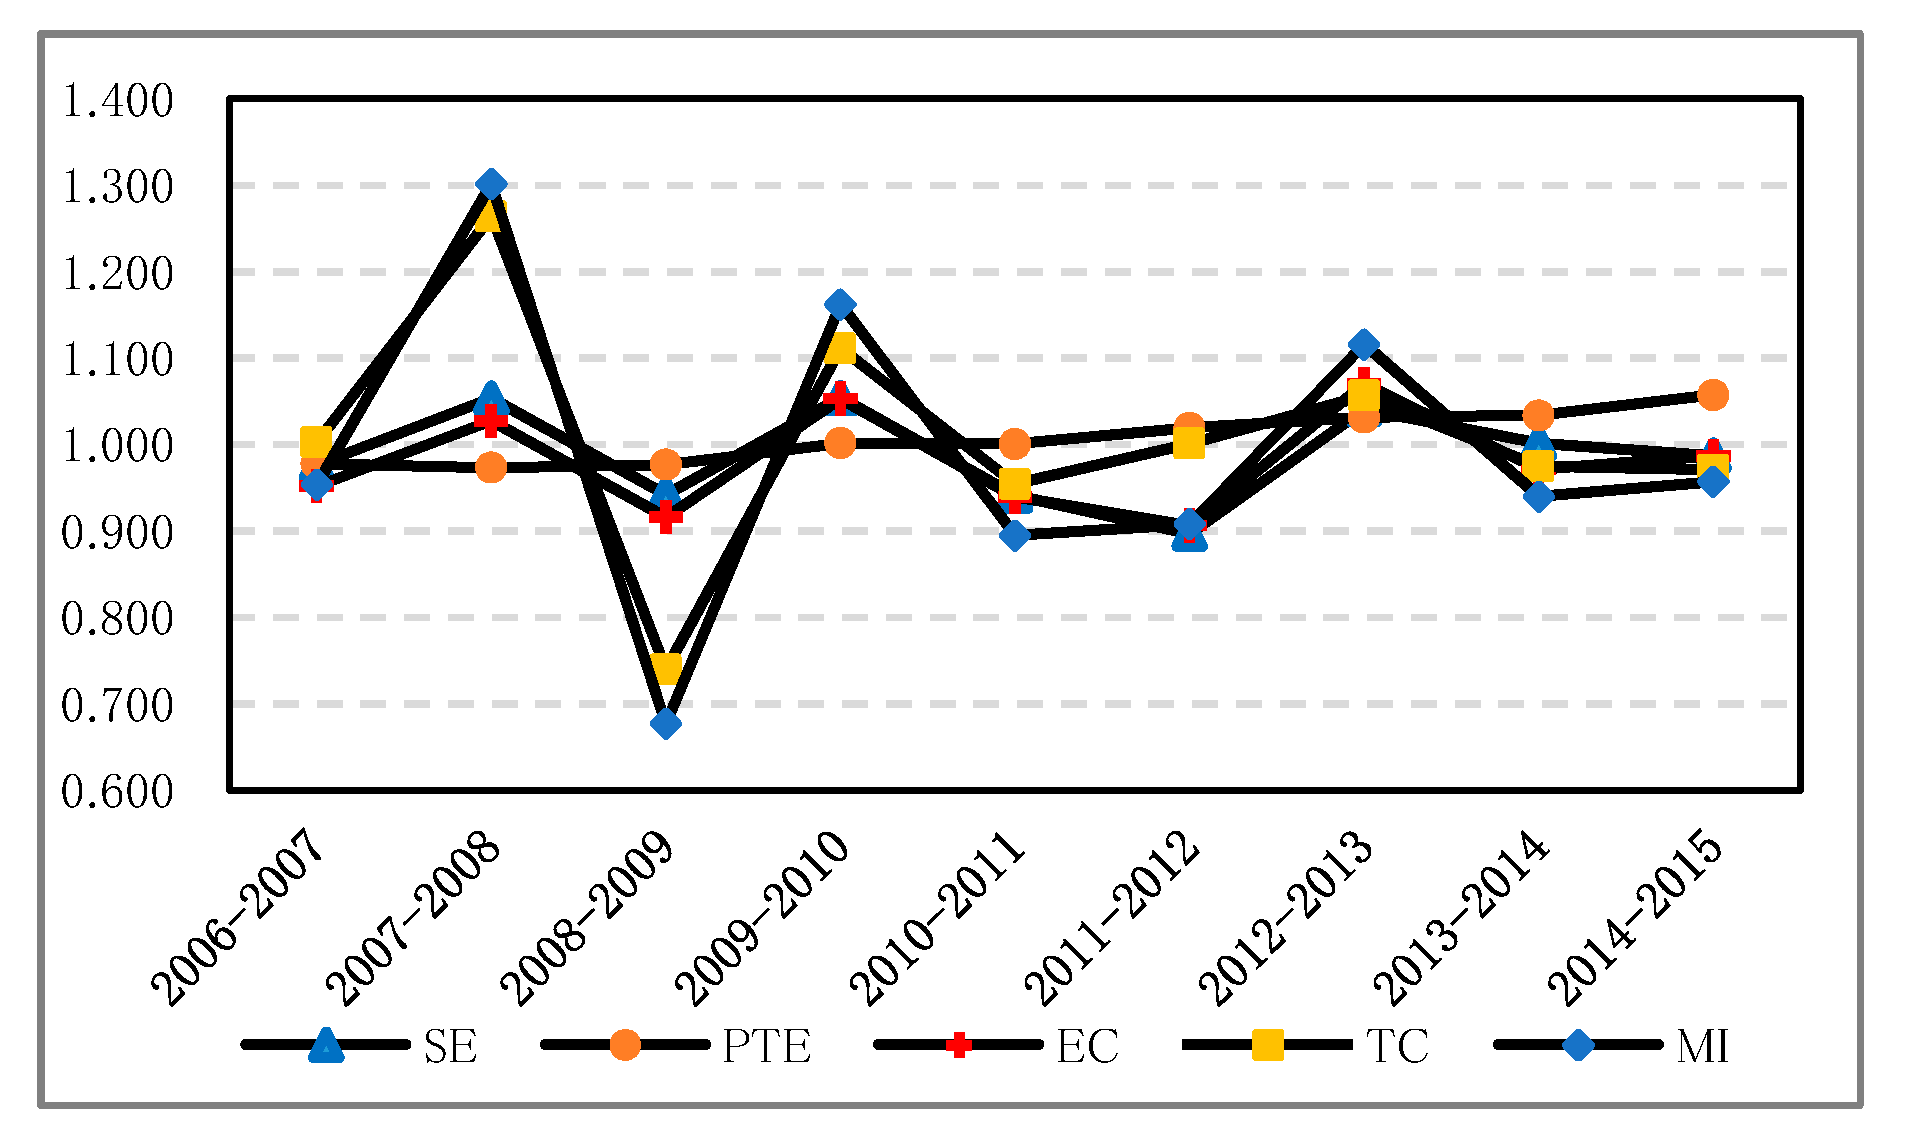
4.3.2. Result Analysis of Malmquist Total Factor Productivity Index of Spatial Cross Section
5. Discussion
6. Conclusions and Insights
Author Contributions
Funding
Acknowledgments
Conflicts of Interest
References
- Griggs, D.; Stafford-Smith, M.; Gaffney, O.; Rockström, J.; Öhman, M.C.; Shyamsundar, P.; Steffen, W.; Glaser, G.; Kanie, N.; Noble, I. Policy: Sustainable development goals for people and planet. Nature 2013, 495, 305–307. [Google Scholar] [CrossRef] [PubMed]
- Söderqvist, T.; Eggert, H.; Olsson, B. Economic Valuation for Sustainable Development in the Swedish Coastal Zone. Ambio 2005, 34, 169–175. [Google Scholar] [CrossRef] [PubMed]
- Henning, J.; Jordaan, H. Determinants of Financial Sustainability for Farm Credit Applications—A. Delphi Study. Sustainability 2016, 8, 77. [Google Scholar] [CrossRef]
- Michael, F.L.; Zainon Noor, Z.; Zardari, N.H.; Figueroa Meza, M.J. Analytical Hierarchy Process Application in Urban Sustainability Indicators Prioritization. Resour. Environ. 2013, 3, 1–5. [Google Scholar]
- Aldegheishem, A. Evaluating the Urban Sustainable Development on the Basis of AHP: A Case Study for Riyadh City. J. Sustain. Dev. 2014, 7, 113–120. [Google Scholar] [CrossRef]
- Bai, L.; Wang, H.; Shi, C.; Du, Q.; Li, Y. Assessment of SIP Buildings for Sustainable Development in Rural China Using AHP-Grey Correlation Analysis. Int. J. Environ. Res. Public Health 2017, 14, 1292. [Google Scholar] [CrossRef] [PubMed]
- Huang, M.; Wang, B. Evaluating green performance of building products based on gray relational analysis and analytic hierarchy process. Environ. Prog. Sustain. Energy 2015, 33, 1389–1395. [Google Scholar] [CrossRef]
- Zhang, N.; Gong, Z.; Yin, K.; Wang, Y. Special Issue “Decision Models in Green Growth and Sustainable Development”. Int. J. Environ. Res. Public Health 2018, 15, 1093. [Google Scholar] [CrossRef] [PubMed]
- He, X.; Wu, Y. City Sustainable Development Evaluation Based on Hesitant Multiplicative Fuzzy Information. Math. Probl. Eng. 2017, 2017, 1–9. [Google Scholar] [CrossRef]
- Lo Storto, C. Ecological efficiency based ranking of cities: A combined DEA cross-efficiency and Shannon’s entropy method. Sustainability 2016, 8, 124. [Google Scholar] [CrossRef]
- Zhao, T.; Yang, Z. Towards green growth and management: Relative efficiency and gaps of Chinese cities. Renew. Sustain. Energy Rev. 2017, 80, 481–494. [Google Scholar] [CrossRef]
- Vlontzos, G.; Niavis, S.; Manos, B. A DEA approach for estimating the agricultural energy and environmental efficiency of EU countries. Renew. Sustain. Energy Rev. 2014, 40, 91–96. [Google Scholar] [CrossRef]
- He, J.; Wan, Y.; Feng, L.; Ai, J.; Wang, Y. An integrated data envelopment analysis and emergy-based ecological footprint methodology in evaluating sustainable development, a case study of Jiangsu Province, China. Ecol. Indic. 2016, 70, 23–34. [Google Scholar] [CrossRef]
- Tang, D.; Tang, J.; Xiao, Z. Environmental regulation efficiency and total factor productivity-Effect analysis based on Chinese data from 2003 to 2013. Ecol. Indic. 2017, 73, 312–318. [Google Scholar] [CrossRef]
- Vlontzos, G.; Pardalos, P.M. Assess and prognosticate green house gas emissions from agricultural production of EU countries, by implementing, DEA Window analysis and artificial neural networks. Renew. Sustain. Energy Rev. 2017, 76, 155–162. [Google Scholar] [CrossRef]
- Cooka, W.D. Data envelopment analysis (DEA)—Thirty years on. Eur. J. Oper. Res. 2009, 192, 1–17. [Google Scholar] [CrossRef]
- Tone, K. A slacks-based measure of efficiency in data envelopment analysis. Eur. J. Oper. Res. 2001, 130, 498–509. [Google Scholar] [CrossRef]
- Andersen, P.; Petersen, N.C. A Procedure for Ranking Efficient Units in Data Envelopment Analysis. Manag. Sci. 1993, 39, 1261–1264. [Google Scholar] [CrossRef]
- Hailu, A. Nonparametric Productivity Analysis with Undesirable Outputs: Reply. Am. J. Agric. Econ. 2001, 85, 1075–1077. [Google Scholar] [CrossRef]
- Seiford, L.M.; Zhu, J. A response to comments on modeling undesirable factors in efficiency evaluation. Eur. J. Oper. Res. 2005, 161, 579–581. [Google Scholar] [CrossRef]
- Tone, K.; Tsutsui, M. Dynamic DEA: A slacks-based measure approach. Omega. 2010, 38, 145–156. [Google Scholar] [CrossRef]
- Fare, R.; Grosskopf, S.; Pasurkajr, C. Environmental production functions and environmental directional distance functions. Energy 2007, 32, 1055–1066. [Google Scholar] [CrossRef]
- Zhou, C.; Shi, C.; Wang, S.; Zhang, G. Estimation of eco-efficiency and its influencing factors in Guangdong province based on Super-SBM and panel regression models. Ecol. Indic. 2018, 86, 67–80. [Google Scholar] [CrossRef]
- Guo, H.; Zhao, Y.; Niu, T.; Tsui, K.L. Hong Kong Hospital Authority resource efficiency evaluation: Via a novel DEA-Malmquist model and Tobit regression model. PLoS ONE 2017, 12, e0184211. [Google Scholar] [CrossRef] [PubMed]
- State Statistical Bureau. China Statistical Yearbook 2007; China Statistic Press: Beijing, China, 2007. (In Chinese)
- State Statistical Bureau. China Statistical Yearbook 2008; China Statistic Press: Beijing, China, 2008. (In Chinese)
- State Statistical Bureau. China Statistical Yearbook 2009; China Statistic Press: Beijing, China, 2009. (In Chinese)
- State Statistical Bureau. China Statistical Yearbook 2010; China Statistic Press: Beijing, China, 2010. (In Chinese)
- State Statistical Bureau. China Statistical Yearbook 2011; China Statistic Press: Beijing, China, 2011. (In Chinese)
- State Statistical Bureau. China Statistical Yearbook 2012; China Statistic Press: Beijing, China, 2012. (In Chinese)
- State Statistical Bureau. China Statistical Yearbook 2013; China Statistic Press: Beijing, China, 2013. (In Chinese)
- State Statistical Bureau. China Statistical Yearbook 2014; China Statistic Press: Beijing, China, 2014. (In Chinese)
- State Statistical Bureau. China Statistical Yearbook 2015; China Statistic Press: Beijing, China, 2015. (In Chinese)
- State Statistical Bureau. China Statistical Yearbook 2016; China Statistic Press: Beijing, China, 2016. (In Chinese)
- State Statistical Bureau. China Statistical Yearbook on Environment 2007; China Statistic Press: Beijing, China, 2004. (In Chinese)
- State Statistical Bureau. China Statistical Yearbook on Environment 2008; China Statistic Press: Beijing, China, 2005. (In Chinese)
- State Statistical Bureau. China Statistical Yearbook on Environment 2009; China Statistic Press: Beijing, China, 2006. (In Chinese)
- State Statistical Bureau. China Statistical Yearbook on Environment 2010; China Statistic Press: Beijing, China, 2007. (In Chinese)
- State Statistical Bureau. China Statistical Yearbook on Environment 2011; China Statistic Press: Beijing, China, 2008. (In Chinese)
- State Statistical Bureau. China Statistical Yearbook on Environment 2012; China Statistic Press: Beijing, China, 2009. (In Chinese)
- State Statistical Bureau. China Statistical Yearbook on Environment 2013; China Statistic Press: Beijing, China, 2010. (In Chinese)
- State Statistical Bureau. China Statistical Yearbook on Environment 2014; China Statistic Press: Beijing, China, 2011. (In Chinese)
- State Statistical Bureau. China Statistical Yearbook on Environment 2015; China Statistic Press: Beijing, China, 2012. (In Chinese)
- State Statistical Bureau. China Statistical Yearbook on Environment 2016; China Statistic Press: Beijing, China, 2013. (In Chinese)
- State Statistical Bureau. China Energy Statistical Yearbook 2007; China Statistic Press: Beijing, China, 2014. (In Chinese)
- State Statistical Bureau. China Energy Statistical Yearbook 2008; China Statistic Press: Beijing, China, 2014. (In Chinese)
- State Statistical Bureau. China Energy Statistical Yearbook 2009; China Statistic Press: Beijing, China, 2014. (In Chinese)
- State Statistical Bureau. China Energy Statistical Yearbook 2010; China Statistic Press: Beijing, China, 2014. (In Chinese)
- State Statistical Bureau. China Energy Statistical Yearbook 2011; China Statistic Press: Beijing, China, 2014. (In Chinese)
- State Statistical Bureau. China Energy Statistical Yearbook 2012; China Statistic Press: Beijing, China, 2014. (In Chinese)
- State Statistical Bureau. China Energy Statistical Yearbook 2013; China Statistic Press: Beijing, China, 2014. (In Chinese)
- State Statistical Bureau. China Energy Statistical Yearbook 2014; China Statistic Press: Beijing, China, 2014. (In Chinese)
- State Statistical Bureau. China Energy Statistical Yearbook 2015; China Statistic Press: Beijing, China, 2014. (In Chinese)
- State Statistical Bureau. China Energy Statistical Yearbook 2016; China Statistic Press: Beijing, China, 2014. (In Chinese)


| Processing Method | Representative Figure | Evaluation | |
|---|---|---|---|
| 1 | Undesirable output is regarded as an input variable | Hailu et al. (2001) [19] | The disadvantage of treating undesirable outputs as input variables is that the method is inconsistent with reality production process. |
| 2 | Multiplying undesired output by −1 | Seiford et al. (2005) [20] | The problem of undesirable output is better solved, but under the influence of strong convexity constraint, the method can only be evaluated in the case of variable scale returns. |
| 3 | Non-radial treatment | Tone (2010) [21] | It effectively solves the problem of non-desirable output and improves the accuracy of evaluation. However, when there are multiple DMU effective, it is difficult to further evaluate the effective DMU. |
| 4 | Distance function method | Fare et al. (2007) [22] | It effectively solves the problem of undesirable outputs but cannot measure input and output slack variables. |
| Type | First Level Index | Second Level Index | Third Level Index |
|---|---|---|---|
| Input | Natural resource consumption (X1) | Land (X11) | Land area per capita (X111) |
| Water (X12) | Per capita water consumption (X121) | ||
| Energy (X13) | Total energy consumption per capita (X131) | ||
| Social resource consumption (X2) | Capital (X21) | Investment in environmental pollution control accounts for GDP share (X211) | |
| Investment in fixed assets per capita (X212) | |||
| Labor (X22) | Employment ratio (X221) | ||
| Desirable output | Social development (Y1) | Urban development (Y11) | Urban road area per capita (Y111) |
| Green coverage area per capita (Y112) | |||
| Urban area per capita (Y113) | |||
| Urban population ratio (Y114) | |||
| Education, technology, culture and health care (Y12) | Three kinds of patent authorization per capita in China (Y121) | ||
| Number of health workers per 10000 people (Y122) | |||
| Consumption of education, culture and entertainment per capita (Y123) | |||
| Number of full-time teachers in Colleges and universities per ten thousand people (Y124) | |||
| Social Security (Y13) | Basic old-age insurance coverage ratio (Y131) | ||
| Unemployment insurance coverage ratio (Y132) | |||
| Insurance ratio of medical insurance for urban employees (Y133) | |||
| Insurance ratio of industrial injury insurance (Y134) | |||
| Birth insurance coverage ratio (Y135) | |||
| Living Standards (Y14) | consumption expenditure per capita (Y141) | ||
| Disposable income per capita (Y142) | |||
| Economic development (Y2) | Economic Growth (Y21) | GDP growth rate (Y211) | |
| Economic Structure (Y22) | Third industry share (Y221) | ||
| Economic Scale (Y23) | GDP per capita (Y231) | ||
| Undesirable output | Pollution, disasters and accidents (Y3) | Water Pollution (Y31) | Wastewater discharge per capita (Y311) |
| Air Pollution (Y32) | SO2 emissions per capita (Y321) | ||
| Smoke and dust emissions per capita (Y322) | |||
| Natural Disasters (Y33) | Direct economic losses natural disasters per capita (Y331) | ||
| Traffic Accidents (Y34) | Direct economic loss traffic accident per capita (Y341) |
| Index | X11 | X12 | X13 | X21 | X22 | Y11 | Y12 | Y13 | Y14 | Y21 | Y22 | Y23 |
| Objective weight | 0.689 | 0.168 | 0.143 | 0.179 | 0.821 | 0.251 | 0.248 | 0.249 | 0.252 | 0.334 | 0.336 | 0.331 |
| Subjective weight | 0.200 | 0.350 | 0.450 | 0.500 | 0.500 | 0.250 | 0.250 | 0.250 | 0.250 | 0.300 | 0.300 | 0.400 |
| Final Weight | 0.528 | 0.225 | 0.247 | 0.179 | 0.821 | 0.251 | 0.248 | 0.249 | 0.252 | 0.301 | 0.302 | 0.397 |
| Index | Y31 | Y32 | Y33 | Y34 | X111 | X121 | X131 | X211 | X212 | X221 | Y111 | Y112 |
| Objective weight | 0.116 | 0.102 | 0.435 | 0.346 | 1.000 | 1.000 | 1.000 | 0.648 | 0.352 | 1.000 | 0.205 | 0.428 |
| Subjective weight | 0.250 | 0.250 | 0.250 | 0.250 | 1.000 | 1.000 | 1.000 | 0.200 | 0.800 | 1.000 | 0.200 | 0.200 |
| Final Weight | 0.116 | 0.102 | 0.435 | 0.346 | 1.000 | 1.000 | 1.000 | 0.315 | 0.685 | 1.000 | 0.173 | 0.361 |
| Index | Y113 | Y114 | Y121 | Y122 | Y123 | Y124 | Y131 | Y132 | Y133 | Y134 | Y135 | Y141 |
| Objective weight | 0.314 | 0.054 | 0.032 | 0.555 | 0.310 | 0.103 | 0.195 | 0.203 | 0.168 | 0.223 | 0.210 | 0.469 |
| Subjective weight | 0.300 | 0.300 | 0.200 | 0.300 | 0.200 | 0.300 | 0.200 | 0.200 | 0.200 | 0.200 | 0.200 | 0.500 |
| Final Weight | 0.398 | 0.068 | 0.024 | 0.626 | 0.233 | 0.116 | 0.195 | 0.203 | 0.168 | 0.223 | 0.210 | 0.469 |
| Index | Y142 | Y211 | Y221 | Y232 | Y311 | Y321 | Y322 | Y331 | Y341 | |||
| Objective weight | 0.531 | 1.000 | 1.000 | 1.000 | 1.000 | 0.749 | 0.251 | 1.000 | 1.000 | |||
| Subjective weight | 0.500 | 1.000 | 1.000 | 1.000 | 1.000 | 0.600 | 0.400 | 1.000 | 1.000 | |||
| Final weight | 0.531 | 1.000 | 1.000 | 1.000 | 1.000 | 0.818 | 0.182 | 1.000 | 1.000 |
| Input Redundancy Rate (%) | Desirable Output Insufficiency Rate (%) | Undesirable Output Redundancy Rate (%) | |||
|---|---|---|---|---|---|
| Natural Resource Consumption | Social Resource Consumption | Social Development | Economic Development | Pollution, Disasters and Accidents | |
| Jiangxi | −110.98 | 0.00 | 35.99 | 0.00 | −342.79 |
| Hubei | −90.53 | 0.00 | 34.14 | 0.00 | −329.21 |
| Yunnan | −117.71 | 0.00 | 17.34 | 0.00 | −179.79 |
| Anhui | −57.24 | 0.00 | 10.60 | 0.00 | −384.73 |
| Jiangsu | −47.76 | −3.61 | 4.52 | 0.00 | −310.94 |
| Zhejiang | −16.02 | −16.53 | 0.00 | 10.79 | −456.50 |
| Chongqing | −35.95 | −1.01 | 27.23 | 0.00 | −93.15 |
| Hunan | −29.13 | 0.00 | 10.66 | 0.00 | −239.66 |
| Period | SEC | PTEC | EC | TC | TFPC |
|---|---|---|---|---|---|
| 2006–2007 | 0.976 | 0.978 | 0.952 | 1.003 | 0.953 |
| 2007–2008 | 1.053 | 0.973 | 1.027 | 1.264 | 1.301 |
| 2008–2009 | 0.942 | 0.977 | 0.916 | 0.740 | 0.677 |
| 2009–2010 | 1.054 | 1.001 | 1.053 | 1.111 | 1.162 |
| 2010–2011 | 0.941 | 1.001 | 0.939 | 0.954 | 0.895 |
| 2011–2012 | 0.897 | 1.019 | 0.906 | 1.001 | 0.908 |
| 2012–2013 | 1.041 | 1.031 | 1.070 | 1.056 | 1.116 |
| 2013–2014 | 1.002 | 1.034 | 0.971 | 0.974 | 0.940 |
| 2014–2015 | 0.987 | 1.057 | 0.987 | 0.970 | 0.957 |
| mean | 0.988 | 1.008 | 0.980 | 1.008 | 0.990 |
| 2006–2007 | 2010–2011 | |||||||||
| SEC | PTEC | EC | TC | TFPC | SEC | PTEC | EC | TC | TFPC | |
| Anhui | 1.086 | 0.913 | 0.992 | 0.998 | 0.990 | 0.994 | 0.990 | 0.985 | 0.912 | 0.898 |
| Guizhou | 0.938 | 1.073 | 1.006 | 0.983 | 0.989 | 1.095 | 0.882 | 0.967 | 0.935 | 0.904 |
| Hubei | 1.005 | 1.010 | 1.015 | 0.994 | 1.010 | 0.936 | 0.916 | 0.858 | 0.946 | 0.811 |
| Hunan | 1.159 | 0.865 | 1.003 | 1.026 | 1.029 | 0.957 | 0.864 | 0.827 | 0.972 | 0.804 |
| Jiangsu | 0.959 | 0.983 | 0.943 | 1.004 | 0.946 | 0.989 | 0.937 | 0.927 | 0.998 | 0.925 |
| Jiangxi | 0.956 | 0.975 | 0.932 | 1.025 | 0.955 | 0.903 | 1.037 | 0.936 | 0.981 | 0.918 |
| Shanghai | 1.052 | 1.009 | 1.062 | 0.943 | 1.001 | 0.997 | 1.044 | 1.041 | 0.941 | 0.980 |
| Sichuan | 0.995 | 0.967 | 0.963 | 1.019 | 0.981 | 0.940 | 1.064 | 1.000 | 0.956 | 0.956 |
| Yunnan | 0.662 | 0.977 | 0.647 | 1.018 | 0.658 | 0.943 | 1.195 | 1.127 | 0.947 | 1.067 |
| Zhejiang | 0.986 | 0.979 | 0.965 | 1.020 | 0.984 | 0.722 | 0.987 | 0.713 | 1.004 | 0.716 |
| Chongqing | 0.939 | 1.005 | 0.944 | 1.001 | 0.944 | 0.875 | 1.089 | 0.952 | 0.905 | 0.862 |
| mean | 0.976 | 0.978 | 0.952 | 1.003 | 0.953 | 0.941 | 1.001 | 0.939 | 0.954 | 0.895 |
| 2014–2015 | Mean | |||||||||
| SEC | PTEC | EC | TC | TFPC | SEC | PTEC | EC | TC | TFPC | |
| Anhui | 0.934 | 0.924 | 0.863 | 0.968 | 0.835 | 0.963 | 0.992 | 0.956 | 0.995 | 0.959 |
| Guizhou | 0.875 | 1.177 | 1.030 | 0.982 | 1.011 | 1.013 | 1.008 | 1.004 | 0.981 | 0.973 |
| Hubei | 0.969 | 1.096 | 1.062 | 0.955 | 1.014 | 0.970 | 0.963 | 0.936 | 1.012 | 0.954 |
| Hunan | 0.994 | 0.881 | 0.875 | 0.995 | 0.871 | 0.994 | 0.994 | 0.986 | 0.971 | 0.959 |
| Jiangsu | 0.983 | 1.073 | 1.055 | 0.944 | 0.995 | 0.988 | 0.978 | 0.967 | 1.064 | 1.034 |
| Jiangxi | 0.960 | 1.030 | 0.989 | 0.952 | 0.941 | 0.959 | 1.004 | 0.963 | 1.019 | 0.980 |
| Shanghai | 1.656 | 0.506 | 0.838 | 0.990 | 0.829 | 1.038 | 1.093 | 1.037 | 1.039 | 1.059 |
| Sichuan | 1.002 | 0.968 | 0.970 | 1.001 | 0.971 | 1.016 | 1.040 | 1.047 | 0.943 | 0.978 |
| Yunnan | 0.664 | 1.692 | 1.124 | 0.994 | 1.117 | 0.962 | 1.045 | 0.985 | 0.987 | 1.011 |
| Zhejiang | 0.999 | 0.985 | 0.983 | 0.964 | 0.948 | 1.006 | 0.957 | 0.951 | 1.046 | 0.996 |
| Chongqing | 0.822 | 1.297 | 1.067 | 0.931 | 0.993 | 0.958 | 1.013 | 0.959 | 1.033 | 0.986 |
| mean | 0.987 | 1.057 | 0.987 | 0.970 | 0.957 | 0.988 | 1.008 | 0.980 | 1.008 | 0.990 |
© 2018 by the authors. Licensee MDPI, Basel, Switzerland. This article is an open access article distributed under the terms and conditions of the Creative Commons Attribution (CC BY) license (http://creativecommons.org/licenses/by/4.0/).
Share and Cite
Li, Z.; Tang, D.; Han, M.; Bethel, B.J. Comprehensive Evaluation of Regional Sustainable Development Based on Data Envelopment Analysis. Sustainability 2018, 10, 3897. https://doi.org/10.3390/su10113897
Li Z, Tang D, Han M, Bethel BJ. Comprehensive Evaluation of Regional Sustainable Development Based on Data Envelopment Analysis. Sustainability. 2018; 10(11):3897. https://doi.org/10.3390/su10113897
Chicago/Turabian StyleLi, Zhijiang, Decai Tang, Mang Han, and Brandon J. Bethel. 2018. "Comprehensive Evaluation of Regional Sustainable Development Based on Data Envelopment Analysis" Sustainability 10, no. 11: 3897. https://doi.org/10.3390/su10113897
APA StyleLi, Z., Tang, D., Han, M., & Bethel, B. J. (2018). Comprehensive Evaluation of Regional Sustainable Development Based on Data Envelopment Analysis. Sustainability, 10(11), 3897. https://doi.org/10.3390/su10113897