Abstract
The issue concerning the increasing research and development (R&D) investment in emerging markets is especially attractive for many researchers and practitioners. This paper measures and compares the characteristics of Chinese and South Korean R&D expenditures of manufacturing companies from 2012 to 2016. It also examines the impact of R&D investment on firm performance. The results show that debt maturity and cash reserves are positive determinants of R&D investment in China and South Korea. Firm size, internal financing, and debt ratio are restrictive factors of R&D intensity in Chinese manufacturing companies, while debt ratio is the only negative determinant of R&D investment in their South Korean counterparts. The results also show that R&D intensity exhibits a strong positive impact on the performance of manufacturing companies in both countries. Moreover, this impact is stronger in South Korea than in China. In addition, R&D investment has a positive time-lag effect only on the performance of Chinese manufacturing companies. Our study presents some new evidence for the relationship between R&D intensity and firm performance in emerging markets.
1. Introduction
The manufacturing industry in emerging markets has been facing numerous issues, such as sustainability, because of changes in the landscape of global manufacturing [1]. Innovation is a new driving force for manufacturing firms to obtain competitive advantages in today’s dynamic environment characterized by fast changes in customers, technologies, and competition [2,3]. In general, large companies spend substantial amounts of money on research and development (R&D) activities in order to obtain competitive advantages, which leads to higher operating performance [4]. Furthermore, it seems that R&D investment can bring greater benefits during an economic crisis. R&D-intensive firms are probably less sensitive to external shocks, since their products are not easily substituted with other cheaper alternatives.
According to the Morgan Stanley Capital International (MSCI) Emerging Markets Indexes [5], China and South Korea are emerging markets in Asia [6,7,8]. From the 2016 edition of the European Union (EU) Industrial R&D Investment Scoreboard released by the Economics of Industrial Research and Innovation (IRI), we get to know that Chinese companies continued to show the best performance with regard to R&D growth (up by 24.7%), but also presented a significant decrease in net sales (−6.2%), and South Korean companies showed a more modest R&D growth and also a slight decrease in net sales [9]. Based on the resource-based view (RBV) [10], innovation is the result of unique resources and the accumulation of knowledge. Since the firm’s internal resources (both tangible and intangible) are limited, it is reasonable for a firm to optimally allocate their resources in order to achieve a sustainable competitive advantage. The effective allocation of a firm’s research resources has been one of the hottest issues in both academic and practical circles. In terms of practical applications, exploring the relationship between R&D intensity and firm performance is important, because an explicit association helps us justify R&D subsidy policies for the firms. In addition, Asia’s emerging economies have relatively incomplete and imperfect financial systems and capital markets compared with developed countries, which leads to difficulties in financing R&D projects [11]. An absence of studies pertaining to the determinants of R&D investment in the context of emerging economies is the primary motivation for this paper.
The objective of this paper is to analyze and compare the factors that may affect R&D investment in China’s and South Korea’s manufacturing industries, and test whether R&D investment contributes to firm performance in these two emerging countries. Our focus on the manufacturing industry is because the manufacturing industry is the main driving force of economic growth in these two countries [12,13]. In the context of Industry 4.0 [14] many manufacturing firms suffer to a great extent from fierce international competition, and R&D investment may provide the critical resources to successfully compete against incumbent firms [4,15]. Given the importance of R&D investment, it is worthwhile to identify the determinants of firms’ R&D investments. Also, the characteristics of R&D investment in emerging markets have attracted greater interest from scholars [16,17].
We are interested in the following research questions. (1) What are the determinants of R&D investment in emerging markets? (2) How do these determinant factors affect R&D investment activities? (3) What is the impact of R&D intensity on the firm’s performance in emerging markets? (4) Are there any differences in the performance of R&D intensity between the two emerging countries? As far as we know, little effort has been made to comprehensively examine the determinants of R&D investment and its impact on firm performance in emerging markets. It is necessary to measure R&D efficiency in our China–Korea comparative study. To do so, we consider two samples in the manufacturing industry: 960 Chinese companies, and 211 Korean companies.
The contributions of this paper are as follows. First, the extant literature has focused on the determinants of R&D investment only in one country or region, and little research has been done on any comparison across countries. This paper examines the factors that may have an influence on R&D investment in China and South Korea for the first time. Second, we test whether R&D investment contributes to a firm’s performance in emerging markets. A large body of literature has largely focused on the empirical practices in the United States (US), which is a developed and leading country. Clearly, our study will enrich and extend the empirical studies on the effect of R&D investment on firm performance in emerging markets. Third, identifying R&D determinants can help corporate managers and decision makers understand how funds can be raised for R&D investment and provide valuable information for developing strategies efficiently and allocating limited resources reasonably.
The remainder of this paper is structured as follows. Section 2 describes the development of the manufacturing industry in China and South Korea. This is followed by Section 3, which reviews previous studies and develops a set of hypotheses. Section 4 presents the methodology used in the study. Section 5 presents the statistical estimation results of the study. Section 6 discusses the results. Finally, the conclusions are discussed in Section 7.
2. Manufacturing Industry in China and South Korea
2.1. Manufacturing Industry in China
China, the largest emerging market [18] is in the catching-up stage and is experiencing a rapid increase in R&D intensity. The manufacturing industry is the main body and pillar of China’s economy [19,20]. In 2017, manufacturing accounted for 36% of China’s gross domestic product (GDP). In 2015, China’s State Council issued a 10-year national plan, Made in China 2025, aiming to transform China from a manufacturing giant into a world manufacturing power. The plan was the country’s first action plan focusing on promoting manufacturing. To promote manufacturing and national competitiveness, it is important to mobilize every conceivable element to stimulate innovation rather than simply support a single industry.
China’s spending on R&D accounted for 2.1% of GDP in 2016, which lagged far behind that of South Korea, Japan, the US, and Europe. According to the China Statistical Yearbook on Science and Technology, the total amount of R&D expenditure in the manufacturing industry increased from 569.53 billion yuan (71.86 billion euros) in 2011 to 1058.03 billion yuan (133.49 billion euros) in 2016.
In recent years, China’s manufacturing industry has experienced large-scale technical innovation and industrial upgrading. However, compared with developed countries such as the US, there still exists a very large gap in several areas such as independent innovation capacity, resource utilization efficiency, and industrial structural level [21]. Particularly, in the process of economic transformation, China’s manufacturing industry faces internal pressures such as insufficient scientific and technological innovation, low energy efficiency, serious environmental pollution, and rising labor costs. Also, the Chinese government announced a series of policies (e.g., tax reduction and government subsidies) to encourage manufacturing companies to make substantial and continuous investments in R&D activities [22,23].
2.2. Manufacturing Industry in South Korea
According to the report by the Korea Institute for Industrial Economics and Trade (KIET) in 2012 [24], about 20% of all of the companies that were surveyed had overseas investment, and 46% had investment plans in the future. In terms of industry, a majority of companies intended to make investments in the electronics industry. Regarding region, China and ASEAN attracted most investors’ interest. In the context of Industry 4.0, overseas movements from Korean manufacturers have been rapidly increasing in the manufacturing industry where price competitiveness has weakened.
In June 2014, the Korean government announced the Manufacturing Innovation 3.0 strategy to upgrade competitiveness in the manufacturing industry and boost the general economy by raising new industries and increasing innovative investment and export [25]. In 2016, R&D expenditure represented about 4.227% of GDP compared to 2.337% in OECD countries and 3.141% in Japan, which ranked second in the world [26]. However, Samsung Electronics Co., Ltd., the largest Korean manufacturing company, has suffered a decline in performance facing the fierce competition in the international market. It has been reported that the R&D intensity of the top 10 Korean companies, such as Samsung Electronics Co., Ltd. and LG Electronics Inc., has begun to decline since 2017 [27]. Small and medium-sized enterprises (SMEs) do not have substantial opportunities for growth compared with globally competitive big companies [28]. The intensity of the R&D expenditure of SMEs is relatively low due to the biased R&D structure [28].
In the context of R&D incentives, the Korean manufacturing companies need to make continuous investment in R&D activities associated with high returns, which is a guarantee of future success and sustainable development.
3. Literature Review and Hypotheses Development
3.1. Determinants of R&D Investment
The revenue of manufacturing firms mainly depends on new technologies and new products. The R&D activities of manufacturing firms are characterized by a very long period of technological development and a high level of risk [29]. Unlike tangible assets (e.g., plant and equipment), the intangible assets created by R&D investment are quite difficult to evaluate. Since it takes quite a long time to create intangible assets in the process of R&D activities, small firms with limited resources generally have less capability to implement large-scale R&D programs. Even if it is frequently noted that start-up companies begin their activities with a total focus on a specific field, research diversification quickly becomes a necessity [30].
In terms of firm size, early studies [31,32,33] have shown that there is no relationship between firm size and innovation capability. Subsequently, Link [34] and Meisel and Lin [35] found a positive relation between firm size and R&D expenditures. Recently, a study conducted by Chiang and Mensah [36] showed that R&D spending is more valuable for firms with larger market shares. Based on an analysis of the top 100 companies of the Chinese electronic and information industry, the findings of Wang [37] suggested that the bigger the firm, the more investments in R&D. In addition, Mishra [38], Xu et al. [39], An and Wang [40], and Choi and Lee [41] also drew the same conclusion. Another study by Khoshnevis and Teirlinck [42] showed that large firms present a higher average scale efficiency and technical efficiency, while small-sized firms suffer from scale and technical inefficiency. These findings provide evidence that large firms tend to invest more in R&D activities. Based on the above considerations, we formulate the following hypothesis:
Hypothesis 1 (H1).
Firm size has a positive impact on R&D investment.
Corporate capital structure can create firm value, and firms usually tap the cheapest source of funds, which is normally debt. However, for funding R&D projects, firms tend to use equity mainly because future cash flows are uncertain and may not be available to pay back long-term debt [15]. Moreover, since the competition is fierce in the manufacturing industry, manufacturing companies should limit the use of too much debt to avoid the risk of default. Highly leveraged firms are likely to face financial constraints and high default risk, which should curb the funds in their R&D investment. On the one hand, a firm’s R&D activities usually face higher risk. On the other hand, companies with high leverage are also facing a higher risk of bankruptcy, so it is beneficial for these companies to use internal funds and equity financing to support innovative investments rather than debt financing.
In terms of debt financing and R&D investment, the empirical evidence is mixed. A majority of studies show the negative effect of debt on R&D investment [15,43,44,45,46]. Others show that debt financing encourages R&D investment [47,48].
Relating to the composition of debt, firms are more likely to use long-term debt with a corresponding horizon of R&D investments rather than short-term debt when R&D projects cannot be funded internally [15]. Bank loans are a key aspect of the long-term funding sources. In addition, if firms with high levels of R&D investments resort to debt financing, they should preferably use long-term debt for which the principal is repaid only after several years. Therefore, we come to the following two hypotheses:
Hypothesis 2 (H2).
High debt ratio has a negative impact on R&D investment.
Hypothesis 3 (H3).
There is a positive relationship between long-term loans and R&D investment.
The sensitivity of investment to the availability of internal cash flow has been a topic of the largest empirical studies in corporate finance. Many studies have found a positive relationship between R&D investment and internal funds, which suggests the existence of financial constraints due to the difference between the costs of internal and external funds [48,49,50,51,52,53,54]. For instance, Grabowski and Vernon [50] argued that cash flow is an important variable of the R&D intensity of 11 US drug firms during 1974–1994, which was characterized by a rapid growth in industry R&D expenditures. Using a sample of 15 pharmaceutical firms, Mahlich and Roediger-Schluga [53] also found that R&D intensity is positively related to internal cash flows. Indeed, most firms prefer to use internal resources to finance investment, because internal finance is cheaper than external finance due to the imperfect capital markets [49].
With a series of R&D incentive policies and government subsidies, manufacturing companies may depend less on internal cash flows to finance their private R&D projects. More generally, firms that can easily borrow from the bank should have a lower cost of external funds. As a result, R&D investment should depend less on internal cash flows. Using a sample of 291 Japanese pharmaceutical firms, Nivoix and Nguyen [30] found that R&D investment has no correlation with internal cash flows because the Japanese financing system relies on bank financing. This leads to the following research hypothesis:
Hypothesis 4 (H4).
Internal cash flows have no impact on R&D investment.
It is generally believed that R&D occurs mostly when firms have more cash flow on hand. A bigger cushion of cash appears to have a positive effect on R&D investment. Firms with low cash balances are certain to experience great difficulties in achieving their full development, especially related to R&D investment. Nivoix and Nguyen [30] found that R&D-intensive firms tend to hold more cash. Chuang [55] found that Korean firms actively utilized cash holdings for R&D activities during the 2008 financial crisis, and accumulated cash briefly after the crisis. This leads to the following hypothesis:
Hypothesis 5 (H5).
Cash holding has a positive impact on R&D investment.
The sixth hypothesis is about the potential of sales growth. When a firm has the potential to create more profit than its competitors, it tends to make a greater effort to increase growth by maintaining the competitive advantage [56]. This generally results in increasing R&D investment. Thus, the potential of growth is likely to have a positive effect in R&D activities. Moreover, demand growth can result in optimistic expectations, relax liquidity constraints, and allow firms to profit from economics of scale, encouraging firms to innovate.
A number of studies [48,56,57,58,59,60] conclude that market growth is a fundamental determinant of firms’ innovation activities. For example, by analyzing the sample of Korean manufacturing firms, Lee [48] pointed out that sales growth positively affects R&D investment. Lee and Hwang [56] collected data on Korean firms in information technology (IT) and non-IT industries, and also found a positive correlation between growth potential and R&D investment. Therefore, we come to the following hypothesis:
Hypothesis 6 (H6).
Sales growth rate has a positive impact on R&D investment.
South Korea is superior to China in the extent of its economic development and technology manufacturing [61]. South Korea has a relationship between competition and cooperation, and has a dominating position in the high-tech and machinery-related manufacturing industries [62]. Additionally, China and South Korea have some differences in their national culture and institutional systems, which to a great extent lead to differences in corporate governance and management style. Lai et al. [61] found that due to differences in cultural background and national spirit, there are some differences in the decisions and viewpoints regarding R&D investment in Taiwan, Japan, and Korea. This leads to our seventh hypothesis:
Hypothesis 7 (H7).
The determinants of R&D investment are different in China and South Korea.
3.2. Effect of R&D Investment on Firm Performance
The literature highlights the importance of R&D for the performance of firms in general [63,64]. In general, R&D investment can create an intangible asset, which will positively impact a firm’s profit. Regarding the role of profitability, a positive effect from R&D investment is expected. For example, with financial data from 25 chemical firms, Reynard [65] showed that a decrease in net profit is statistically significantly related to a decrease in R&D investment. An early study conducted by Hirschey and Weygandt [66] showed that Tobin’s Q values are cross-sectionally correlated with R&D intensity. Subsequently, Megna and Klock [67], taking 11 US firms in the semiconductor industry as a sample, argued that R&D investments are associated with higher firm value. Baek [68] confirmed that R&D investment can increase Korean firm’s sales. Lev and Sougiannis [69] demonstrated that R&D investment is associated with an increase in earnings. Based on the analysis of 550 Korean listed firms in 2004, Cho et al. [28] developed a parsimonious model, and found that R&D investment positively affects firm performance when measured by productivity, profits, growth rates, the number of patent applications, and the market value of the price earnings ratio. Filatotchev and Piesse [15] argued that a high level of R&D input contributes to the growth of newly listed firms. Using the panel data of China’s electronics manufacturing firms, Zhu et al. [70] found that R&D intensity exhibits a strong impact on the firm’s performance, as measured by return on sales (ROS) and return on assets (ROA).
However, the relationship between profitability and R&D intensity is still complicated. Firms with low profits may still make investments in private R&D to ensure the development of new products. Conversely, firms with high profitability may not always lead to a higher level of R&D.
For a firm to survive in a Schumpeterian world, simply producing a given set of outputs while employing a given set of inputs with a given technology is not enough [71]. It is not possible for a firm with high profitability to reduce its R&D investment in the long run. Successful firms in the long run must develop innovation capabilities and profit from them [72]. Based on the arguments above, we propose the following hypotheses:
Hypothesis 8 (H8).
R&D investment has a positive impact on firm performance.
Hypothesis 9 (H9).
The impact of R&D investment on firm performance is different in China and South Korea.
In terms of the lagged effect of R&D investment, Falk [73] carried out a study in Austria, and revealed that R&D intensity had a significant and positive impact on sales growth over the subsequent two years. Xu and Jin [74] empirically found that R&D investment has a one-year lagged positive effect on profit margin in China’s Internet of Things industry. A study by Xu et al. [75] also showed that R&D investment has a significant short-term lagged effect on firm value, as measured by Tobin’s Q. Lee and Choi [76] conducted a study on Korean pharmaceutical firms and observed that the impact of the R&D intensities of the previous two and five years (t-2 and t-5, respectively) in terms of firm value were significant. Therefore, we come to the following hypotheses:
Hypothesis 10 (H10).
R&D investment has a positive lagged effect on firm performance.
Hypothesis 11 (H11).
The lagged effect of R&D investment on firm performance is different in China and South Korea.
4. Methodology
4.1. Sample
The analysis was carried out using all of the manufacturing companies listed on the Shenzhen and Shanghai Stock Exchange and the Korean Stock Exchange over the period 2012–2016. In 2012, all listed companies were required by the China Securities Regulatory Commission (CSRC) to disclose detailed information about R&D expenditure in the annual financial statements. However, in 2011, the Korean government adopted K-IFRS and required every listed company to generate their financial reports based on new accounting standards. Therefore, the year 2012 is selected as the starting point. We excluded companies without R&D activities for five consecutive years, companies with missing data, and the companies that were listed after 2012. For Chinese manufacturing listed companies, we also eliminated companies issuing other kinds of shares, like B, H, S, etc. Market value for those companies is different from companies with only A-shares. For Korean manufacturing listed companies, companies without December fiscal year-ends were excluded. As a result, our final sample was 960 Chinese manufacturing companies and 211 Korean manufacturing companies, which gave a total number of 4800 observations and 1055 observations, respectively. Chinese data were sourced from the China Stock Market & Accounting Research (CSMAR) database and Korean data were sourced from the Data Guide database For facilitating comparison between the two countries, we convert Korean Won to Chinese Yuan by using the Chinese official intermediate exchange rate by the end of each year. On the basis of the literature [27,37,41,70,77,78,79,80], ordinary least squares (OLS) is used to test the linear relationship between our dependent and independent variables.
4.2. Variables
Guided by the studies [66,67,75,81,82,83], Tobin’s Q ratio (TQ) is used to measure the firm’s performance.
We consider R&D intensity (RD), which is an indicator that has also been used in other studies [20,27,30,48,78,84,85,86] dedicated to analyzing R&D investment.
As do other studies [16,20,30,70,80,81,85,87,88,89], we consider the factors that have an influence on R&D expenditures. Firm size is measured by two variables: SIZE is the log of total assets, and SALE is the log of sales. Cash flow is gauged by earnings before interest, taxes and depreciation over total sales (CFS). Strength in the capital structure is measured by the ratio of total liabilities to total assets (LEV) and the proportion of long-term loans (MATU). A firm’s liquidity is measured by the ratio of cash and equivalent to total assets (CASH). GROW is measured by the sales growth rate. Finally, a year dummy is introduced to control for changes in the economic environment. Table 1 presents the definitions of the variables.

Table 1.
Definition of Variables. R&D: research and development.
4.3. Model Specification
For H1, H2, H3, H4, H5, H6, and H7, we employ model (1) to investigate the determinants of R&D investment:
RDi,t = β0 + β1SIZEi,t (SALEi,t) + β2LEVi,t + β3MATUi,t + β4CFSi,t +β5CASHi,t + β6GROWi,t + Year + ɛi,t
To test H8 and H9, model (2) is carried out to examine the relationship between R&D investment and firm performance:
TQi,t = β0 + β1RDi,t + β2SIZEi,t (SALEi,t) + β3LEVi,t + β4MATUi,t +β5CFSi,t + β6CASHi,t + β7GROWi,t + Year + ɛi,t
To test H10 and H11, we use model (3) to examine the lagged effect of R&D investment:
where i = 1,… n and t = 1,… t represent the firm and year, respectively; β0, β1, β2, β3, β4, β5, β6, and β7 are the presumed parameters; and ɛ denotes the measurement error term.
TQi,t = β0 + β1RDi,t-n + β2SIZEi,t (SALEi,t) + β3LEVi,t + β4MATUi,t +β5CFSi,t + β6CASHi,t + β7GROWi,t + Year + ɛi,t n = 1,2
5. Data Analysis
5.1. Descriptive Statistics
Table 2 provides the descriptive statistics for the studied manufacturing companies in China and South Korea. Table 2 also reveals the significant differences for all of the variables, except sales growth rate (GROW). We find that, on average, Chinese manufacturing companies had better performance than Korean manufacturing companies. The R&D intensity of Chinese manufacturing companies was much higher than that of their Korean counterparts. This is in line with Zhang et al.’s [90] finding that profit-maximizing firms with a higher R&D efficiency tend to spend more on R&D.
Table 2.
Descriptive Statistics.
Based on the measures of firm size, Korean manufacturing companies are much bigger. Korean manufacturing companies also tend to obtain more debt and hold less cash compared with Chinese manufacturing companies, which appear to prefer equity financing and hold large cash balances. They also appear to use a higher proportion of long-term debt when they have to borrow.
Figure 1 shows that the average R&D intensity increased steadily from 3.83% to 4.47% between 2012–2016 for Chinese manufacturing companies, while R&D intensity fluctuated around 1.75% for their Korean counterparts. Regarding firm performance, it appears to be a difference in Tobin’s Q between Chinese and Korean manufacturing companies, with an average Tobin’s Q of about between 1.56–3.37 for Chinese companies against about 1.20 for the Korean ones. Moreover, the decline in Tobin’s Q in China between 2015–2016 may have alarmed investors.
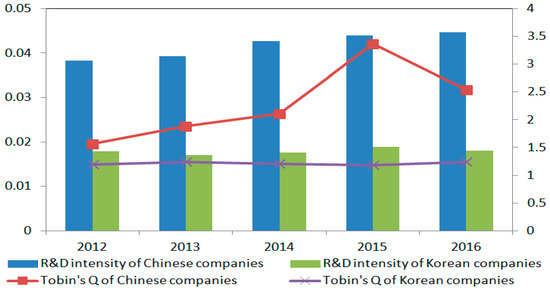
Figure 1.
R&D intensity and Tobin’s Q for Chinese and Korean manufacturing companies from 2012 to 2016.
5.2. Correlation Analysis
Correlation analysis was conducted before regression. Table 3 shows the results of correlation analysis. We compute the variance inflation factors (VIFs) and find them all to be less than 2, suggesting that multicollinearity is not a major issue in our study.
Table 3.
Correlation Analysis.
5.3. Determinants of R&D Intensity
We examine how R&D intensity is related to the above individual variables using multivariate regressions. The empirical results appear in Table 4.
Table 4.
Regression Results of Model (1).
For China’s manufacturing sector, R&D intensity decreases with firm size, which is not consistent with H1. This suggests that there may exist an extreme point for firm size in China. Small-scale firms suffer from great pressure regarding their survival and development, which stimulates firms to make breakthroughs in developing new products in order to expand their market share. Conversely, large-scale firms are more likely to expand in a stable environment and attempt to avoid the potential threats brought by risky R&D activities. However, when SIZE is used to measure firm size, R&D intensity increases with the size of Korean manufacturing companies, which supports the notion that the diversification of risk that is available to larger firms increases the incentives to engage in high-risk R&D activities. Conversely, the lack of risk mitigation opportunities appears to increase the costs of undertaking R&D investments for smaller firms.
Regarding the role of financing variables, it is clear that debt has a strong negative impact on R&D intensity for these two samples. Besides, the maturity of debt also plays a significant role for manufacturing companies in the two countries. The results indicate that companies prefer to borrow long term to avoid the challenge of renewing short-term debt in adverse economic conditions. Therefore, H2 and H3 are fully supported.
Next, the internal cash flow of Chinese manufacturing companies has a significant negative impact on R&D intensity, while it has a non-significant positive impact on Korean manufacturing companies.
The influence of cash reserves on R&D intensity is significant and positive in both samples, which is consistent with what Nivoix and Nguyen [30] obtained. Thus, H5 appears to be empirically validated. Finally, the sales growth rate is not statistically significant in both samples, rejecting H6.
In conclusion, R&D expenditures in China largely depend on firm size (SIZE and SALE), debt ratio (LEV), debt maturity (MATU), internal cash flow (CFS), and cash holding (CASH). For Korean companies, debt ratio (LEV), debt maturity (MATU), and cash holding (CASH) are R&D determinant factors. Thus, H7 is fully supported.
5.4. Effect of R&D Intensity on Firm Performance
In this section, we analyze the relationship between R&D investment and firm performance. Table 5 presents the regression results of model (2).
Table 5.
Regression Results of Model (2).
Looking across the two samples, the coefficients of RD indicate that R&D investment has a positive influence on firm performance. Moreover, the impact of R&D investment on firm performance in China is weaker than in South Korea. Thus, this evidence is strongly supportive of H8 and H9.
Unsurprisingly, Chinese larger manufacturing companies are associated with lower performance. There is a strong relationship between internal cash flow and firm performance only for Chinese manufacturing companies, indicating that internal finance is of greater importance for firm performance in China than in South Korea.
Leverage (LEV) does not affect the performance of Korean manufacturing companies. This result may also be because these firms strive to repay debt in order to support their development. Besides, high leverage can severely dent the performance of Chinese manufacturing companies. Debt maturity (MATU) exhibits a negative impact on firm performance in the Chinese sample and a positive impact on firm performance in the Korean sample. Besides, for Korean manufacturing companies, the associated impact of cash reserves on firm performance appears to be quite significant. Finally, sales growth rate (GROW) is associated with a significantly better performance for Korean manufacturing companies, but not for Chinese manufacturing companies.
Table 6 shows the regression results of model (3). The coefficients of RD in the first and second lag phase in China are positive and significant, but they are less than those in the current period shown in Table 5, which suggests that R&D investment has a decreasingly positive lagged effect on the performance of Chinese manufacturing companies. In South Korea, the lagged effect of R&D investment and firm performance are positively related, but not significant. Therefore, H10 is partially supported, and H11 is fully accepted.
Table 6.
Regression Results of Model (3).
5.5. Robustness Check
We consider ROS to be an alternative measure of firm performance. Then, models (2) and (3) are re-estimated. The regression results are similar to the basic results, which indicates that the conclusions of this paper are robust.
6. Discussion
The analysis and comparison of characteristics of R&D investment in the manufacturing industries of Korea and China provides several intriguing observations. First, we find a negative relation between R&D and firm size in China, which is in line with the findings for the US, where a large share of R&D investment is carried out by medium and small-sized firms. This is due to China’s favorable policies for encouraging high-tech SMEs to invest more in R&D activities in the process of economy transformation [91,92]. This negative relationship suggests the existence of economies of scale in the management of R&D projects.
Second, we observe that the financing of R&D investment in China’s manufacturing sector does not depend on internal funds, which is consistent with what Nivoix and Nguyen [30] have reported for Japanese pharmaceutical companies. The company’s internal funds are used to distribute dividends to shareholders. In 2015, the Chinese council issued a series of financial and monetary policies to encourage bank financial institutions to increase credit for key areas of the manufacturing industry and broaden direct financing channels for manufacturing enterprises [19]. In both emerging countries, R&D expenditures are much more determined by the firm’s funding structure. More precisely, high debt has a negative influence on a firm’s R&D intensity. Debt financing is too hazardous given its relatively strict payment constraints. Giudici and Paleari [93] and Müller and Zimmermann [94] pointed out the importance of financing R&D investment with equity capital. Similarly, Filatotchev and Piesse [15] suggested that debt financing is related to lower R&D intensity. Short-term debt is even worse, because lenders may require the full amount to be repaid at short notice. Furthermore, if manufacturing companies have to use debt, their preference is clearly in favor of long-term loans, which alleviate the financial pressure of renewing short-term loans before R&D projects start to generate positive cash flows. This financing behavior seems to be specific to manufacturing companies in both countries, which is probably because of the extended payback periods that characterize their R&D investments.
The positive correlation between R&D intensity and liquidity position provides the evidence that R&D activities need to be well funded and require appropriate financial resources to mitigate high risks. This finding is consistent with the negative impact of debt for the reason that cash can be viewed as negative debt (since excess cash can be used to repay the firm’s existing debt).
Another characteristic of China’s and Korea’s manufacturing industries is that firm performance is positively associated with R&D investment. The analysis also reveals that Korean manufacturing companies exhibit a better R&D performance than Chinese companies, which suggests that the Chinese manufacturing sector need to focus more on improving their competitive advantages in the context of international competitive market conditions. Besides, strong cash flows contribute to improving the firm performance of Chinese manufacturing companies, while the maturity of debt, cash reserves, and sales growth rate are favorable drivers of performance improvement for Korean manufacturing companies.
In addition, firm performance appears to be positively related to past R&D investment only in China’s manufacturing industry. As is well known, it generally takes a certain period of time to obtain expected returns from R&D projects. The non-significant relationship between the lagged effect of R&D investment and the performance of Korean manufacturing companies suggests that their commercial success is hard to sustain, which is consistent with highly competitive market conditions.
The overall results of the empirical analysis indicate that the manufacturing sectors of China and South Korea have some differences in their decision making and viewpoints concerning investment activities in R&D.
7. Conclusions
In this paper, we empirically analyze and compare the determinants of R&D investment of manufacturing companies in two emerging markets, and investigate whether R&D investment has any effect on firm performance. Using firm-level data from 960 Chinese companies and 211 Korean companies, we find the following results:
(1) Debt maturity and cash reserves are positive determinants of R&D investment in China and South Korea. In addition, firm size, internal financing, and debt ratio are restrictive factors of R&D intensity in Chinese manufacturing companies, while debt ratio is the only negative determinant of R&D investment in Korean counterparts.
(2) Regarding the economic impact of R&D investment, the empirical results show that R&D investment positively affects firm performance in China and South Korea. Korean manufacturing companies have a higher R&D efficiency than Chinese ones.
(3) R&D investment has a decreasingly positive time-lag effect only on the performance of Chinese manufacturing companies.
In light of the above conclusions, the main findings are as follows:
(1) From a national perspective, China, an efficiency-driven country [95] should provide a better environment for popular entrepreneurship and mass innovation by lowering barriers, strengthening public services, and encouraging college students, scientists, and engineers to start new businesses [96]. If the Chinese government intends to accelerate industrial upgrading and convert the pattern of “Made in China” into “Created in China,” great emphasis should be put on the importance of private high-tech firms [91].
South Korea, an innovation-driven country [95], should establish intellectual property rights legislation and provide effective support for science parks and business incubators for new and growing firms [97]. The Korean government should also encourage SMEs to increase R&D inputs by providing a series of tax incentives and R&D subsidies, aiming to maximize the social welfare [98].
(2) Based on the RBV, the manufacturing companies in the two countries should allocate R&D resources efficiently and optimally, improve original innovation capacity, more actively promote the use of advanced foreign technology, and accelerate the transformation of technological innovation. For managers of Chinese and Korean manufacturing companies, we suggest the establishment of lasting and trusting relationships with creditors, so as to obtain considerable reduction in the level of information asymmetry.
(3) Under the complex market environment, Chinese manufacturing companies should constantly enhance internal control, maintain a moderate scale, and avoid blind expansion so as to achieve healthy and sustainable development.
(4) We suggest that policy makers in both countries create substantial tax incentives to reward companies that make regular annual investments in R&D directed at registering patents.
In this paper, we have focused on the determinants of R&D investment in the manufacturing industry. Other external factors (e.g., market structure, industry concentration, and customer involvement) affecting R&D investment strategy warrant further academic research. Comparing the emerging countries with the developed countries would also be fruitful. In addition, studies of other industries would provide insight into the determinants of R&D investment in emerging markets.
Author Contributions
J.X. designed the research, collected the data and drafted the manuscript. J.-W.S. guided this work and provided extensive revisions during the study. All the authors wrote, read and approved the final manuscript.
Funding
This research received no external funding.
Acknowledgments
The authors would like to thank the editors and all anonymous referees for their valuable comments and suggestions. Yang Bai, Ajou University, and Feng Liu, Korea University, has also provided considerable advice that has contributed to improve the paper.
Conflicts of Interest
The authors declare no conflict of interest.
References
- Herrmann, C.; Schmidt, C.; Kurle, D.; Blume, S.; Thiede, S. Sustainability in manufacturing and factories of the future. Int. J. Precis. Eng. Manuf. Green Technol. 2014, 1, 283–292. [Google Scholar] [CrossRef]
- Lin, B.W.; Lee, Y.; Hung, S.C. R&D intensity and commercialization orientation effects on financial performance. J. Bus. Res. 2006, 59, 679–685. [Google Scholar]
- Lau, A.K.W.; Baark, E.; Lo, W.L.W.; Sharif, N. The effects of innovation sources and capabilities on product competitiveness in Hong Kong and the Pearl River Delta. Asian J. Technol. Innovat. 2013, 21, 220–236. [Google Scholar] [CrossRef]
- Lev, B.; Radhakrishnan, S.; Ciftci, M. The Stock Market Valuation of R&D Leaders. Available online: https://ssrn.com/abstract=1280696 (accessed on 8 October 2008).
- MSCI Emerging Markets Index. Available online: https://www.msci.com/emerging-markets (accessed on 10 August 2018).
- Jeong, J. Determinants of dividend smoothing in emerging market: The case of Korea. Emerg. Mark. Rev. 2013, 17, 76–88. [Google Scholar] [CrossRef]
- Lee, H.; Oh, S.; Park, K. How do capital structure policies of emerging markets differ from those developed economies? Survey evidence from Korea. Emerg. Mark. Financ. Trade 2014, 50, 34–72. [Google Scholar] [CrossRef]
- Bonizzi, B. Capital market inflation in emerging markets: The cases of Brazil and South Korea. PSL Quart. Rev. 2015, 68, 115–150. [Google Scholar]
- IRI. Available online: http://iri.jrc.ec.europa.eu (accessed on 2 July 2018).
- Wernerfelt, B. A resource-based view of the firm. Strat Manag. J. 1984, 5, 199–219. [Google Scholar] [CrossRef]
- Sasidharan, S.; Lukose, P.J.J.; Komera, S. Financing constraints and investments in R&D: Evidence from Indian manufacturing firms. Quart. Rev. Econ. Financ. 2015, 55, 28–39. [Google Scholar]
- Choi, Y.S.; Tcha, M.J. The China Impact And Korean Manufacturing Industries: The Experiences of SMEs in Korea. Available online: http://www.kdi.re.kr/data/download/attach/7762_B_session2_3.pdf (accessed on 15 July 2005).
- Wang, L. Comparison and analysis on international competitiveness of manufacturing industry in China, Japan and Korea: Based on technology content and TC index. Technol. Econ. 2010, 29, 22–25. [Google Scholar]
- Industry 4.0. Available online: https://en.wikipedia.org/wiki/Industry_4.0 (accessed on 2 July 2018).
- Filatotchev, I.; Piesse, J. R&D, internationalization and growth of newly listed firms: European evidence. J. Int. Bus. Stud. 2009, 40, 1260–1276. [Google Scholar]
- Zhang, Y.; Li, H.; Hitt, M.A.; Cui, G. R&D intensity and international joint venture performance in an emerging market: Moderating effects of market focus and ownership structure. J. Int. Bus. Stud. 2007, 38, 944–960. [Google Scholar]
- Zhang, G.; Duan, H.; Zhou, J. Small worldliness, Chinese culture, and firm innovation performance: An empirical study based on patent collaboration data of China. Asian J. Technol. Innovat. 2015, 23, 189–204. [Google Scholar] [CrossRef]
- Jain, S.C. Emerging Economies and the Transformation of International Business: Brazil, Russia, India and China (BRICs); Edward Elgar: Cheltenham, UK, 2006; pp. 1–384. [Google Scholar]
- Cheng, Z.; Li, W. Independent R and D, technology introduction, and green growth in China’s manufacturing. Sustainability 2018, 10, 311. [Google Scholar] [CrossRef]
- Jin, Z.; Shang, Y.; Xu, J. The impact of government subsidies on private R&D and firm performance: Does ownership matter in China’s manufacturing industry? Sustainability 2018, 10, 2205. [Google Scholar]
- Xu, J.; Sim, J.W. Are costs really sticky and biased? Evidence from manufacturing listed companies in China. Appl. Econ. 2017, 49, 5601–5613. [Google Scholar] [CrossRef]
- Wang, Y.C. Research on Science and Technology Finance and Tax Policy to Promote R&D of Manufacturing Industry. Master’s Thesis, Tianjin University of Commerce, Tianjin, China, 2017. [Google Scholar]
- Teng, W.Y. The Research of Government Funding on R&D Investment of China’s Manufacturing Industry. Master’s Thesis, Zhejiang Gongshang University, Hangzhou, China, 2017. [Google Scholar]
- KIET. Available online: http://eng.kiet.re.kr/kiet_eng/main (accessed on 27 March 2018).
- Lee, J.; Jun, S.; Chang, T.W.; Park, J. A smartness assessment framework for smart factories using analytic network process. Sustainability 2017, 9, 794. [Google Scholar] [CrossRef]
- Gross Domestic Spending on R&D. Available online: https://data.oecd.org/rd/gross-domestic-spending-on-r-d.htm (accessed on 7 August 2018).
- Xu, J. R&D, Advertising and the Performance of Korean Listed Companies: Based on the Classification of Firm Size. Ph.D. Dissertation, Dankook University, Yongin-si, Korea, 2018. [Google Scholar]
- Cho, S.P.; Lim, K.; Kwon, G.J.; Sung, Y.H. R&D investment and performance in Korea: Korean R&D Scoreboard 2005. Asian J. Technol. Innovat. 2008, 16, 143–160. [Google Scholar]
- Bottazzi, G.; Dosi, G.; Lippi, M.; Pammolli, F.; Riccaboni, M. Innovation and corporate growth in the evolution of the drug industry. Int. J. Ind. Organ. 2001, 19, 1161–1187. [Google Scholar] [CrossRef]
- Nivoix, S.; Nguyen, P. Characteristics of R&D Expenditures in Japan’s Pharmaceutical Industry. Asia Pac. Bus. Rev. 2012, 18, 225–240. [Google Scholar]
- Hamberg, D. Size of firm, oligopoly, and research: The evidence. Can. J. Econ. Polit. Sci. 1964, 30, 62–75. [Google Scholar] [CrossRef]
- Mansfield, E. Industrial research and development expenditures: Determinants, prospects, and relation of size of firm and inventive output. J. Polit. Econ. 1964, 71, 556–576. [Google Scholar] [CrossRef]
- Scherer, F.M. Firm size, market structure, opportunity, and the output of patented inventions. Am. Econ. Rev. 1965, 55, 1097–1125. [Google Scholar]
- Link, A.N. Firm size and efficient entrepreneurial activity: A reformulation of the Schumpeter hypotheses. J. Polit. Econ. 1980, 88, 771–782. [Google Scholar] [CrossRef]
- Meisel, J.B.; Lin, S.A.Y. The impact of market structure on the firm’s allocation of resources to research and development. Q. Rev. Econ. Bus. 1983, 23, 28–43. [Google Scholar]
- Chiang, C.C.; Mensah, Y.M. The determinants of investor valuation of R&D expenditure in the software industry. Rev. Quant. Financ. Account. 2004, 22, 293–313. [Google Scholar] [CrossRef]
- Wang, R. The internal determinants of firm R&D expenditures-evidence from top 100 companies of Chinese electronic & information industry. Stud. Sci. Sci. 2005, 23, 225–231. [Google Scholar]
- Mishra, V. The determinants of R&D expenditure of firms: Evidence from a cross-section of Indian firms. Econ. Pap. 2007, 26, 237–248. [Google Scholar]
- Xu, X.; Chen, Q.; Zheng, B. The determinant factors of R&D expenditure: An empirical research based on high-tech industry. Stud. Sci. Sci. 2008, 26, 304–310. [Google Scholar]
- An, J.; Wang, X. On the influencing factors of R&D expenditures in high-tech listed companies-Based on the empirical dates (2004–2008) of listed companies. East China Econ. Manag. 2010, 24, 93–97. [Google Scholar]
- Choi, J.; Lee, J. Firm size and compositions of R&D expenditures: Evidence from a panel of R&D performing manufacturing firms. Ind. Innovat. 2018, 25, 459–481. [Google Scholar]
- Khoshnevis, P.; Teirlinck, P. Performance evaluation of R&D active firms. Socio-Econ. Plan. Sci. 2018, 61, 16–28. [Google Scholar]
- Hall, B.H. The impact of corporate restructuring on industrial research and development. Brookings Pap. Econ. Activ. 1990, 1990, 85–124. [Google Scholar] [CrossRef]
- Hall, B.H. Investment and Research and Development at the Firm Level: Does the Source of Financing Matter? Available online: http://www.nber.org/papers/w4096.pdf (accessed on 1 June 1992).
- Cumming, D.J.; Macintosh, J.G. The determinants of R&D expenditures: A study of the Canadian biotechnology industry. Rev. Ind. Organ. 2000, 17, 357–370. [Google Scholar]
- Ren, H. Empirical research on the effect factors of R&D input-Based on the perspective of enterprise life cycle. J. Ind. Technol. Econ. 2015, 8, 40–49. [Google Scholar]
- Bond, S.; Harhoff, D.; Van Reenen, J. Investment, R&D and financial constraints in Britain and Germany. Available online: http://www.nber.org/CRIW/papers/vanreenen.pdf 2003 (accessed on 12 August 2003).
- Lee, S. Financial determinants of corporate R&D investment in Korea. Asian Econ. J. 2012, 26, 119–135. [Google Scholar]
- Hubbard, R. Capital market imperfections and investment. J. Econ. Lit. 1998, 26, 193–225. [Google Scholar]
- Grabowski, H.; Vernon, J. The determinants of pharmaceutical research and development expenditures. J. Evol. Econ. 2000, 10, 201–215. [Google Scholar] [CrossRef]
- Carpenter, R.E.; Petersen, B.C. Capital market imperfections, high-tech investment, and new equity financing. Econ. J. 2002, 112, F54–F72. [Google Scholar] [CrossRef]
- Hall, B. The financing of research and development. Oxf. Rev. Econ. Pol. 2002, 18, 35–51. [Google Scholar] [CrossRef]
- Mahlich, J.; Roediger-Schluga, T. The determinants of pharmaceutical R&D expenditures: Evidence from Japan. Rev. Ind. Organ. 2006, 28, 145–164. [Google Scholar]
- Brown, J.R.; Fazzari, S.M.; Petersen, B.C. Financing innovation and growth: Cash flow, external equity, and the 1990s R&D boom. J. Financ. 2009, 64, 141–185. [Google Scholar]
- Chuang, H. R&D investment, cash holdings and the financial crisis: Evidence from Korean corporate data. Appl. Econ. 2017, 49, 5638–5650. [Google Scholar]
- Lee, M.H.; Hwang, I.J. Determinants of corporate R&D investment: An empirical study comparing Korea’s IT industry and its non-IT industry. ETRI J. 2003, 4, 258–265. [Google Scholar]
- Brouwer, E.; Kleinknecht, A. Firm size, small business presence and sales of innovative products: A micro-econometric analysis. Small Bus. Econ. 1996, 8, 189–201. [Google Scholar] [CrossRef]
- Brouwer, E.; Kleinknecht, A. Keynes-plus? Effective demand and changes in firm-level R&D: An empirical note. Camb. J. Econ. 1999, 23, 385–391. [Google Scholar]
- Piva, M.; Vivarelli, M. Is demand-pulled innovation equally important in different groups of firms? Camb. J. Econ. 2007, 31, 691–710. [Google Scholar] [CrossRef]
- García-Quevedo, J.; Pellegrino, G.; Vivarelli, M. R&D drivers and age: Are young firms different? Res. Policy 2014, 43, 1544–1556. [Google Scholar]
- Lai, Y.L.; Lin, F.J.; Lin, Y.H. Factors affecting firm’s R&D investment decisions. J. Bus. Res. 2015, 68, 840–844. [Google Scholar]
- Fukao, K.; Inui, T.; Ito, K.; Kim, Y.G.; Yuan, T. An international comparison of the FTP levels and the productivity convergence of Japanese, Korean, Taiwanese, and Chinese listed firms. J. Chin. Econ. Bus. Stud. 2011, 9, 127–150. [Google Scholar] [CrossRef]
- Greenhalgh, C.; Rogers, M. Innovation, Intellectual Property, and Economic Growth; Princeton University Press: Princeton, NJ, USA, 2010. [Google Scholar]
- Salimi, N.; Rezaei, J. Evaluating firms’ R&D performance using best worst method. Eval. Program Plann. 2018, 66, 147–155. [Google Scholar] [PubMed]
- Reynard, E. A method for relating research spending to net profits. Res. Manag. 1979, 22, 12–14. [Google Scholar] [CrossRef]
- Hirschey, M.; Weygandt, J. Amortization Policy for advertising and research and development expenditures. J. Account. Res. 1985, 23, 326–335. [Google Scholar] [CrossRef]
- Megna, P.; Klock, M. The impact of intangible capital on Tobin’s Q in the semiconductor industry. Am. Econ. Rev. 1993, 83, 265–269. [Google Scholar]
- Baek, M.C. Influence of Firm’s R&D Expenditure on Profit, Sales, and Stock Price. Ph.D. Dissertation, Yonsei University, Seoul, Korea, 1994. [Google Scholar]
- Lev, B.; Sougiannis, T. The capitalization, amortization, and value-relevance of R&D. J. Account. Econ. 1996, 21, 107–138. [Google Scholar]
- Zhu, G.L.; Zhang, Y.; Chen, K.H.; Yu, J. The impact of R&D intensity on firm performance in an emerging market: Evidence from China’s electronics manufacturing firms. Asian J. Technol. Innovat. 2017, 25, 41–60. [Google Scholar]
- Canarella, G.; Miller, S.M. The determinants of growth in the U.S. information and communication technology (ICT) industry: A firm-level analysis. Econ. Model. 2018, 70, 259–271. [Google Scholar] [CrossRef]
- Nelson, R.R. Why do firms differ, and how does it matter? Strat Manag. J. 1991, 12, 61–74. [Google Scholar] [CrossRef]
- Falk, M. Quantile estimates of the impact of R&D intensity on firm performance. Small Bus. Econ. 2012, 39, 19–37. [Google Scholar]
- Xu, J.; Jin, Z. Research on the impact of R&D investment on firm performance in China’s Internet of Things industry. J. Adv. Manag. Sci. 2016, 4, 112–116. [Google Scholar]
- Xu, J.; Sim, J.W.; Jin, Z. Research on the impact of R&D investment on firm performance and enterprise value based on multiple linear regression model and data mining. Int. J. Database Theor. Appl. 2016, 9, 305–316. [Google Scholar]
- Lee, M.; Choi, M. Analysis on time-lag effect of research and development investment in the pharmaceutical industry in Korea. Osong Publ. Health Res. Perspect. 2015, 6, 241–248. [Google Scholar] [CrossRef] [PubMed]
- Grabowski, H. The determinants of industrial research and development: A study of the chemical, drug, and petroleum industry. J. Polit. Econ. 1968, 76, 292–306. [Google Scholar] [CrossRef]
- Coombs, J.E.; Bierly, P.E. Measuring technological capability and performance. R&D Manag. 2006, 36, 421–438. [Google Scholar]
- Tyagi, S.; Nauriyal, D.K.; Gulati, R. Firm level R&D intensity: Evidence from Indian drugs and pharmaceutical industry. Rev. Manag. Sci. 2018, 12, 167–202. [Google Scholar]
- Tingvall, P.G.; Poldahl, A. Determinants of firm R&D: The role of relationship-specific interactions for R&D spillovers. J. Ind. Compet. Trade 2012, 12, 395–411. [Google Scholar]
- Connolly, R.A.; Hirschey, M. Firm size and the effect of R&D on Tobin’s Q. R&D Manag. 2005, 35, 217–223. [Google Scholar]
- Khlif, H.; Guidara, A.; Souissi, M. Corporate social and environmental disclosure and corporate performance: Evidence from South Africa and Morocco. J. Account. Emerg. Econ. 2015, 5, 51–69. [Google Scholar] [CrossRef]
- Shin, N.; Kraemer, K.L.; Dedrick, J. R&D and firm performance in the semiconductor industry. Ind. Innov. 2017, 24, 280–297. [Google Scholar]
- DeCarolis, D.M.; Deeds, D.L. The impact of stocks and flows of organizational knowledge on firm performance: An empirical investigation of the biotechnology industry. Strat Manag. J. 1999, 20, 953–968. [Google Scholar] [CrossRef]
- Nunes, P.M.; Serrasqueiro, Z.; Leitão, J. Is there a linear relationship between R&D intensity and growth? Empirical evidence of non-high-tech vs. high-tech SMEs. Res. Policy 2012, 41, 36–53. [Google Scholar]
- Guedes, M.J.; Gonçalves, V.D.C.; Soares, N.; Valente, M. UK evidence for the determinants of R&D intensity from a panel fsQCA. J. Bus. Res. 2016, 69, 5431–5436. [Google Scholar]
- Howe, J.D.; McFetridge, D.G. The determinants of R&D ezpenditures. Can. J. Econ. 1976, 9, 57–71. [Google Scholar]
- Chari, M.D.R.; Devaraj, S.; David, P. The impact of information technology investments and diversification strategies on firm performance. Manag. Sci. 2008, 54, 224–234. [Google Scholar] [CrossRef]
- Honoré, F.; Munari, F.; de La Potterie, B.V.P. Corporate governance practices and companies’ R&D intensity: Evidence from European countries. Res. Policy 2015, 44, 533–543. [Google Scholar]
- Zhang, A.; Zhang, Y.; Zhao, R. A study of the R&D efficiency and productivity of Chinese firms. J. Comp. Econ. 2003, 31, 444–464. [Google Scholar]
- Chen, Z.; Lee, S.H.; Xu, W. R&D performance in high-tech firms in China. Asian Econ. Pap. 2017, 16, 193–208. [Google Scholar]
- Gu, Q.; Jiang, W.; Wang, G.G. Effects of external and internal sources on innovation performance in Chinese high-tech SMEs: A resource-based perspective. J. Eng. Technol. Manag. 2016, 40, 76–86. [Google Scholar] [CrossRef]
- Giudici, G.; Paleari, S. The provision of finance to innovation: A survey conducted among Italian technology-based small firms. Small Bus. Econ. 2000, 14, 37–53. [Google Scholar] [CrossRef]
- Müller, E.; Zimmermann, V. The importance of equity finance for R&D activity. Small Bus. Econ. 2009, 33, 303–318. [Google Scholar]
- Kelly, D.; Bosma, N.; Amorós, J.E. Global entrepreneurship monitor-2010 global report. Available online: http://dspace.library.uu.nl/bitstream/1874/228073/1/266.pdf (accessed on 9 August 2018).
- Erkut, B. Entrepreneurship and economic freedom: Do objective and subjective data reflect the same tendencies? Entrep. Bus. Econ. Rev. 2016, 4, 11–26. [Google Scholar] [CrossRef]
- Erkut, B. Structural similarities of economics for innovation and competitiveness-a decision tree based approach. Stud. Oecon. Posnan. 2016, 4, 85–104. [Google Scholar] [CrossRef]
- Kim, M.K.; Park, J.H.; Paik, J.H. Factors influencing innovation capability of small and medium-sized enterprises in Korean manufacturing sector: Facilitators, barriers and moderators. Int. J. Technol. Manag. 2018, 76, 214–235. [Google Scholar] [CrossRef]

© 2018 by the authors. Licensee MDPI, Basel, Switzerland. This article is an open access article distributed under the terms and conditions of the Creative Commons Attribution (CC BY) license (http://creativecommons.org/licenses/by/4.0/).