Article

Evaluation of Progressive Collapse Resistance of Steel Moment Frames Designed with Different Connection Details Using Energy-Based Approximate Analysis

1
Department of Architectural Engineering, Hanyang University, 55 Hanyangdaehak-ro, Sangrok-Gu, Ansan, Gyeonggi-Do 15588, Korea
2
Department of Civil Engineering, National Chiao Tung University, 1001 University Road, Hsinchu, Taiwan
*
Author to whom correspondence should be addressed.
Sustainability 2018, 10(10), 3797; https://doi.org/10.3390/su10103797
Submission received: 15 September 2018 / Revised: 11 October 2018 / Accepted: 18 October 2018 / Published: 20 October 2018

Abstract

:
This study evaluates the progressive collapse resistance performance of steel moment frames, individually designed with different connection details. Welded unreinforced flange-bolted web (WUF-B) and reduced beam section (RBS) connections are selected and applied to ordinary moment frames designed as per the Korean Building Code (KBC) 2016. The 3-D steel frame systems are modeled using reduced models of 1-D and 2-D elements for beams, columns, connections, and composite slabs. Comparisons between the analyzed results of the reduced models and the experimental results are presented to verify the applicability of the models. Nonlinear static analyses of two prototype buildings with different connection details are conducted using the reduced models, and an energy-based approximate analysis is used to account for the dynamic effects associated with sudden column loss. The assessment on the structures was based on structural robustness and sensitivity methods using the alternative path method suggested in General Services Administration (GSA) 2003, in which column removal scenarios were performed and the bearing capacity of the initial structure with an undamaged column was calculated under gravity loads. According to the analytical results, the two prototype buildings satisfied the chord rotation criterion of GSA 2003. These results were expected since the composite slabs designed to withstand more than 3.3 times the required capacity had a significant effect on the stiffness of the entire structure. The RBS connections were found to be 14% less sensitive to progressive collapse compared to the WUF-B ones.

1. Introduction

Building structures are designed to resist loading combinations specified in building codes. However, in many cases, structures fail due to progressive collapse. In other words, even though structures are properly designed to bear design loads, structural redundancy suddenly decreases because of unexpected abnormal loads, which consequently causes the entire structures to collapse. The following cases are representative examples of progressive collapse: the collapse of the Ronan Point Apartment in London caused by a gas explosion, the collapse of the Alfred P. Murrah Federal Building in the U.S. caused by a truck bomb attack, the collapse of the World Trade Center caused by the impact of large passenger jets in the U.S., and the collapse of the Sampung Department Store in Republic of Korea caused by the punching shear failure of a flat plate system. Based on these catastrophic accidents, the American Society of Civil Engineers (ASCE) 7, the GSA 2003, and the U.S. Department of Defense (DoD) 2009 [1,2,3] have introduced analysis and design methods to prevent the progressive collapse of buildings. Additionally, the British Standard (BS) 5950 [4] in the U.K. provides guidelines to prevent disproportionate collapses by ensuring sufficient material strength of structural members and by reinforcing ties between connections in an effort to resist such extreme loads. Even though terror threats have been increasing around the world, many countries do not have proper guidelines to prevent progressive collapses. For example, in Republic of Korea, the guidelines by the Korea Ministry of Land, Infrastructure and Transport (KMLIT) [5] provide a design method that can prevent or minimize the damage caused by terrorist attacks for large-scale and high-rise buildings. However, this method focuses on the site and interior planning, security facilities, evacuation, and the planning for building facilities. At the moment, there is no effective guide that prevents the collapse of a structure due to local failure of a main structural member after a terrorist attack. Therefore, the safety evaluation of structures under abnormal loads such as impact and blast caused by terrorist attacks is a significant concern for residents and nations, and it is indispensable to study and propose reliable design methods to prevent the progressive collapse of damaged buildings.
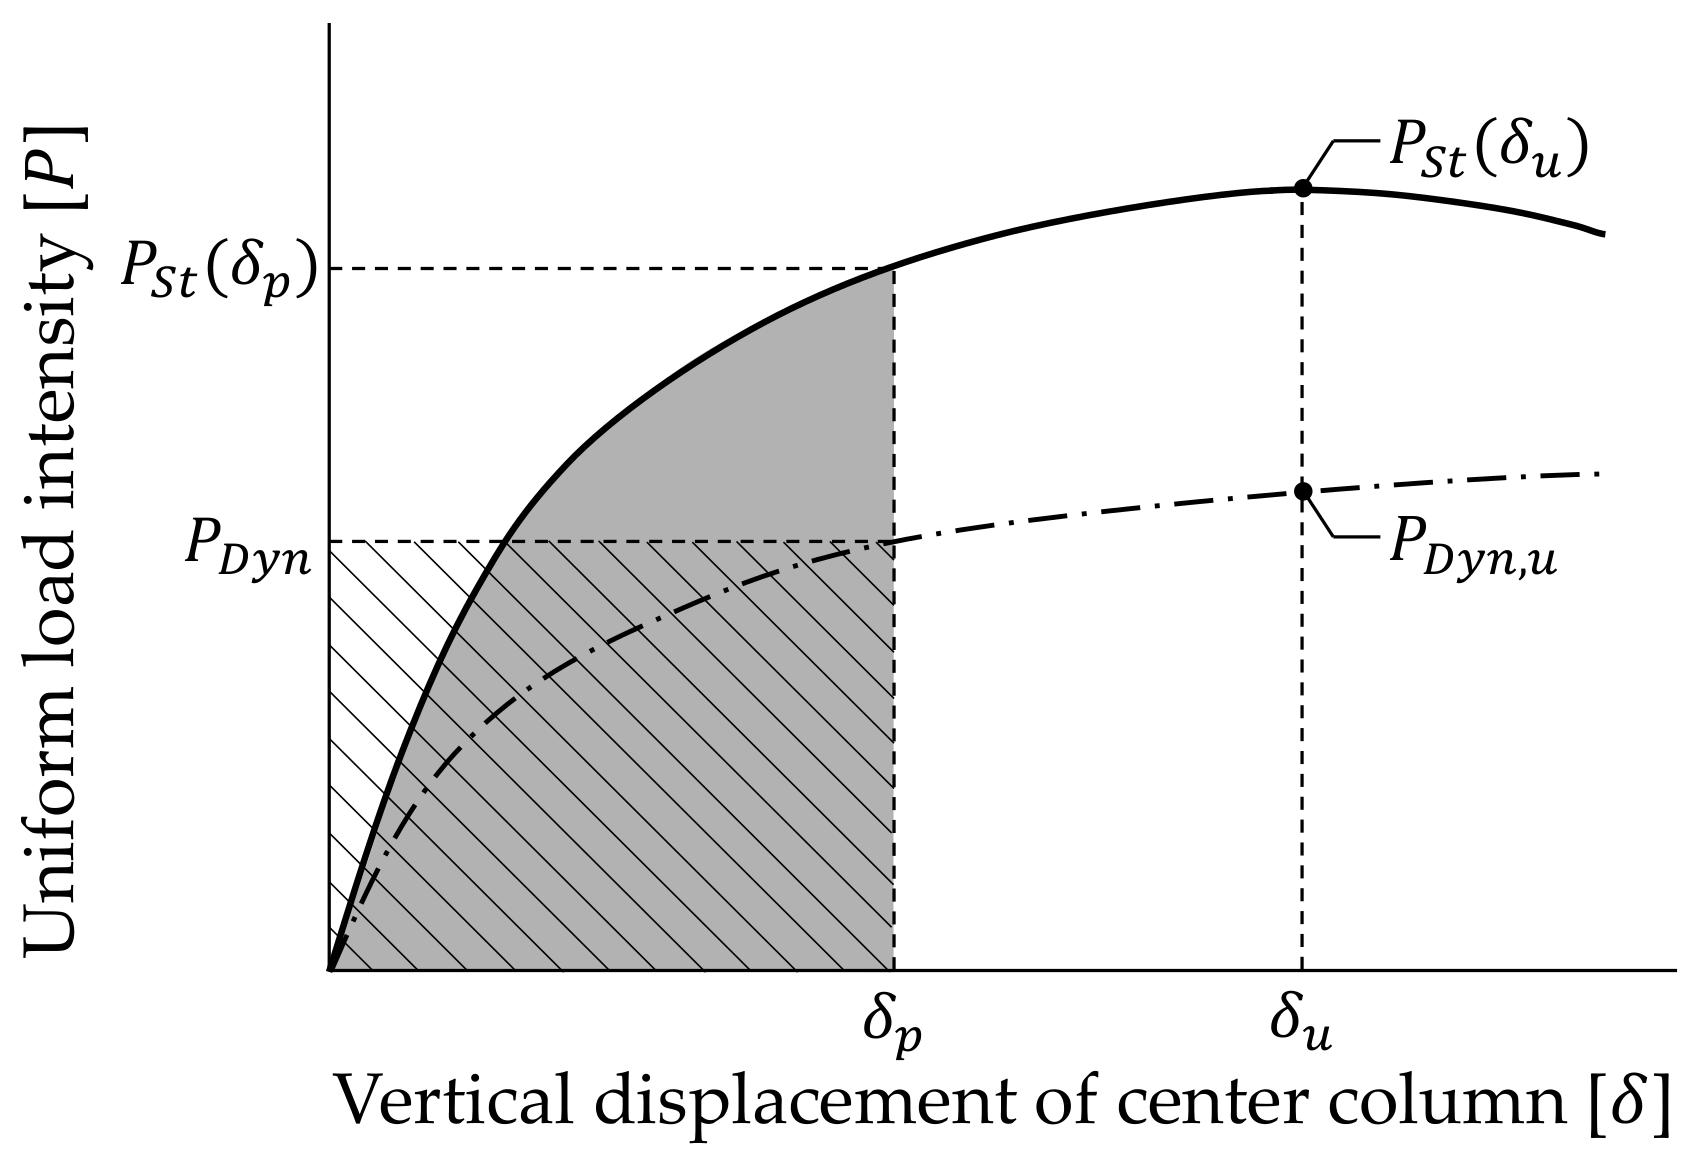
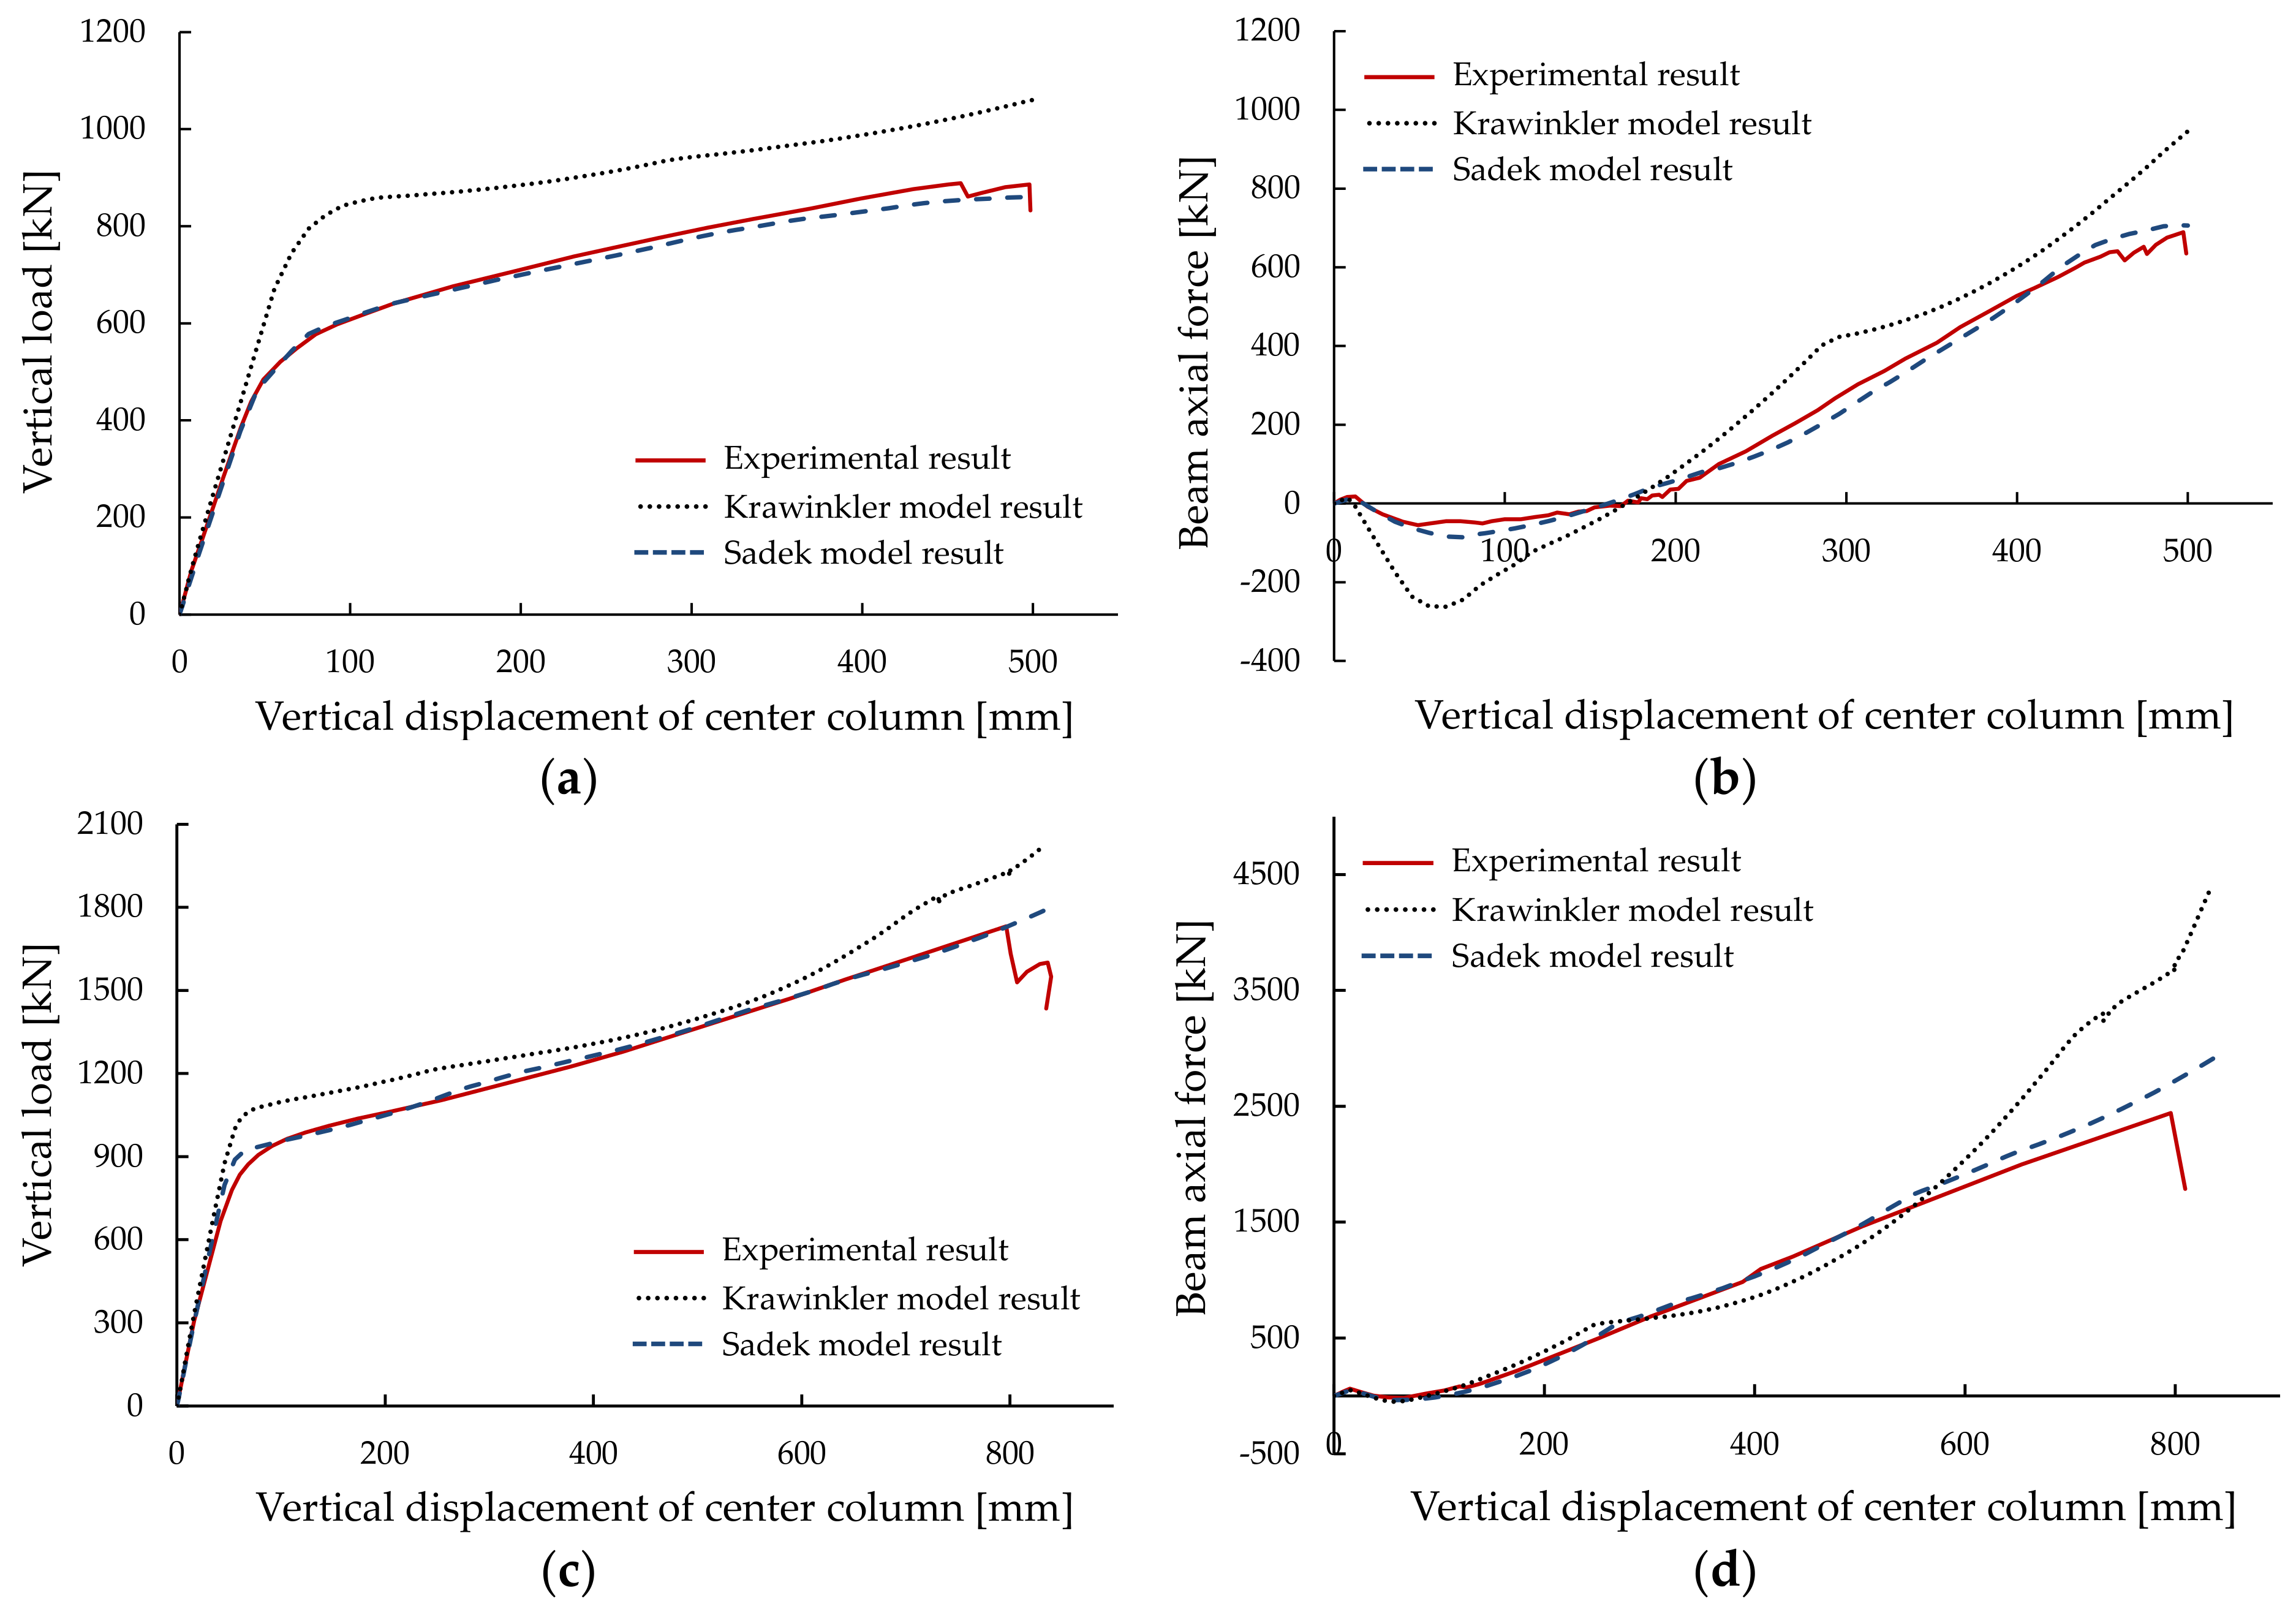
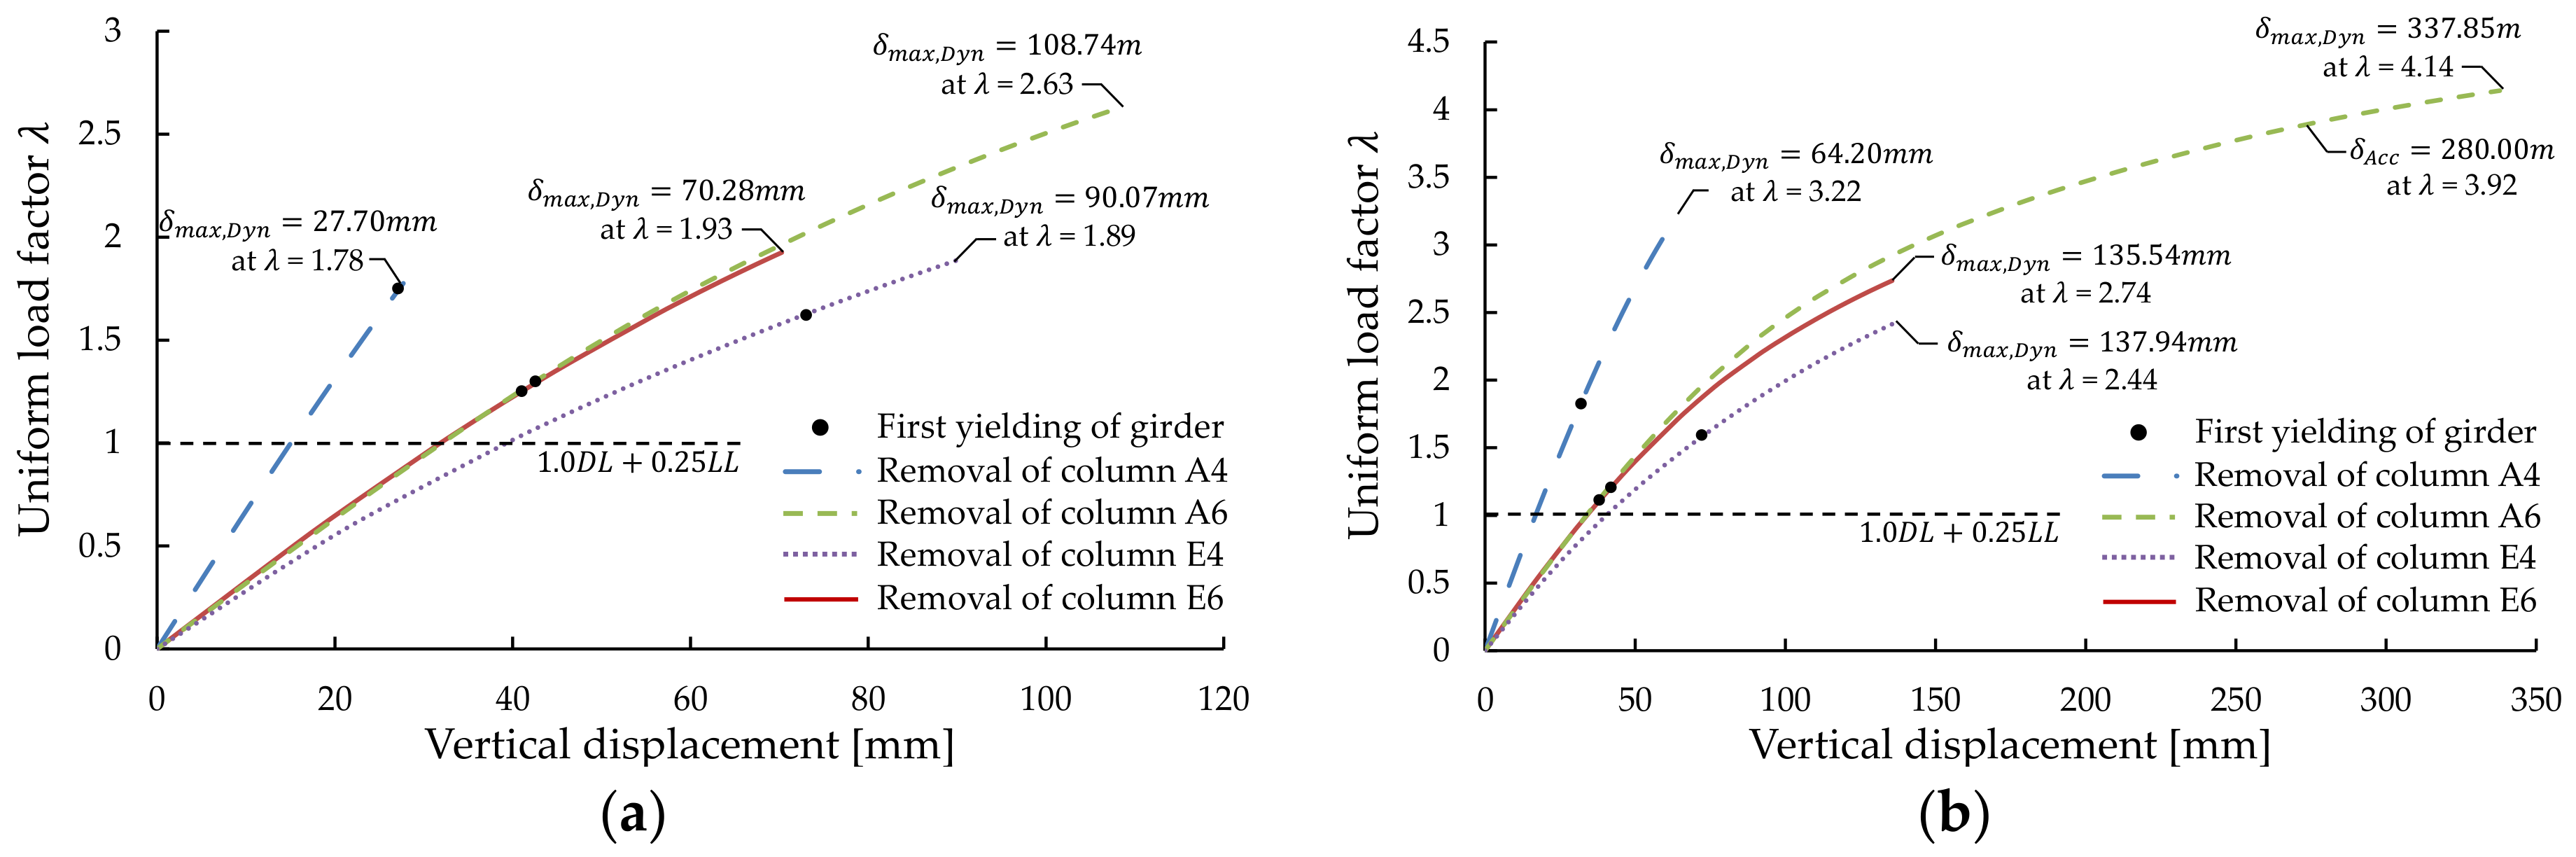
Design methods used to prevent the progressive collapse of buildings include the tie force, alternative path (AP), and the specific local resistance (SLR) methods. The typical progressive collapse resistance design guidelines of the GSA 2003, the DoD 2009, and the BS 5950 [2,3,4], commonly recommend the AP method. It is a design method that increases the stiffness and strength of the member and structure under the column removal scenario so that the load initially supported by the removed column can be replaced by the adjacent member. Many researchers have applied the AP method to assess the progressive collapse resistance performance of buildings. Marjanishvili [6] compared the characteristics of each method presented in the guideline and emphasized that the results of nonlinear dynamic analysis with the dynamic effect of sudden column loss and nonlinear behavior (material nonlinearity, large deformation, etc.) of the beam and connection could be most reliable from the standpoint of the collapse mechanism under the column removal scenario. However, this method requires repeated analysis for each load step, and the time required for analysis is much greater than static analysis. In nonlinear static analysis, the adopted procedure is simple, and it takes a relatively short time for analysis compared to nonlinear dynamic analysis. However, the reliability of the analysis is degraded considering the dynamic amplification factor due to column removal. The disadvantages of these methods increase with the order of the element and the size of the structure. Sadek et al. [
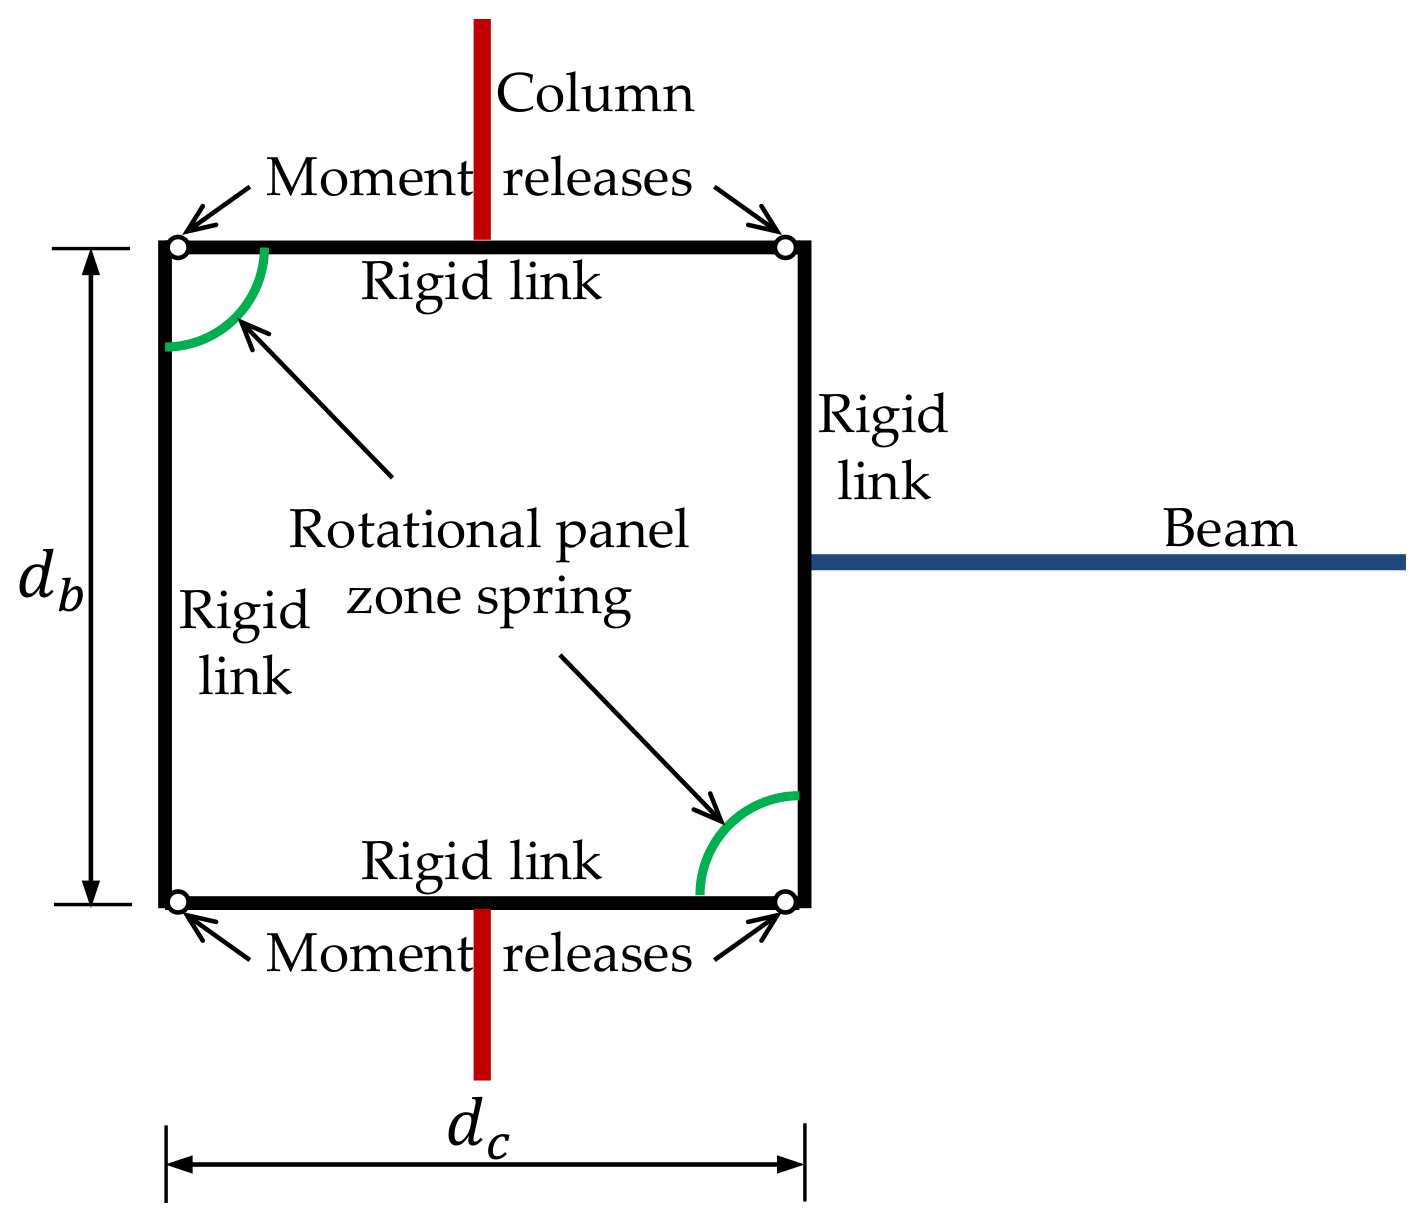
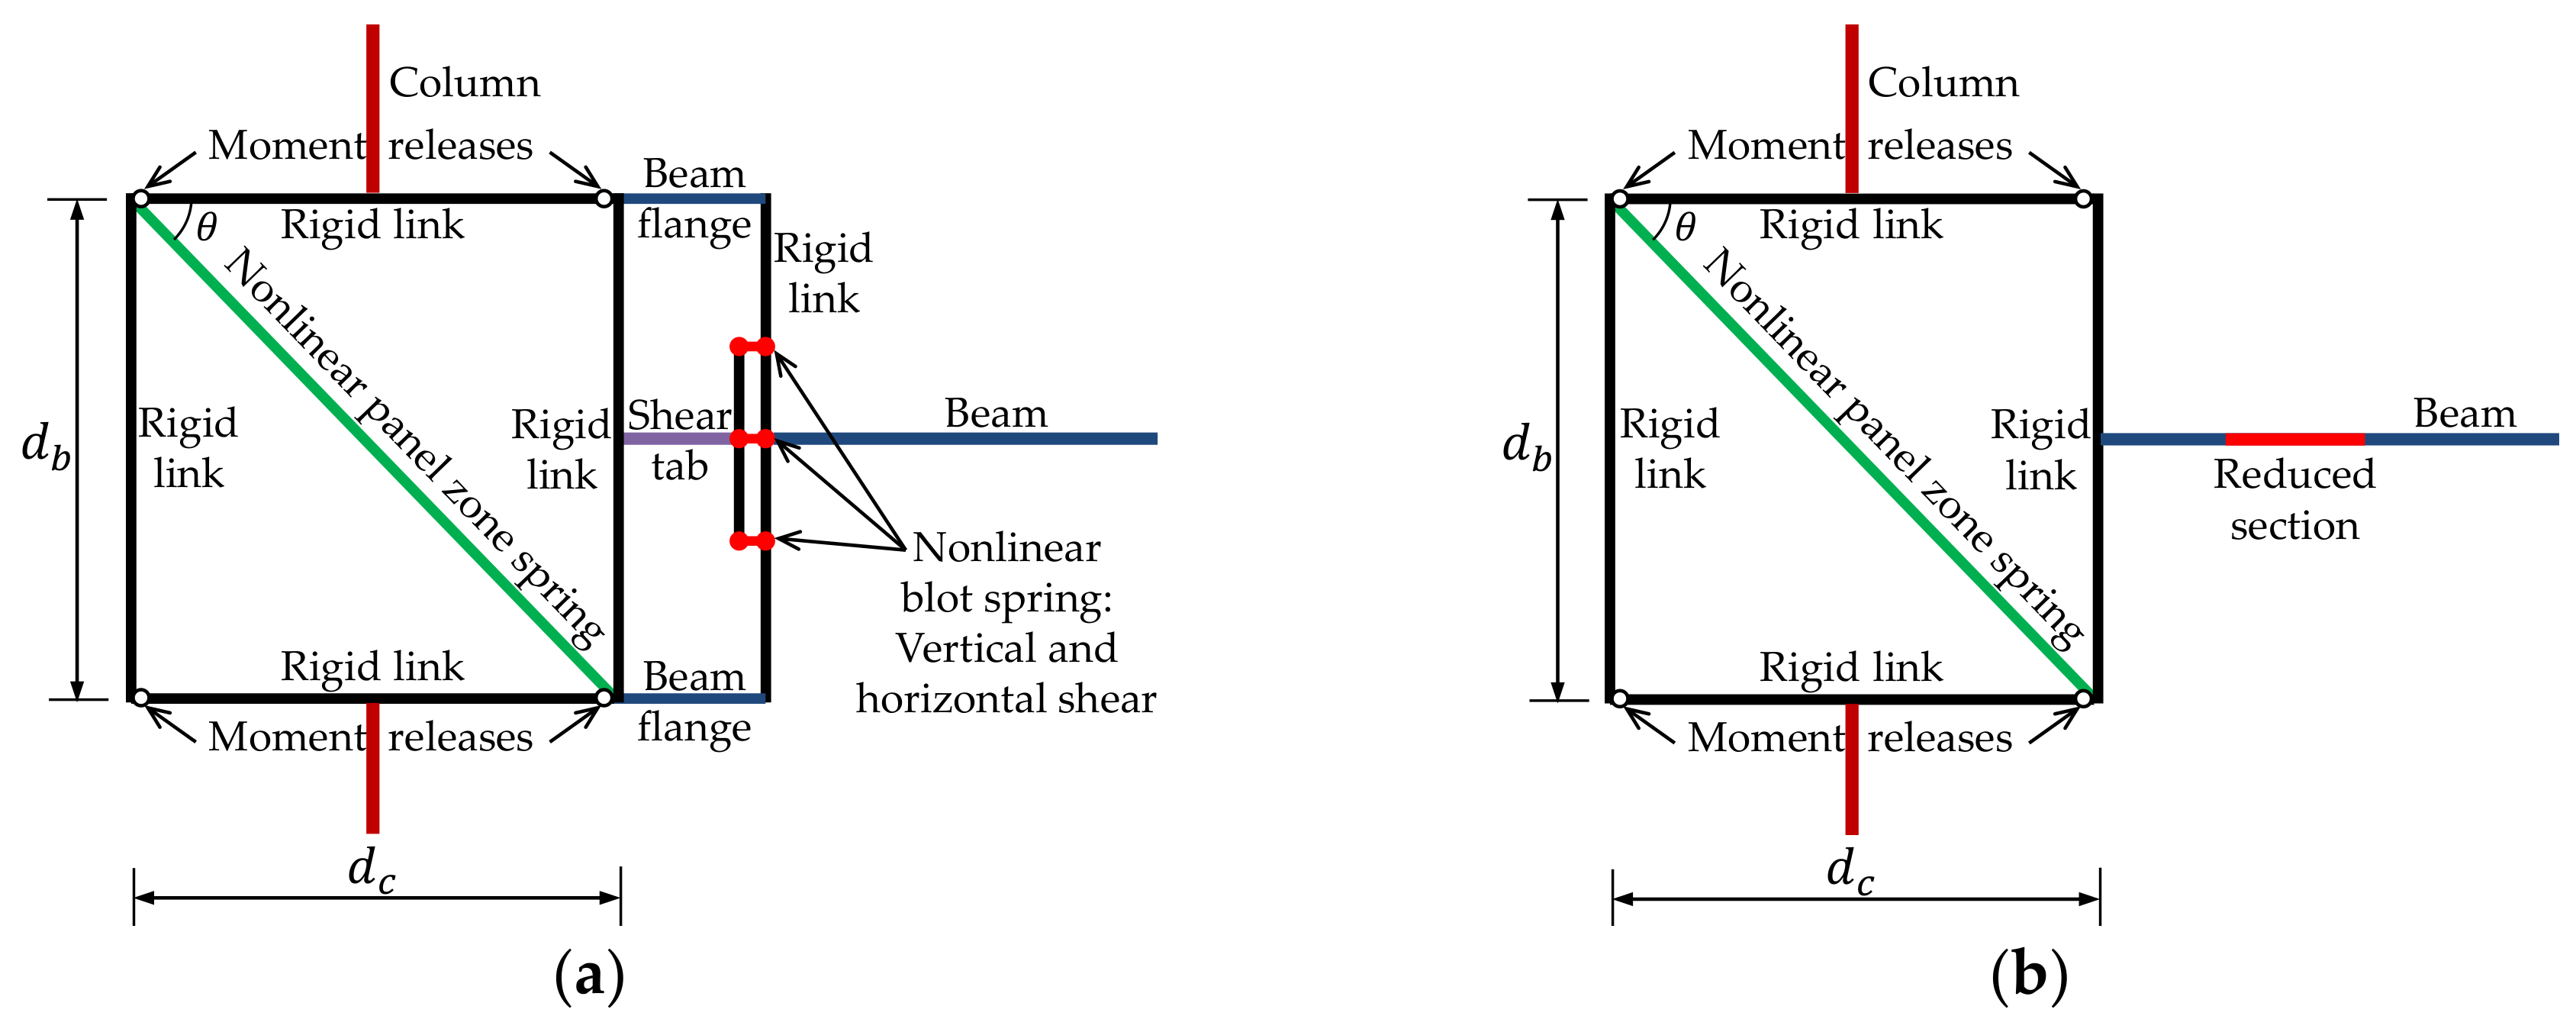
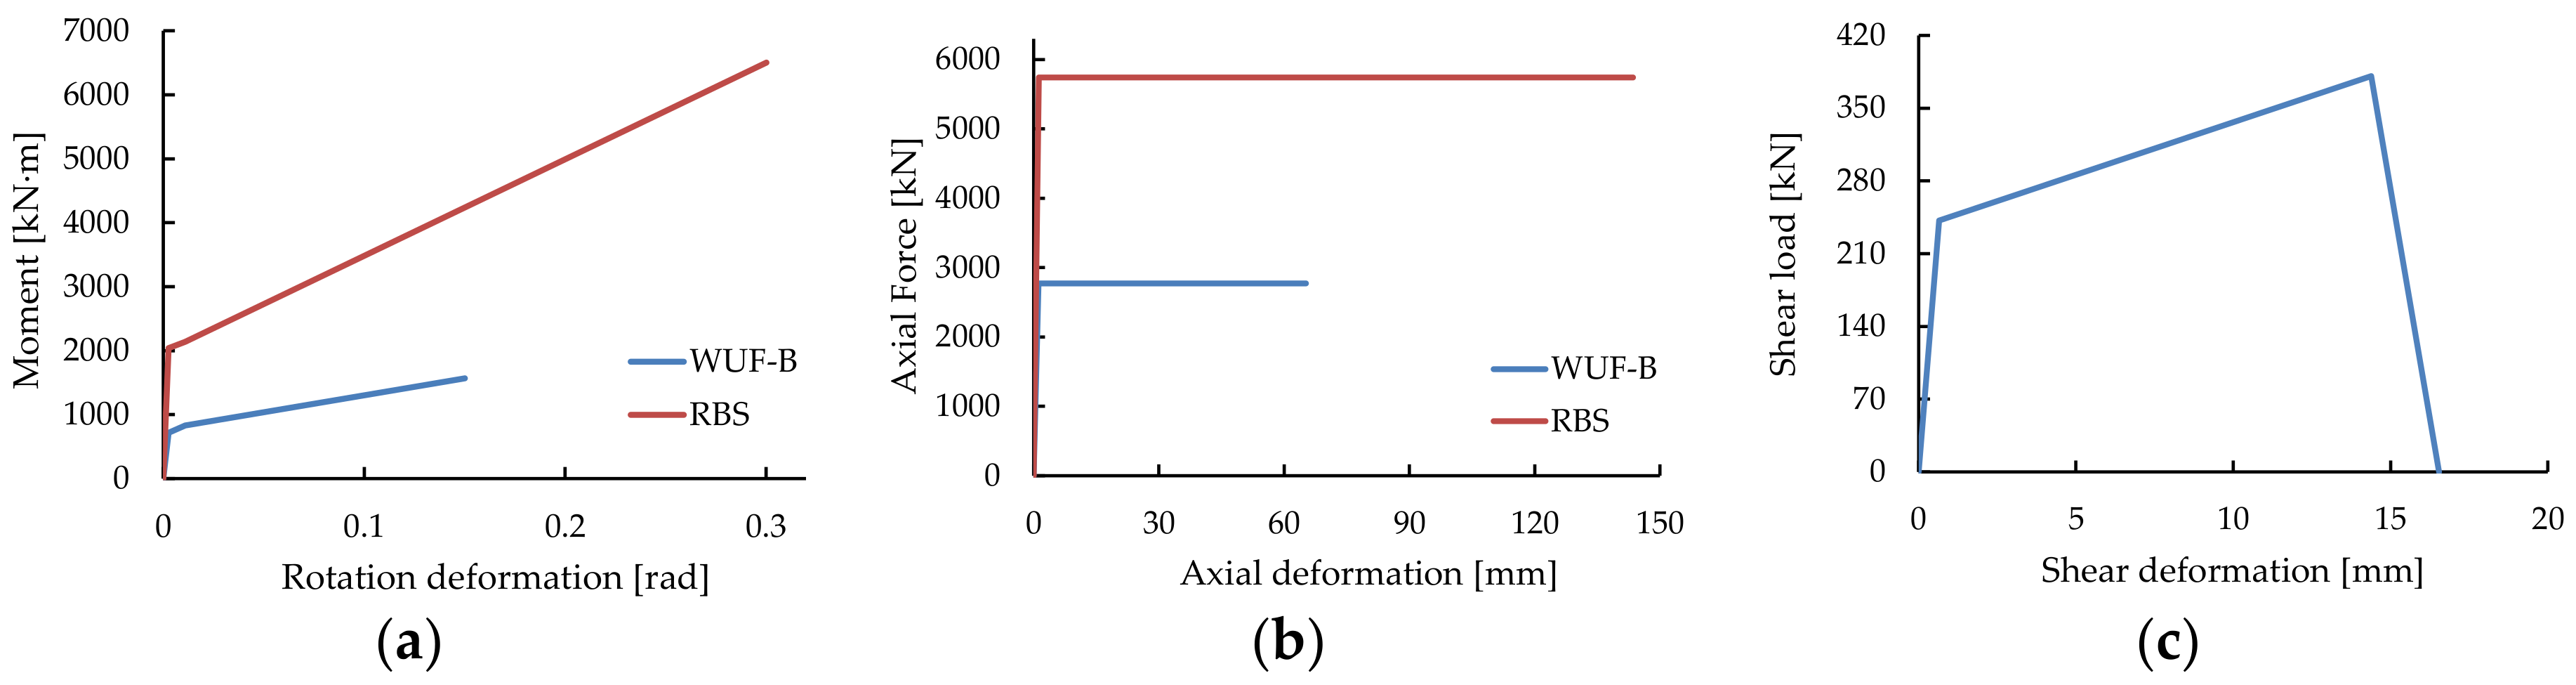
7] and Bao et al. [8] developed the 1-D element modeling method to assess the resistance performance against progressive collapse based on gravity load for steel and reinforced concrete structures. In these modeling approaches, the stiffness of the panel zone with the hinge and the rigid element were applied as the nonlinear uniaxial and shear springs, and the columns and beams with beam elements were connected to the rigid element by constraint. In addition, Main [9] proposed the modeling method using a composite slab with a 2-D shell element and verified the applicability to the 2 × 2 bay floor system structure previously used by Sadek et al. [10] and Alashker et al. [11]. These methods are reliable and reduce time and data consumption in progressive collapse analyses for the entire 3-D structure. As research for the efficient analysis and assessment of the AP method, Izzuddin et al. [12] proposed energy-based approximate analysis with the dynamic effect of sudden column loss using nonlinear static response. Using this analysis, Main and Liu [13] performed column removal scenarios for steel moment frames until the initial failure of the connections to compare the results from the dynamic and energy-based approximate analyses and to evaluate the collapse resistance of the structure. Similarly, Bao et al. [14] analyzed the collapse resistance performance for reinforced concrete structures and evaluated the structural robustness as the maximum residual capacity of the structural system that can resist progressive collapse induced by sudden column loss. Starossek and Haberland [15] analyzed the sensitivity of the structure to local failure on the basis of energy released and required, quantification of damage progression, and system stiffness. Based on the aforementioned studies, Noh et al. [16] evaluated sensitivity using structural robustness under the column removal scenario for seismically designed steel moment frames. Structural sensitivity is a relative evaluation index used for the reduction of load-bearing capacity depending on the column removal location and for the determination of the column, which is sensitive. It is also advantageous to determine which system is sensitive to progressive collapse in different structural systems, comparing various structures on the basis of seismic design. Thus, structural sensitivity can be categorized into structural systems depending on collapse resistance performance among their various structures on the basis of seismic design and can be directly helpful for structural design. However, there was no previous research reporting the assessment of the sensitivity of progressive collapse to different structural systems, while Noh et al. [16] indicted that an analysis of sensitivity is required for steel moment frames with different connection details or structural systems.
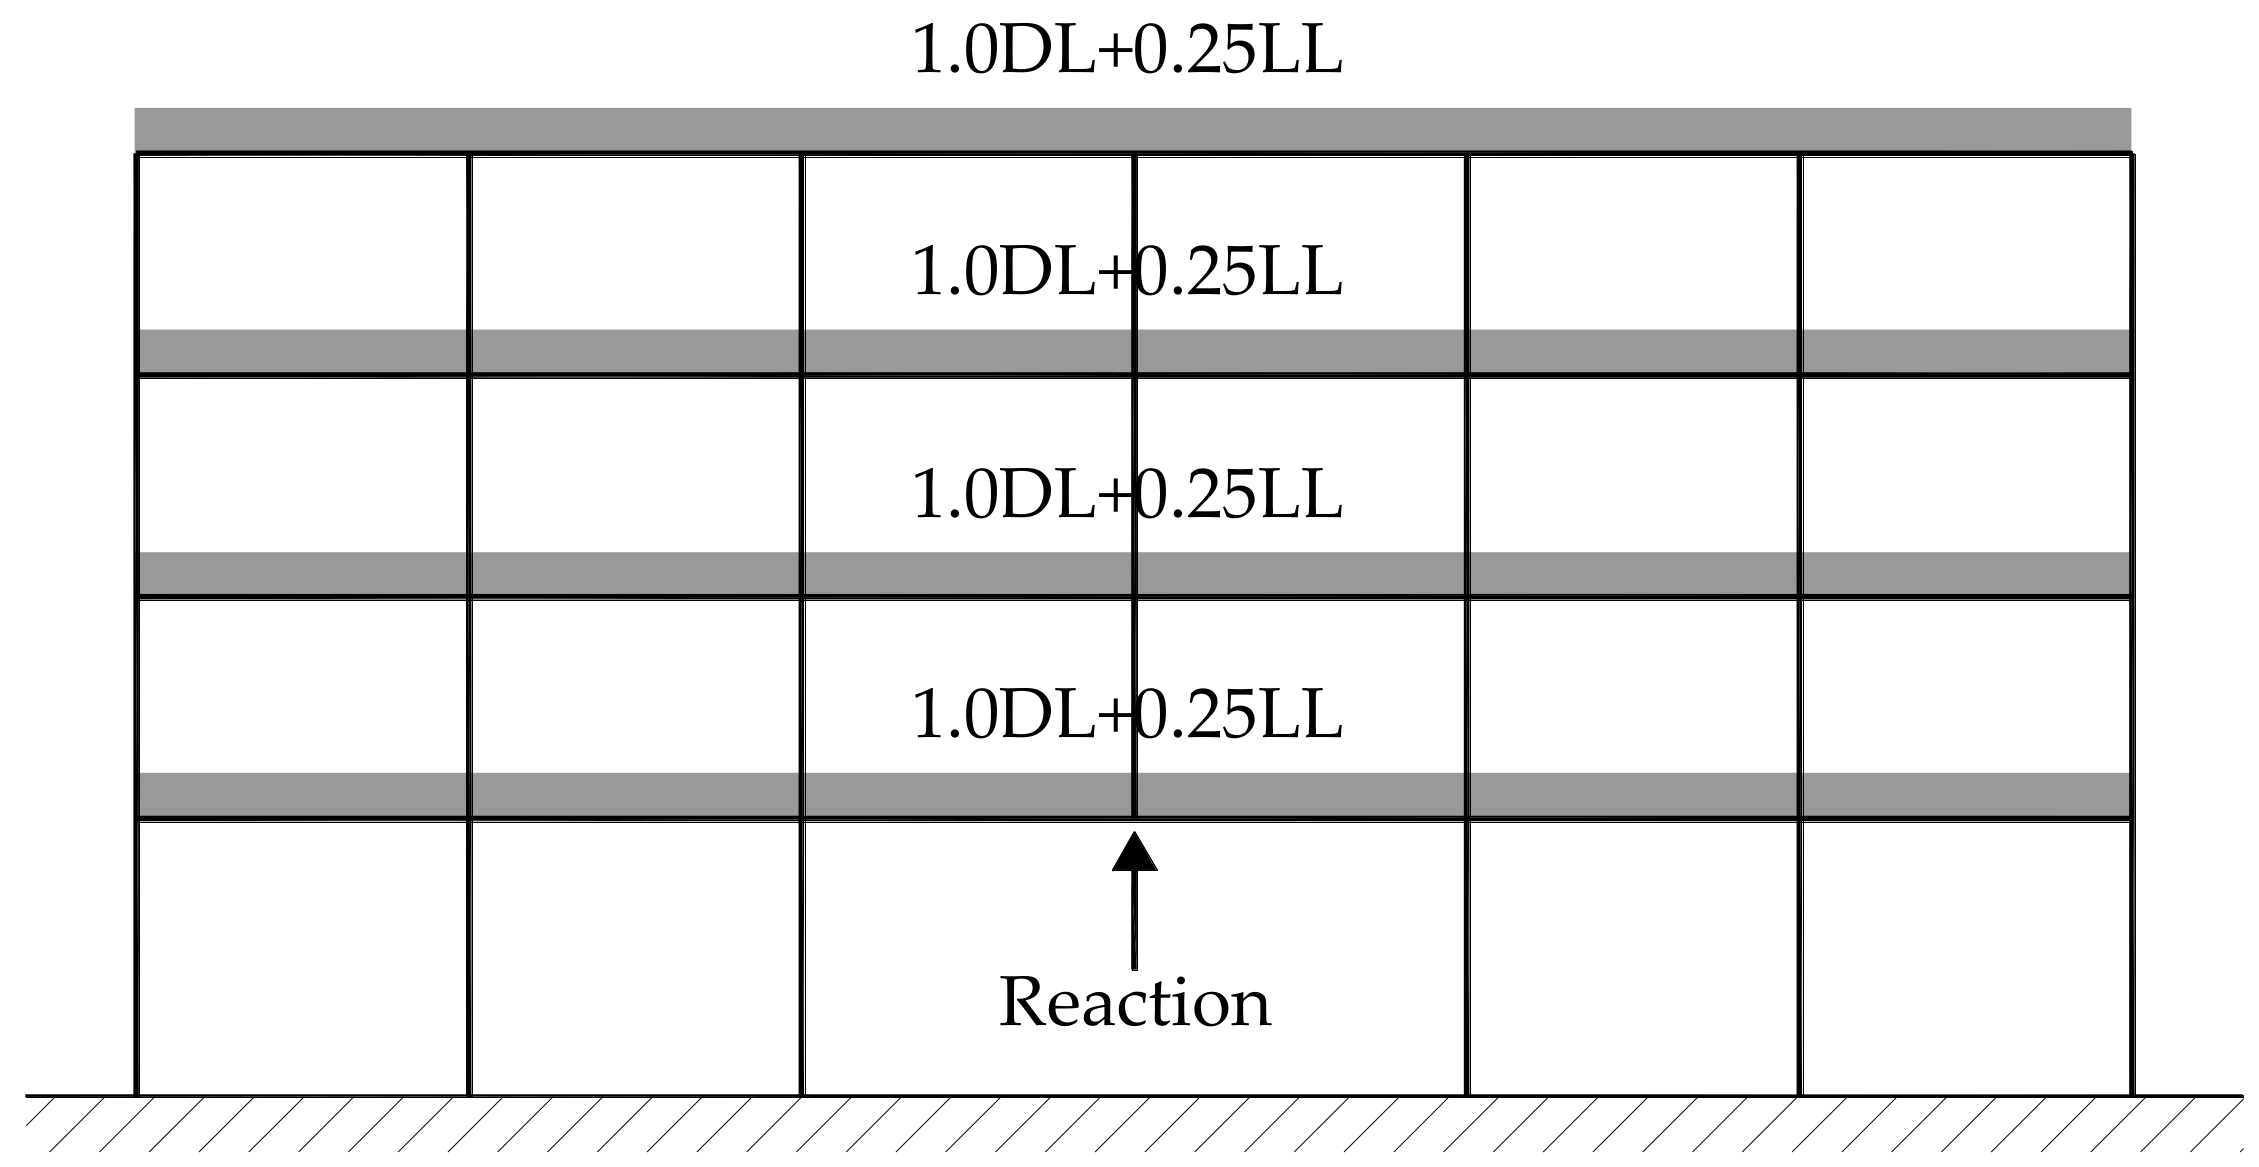
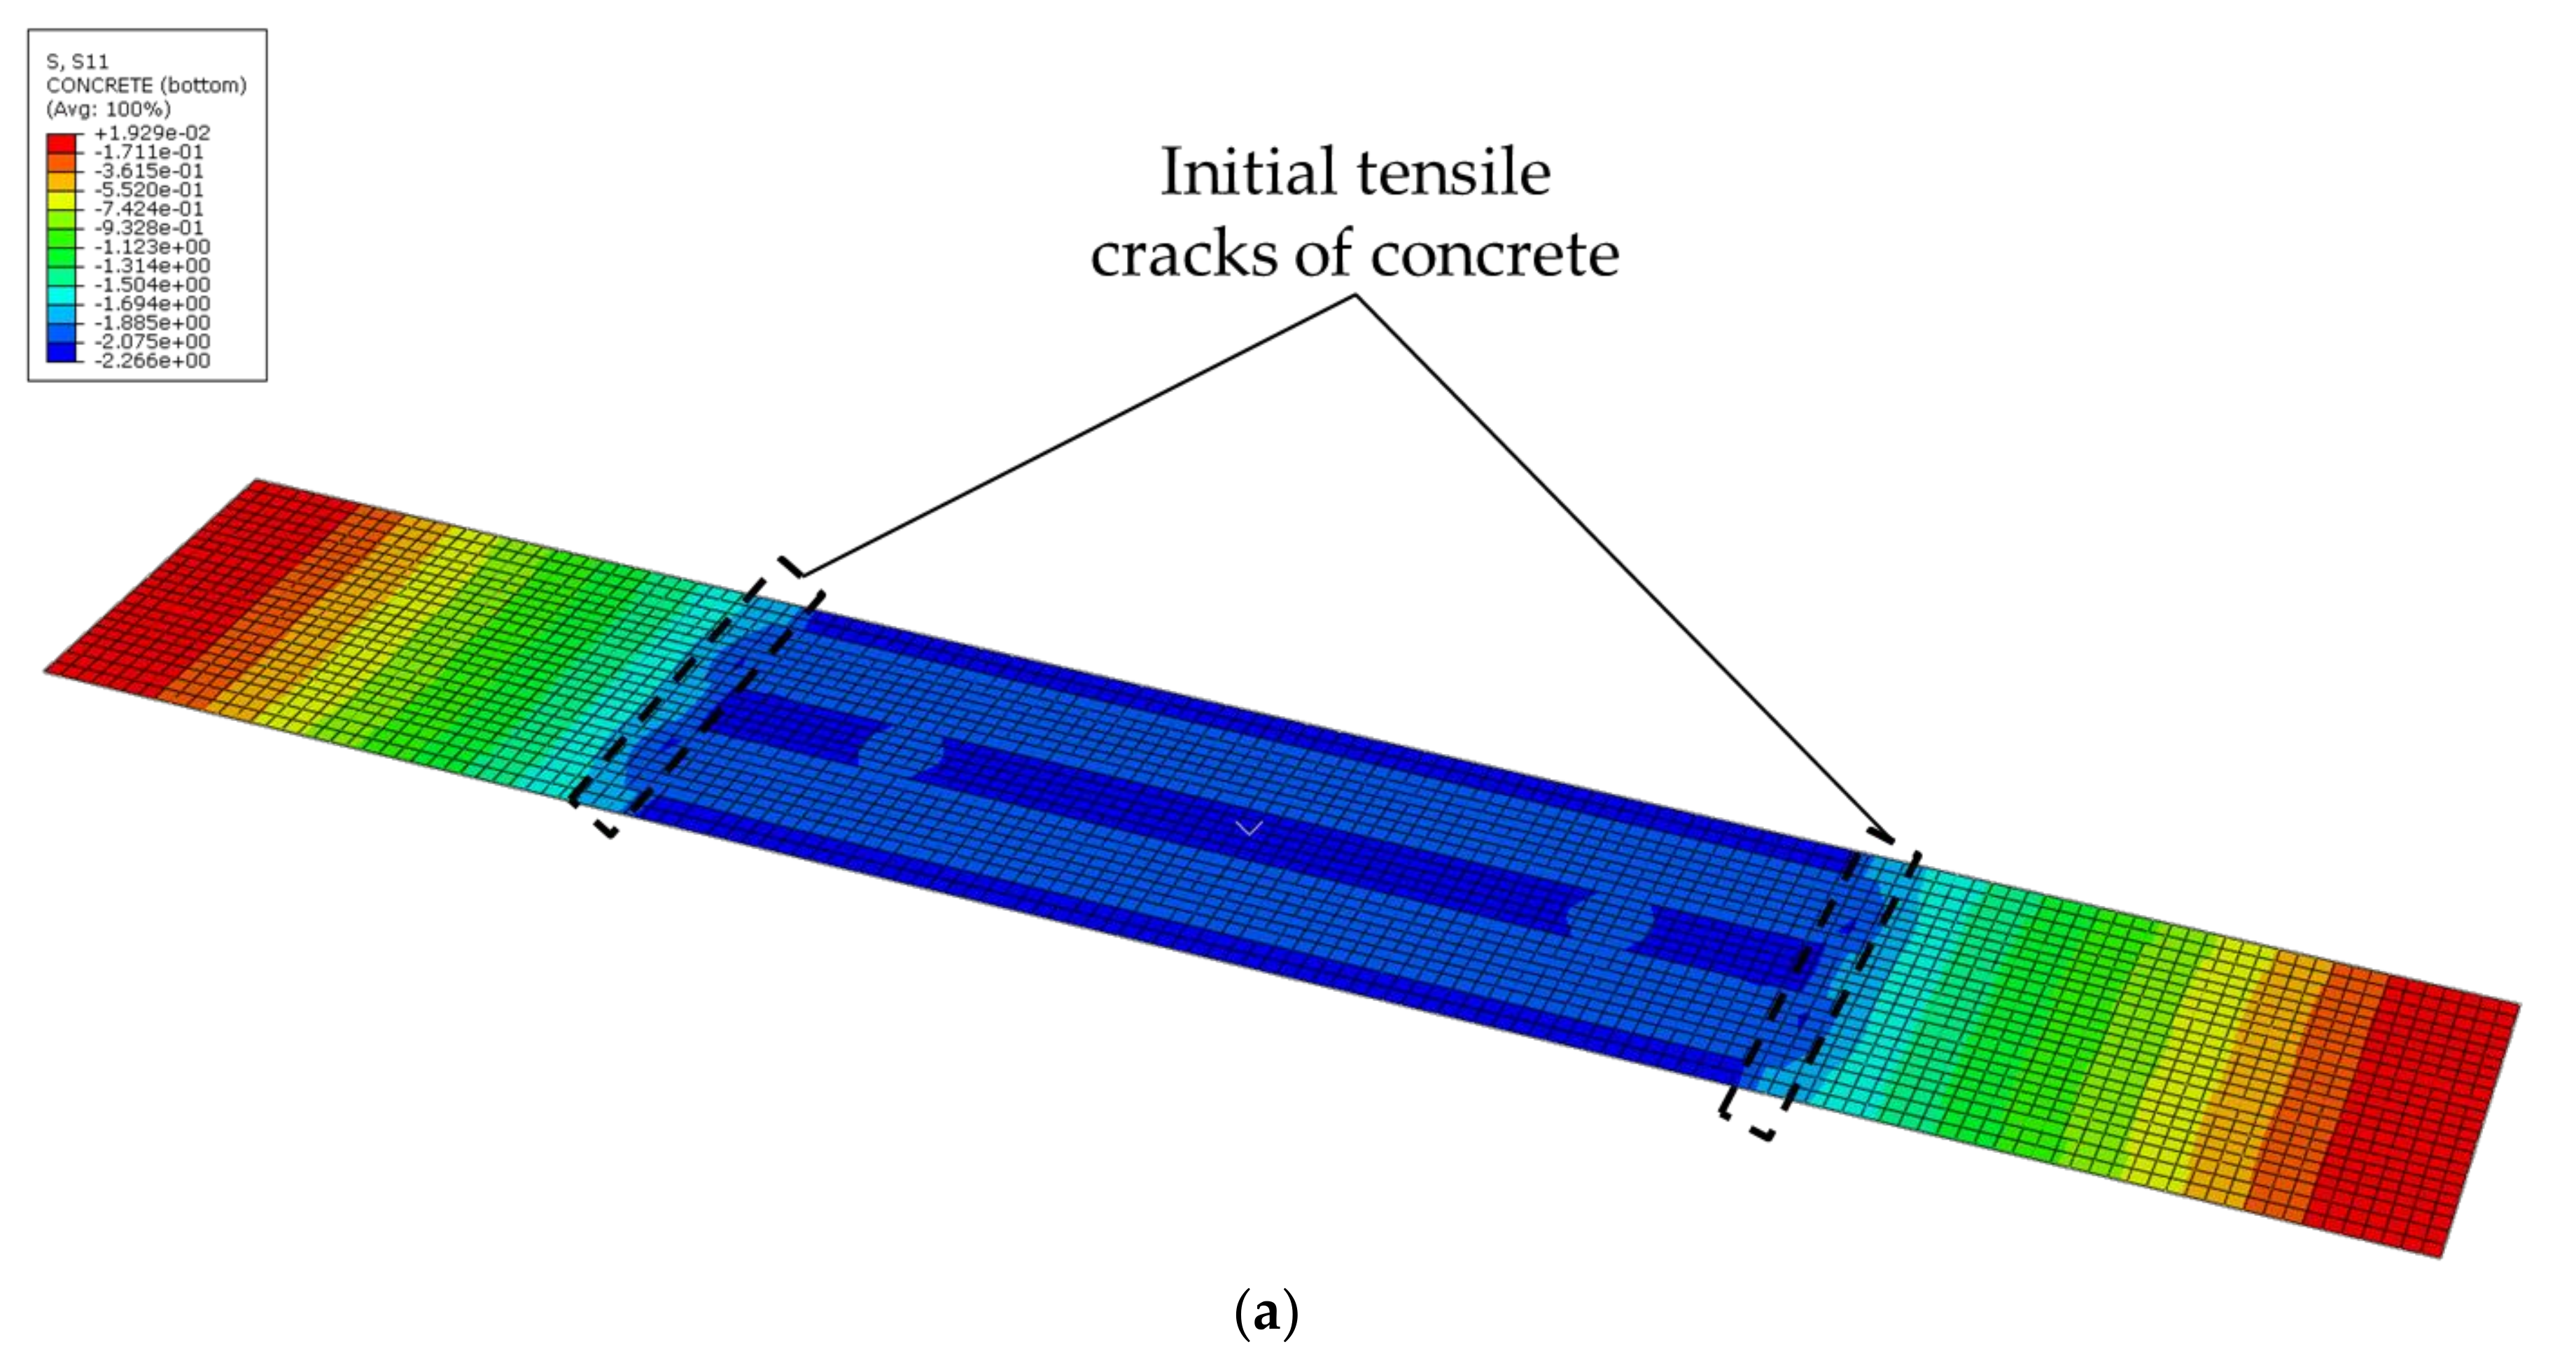
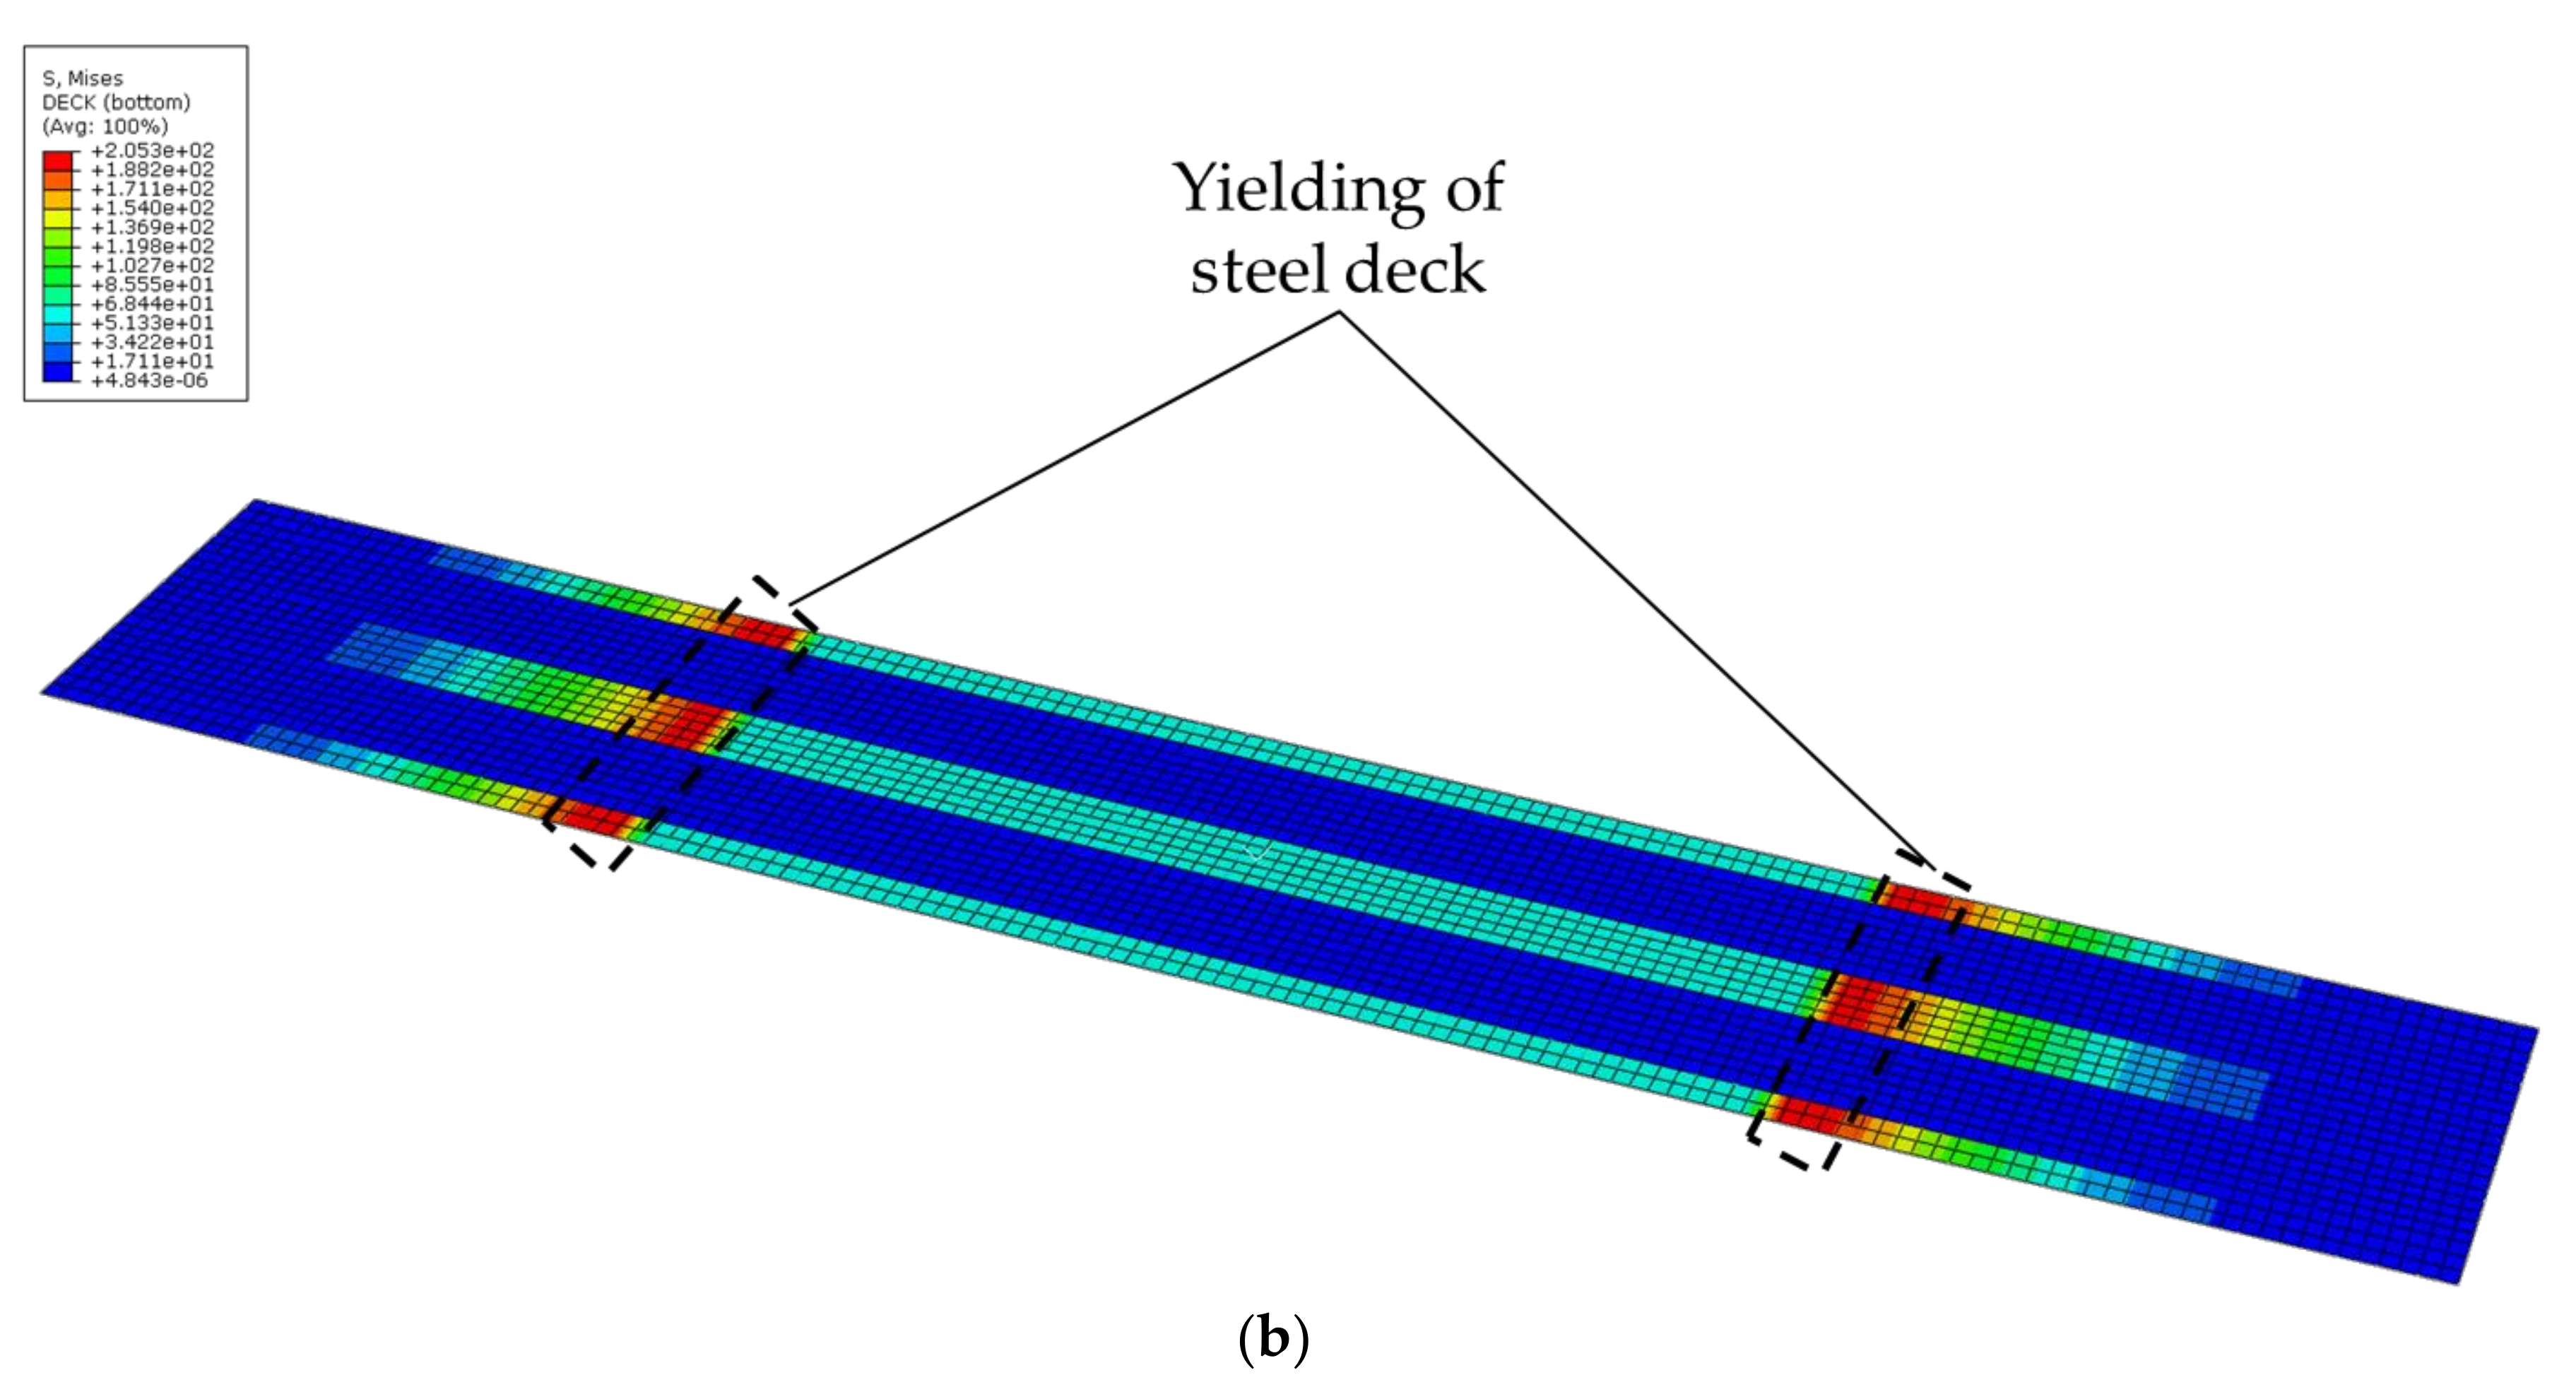
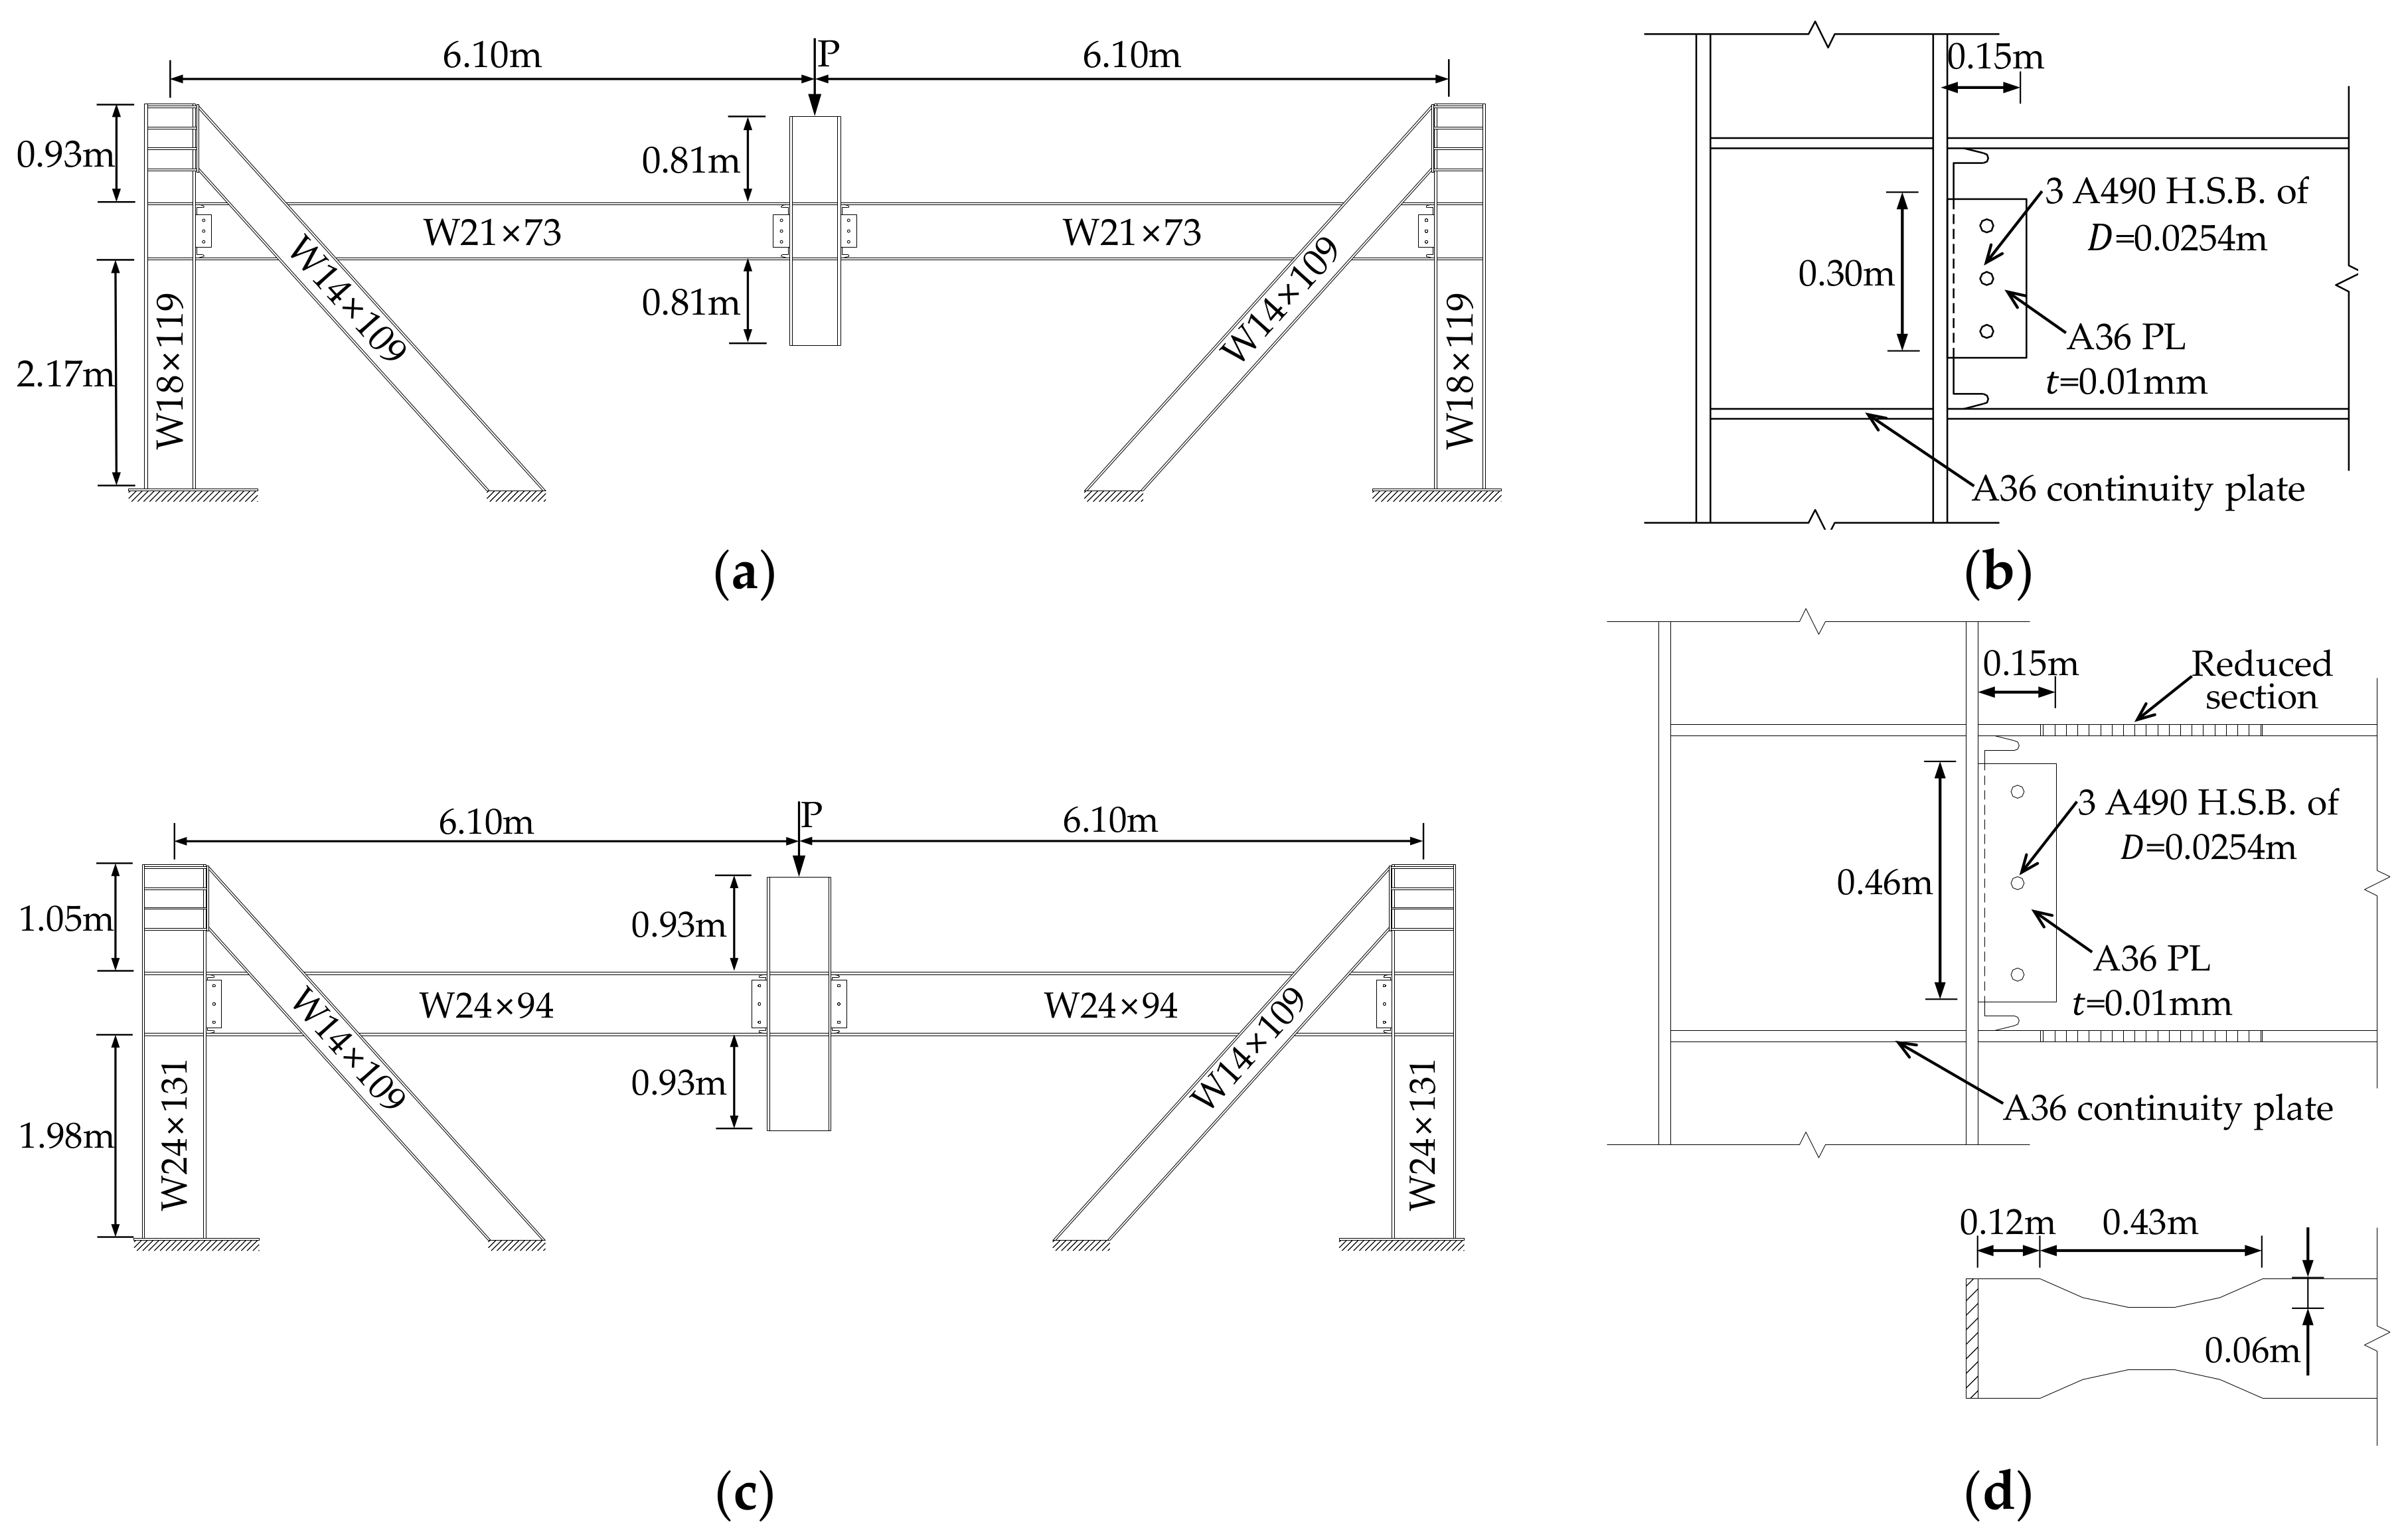
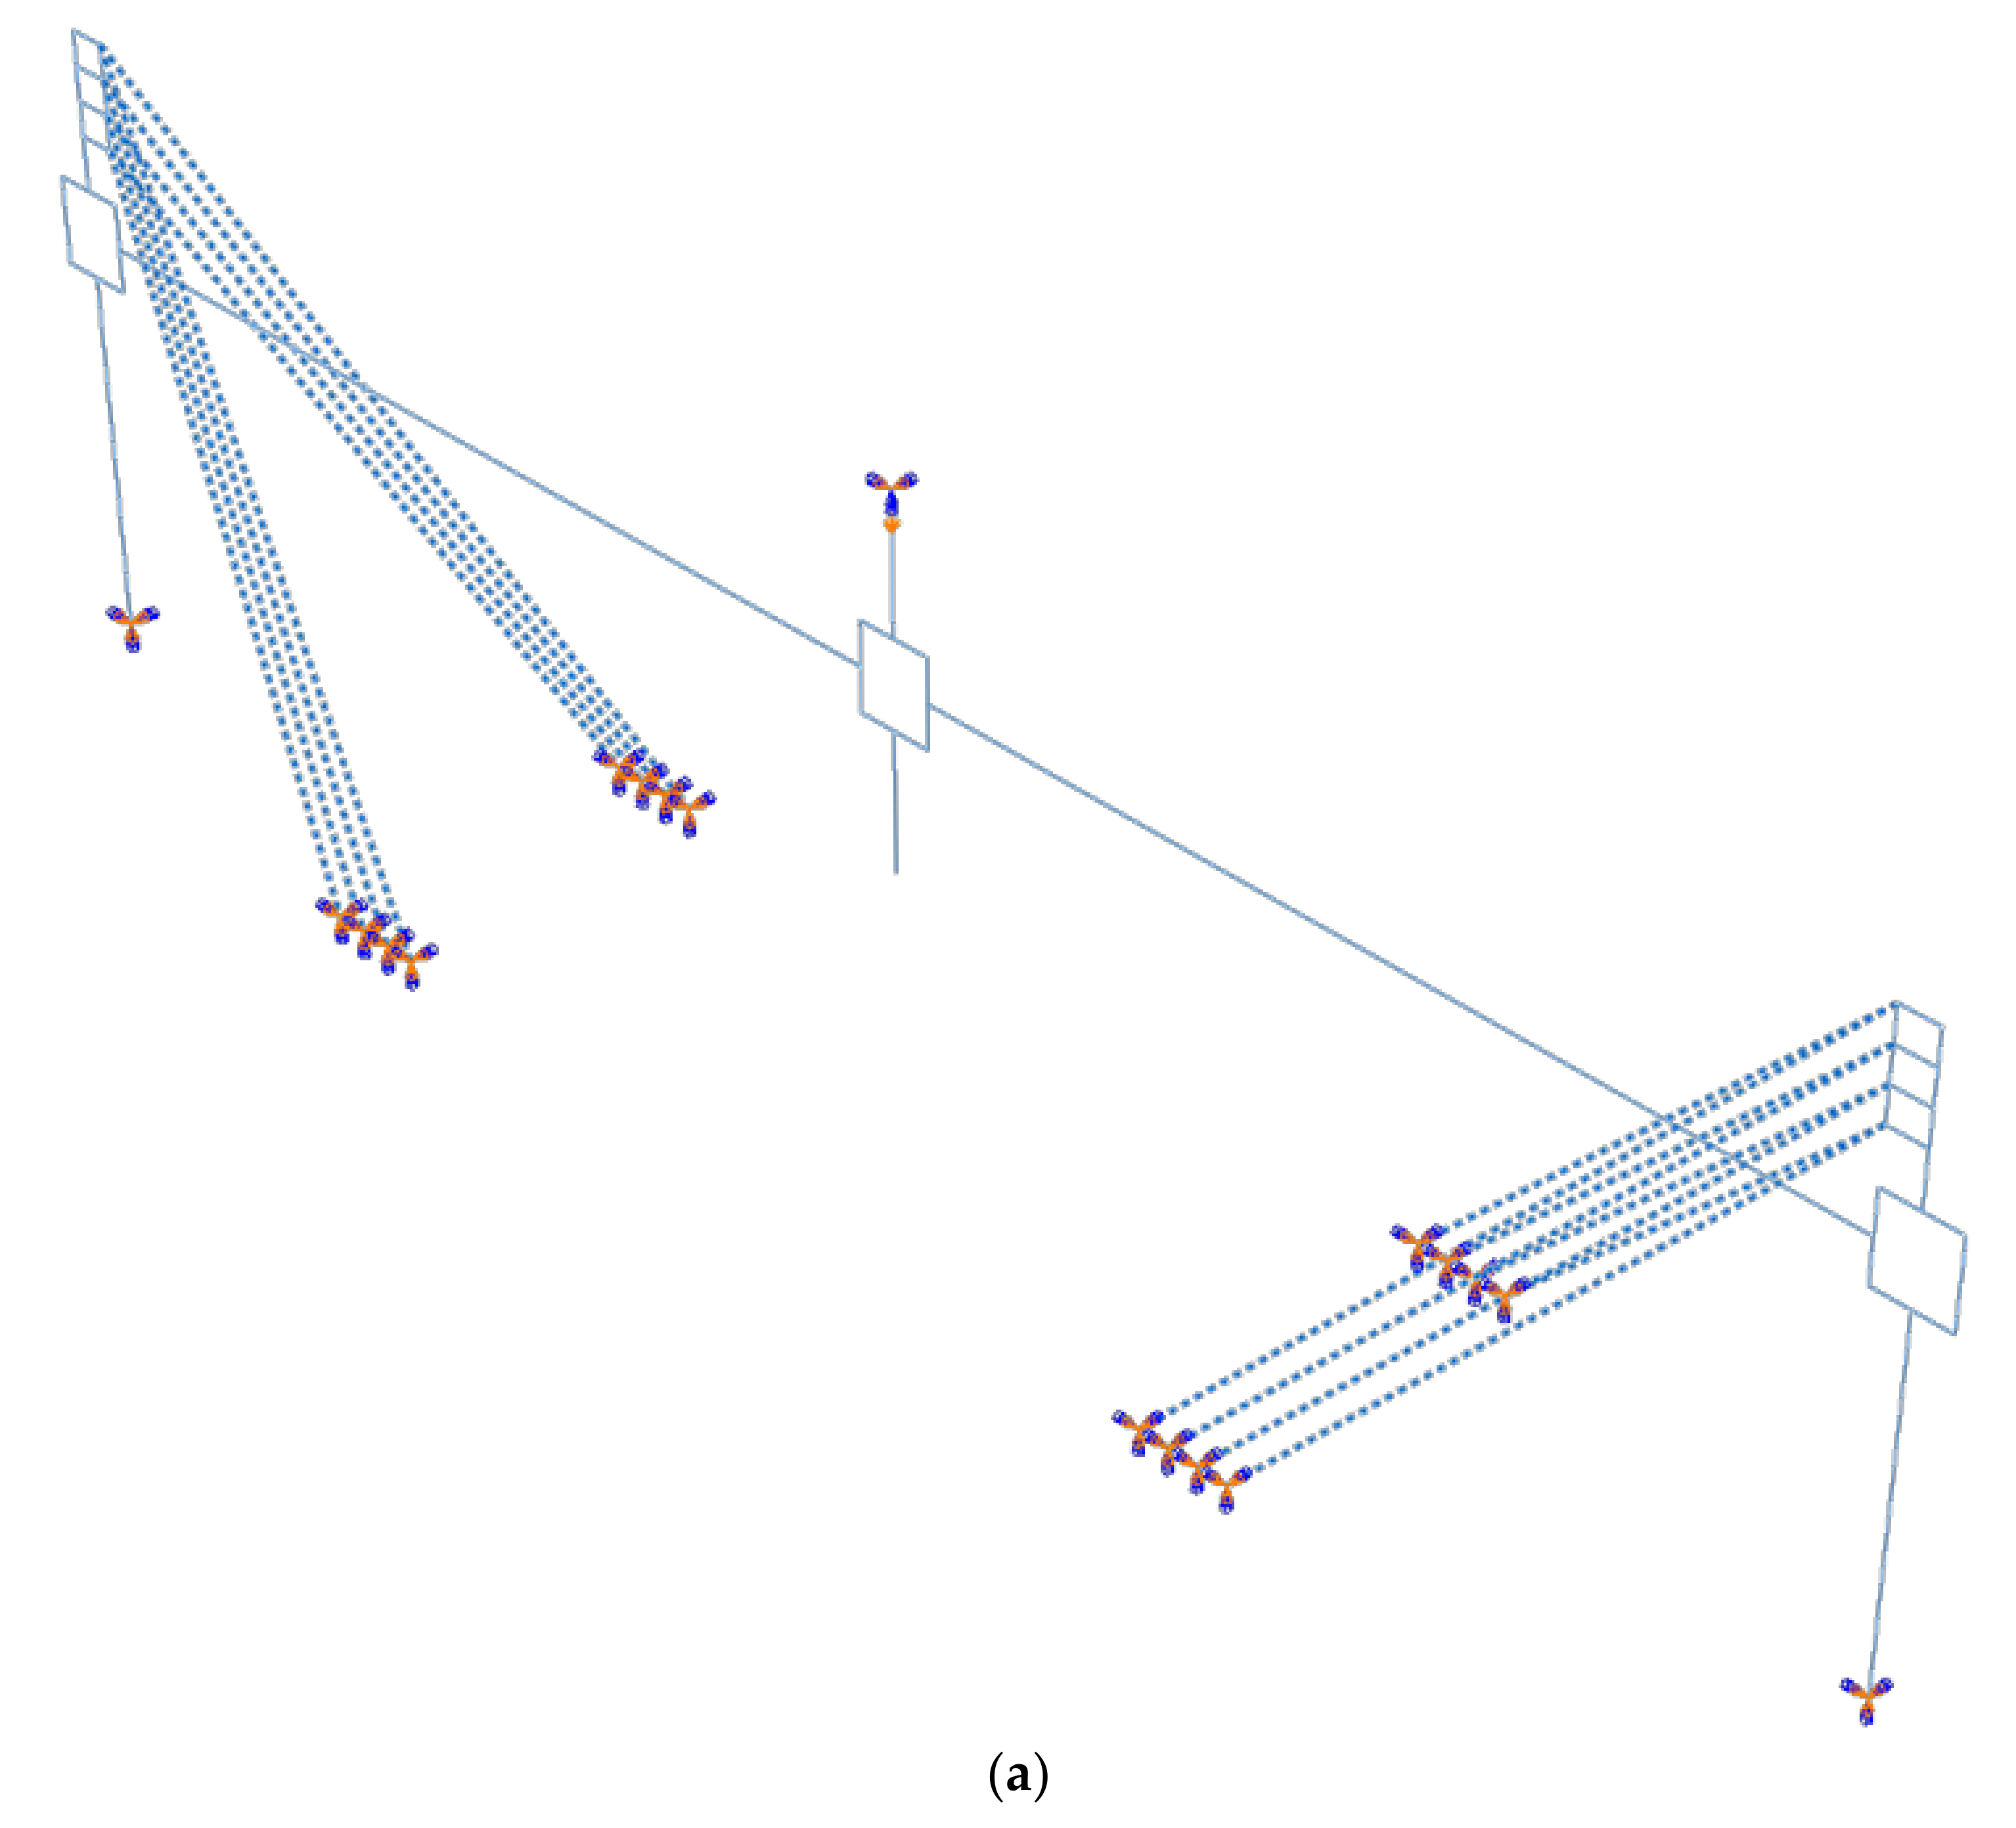
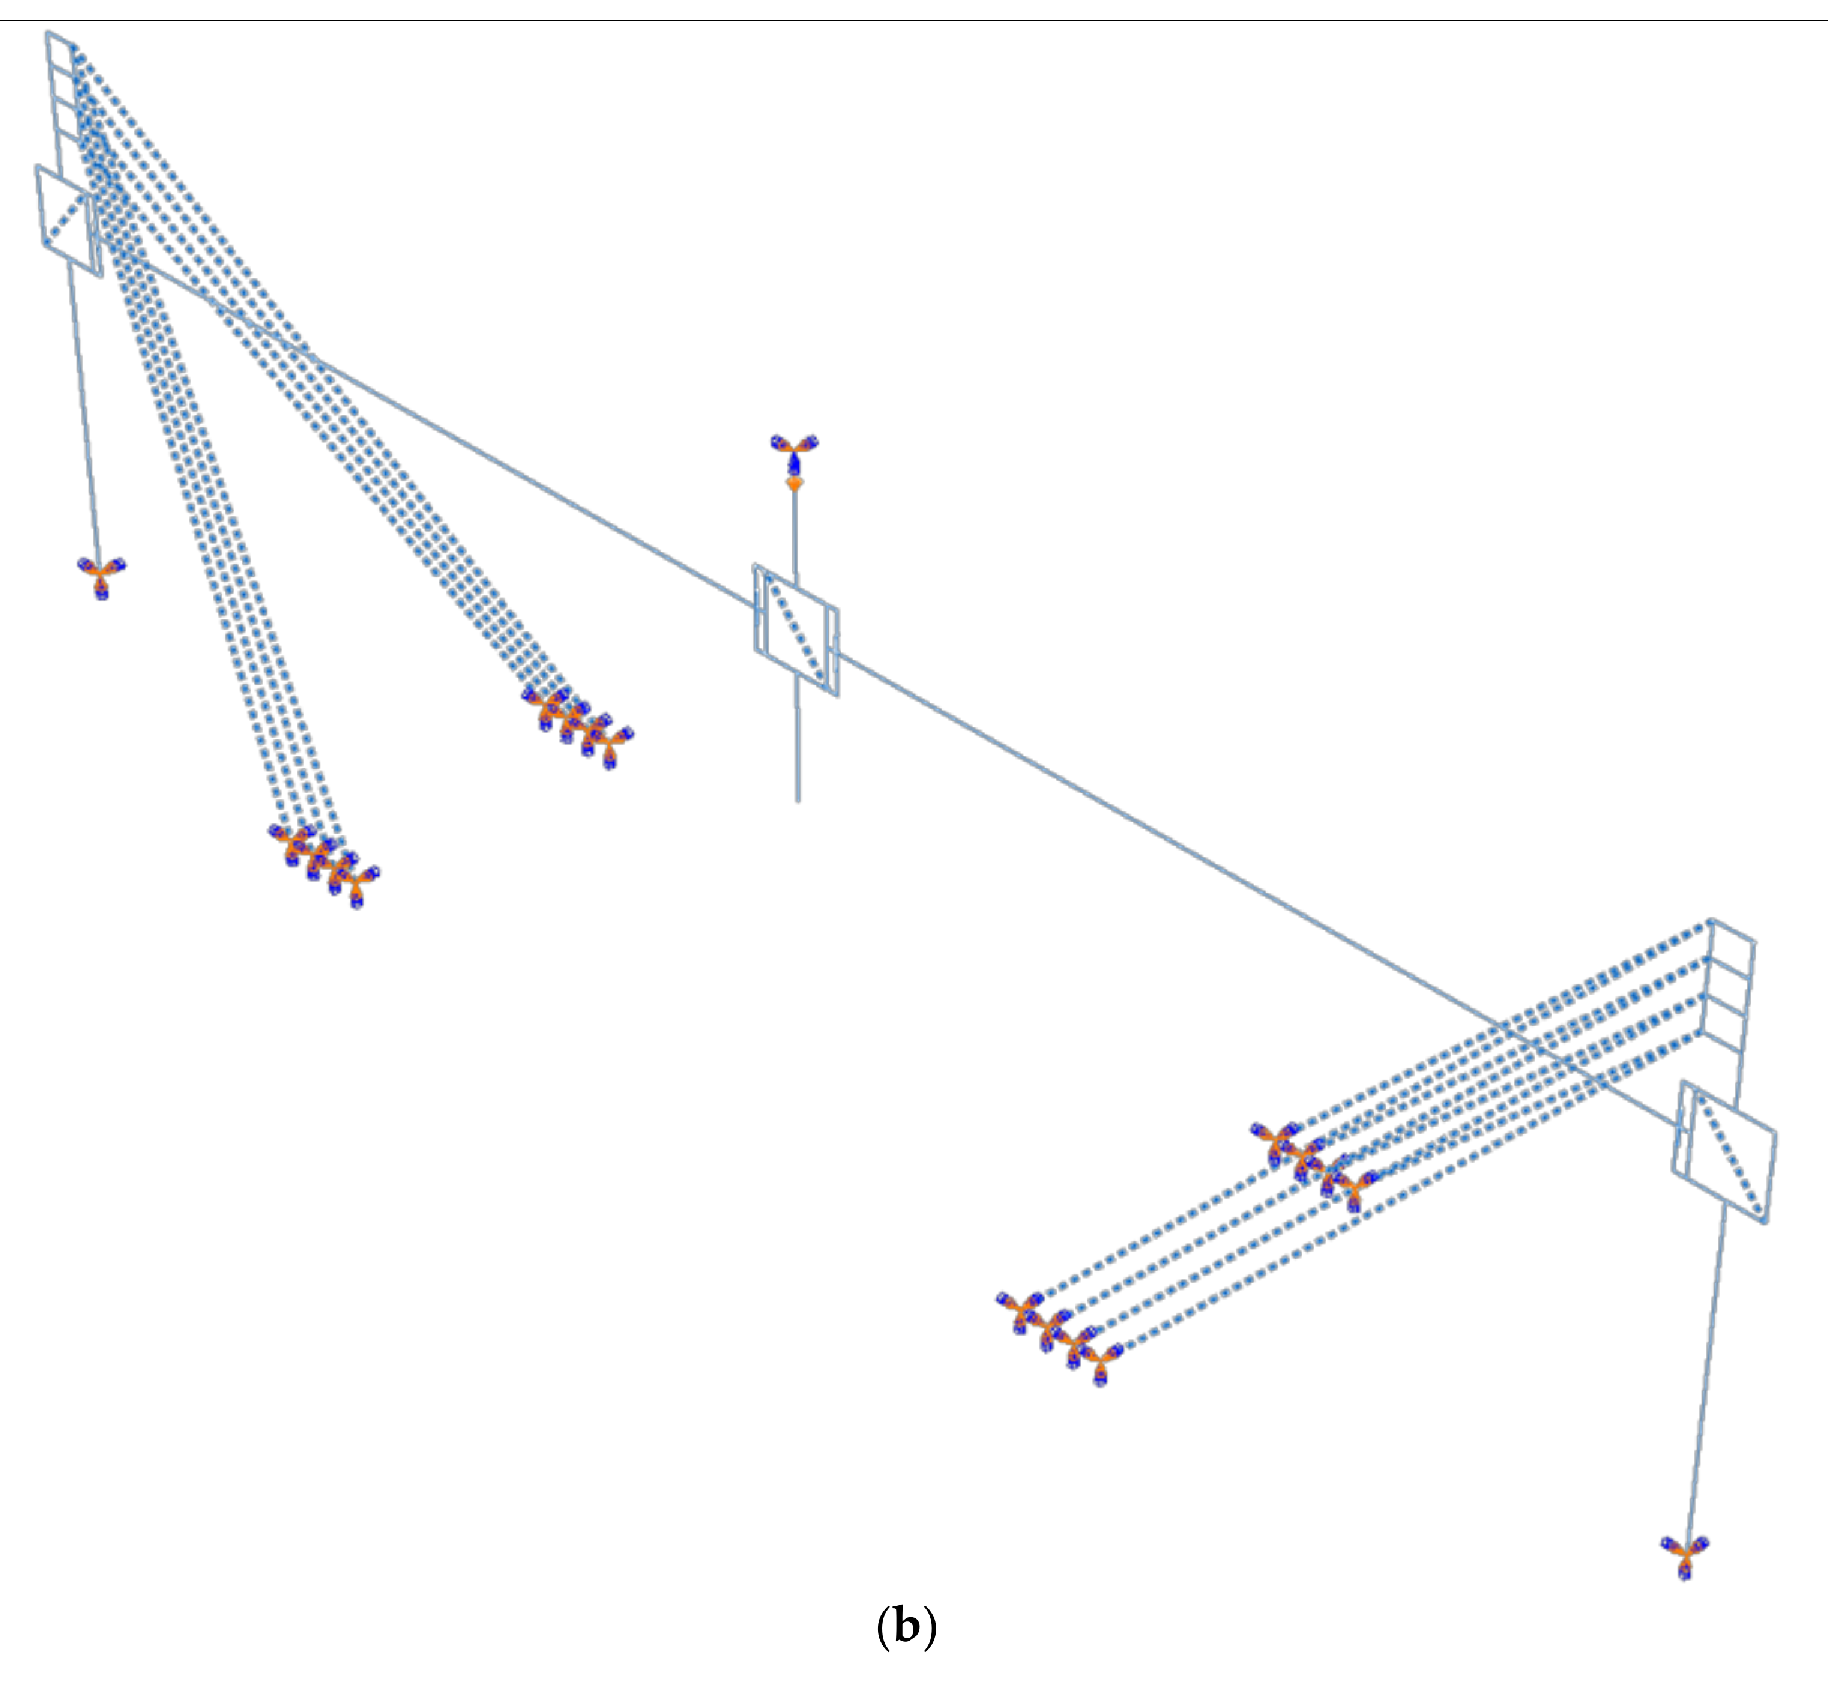
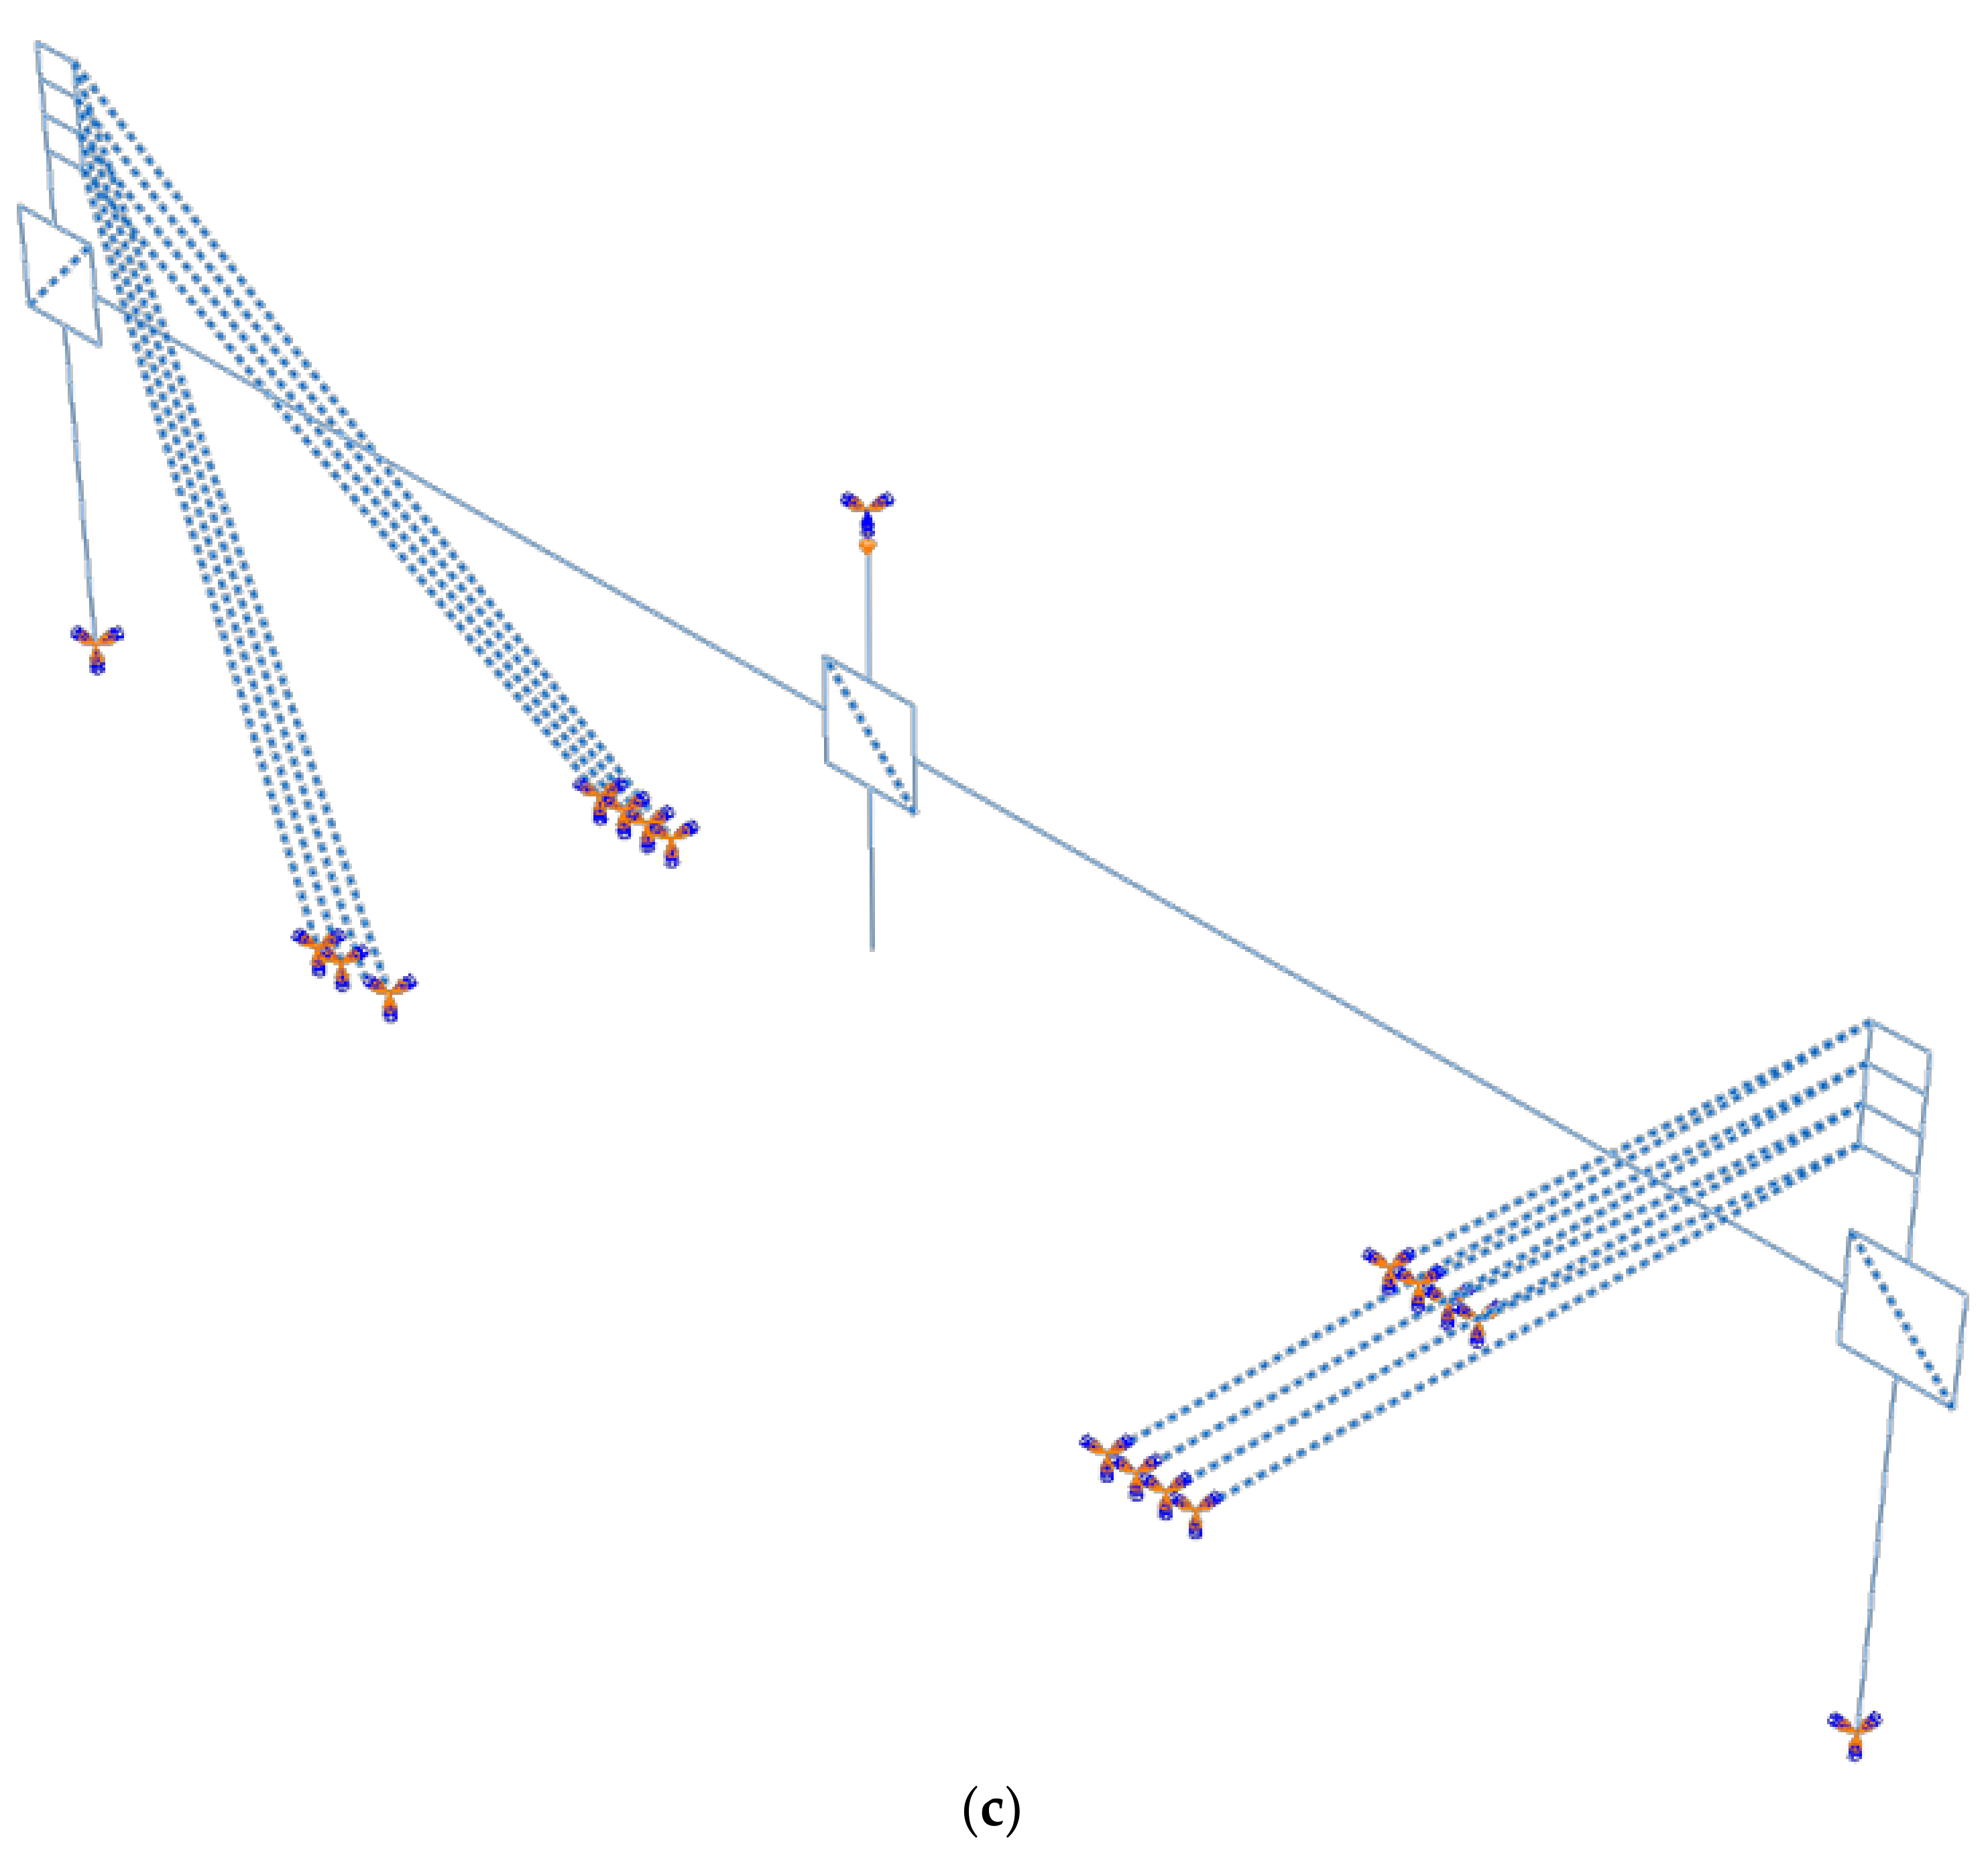
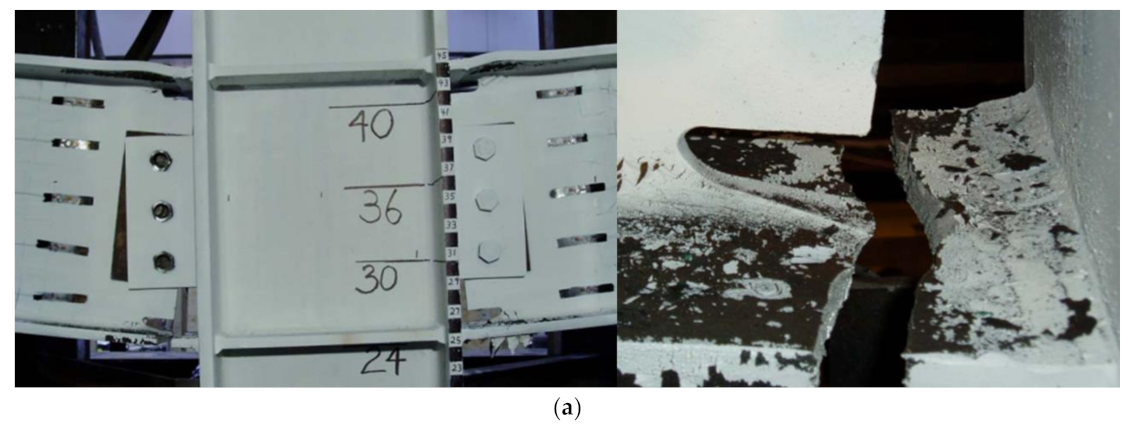
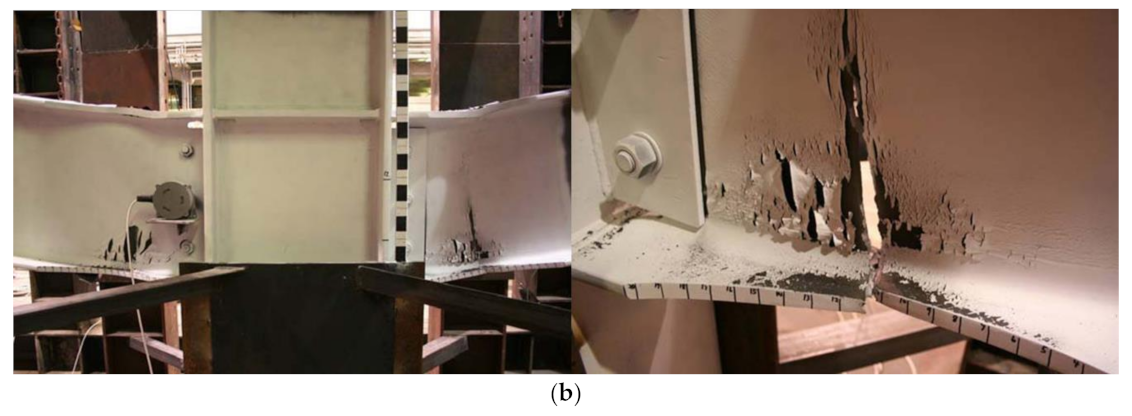
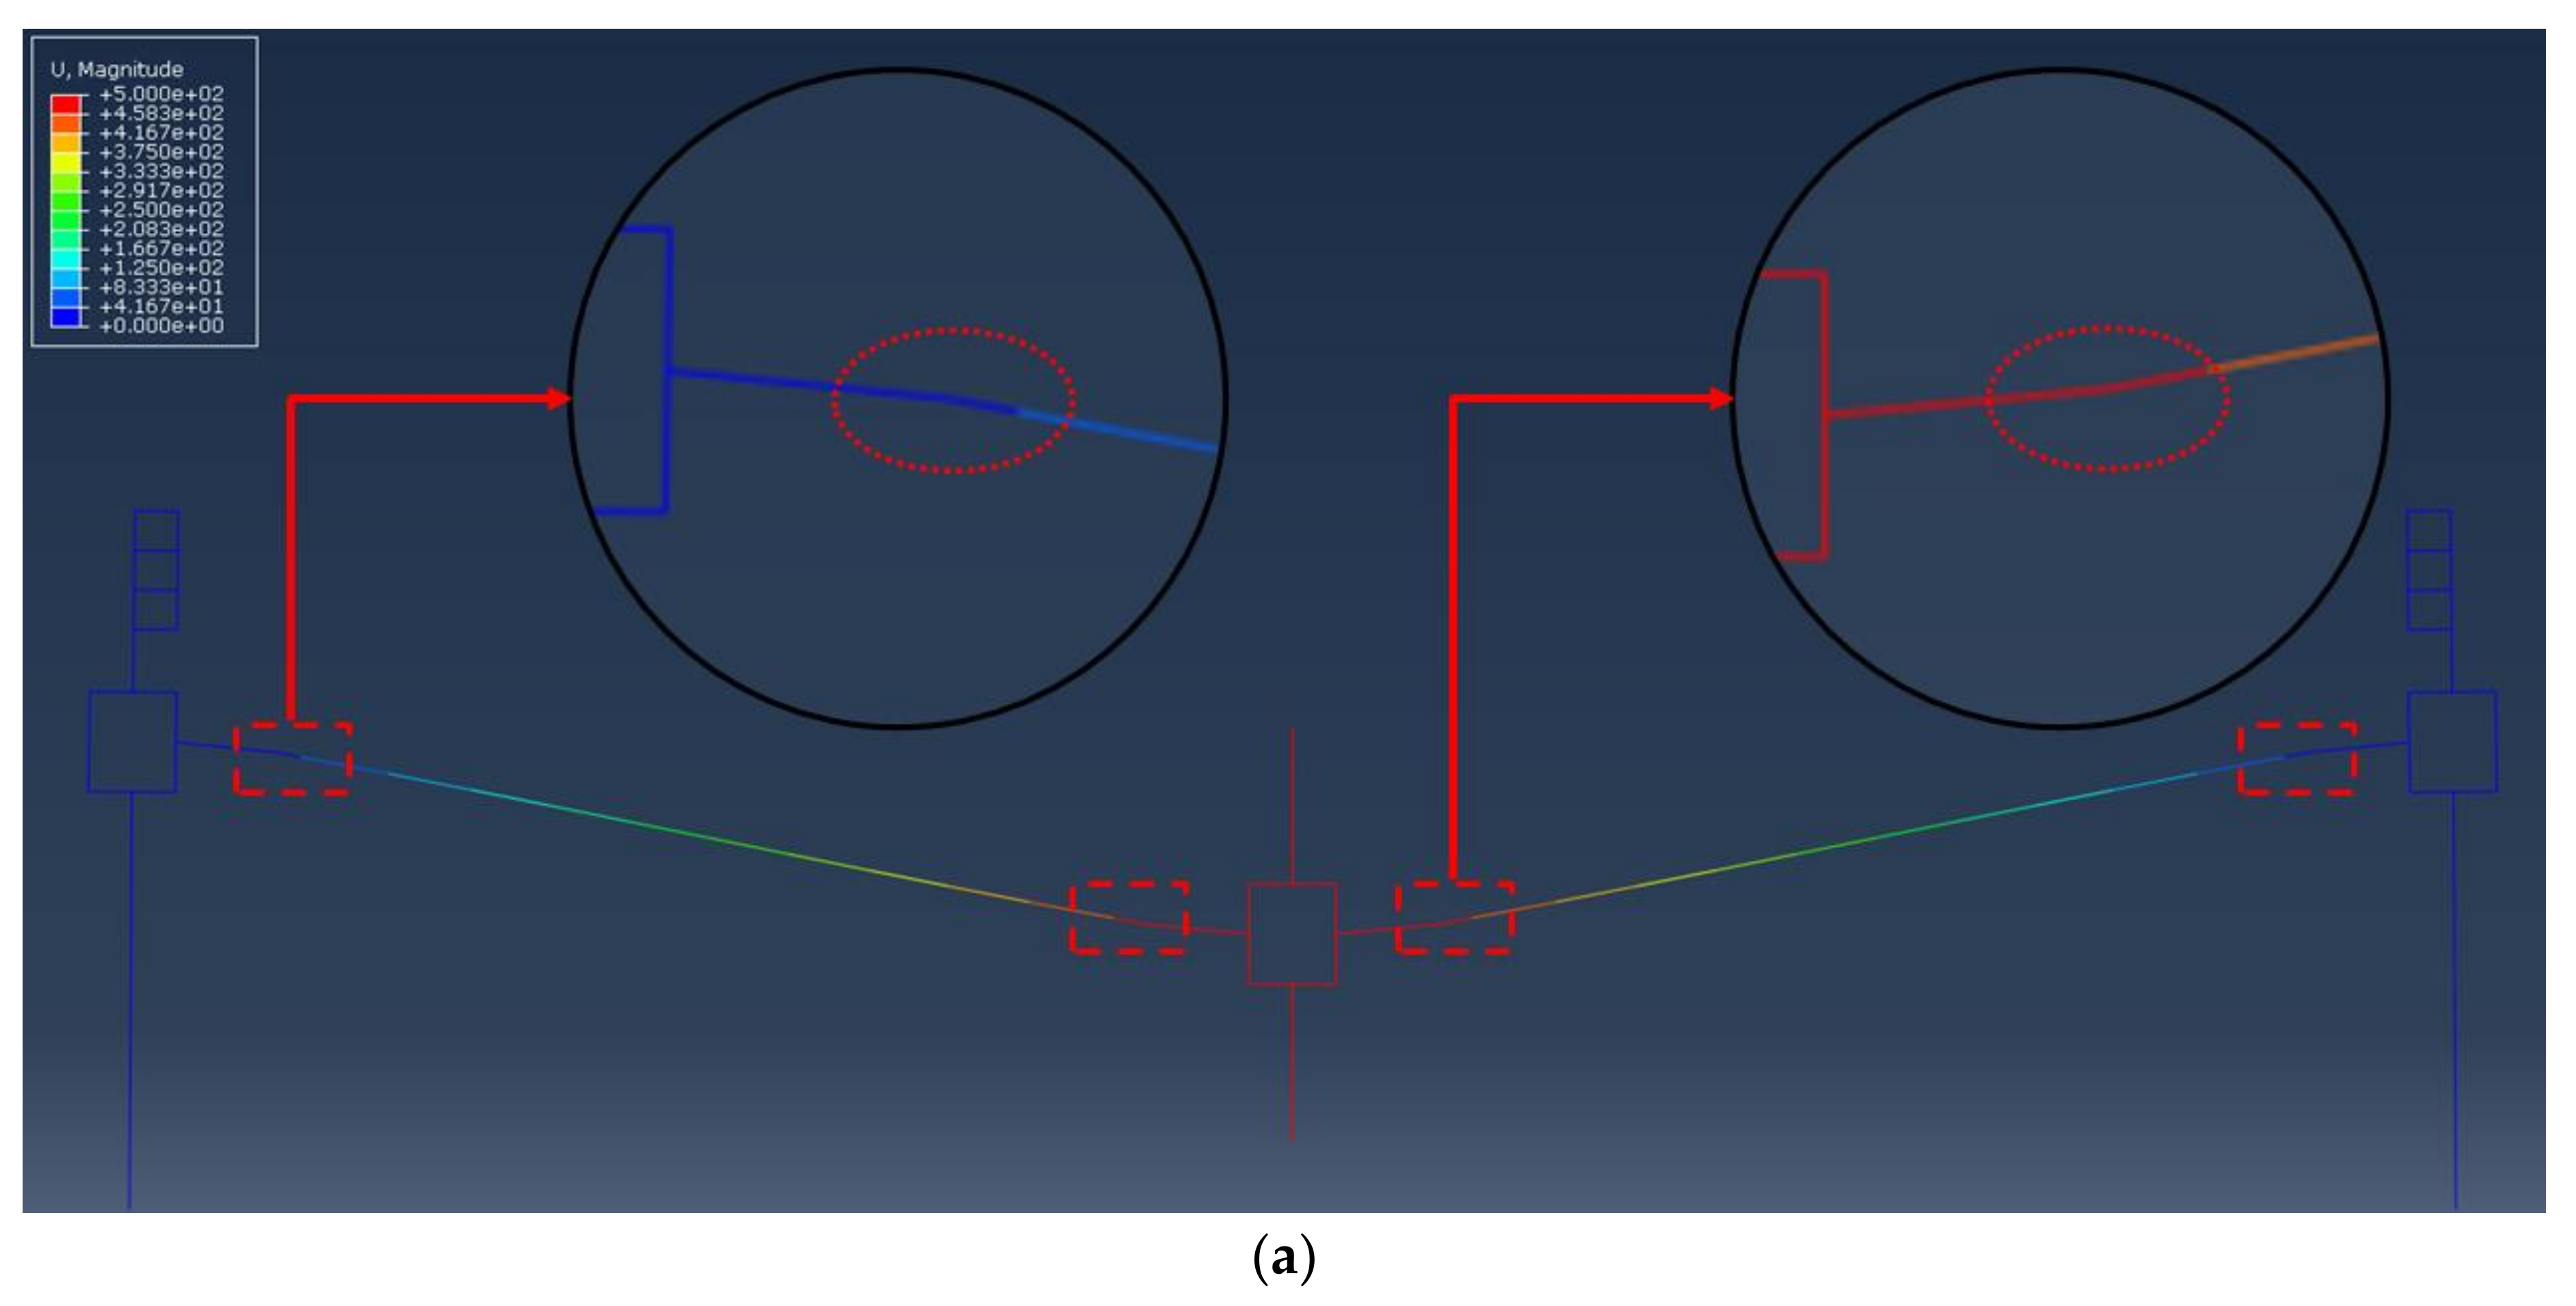
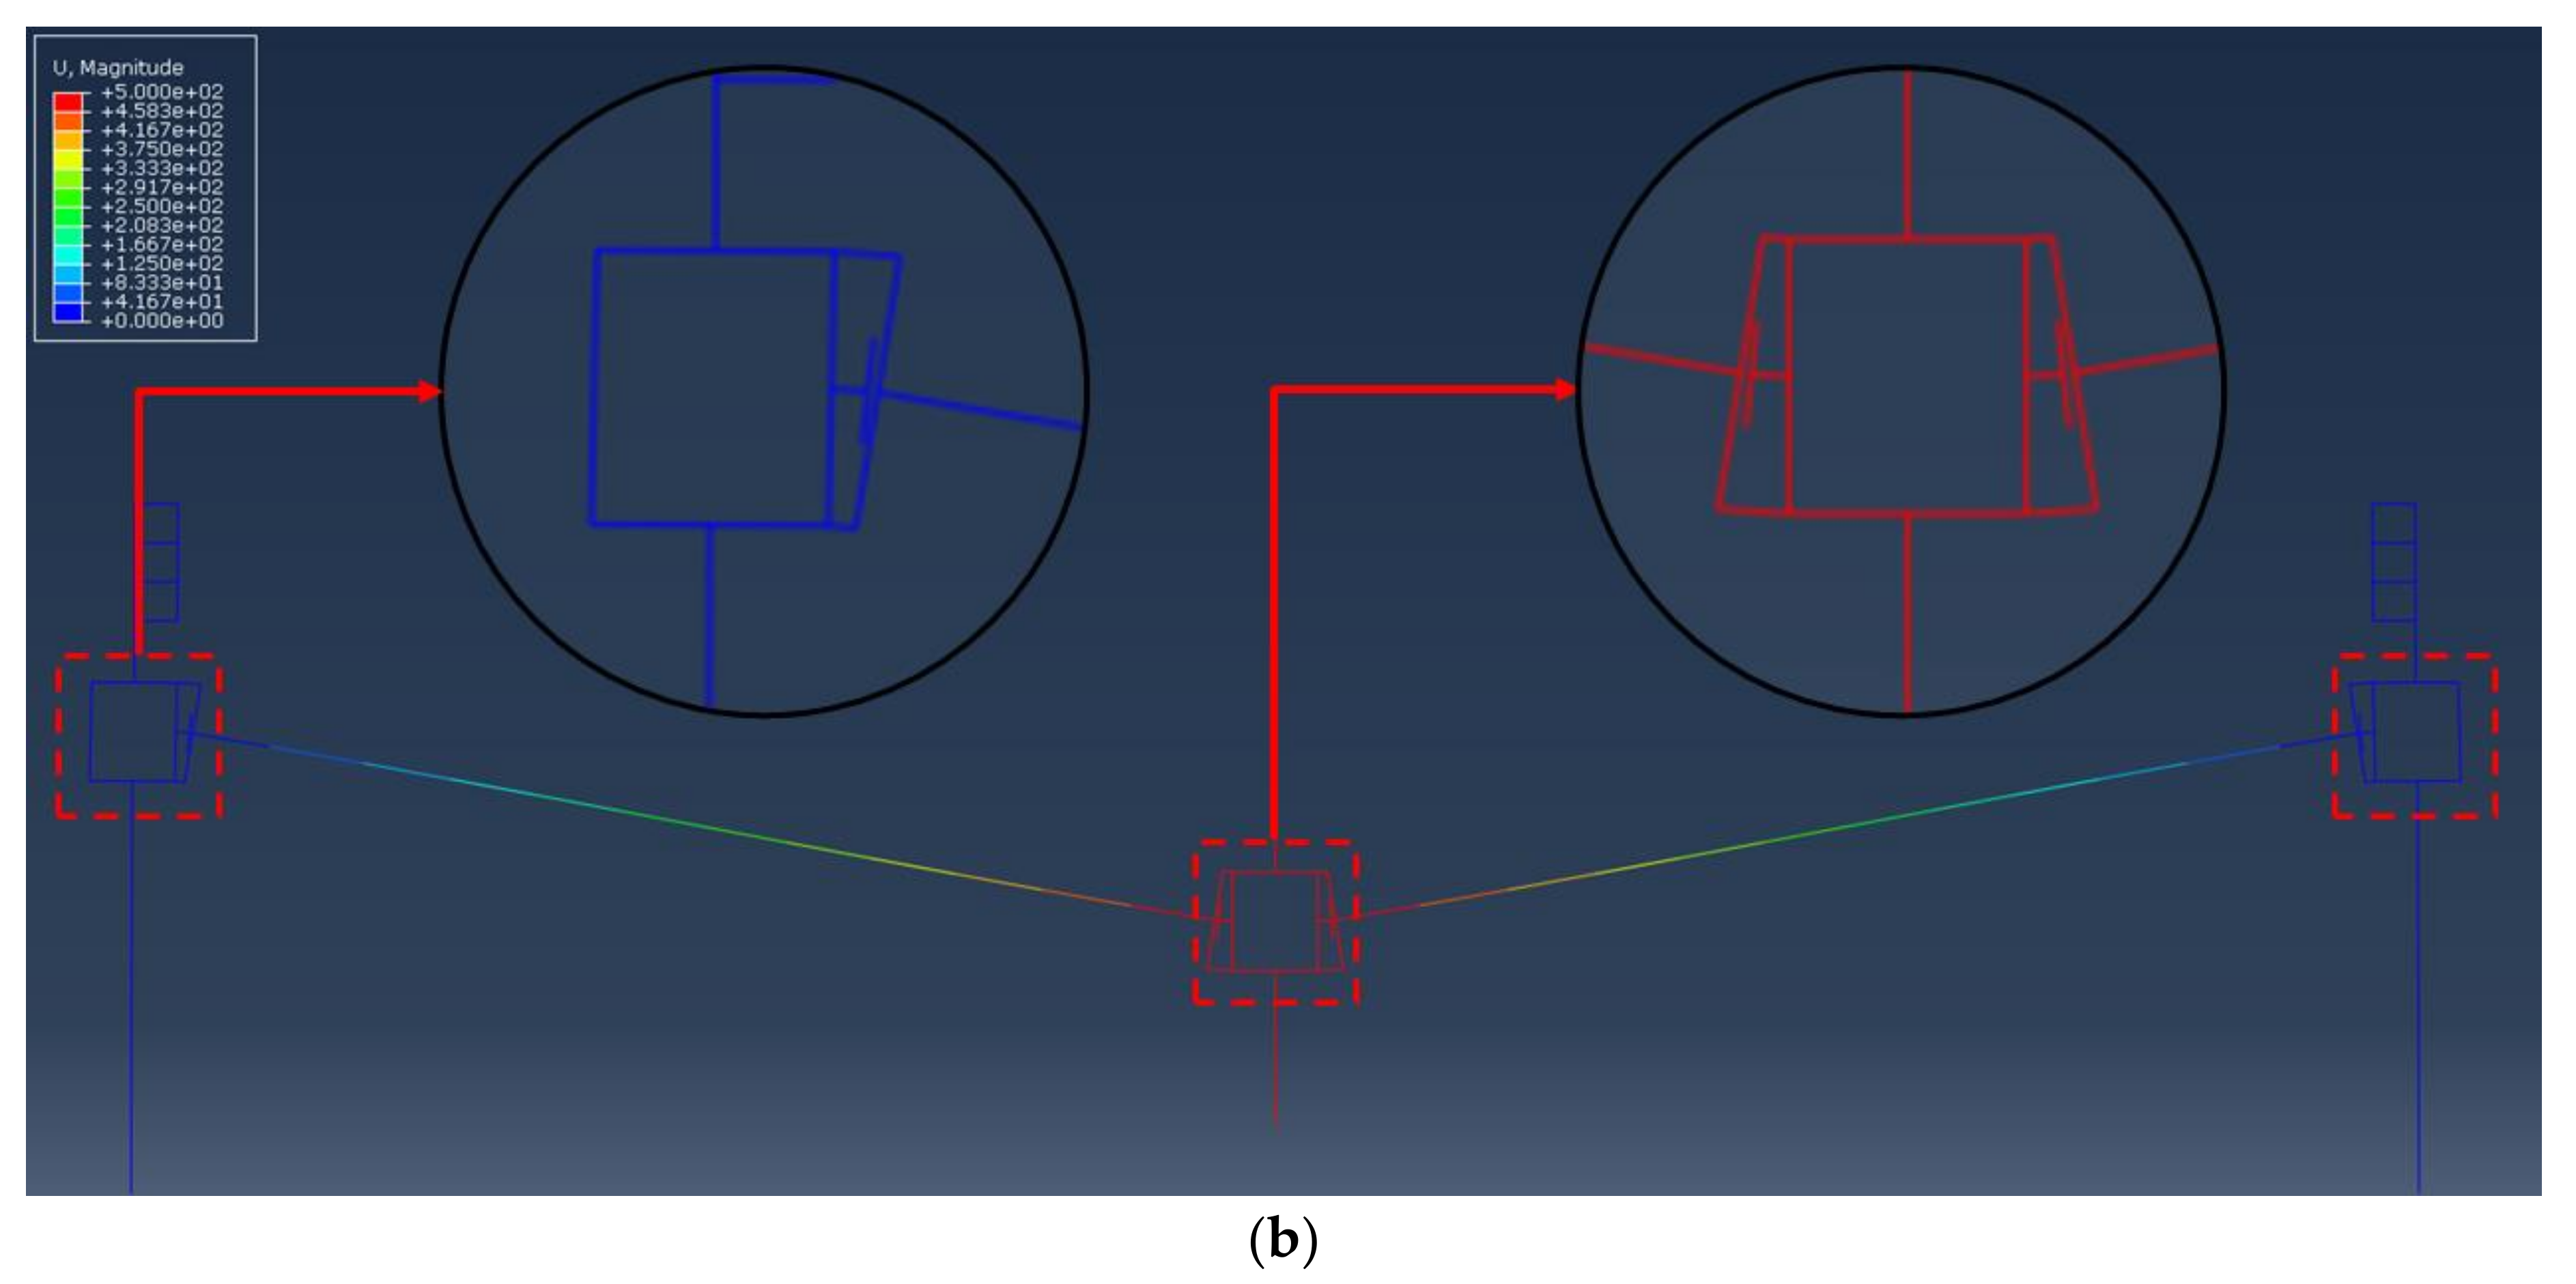
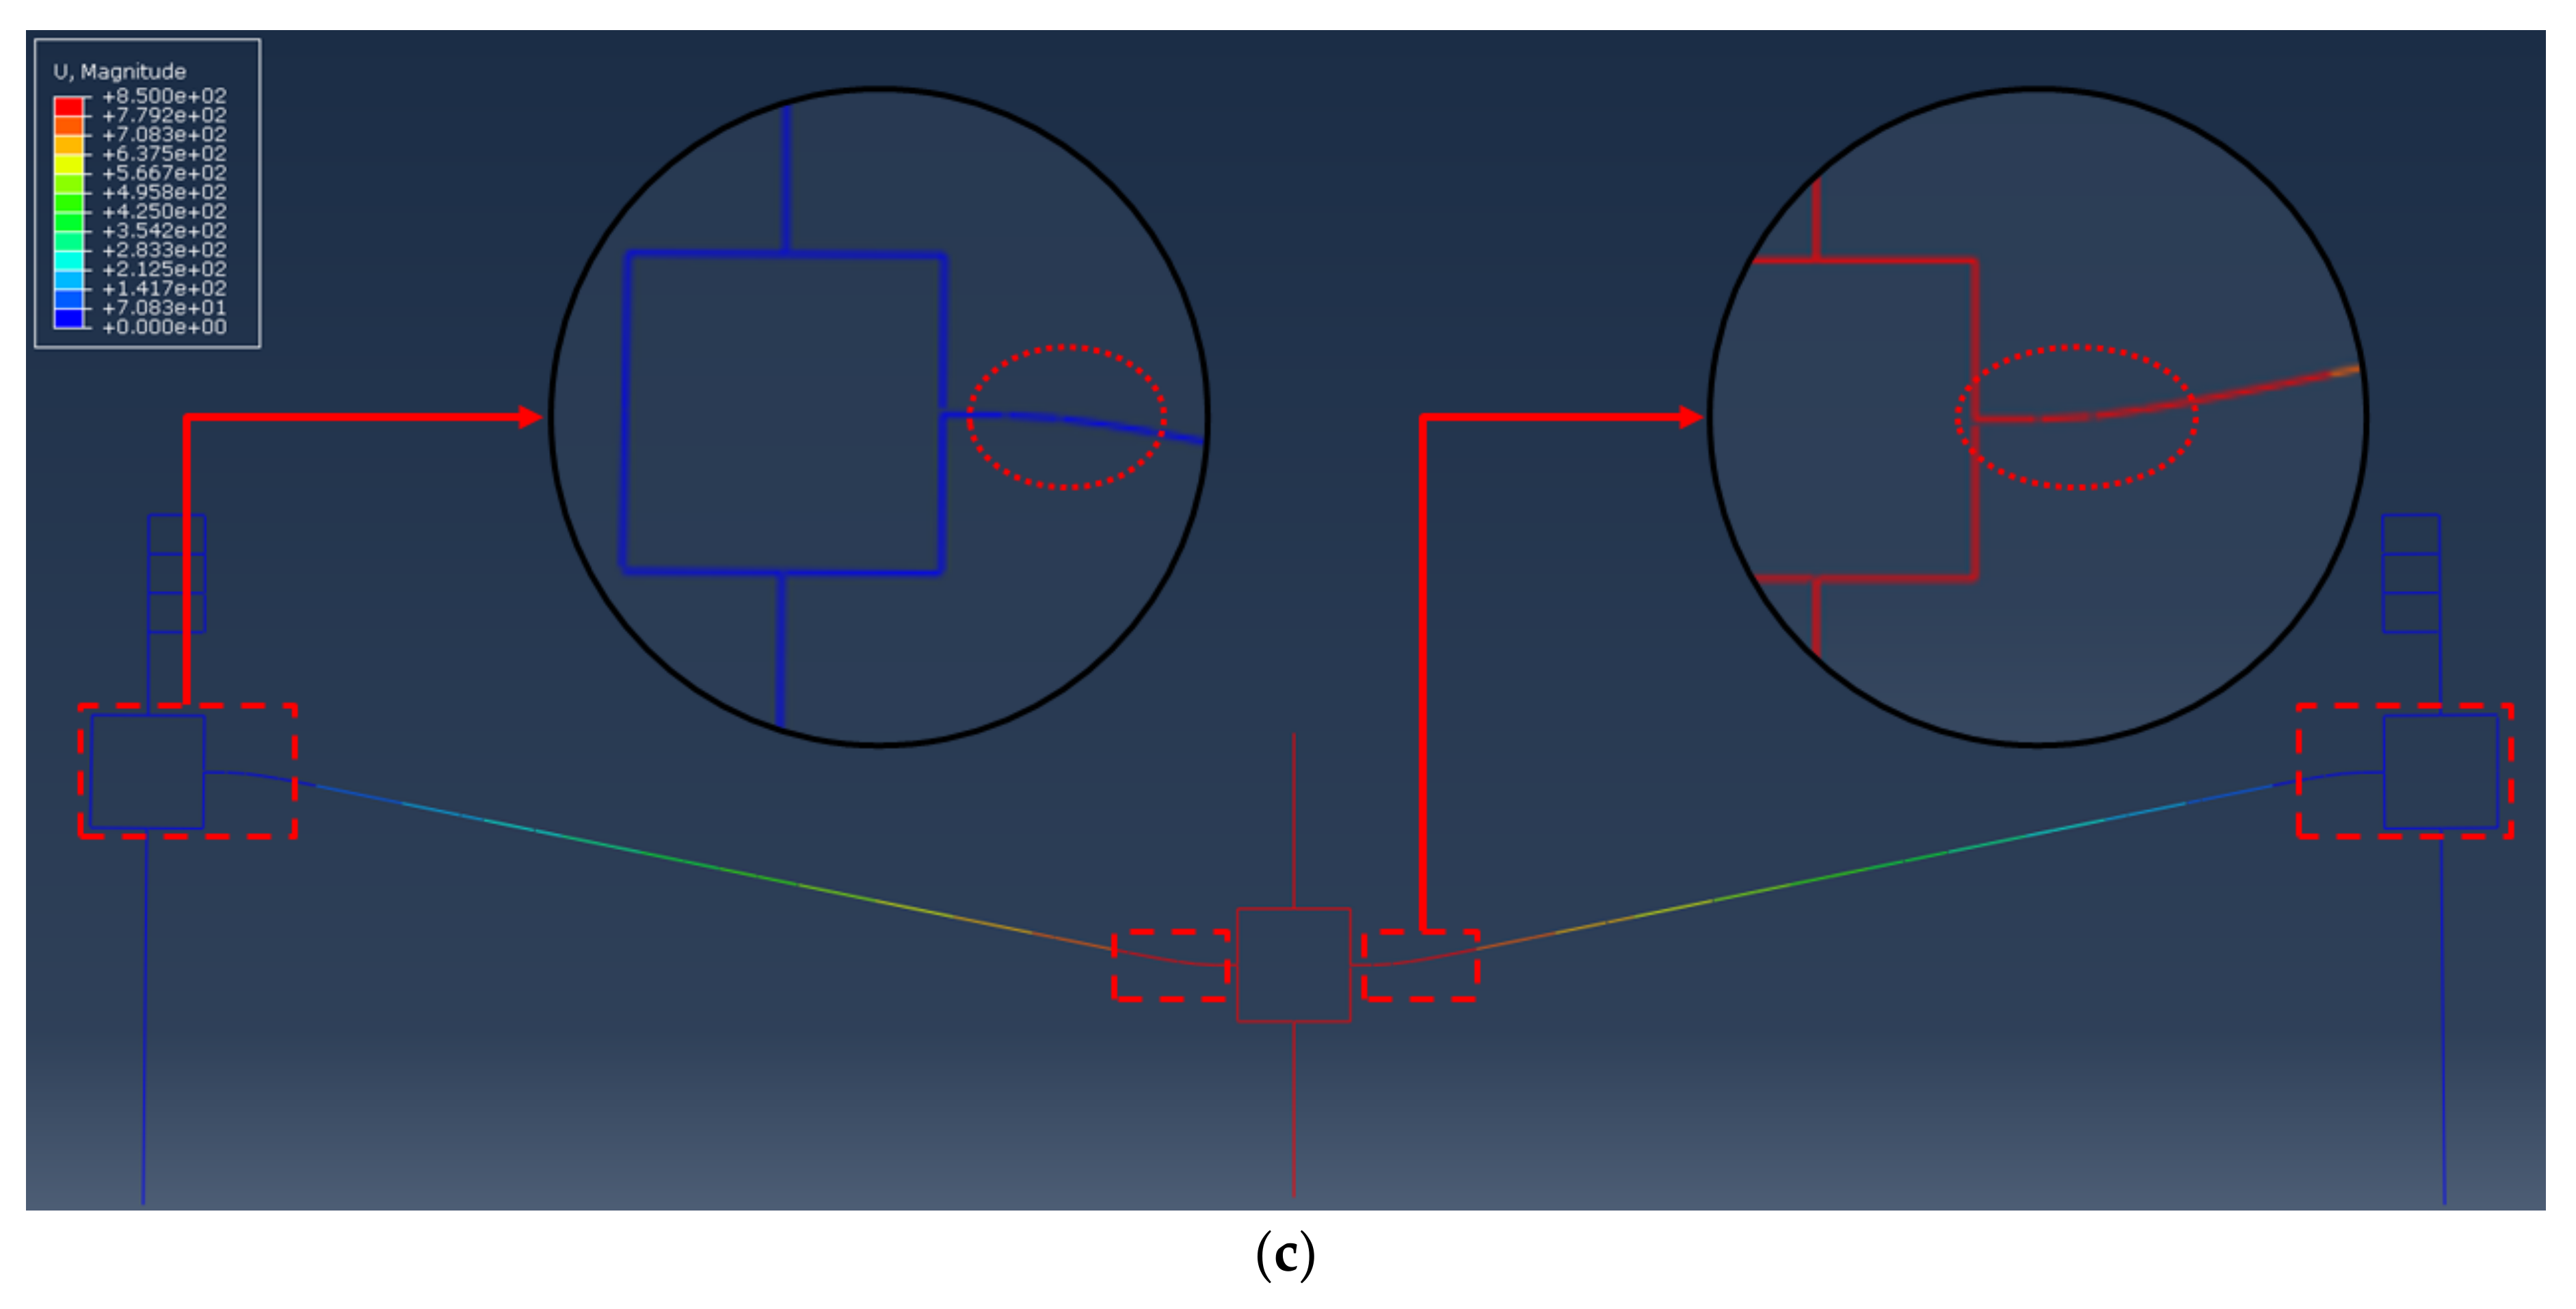
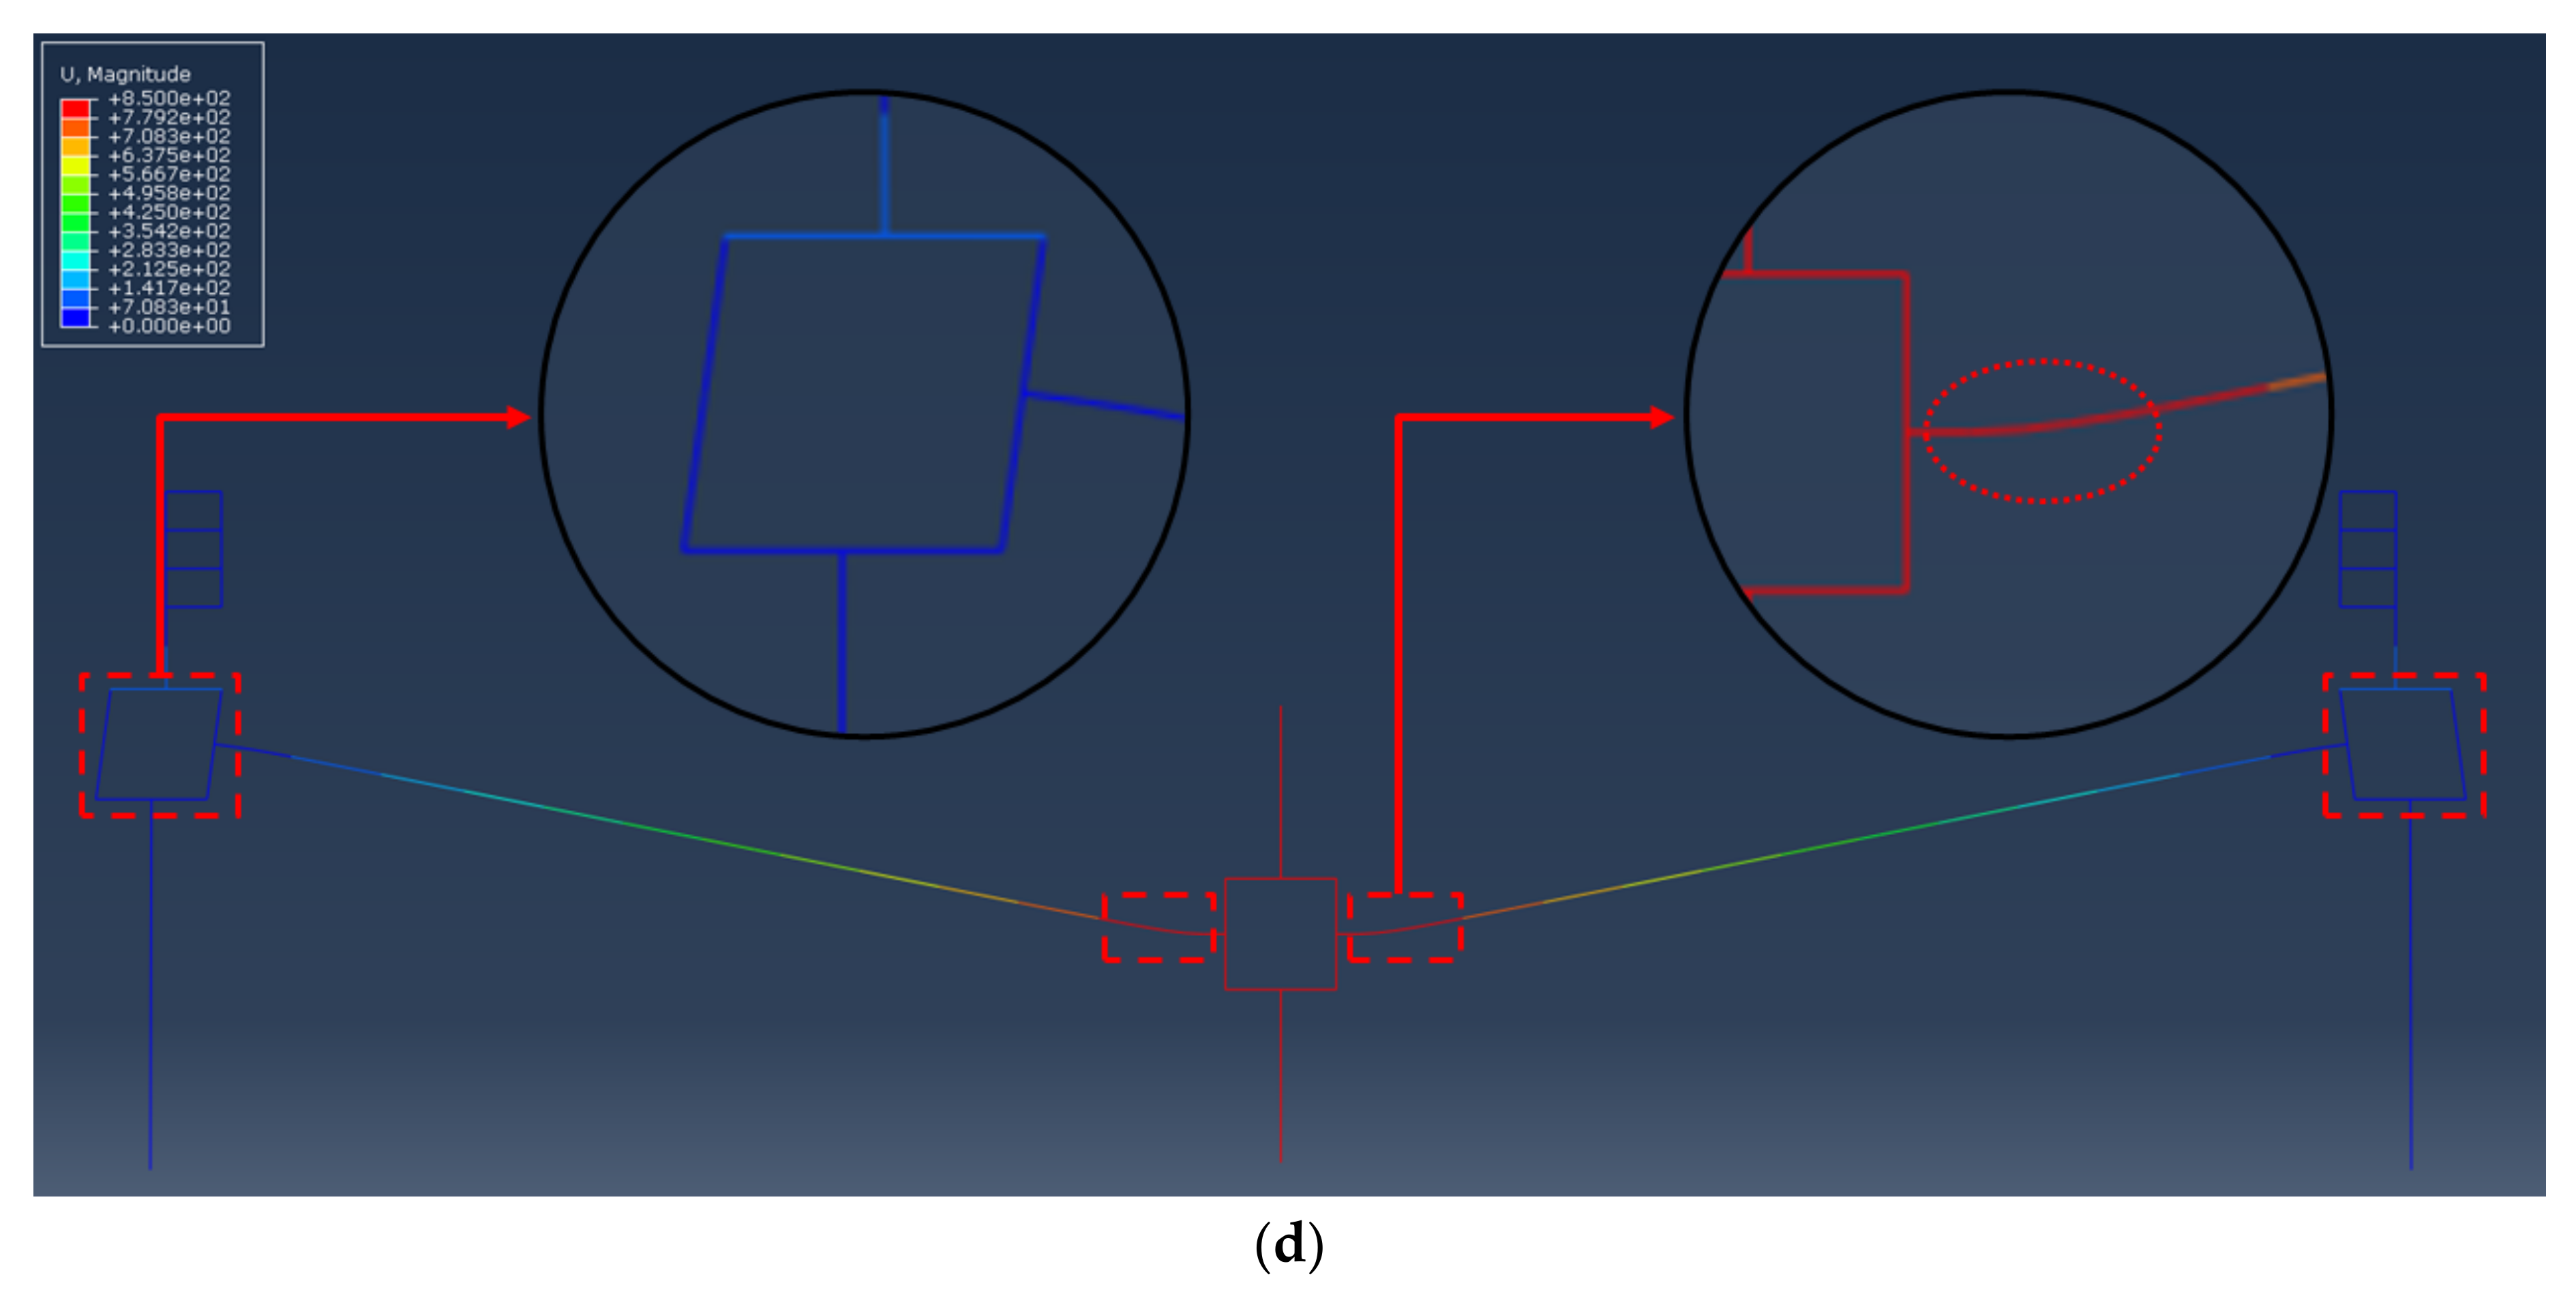
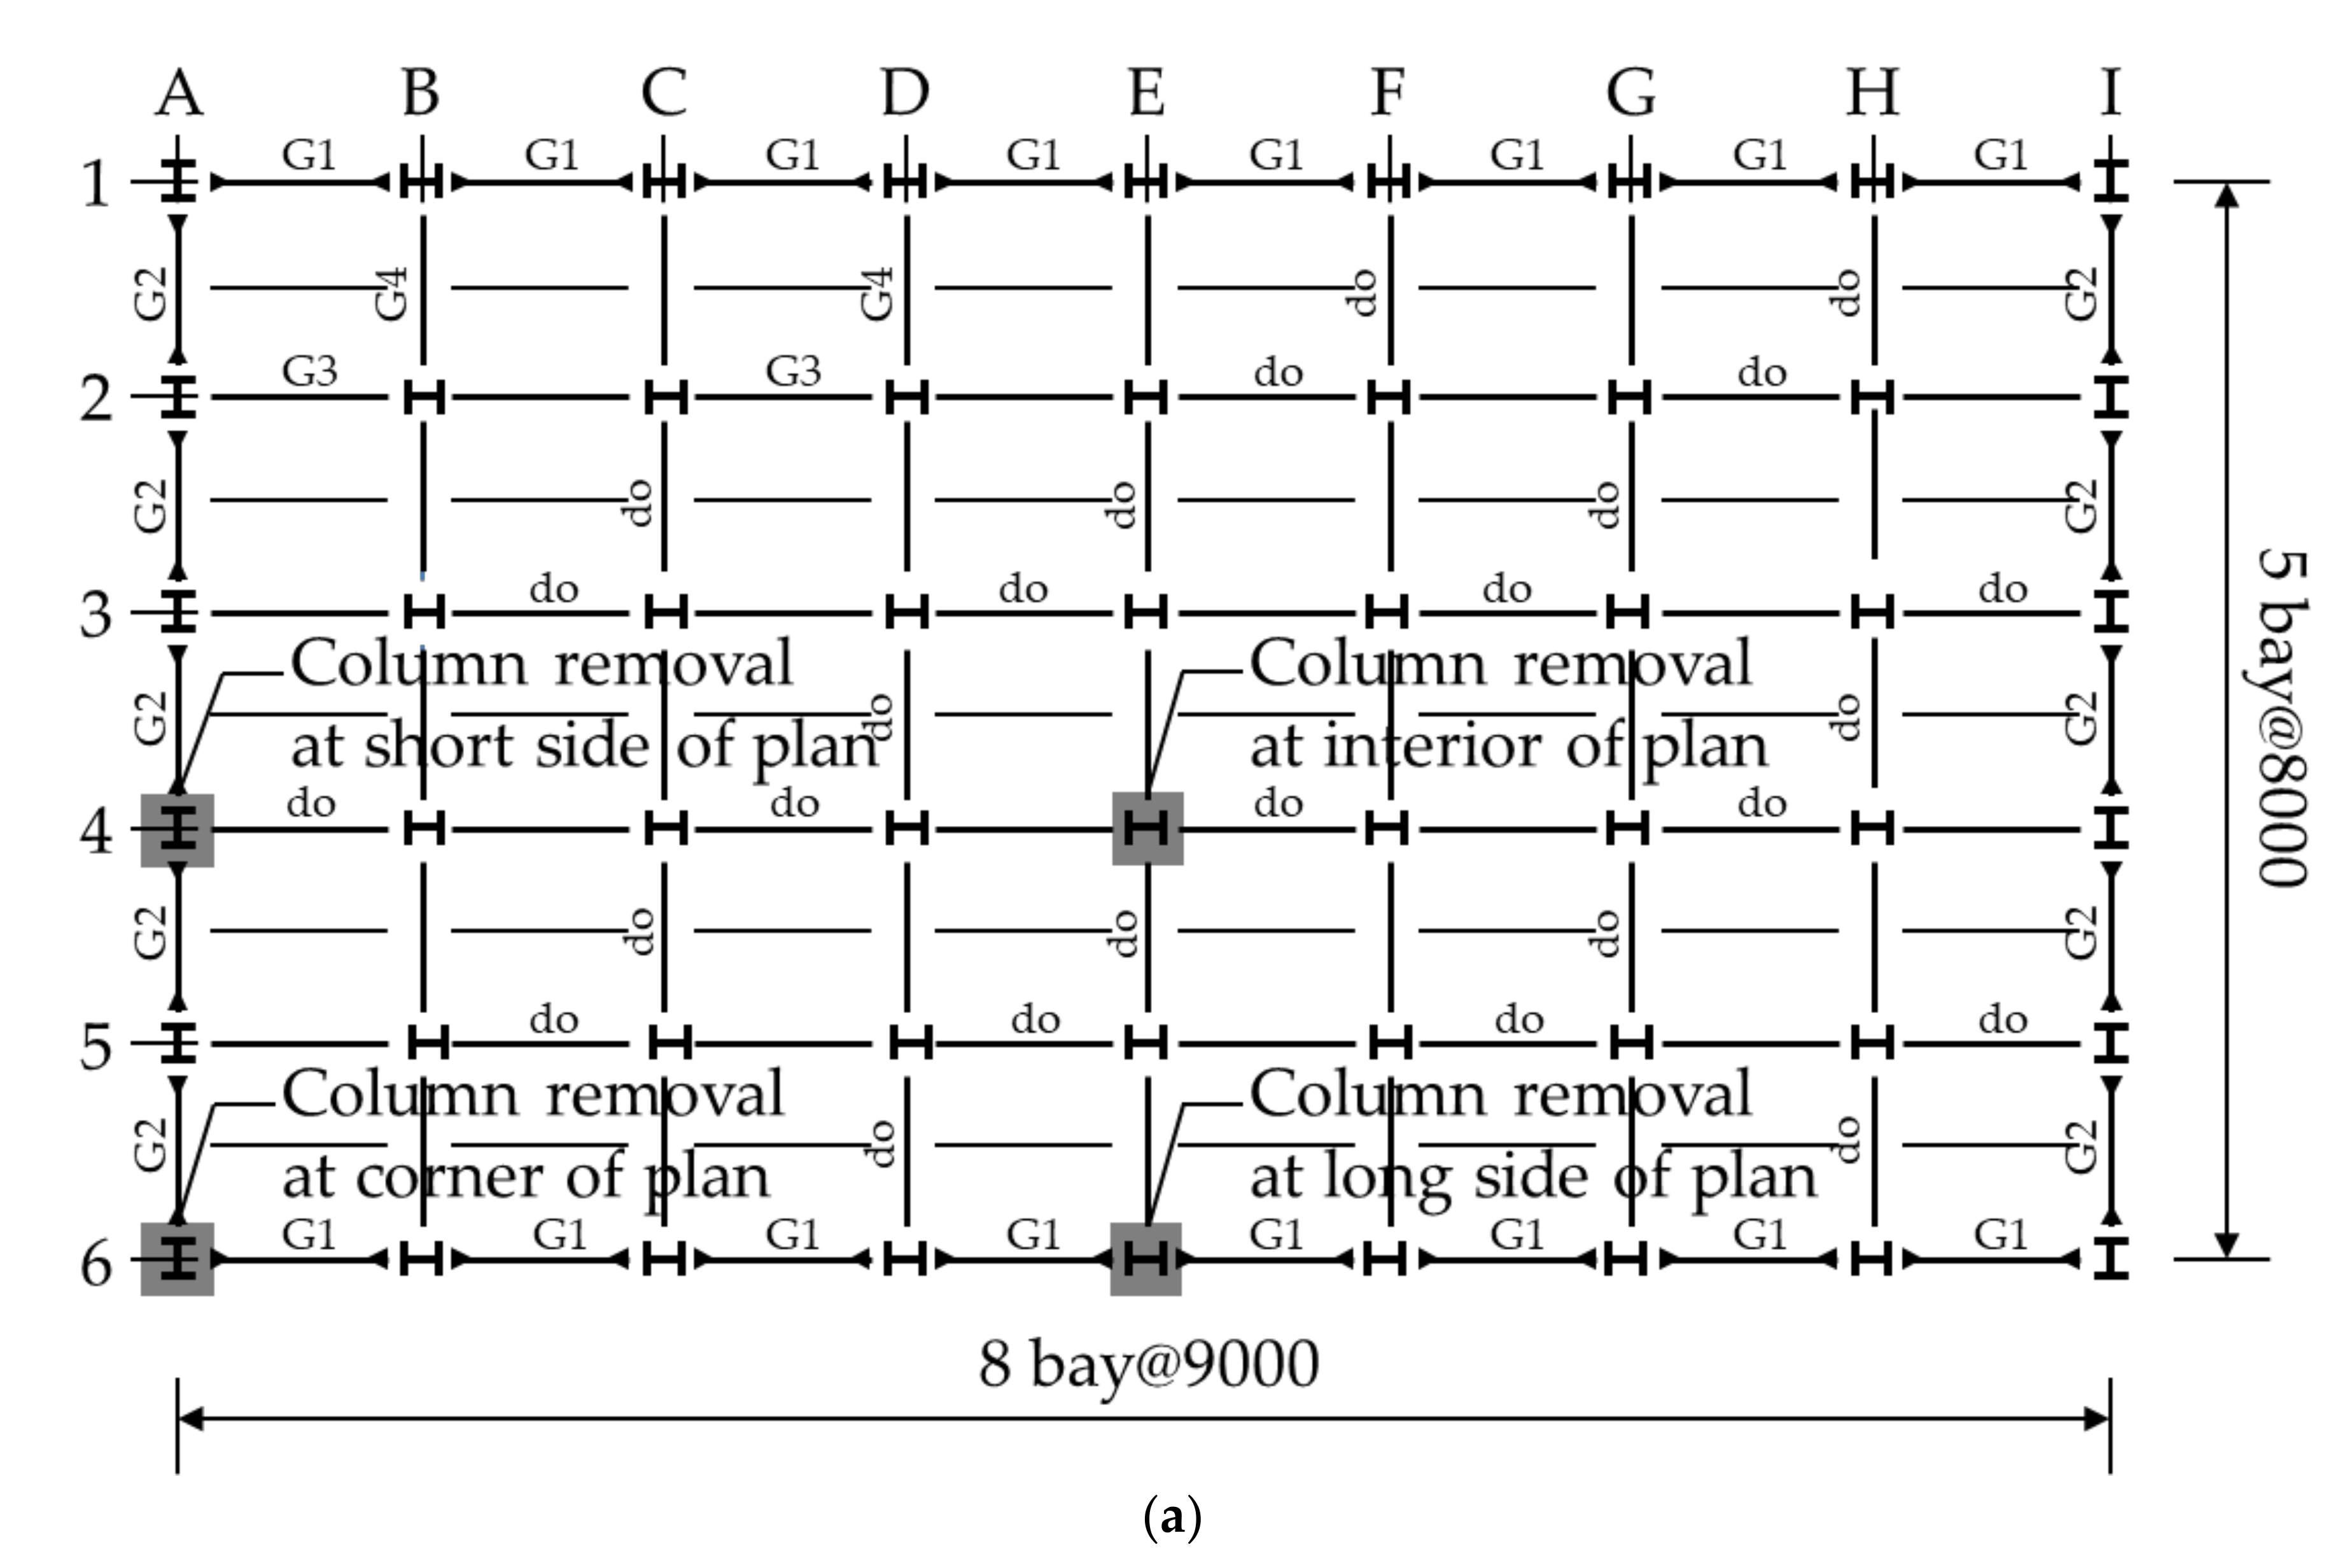
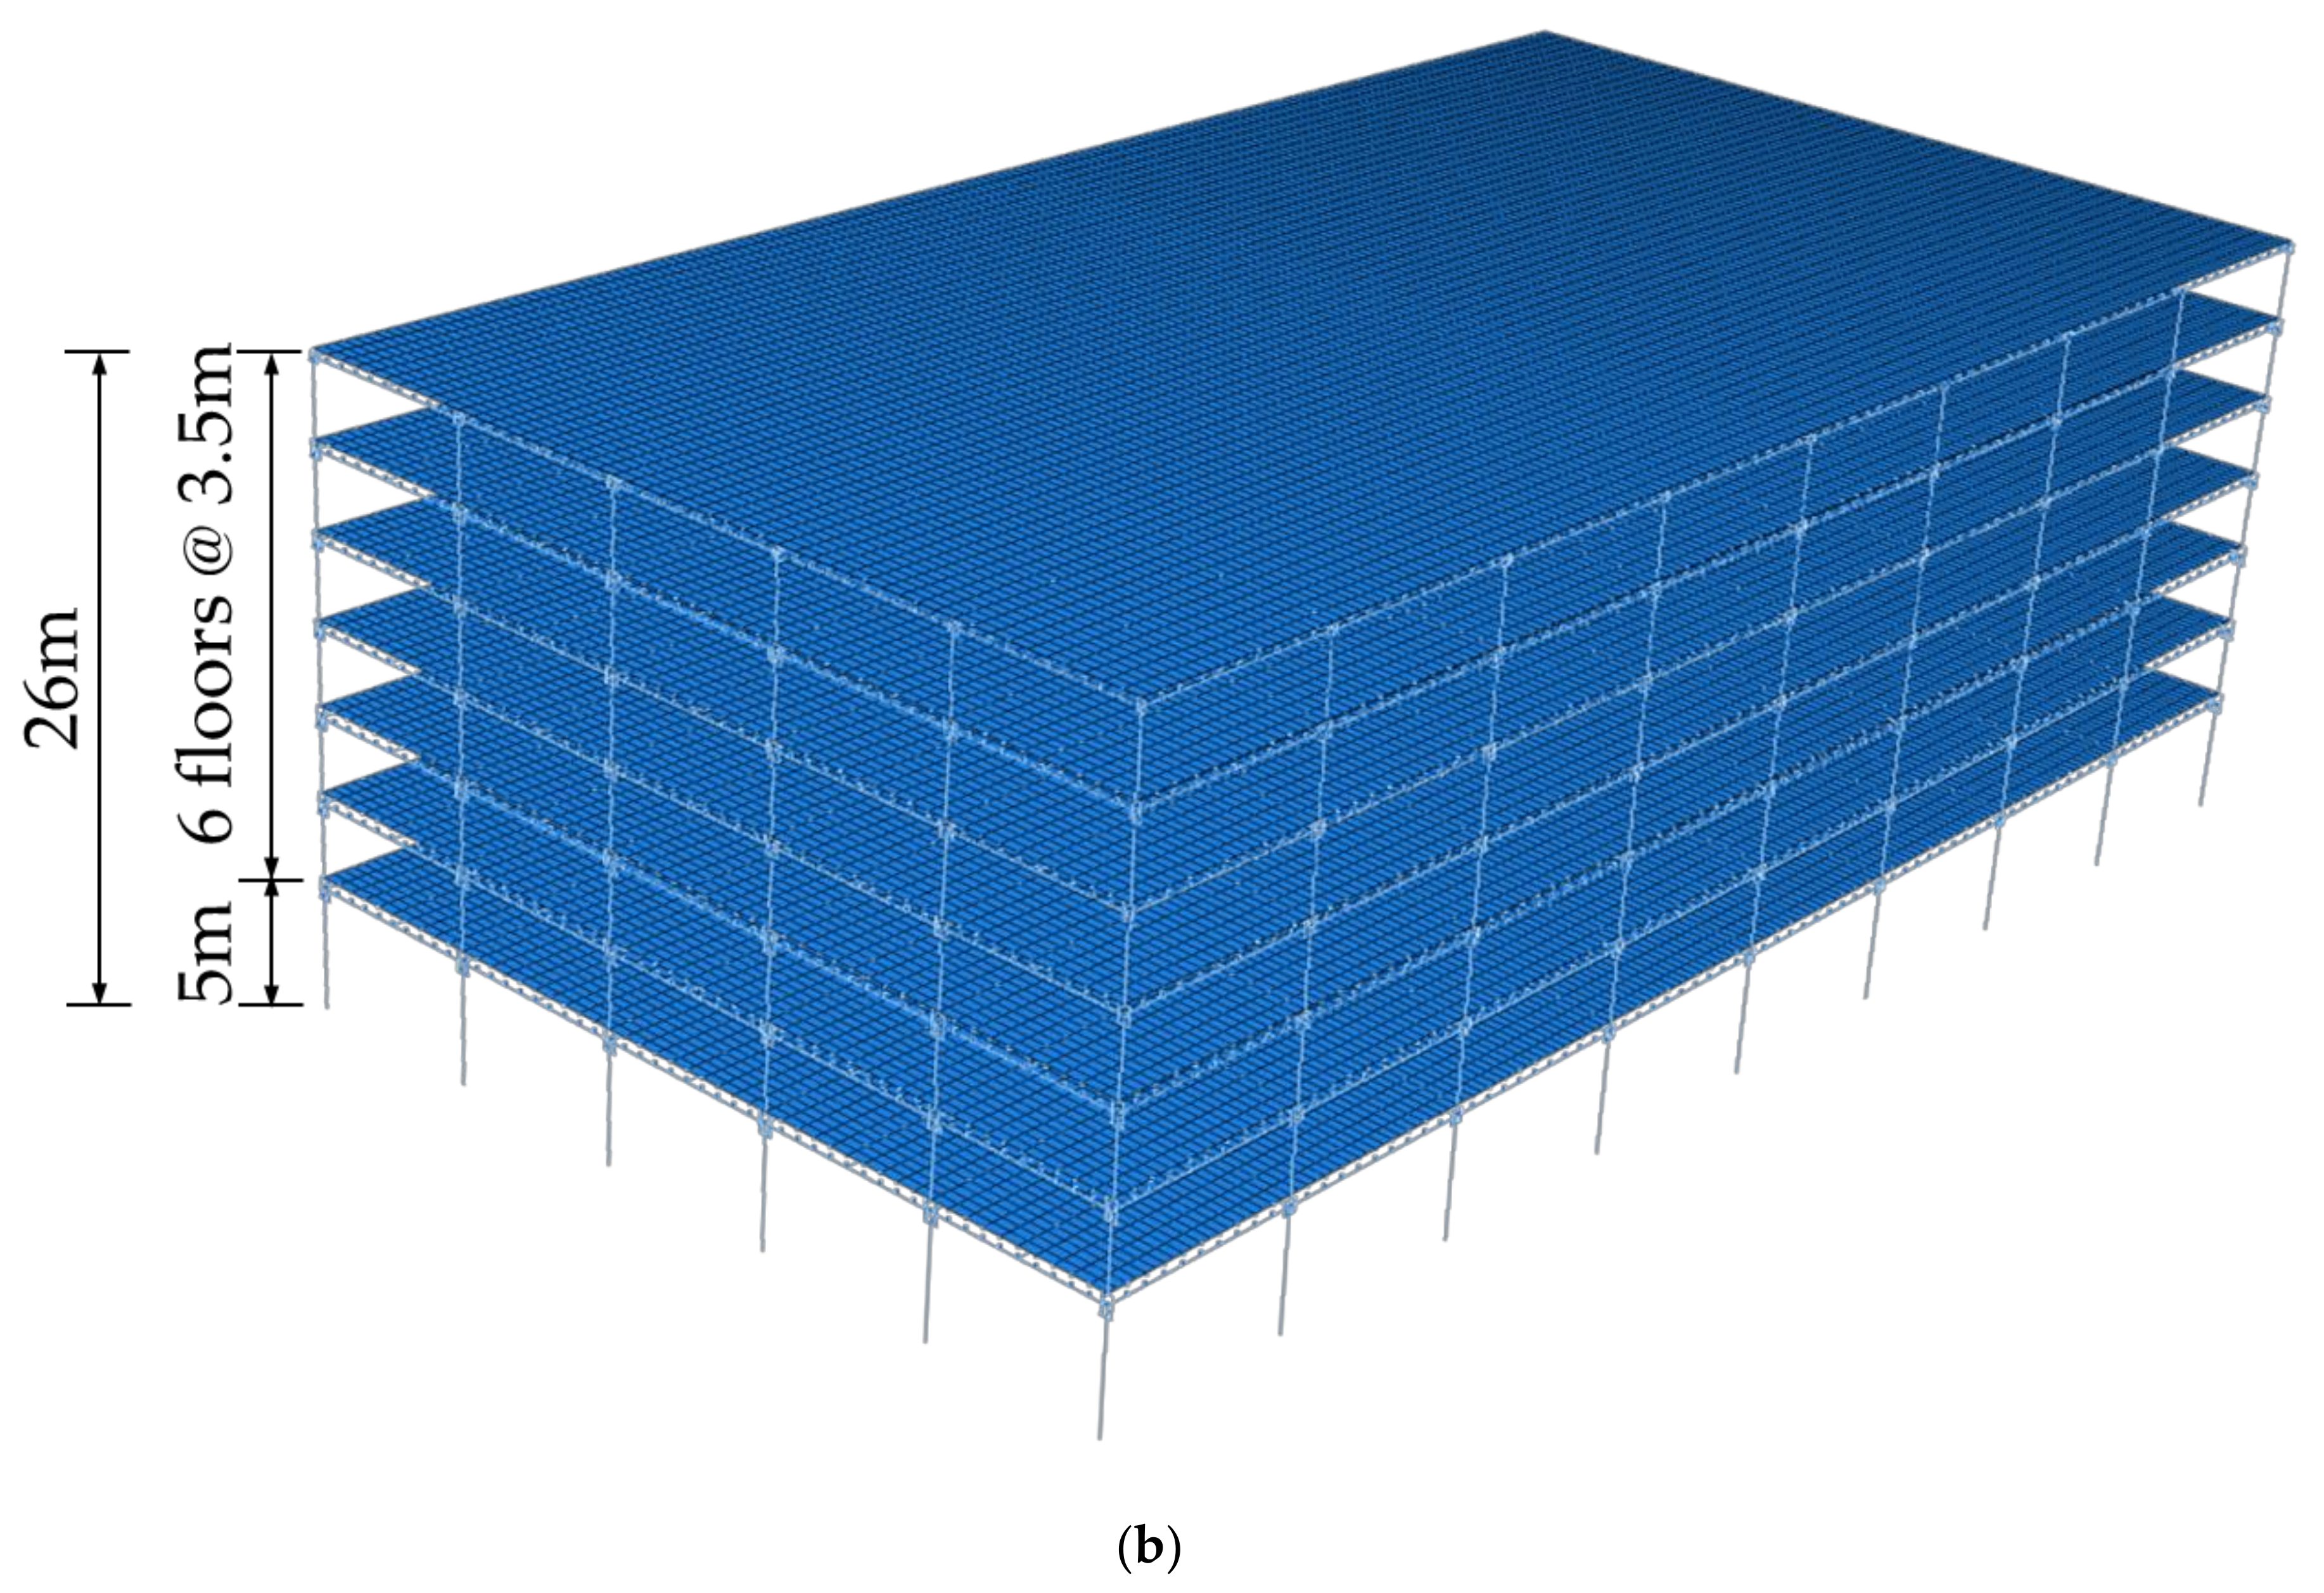
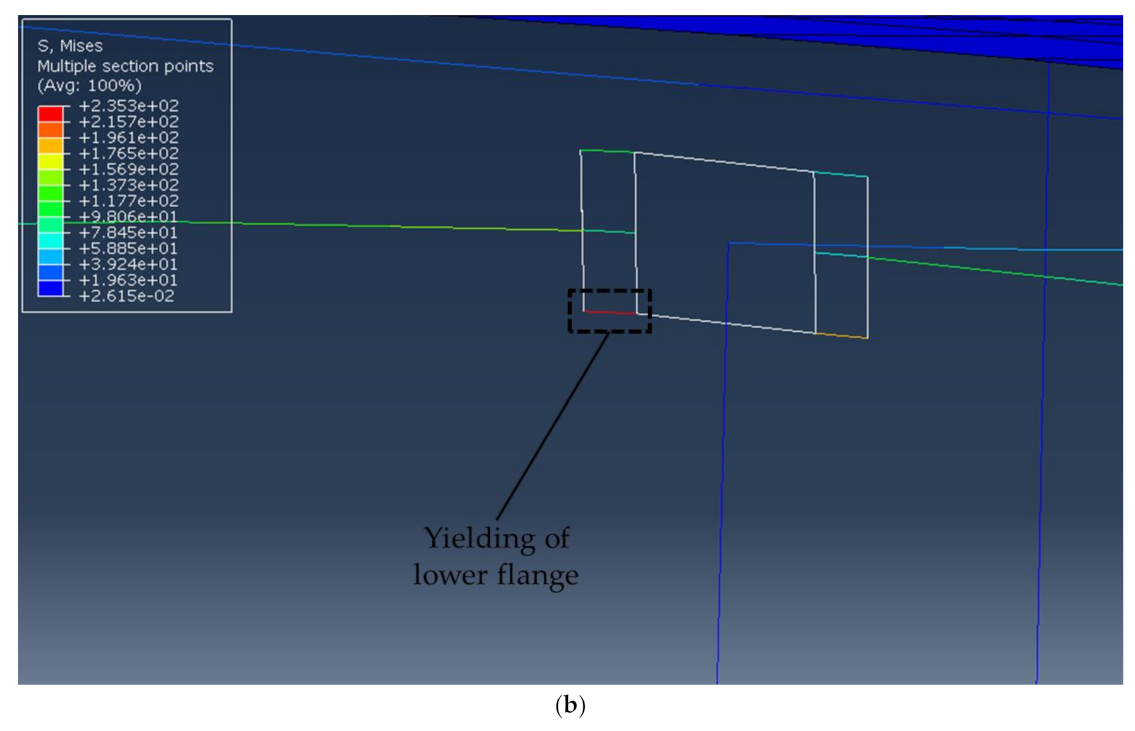
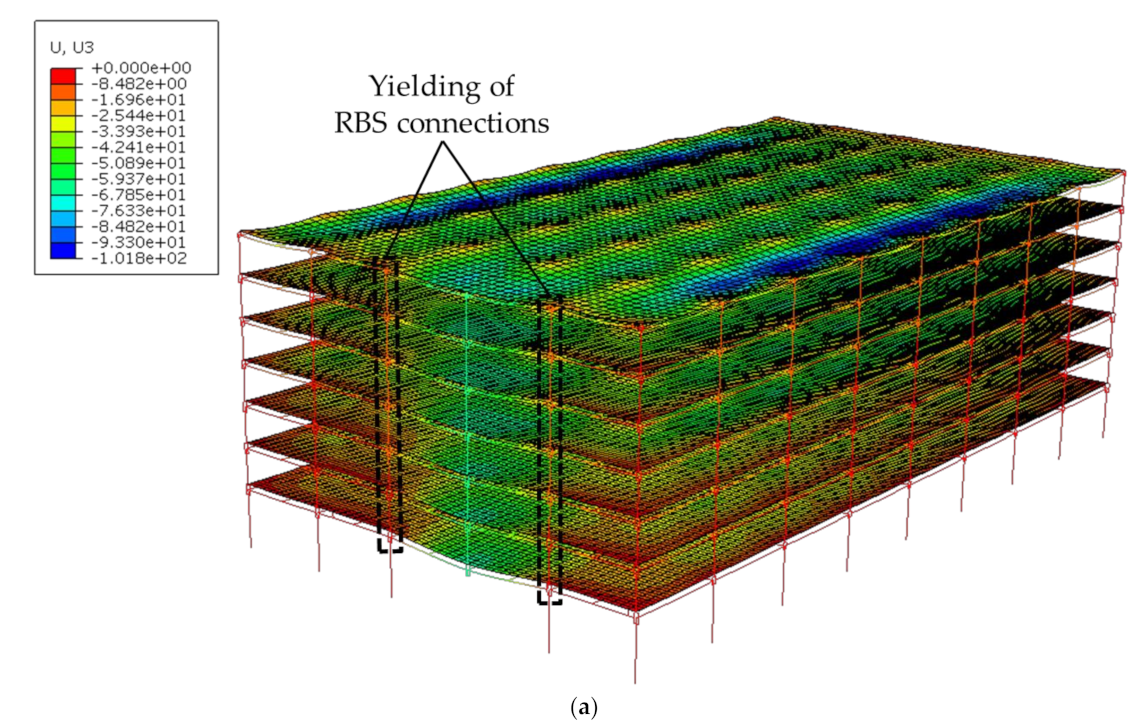
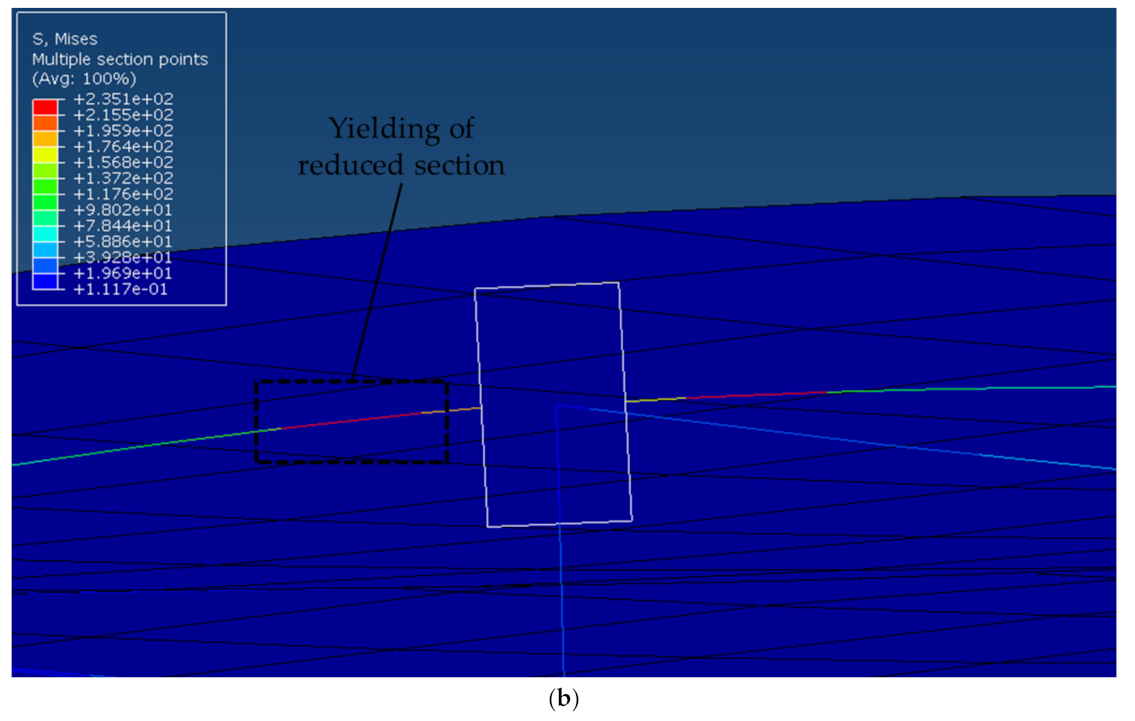
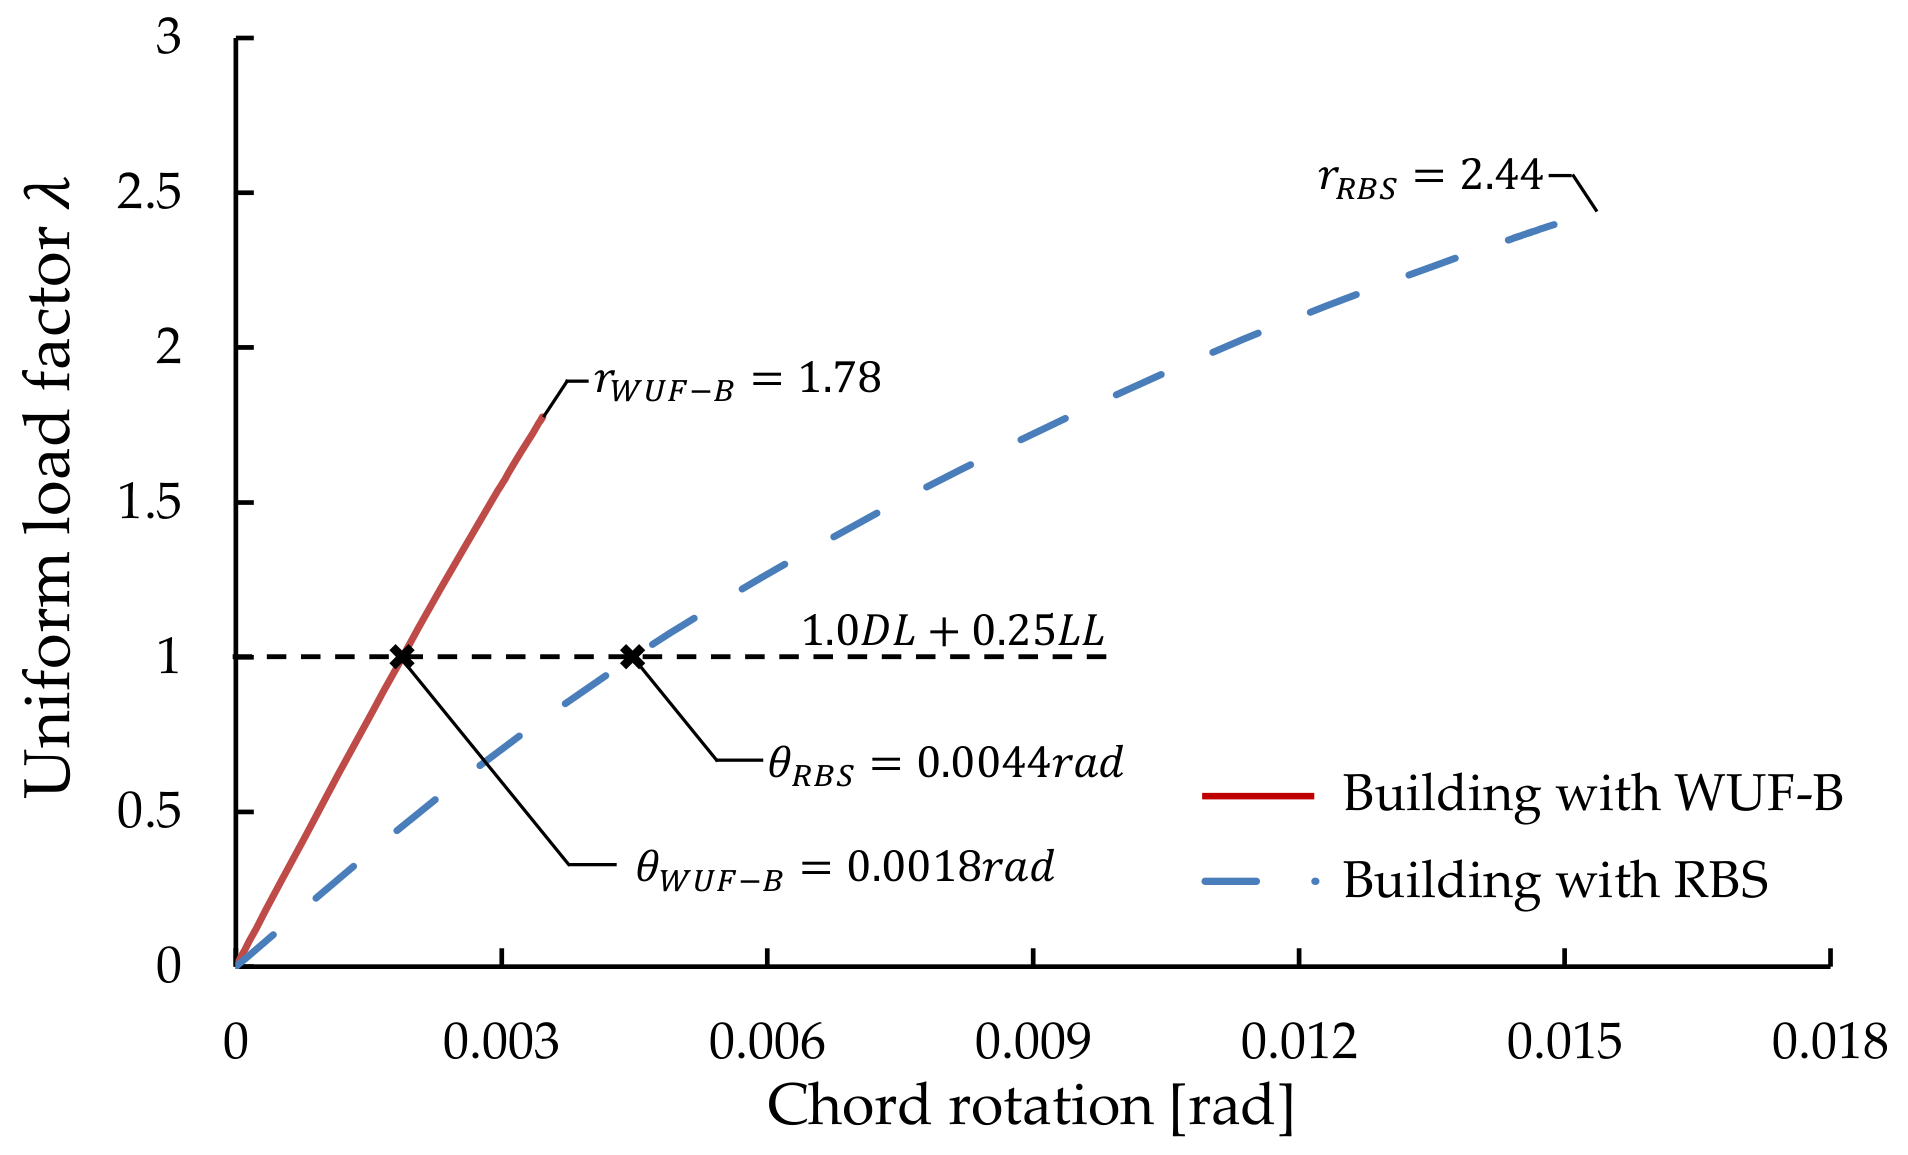
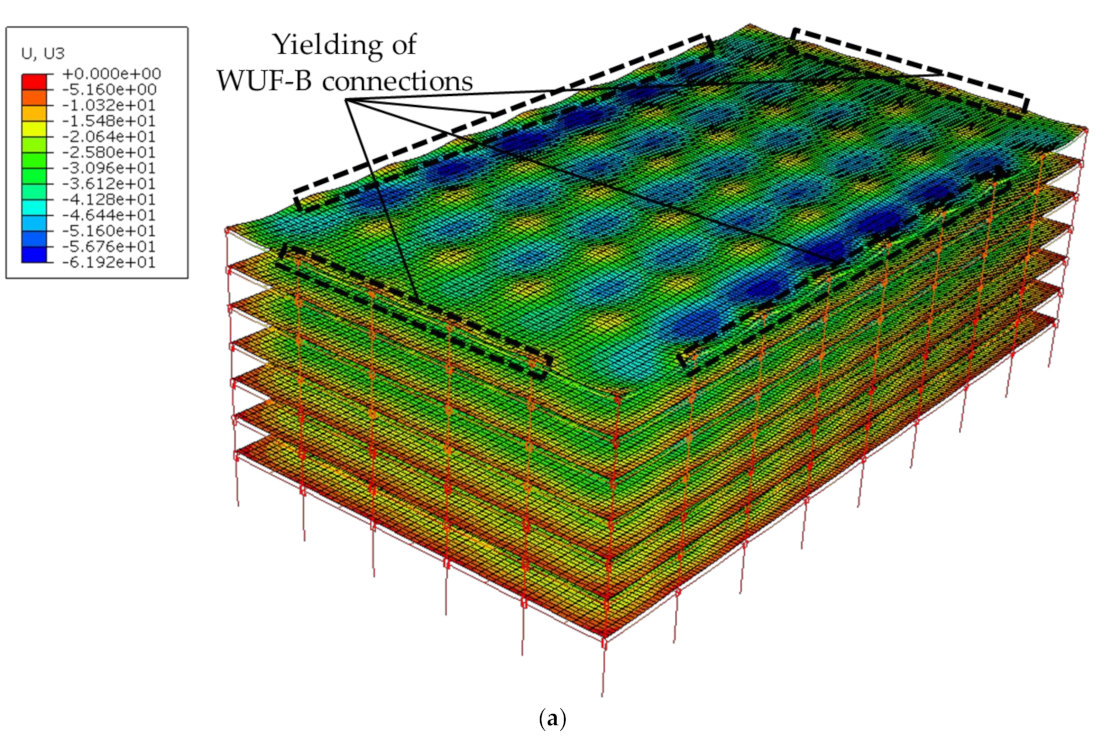
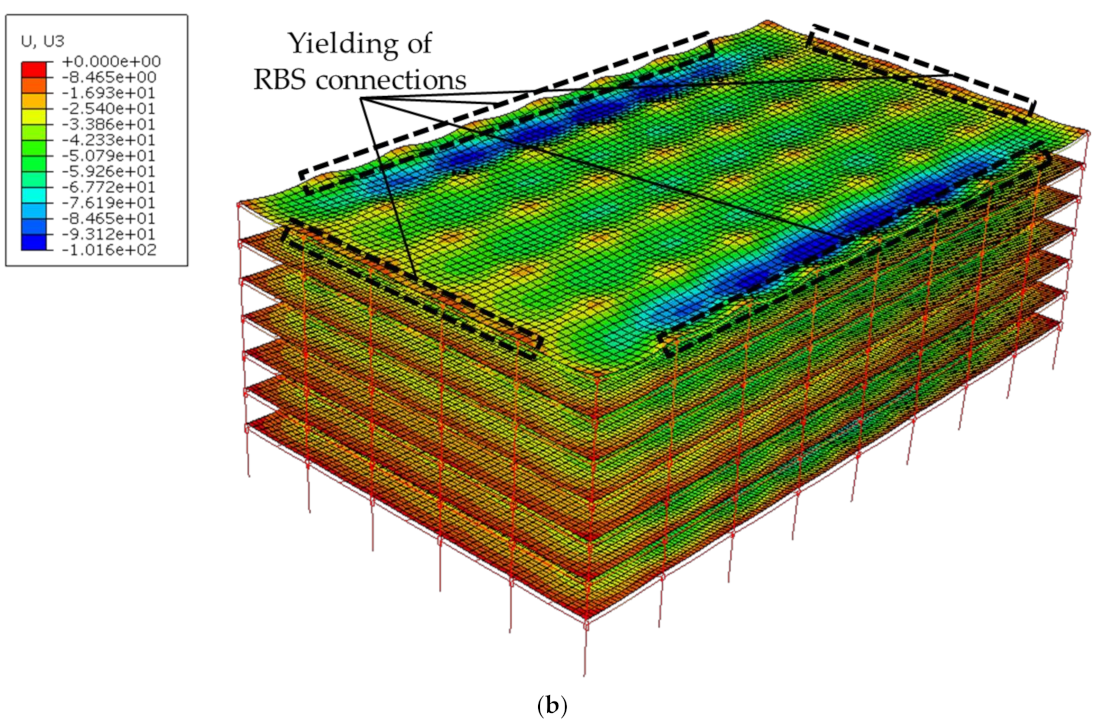
Based on these backgrounds, this study has been conducted to evaluate the resistance performance of a steel structure, constructed using the moment frames individually designed with WUF-B and RBS connections, in order to analyze the sensitivity for progressive collapse of different structural systems. Herein, the evaluation method of the structures was based on the structural sensitivity proposed by Noh et al. [16], which can be quantitatively and clearly evaluated. The steel moment frames were seismically designed as per KBC 2016 [17]. The entire structures were modeled using reduced models of 1-D and 2-D elements for beams, columns, connections, and composite slabs. After performing nonlinear static analyses on these structures, progressive collapse resistance performance was evaluated using structural robustness and sensitivity calculated from the energy-based approximate analysis with the dynamic effect of sudden column loss.

2. Evaluation Methods for Progressive Collapse Resistance Performance

2.1. Acceptance Criteria for Progressive Collapse Resistance Performance

The guidelines of GSA 2003 and DoD 2009 [2,3] provide acceptance criteria to evaluate the failure of key structural components in progressive collapse analysis. In linear analyses, the acceptance criteria are based on the demand-capacity ratio for each structural member or connection in the design. In contrast, the possibility of collapse in nonlinear analyses is evaluated by means of the chord rotation angle θ specified in the guidelines. Table 1 lists the acceptance criteria for the chord rotation angle of the steel moment frames specified in GSA 2003 [2]. In the present study, the AP method was applied to the steel moment frames individually designed with WUF-B and RBS connections and progressive collapse resistance performance was evaluated for allowable rotation limits θ = 0.025 rad and θ = 0.035 rad.

2.2. Alternative Path Method

The AP method of GSA 2003 [2] applied in this study is divided into static and dynamic analyses; and loading conditions are different, depending on the chosen analysis method. In static analysis, the amplified load combination 2.0 ( 1.0 D L + 0.25 L L ) is applied to the tributary area of the column removal span considering the dynamic effect of sudden column loss, and the load combination 1.0 D L + 0.25 L L without the dynamic effect is applied to all other areas. In dynamic analysis, load combination 1.0 D L + 0.25 L L is applied to the entire floor area, but dynamic effect attributed to the sudden column loss is considered, using the internal reaction forces of the lost column to the supported structure (Figure 1). The column removal locations in the guideline are the exterior columns located at the corners, and center and interior columns on the ground level of buildings. Since the most vulnerable column removal locations that could lead to progressive collapse are different, depending on the plan and structure type of the building, it is noted that the removal scenarios for each of the column locations should be performed to accurately assess collapse resistance performance.

2.3. Energy-Based Approximate Analysis

Dynamic analysis representing the most realistic simulations and responses of structural behavior is complex and time-consuming. Considering these disadvantages, Izzuddin et al. [12] proposed an energy-based approximate analysis that can efficiently calculate the load-displacement response with the dynamic effect of sudden column loss using nonlinear static analysis. This analysis is based on the assumption that the predominant deformation responds in a single mode by the gravity load applied to the structure, and this system can be considered as a single-degree-of-freedom. At dynamic displacement δ after sudden column loss, the external work W D y n ( δ ) performed by the dynamic loads P D y n can be expressed as Equation (1):
  W D y n ( δ ) = α P D y n δ = α { 1 2 m [ δ ( t ) ] 2 + 1 2 k [ δ ( t ) ] 2 }  
where α is a constant that depends on the shape of the deformation mode, and m and k are the mass and stiffness of the structure, respectively. Since the kinetic energy in the state of reaching the peak dynamic displacement δ p is zero, the external work W D y n ( δ p ) is equal to the internal energy U ( δ p ) absorbed by the structure, as seen in Equation (2):
  W D y n ( δ p ) = α P D y n δ p = 1 2 α k δ p 2 = U ( δ p )  
Assuming the same deformation mode response under the static loads, the external work W S t ( δ p ) at displacement δ p can be expressed as Equation (3) and the load-displacement curve P S t ( δ ) in Figure 2 can be obtained from the nonlinear static analysis:
  W S t ( δ p ) = α 0 δ p P S t ( δ )   d δ = α 0 δ p k δ   d δ = 1 2 α k δ p 2 = U ( δ p )  
Equating the work performed under static and dynamic loading at peak dynamic displacement δ p allows the constant α to be eliminated, yielding the following equation:
  P D y n δ p = 0 δ p P S t ( δ )   d δ  
The left-hand side of Equation (4) represents the hatched area in Figure 2 and the right-hand side represents the shaded area. The dynamic load P D y n is expressed as the following equation by dividing the peak dynamic displacement δ p on both sides. Consequently, the function P = P D y n ( δ ) can be obtained by using Equation (5) with varying δ p :
  P D y n = 1 δ p 0 δ p P S t ( δ )   d δ  
The function P = P S t ( δ ) in Figure 2 continues to increase beyond displacement δ u corresponding to the ultimate resistance due to the residual bearing capacity of the structural system. However, the uncertainties of analysis in the post-ultimate response significantly increase due to accelerations and increasing dynamic effects produced under force-controlled loading. Considering these reasons and conservatism, the ultimate capacity P D y n , u under sudden column loss, as shown in Equation (6), is obtained at displacement δ u corresponding to the ultimate static load:
  P D y n , u = P D y n ( δ u )  
The progressive collapse resistance performance of the structures in this study was evaluated by the previously described energy-based approximate analysis.

2.4. Structural Robustness of Progressive Collapse

The structural robustness of progressive collapse is a measure of the extent to which a structure can resist collapse due to abnormal loads. To use the structural robustness as a structural performance measure, it is necessary to satisfy usefulness and validity. Starossek & Haberland [15] presented the general requirements for structural robustness as follows:
  • Generality for applicability to any type of structure
  • Expressiveness of all aspects of robustness with clear distinction between robust and non-robust
  • Objectivity by independence from user decision and reproducibility
  • Simplicity to gain objectivity, generality, as well as acceptance with users
  • Ability to calculate the properties and behaviors of the structure with sufficient accuracy and without excessive effort
From this viewpoint, structural robustness should be uniquely defined so that it can be quantitatively measured and clearly evaluated with general validity. Bao et al. [14] proposed an index r to assess the robustness of a structure. This can be expressed as the ratio of the maximum resistance capacity C to the required capacity D under sudden column loss, as shown in Equation (7), where D can be defined according to an applicable code or standard. The acceptance criteria for robustness to prevent disproportionate collapse require that r 1 , which indicates that as index r increases, the structure becomes more robust:
  r = C D  
The structural sensitivity defined by Noh et al. [16], as shown in Equation (8), is a relative evaluation index for the reduction of the load-bearing capacity depending on column removal location, or an index for assessing the extent of safety of progressive collapse depending on column removal scenarios in different structural systems, in terms of structural materials, connection details, etc. The structural sensitivity index S can be evaluated as the ratio of the residual capacity ( r D D ) under gravity loading of the structure with a missing column to the value of ( r o D D ) of the undamaged structure, which can be expressed using the structural robustness index r . A value of 0 S 1 is obtained if the structure has the required capacity after sudden column removal, and the sensitivity index S of the structure that does not satisfy the acceptance criteria for robustness has a negative value.
  S = ( r D D ) ( r o D D ) = r 1 r o 1  

3. Analysis Modeling Approach

3.1. Reduced Modeling

Modeling of the entire structure is required to confirm resistance performance against progressive collapse for the seismically designed steel moment frame. There are detailed and reduced models for the modeling approach of composite slabs and seismic connections of beam-columns, which are components that determine the behavior of the structure [18]. The detailed model using the 3-D solid element can easily visually confirm the geometry, deformation, and stress distribution of the structure, but time and data consumption for analysis is highly demanded due to the large number of elements. In contrast, the reduced model using 1-D and 2-D elements, such as springs, beams, and shells, is easier to model and requires less analysis time than the detailed one. However, for reliable simplification of the 1-D and 2-D modeling, the geometric and structural behaviors of real 3-D members and connection details should be considered using additional material parameters. For instance, there are varying depths of concrete and steel deck in composite slab, panel zone behavior in beam-column connection, and width of the radius-cut section in RBS connection. This section introduces the modeling approach for the composite slab, WUF-B, and RBS connections. Additionally, comparisons between the analysis results of the reduced models and the experimental results were conducted to verify the applicability of the models. Numerical analyses considering both geometrical and material nonlinearities were performed using the finite element software ABAQUS, while the loading condition involved the application of a concentrated static load to the prescribed location under displacement control until failure occurred.

3.2. Reduced Modeling for Composite Slab

This study considered the modeling and analysis of the seismically designed moment frames including the composite slab. The modeling approach of the composite slabs proposed by Main [9] was adopted and the concrete slab on the steel deck was represented in the reduced model using alternating strips of shell elements referred to as “strong” and “weak” strips, as illustrated in Figure 3. The weak strips include only the concrete above the top of the steel deck, while the strong strips include the full depth of concrete and the steel deck. The thickness of the steel deck used in the strong strips is calculated by considering the average width of the bottom segment of each rib. This thickness t d can be expressed as:
  t d = t · ω B ω M  
where t is the actual deck thickness, ω M is the average rib width, and ω B is the bottom segment width of each rib. Conversely, no contribution from the steel deck is included in the weak strips.
The connection of the composite slabs and the floor beams is modeled using the rigid links and the beam elements: the former represents a half of the depth of beams (or girders), while the latter represents a shear stud.

3.3. Verification of Reduced Modeling for Composite Slab

To validate the reduced model of the composite slab, the test specimen (see Figure 4) conducted by Kim et al. [19] was modeled based on finite element model (FEM) and the experimental data, and simulated results were compared. The composite slab was modelled using four-node quadrilateral shell elements with reduced integration (S4R) and the wire mesh was considered using a rebar option from the ABAQUS library. C21 concrete with a compressive strength of 21 MPa, SD400 reinforcing bars with a yield strength of 400 MPa, and a QL600 steel deck with a minimum specified yield strength of 205 MPa were used for material properties. The concrete material model used in the analysis was concrete damage plasticity in ABAQUS, which could provide an effective method for modeling the concrete behavior in tension and compression. This study employed the stress-strain relationship proposed by Hognestad [20] in compression and Mondal and Prakash [21] in tension, as shown in Figure 5a. An elastic perfectly-plastic material was used for the steel deck and rebar with an identical behavior in tension and compression (see Figure 5b). The roller and pin supports for the composite slab were placed at a distance of 100 mm away from the span ends. The two-point displacement load was applied, and the vertical deflection at the mid-span was measured. Figure 6 shows a comparison of the vertical load-displacement curves obtained from the FEM and the tests. The analytical and experimental results were in good agreement with each other for the ultimate load, initial stiffness, and elicited behavior, but the descending branch was not developed in the large-deformation behavior of the analysis model after reaching the ultimate load. To improve this result, the concrete tension stiffening model, which decreases linearly to reach zero stress at a strain of 0.0035 in the softening behavior (Figure 6b), was applied to this analysis. As a result, the curve computed from the reduced model is generally in good agreement with the experimental one. The initial tensile cracks of the concrete occurred at the lower surface of the loading location under P = 11.04 kN (Figure 7a), followed by the yielding of the steel deck of the strong strip when the vertical load reached P = 37.05 kN (Figure 7b).

3.4. Reduced Modeling for WUF-B and RBS Connection

In this study, the prequalified connection details of WUF-B and RBS specified in FEMA 350 [22] and AISC 341 [23] for use in ordinary moment frames were selected to compare the structural sensitivity of different structural systems for the steel structure. In FEMA 355F [24], there is also the reduced model proposed by Krawinkler [25] (Krawinkler model) as a representative analytical model to simulate the non-linear behavior of the beam-column connections, as shown in Figure 8. This model developed to resist lateral forces due to earthquake loads is most commonly used in seismic-related analytical research studies. Furthermore, it is also extensively used in analytical studies for progressive collapse based on gravity loads. It holds the full dimension of the panel zone with rigid links and controls the deformation of the panel zone using two rotational springs and hinges. The yielding and plastic properties of the panel zone are calculated as follows:
k θ = M y θ y   where :   M y = 0.55 F y d c t p z d b ,   θ y = F y 3 G  
M p = 0.55 F y d c t p z d b [ 1 + 3 b c f t c f 2 d b d c t p z ] ,   θ p = 4 θ  
where d c is the column depth, d b is the beam depth, t c f is the column flange thickness, b c f is the column flange width, and t p z is the panel zone thickness.
As depicted in Figure 9, Sadek et al. [7] (Sadek model) developed the various reduced models with WUF-B and RBS connections suitable for progressive collapse analyses based on gravity loads. Compared with the Krawinkler model, this WUF-B reduced model (Figure 9a) further considers the upper and lower flanges and shear tap components whereby the panel zone behavior is defined as a uniaxial spring element determined by the section properties as follows:
k p z = G ( d c t c f ) t p z ( d b t b f ) cos 2 θ   where :   cos 2 θ = ( d c t c f ) 2 ( d c t c f ) 2 + ( d b t b f ) 2  
  f p z = 0.6 F y d c t p z cos θ [ 1 + 3 b c f t c f 2 d b d c t p z ]  
where G is the shear modulus of steel and t b f is the beam flange thickness.
Sadek et al. [7] used the bolt spring connection based on the test results of the shear tab and beam web. However, in this study, the biaxial spring model was employed with the vertical and horizontal axes proposed by Main and Sadek [26]. Zero-length spring elements were used to model the shear behavior of the bolts, and each bolt spring was defined as an element with properties based on the axial load-deformation relationship. Figure 10 shows a typical shear load-deformation relationship and the parameters for bolt springs, which exhibit a steeper drop in resistance after the ultimate load is reached in both tension and compression. The yield and ultimate capacities of each spring, i.e., t y ( = c y ) and t u ( = c u ) , are calculated using equations listed in the AISC 360 [27], and the deformation at the ultimate load δ u is obtained as δ u = θ m a x · y m a x , where θ m a x is the plastic rotation capacity and y m a x is the distance from the center of the bolt group to the most distant bolt. Failure deformation is applied as 1.15 δ u referring to Main and Sadek [26] in order to consider the rapid drop after the ultimate load.
The initial stiffness of a spring k b s can be estimated using Equation (14) in the FEMA 355D [28] based on the linear regression of rotational stiffness data from seismic testing.
k b s = κ i y i 2   where :   κ = 124550 ( d b g 142 )  
where κ is the initial rotational stiffness of a shear tab, d b g = s ( N 1 ) is the depth of the bolt group, s is the vertical spacing between bolts, N is the number of bolts, and y i is the vertical distance of the i th bolt row from the center of the bolt group.
The RBS model is the same as the modeling approach used for the panel zone of WUF-B and the rigid links connect the end of the beam elements along the girder centerline, as shown in Figure 9b. In this study, the equivalent effective width model proposed by Lee [29] in Figure 11 was employed to consider the radius-cut section that led to the plastic hinge of the beam. This model was verified using 3-D finite element analyses for RBS specimens subjected to cyclic loads. It can be applied to the Krawinkler model because it considers only the radius-cut section of the beam. Additionally, it is assumed that the initial elongation equals the elongation of the section replaced with the equivalent constant width of the radius-cut section, and the equivalent effective width b e q is derived as Equation (15).
b e q = X 1 X 2   where :   X 1 = b [ L b 2 ( a + b 2 ) ] ,   X 2 = ( L b 2 a b ) b b f 2 c R × tan 1 ( b 2 R b b f 2 c R )  
where a is the horizontal distance from the face of column flange to the start of the RBS cut, b is the length of an RBS cut, c is the depth of the RBS cut at the center of the reduced beam section, R is the radius of the RBS cut, L b is the length of the beam, and b b f is the beam flange width.

3.5. Verification of Reduced Modeling for WUF-B and RBS Connection

To verify the reduced models for WUF-B and RBS connections, the test specimen in Figure 12 was modeled using ABAQUS, as shown in Figure 13. These physical tests were carried out by Sadek et al. [7] to investigate the response of steel beam-column assemblies with moment resisting connections under the monotonic loading conditions expected in the column removal scenarios. The sizes of the specimens were two spans with a length of 6.10 m and columns with a height of 3.66 m, and two diagonal braces for each column were rigidly constrained to the top of the column and the strong floor of the test facility. Diagonal braces were installed to simulate the lateral restraint effect provided by the continuous upper-floor framing system of the multistory building. Displacement transducers and load cells were used to measure the displacement and vertical load applied by the hydraulic actuator with a capacity of 2700 kN and a stroke length of 500 mm at the center column of the test specimens. The strain gauges were attached to calculate the axial forces developed at the midspan of the beams, columns, and diagonal braces during the test. In the analysis model based on the test specimens, the shear tab, flange, beam, and column consisted of a two-node linear beam element (B31), and rigid links of the panel zones were assigned to the discrete rigid element (RB3D2). The CONNECTOR option in ABAQUS were used to model the panel zone spring, bolt spring, and diagonal braces installed for the lateral support of the upper column. The ASTM A992 structural steel with a yield strength of 344.8 MPa was used in all beams, columns, and doubler plates in the panel zones. The ASTM A36 steel with a yield strength of 248.2 MPa was used for the shear tabs and continuity plates at beam-column connections. The ASTM A490 high strength bolts were used for the bolted moment connections. Figure 14 shows the nonlinear panel zone spring properties for each test specimen calculated on the basis of the reduced modeling approaches described in Section 3.4. Using Equation (15), the equivalent effective width b e q of the RBS specimen was calculated to be equal to 147 mm and the finite element analysis was performed under displacement-controlled loading of the unsupported center column.
Figure 15 represents a comparison between the numerical results from the FEM and experimental results from the WUF-B and RBS specimens. Compared to the experimental results, the Krawinkler model curves show that the yielding loads increased by 45% and 31% in the load-displacement curves, respectively, and that the development of catenary action in the beams is quite different from the experimental and Sadek model results. In contrast, the Sadek model curves indicate good agreement with the experimental load-displacement and catenary action curves. Figure 16 and Figure 17 show the failure mode of test specimens and the deformation of the WUF-B and RBS test specimens under failure load, respectively. In the experiment, the dominant deformation of the WUF-B test specimen occurred at the flanges near the weld access hole of the beam, and the failure was characterized by the fracture of the bottom flange near the center column. In the case of the RBS test specimen, dominant deformation occurred at the reduced section of the beam and panel zone, and the failure was characterized by the fracture of the bottom flange in the reduced section of the connection near the center column. The observed behaviors of tests described previously are fairly well described by Sadek models, but are completely different to those by the Krawinkler models. This indicates that the Krawinkler model is not appropriate for the progressive collapse analysis based on gravity loads. Therefore, this study employs the Sadek model to accurately assess collapse resistance performance.

4. Evaluation of Progressive Collapse Resistance Performance of Selected Structure

4.1. Description of Prototype Building Design

To evaluate the structural sensitivity proposed by Noh et al. [16] for 3-D steel moment frames with different seismic connections, a prototype building was designed. Considering the guidelines by the KMLIT [5], the steel structure was assumed to be used as office space with a total floor area that exceeded 20,000 m2, as shown in Table 2. As a result, the building had seven stories and plan dimensions of 40 × 72 m with 5 × 8 bay, as shown in Figure 18. Using the design loads based on the KBC 2016 [17], the structural members were designed as per KSSDC 2016 [30]. The building was assumed to be in Seismic Design Category D, and the lateral loads were resisted by seismically designed ordinary moment frames (OMFs) located at the exterior of the building. All interior frames were designed to support gravity loads only. In the design of the prototype building, SS400 structural steel with a yield strength of 235 MPa was used in all the beams and girders, whereas SM490 steel with a yield strength of 325 MPa was used in all the columns. Table 3 shows the member sizes of the moment resisting frames, while the gravity loads considered in the design are listed in Table 4.

4.2. Design of Composite Slab and Shear Stud Anchor

The composite slab of the prototype building was designed using the material properties of the test specimen in Section 3.3. Considering bearing capacity and serviceability, the thickness of the topping concrete and steel deck was determined to be 100 mm and 1.2 mm, respectively. The designed strength of the composite slab was more than 3.3 times the required strength to satisfy the acceptance criteria for natural frequency considering noise and vibration in the serviceability check. The shear strength of the stud anchor connecting the beam flange to the steel deck was calculated using Equation (16) in the KBC 2016 [17].
( D m a x ) p u s h = 0.50 A s h f c k E c ,   E c = 5050 f c k  
Shear stud anchors with a diameter of 19 mm were used to develop a full composite action between the steel beams and the concrete slab. Considering the nominal shear strength of the shear stud and the requirements in the standard, the arrangement of the stud anchor was equally spaced every 900 mm in the beam at the long side of the plan and every 800 mm in the beam at the short side of the plan, as shown in Figure 19. The physical test for the progressive collapse of the composite slab was conducted by Astaneh-Asl et al. [31], who reported that the stud anchor hardly deformed at large displacements under the monotonic loading conditions. Additionally, Kim et al. [32] used the spot welding option in ABAQUS to model stud anchors in an analytical study of the progressive collapse resistance of the 2 × 2 bay subassembly frames. Based on these studies, the present study employed the spot welding option to model stud anchors.

4.3. Design and Modeling of RBS Connections

The WUF-B connection is prequalified by FEMA 350 and AISC 341 [22,23] for use only in ordinary moment frames and provides a fully rigid interconnection between the beam and column. In contrast, the RBS connection is applicable to ordinary, intermediate, and special moment frames because of its excellent ductility. AISC 358 [33] provides the requirements and dimensions ( a ( 0.50 ~ 0.75 ) b f , b ( 0.65 ~ 0.85 ) d b , and c 0.25 b f ) for the radius-cut section of the RBS connection to induce plastic hinges in the beam and to limit the moment and inelastic deformation developed at the face of the column. The RBS connections of the moment frames in the prototype building were designed as per AISC 358 [33] and were modeled using the reduced modeling approaches explained in Section 3.4. Equivalent effective widths b e q and dimensions of the RBS connections for moment resisting frames are listed in Table 5. Figure 20 depicts an example of the RBS connection for G1 at 1-3F.

4.4. Energy-Based Approximate Analysis Based on Nonlinear Static Analysis

Uniformly distributed loading of the gravity load combination λ ( 1.0 D L + 0.25 L L ) was applied to the entire floor slab of the prototype buildings, individually designed with WUF-B and RBS connections. With the use of a force-controlled pushdown approach, the load factor λ was gradually increased until failure occurred. The column removal scenarios were performed for each column location specified in the GSA 2003 [2], as shown in Figure 18a. Figure 21 shows the load factor-vertical displacement curves at the removed column location. Failure of the structure was determined by the divergence in numerical analysis due to instability of the structure after successive yielding of the beam-column connections or the beam members adjacent to the removed column at all the levels. The yielding of the 1-D element was evaluated using the von Mises stress in the finite element program used in this study. Herein, the von Mises stress was obtained from the maximum bending stress and axial stress calculated through corresponding section forces (M, N).
In the column removal scenario, the maximum and minimum failure load factors of the building with WUF-B connections were λ A 6 = 4.15 and λ E 4 = 3.20 for the case where columns A6 and E4 were removed, respectively, and the corresponding displacements were δ A 6 = 108.74 mm and δ E 4 = 90.07 mm, as shown in Figure 21a. In all the scenarios, the flange yielding was observed for all the WUF-B connections located at the exterior of the roof floor level (Figure 22b). It was confirmed that the yielding of the flange preferentially occurred since the design redundancy of the beam members in the roof floor level was smaller than that of floors 1 through 6, as listed in Table 6. When columns A4, A6, and E6 were removed, plastic hinges increased due to the yielding of the WUF-B connections from the lower to the upper floor level until the failure load factor was reached. Correspondingly, the analysis was terminated due to the instability of the whole structure (Figure 22a). In the case of the removal of the column E4, the analysis was terminated since the structure was unstable because of the successive yielding of the beam members adjacent to the removed column at all the levels.
The load-displacement curves and failure modes for the column removal scenario of the building with the RBS connections in Figure 21b and Figure 23a were almost similar to the results of the WUF-B connections, and the yielding of the moment resisting frames located at the exterior of the roof floor level was observed. However, the maximum failure load factor was verified in the case of the removal of the column A4, while the yielding of the moment frames occurred within the reduced section of the RBS connections (Figure 23b). In the column removal scenario, the maximum and minimum failure load factors of the building with the RBS connection after the removal of columns A4 and E4 were λ A 4 = 5.36 and λ E 4 = 3.86, respectively, and the corresponding displacements were δ A 4 = 64.20 mm and δ E 4 = 137.94 mm. These results show that the load factor and vertical displacement increased by 20~58% and 53~211%, respectively, compared with the results of the WUF-B connections.
Figure 24 shows the load factor-vertical displacement curves after the application of the energy-based approximate analysis introduced in Section 2.3 to the nonlinear static analysis results in Figure 21. These results, accounting for the dynamic effects associated with sudden column loss, can be used to evaluate the progressive collapse resistance performance using the load combination of the dynamic analysis. Table 7 shows the vertical displacements and the chord rotation under the load combination 1.0 D L + 0.25 L L specified in GSA 2003 [2]. The maximum vertical displacement δ G S A = 40 mm of the two buildings was obtained from the elicited results of the removal scenario of column E4, while chord rotation was calculated to be equal to 0.0050 rad. These results showed that the chord rotation of these connections were within the range of 14~20% of the limit values (WUF-B = 0.025 rad and RBS = 0.035 rad) specified in GSA 2003 [2] and that the two buildings individually designed with different connections satisfied all of the collapse resistance performance criteria. It is evident that the composite slabs designed to have more than 3.3 times the required capacity improved the stiffness of the entire structure and induced very small bay deflection at the removed column. Therefore, it appears that the structures designed in this study will hardly fail due to progressive collapse.

5. Evaluation of Structural Robustness and Sensitivity for Progressive Collapse

For the two buildings considered previously, the structural robustness for progressive collapse was evaluated using Equation (7) in Section 2.4. This study was based on the evaluation criteria for the WUF-B and RBS connections in GSA 2003 [2]. Therefore, required capacity D was defined as the load combination G o = 1.0 D L + 0.25 L L that satisfies the maximum chord rotation, i.e., θ m a x < θ a c c . Correspondingly, the maximum resistance C of the two buildings was defined as the maximum dynamic load P D y n , u that satisfies the maximum chord rotation, i.e., θ m a x < θ a c c . As shown in Table 8, from the analytical results of Section 4, in the column removal scenario of building with the WUF-B connections, since the maximum chord rotations do not exceed the limit chord rotation of 0.025 rad up to the point where the failure load factor is reached, the structural robustness r based on Equation (17) is determined by the failure load factor r W U F B = 1.78, corresponding to the removal of column A4. In the case of the building with the RBS connections, the failure load factor was calculated as r R B S = 3.92 and decreased by 5.31% due to the maximum chord rotation that exceeded the allowable chord rotation limit of 0.035 rad. However, this value is 61% larger than the failure load factor estimated in the scenario of the sudden loss of column E4. Thus, the structural robustness is r R B S = 2.44.
  r = C D = m i n P D y n , u 1.0 D L + 0.25 L L = m i n ( λ m a x   f o r   a l l   c o l u m n   r e m o v a l   c a s e s )  
Figure 25 shows the comparison of the load factor and chord rotation relations in terms of structural robustness of the two buildings. The GSA 2003 [2] acceptance criterion indicates that the building with a smaller chord rotation has reliable collapse resistance. The building with the WUF-B connections was calculated to have a 59% smaller chord rotation than the other structure under a combination load of 1.0 D L + 0.25 L L . This was because the WUF-B connections without defects of beams improved the stiffness of the structure in comparison with the RBS connections, resulting in a relatively small deformation. With regard to structural robustness, the building with the RBS connections was superior to the other building by 37% better performance than the counterpart.
The structural sensitivity S for the column removal scenario of the two buildings was evaluated based on Equation (8). The robustness index r o of the initial structure with an undamaged column was calculated by applying the nonlinear static analysis introduced previously. Correspondingly, all the seismically designed connections yielded in the roof floor, and the analysis was terminated due to the instability of the structure (Figure 26). The maximum failure load factor obtained from the analysis was r o , W U F B = 5.15 for the building with the WUF-B connections and r o , R B S = 5.34 for the building with the RBS connections.
Consequently, the sensitivity index S of the two buildings estimated using the above results are presented in Table 9. For the abnormal loads specified in GSA 2003 [2], the building with the RBS connections was most sensitive to the removal of column E4, and corresponded to 33% of the initial bearing capacity. However, when column A4 was removed, the bearing capacity of the building with the WUF-B connections was reduced to 19% of the initial capacity. This is the most sensitive case in comparison with all the other cases. Therefore, the reduced bearing capacity of the building with the WUF-B connections was 14% higher than that of the building with the RBS connections, and it was thus considered to be a relatively more sensitive structure for progressive collapse.

6. Conclusions

This study evaluated the progressive collapse resistance performance of steel moment frame systems under column loss scenarios. For reliability, convenience, and efficiency of modeling and analysis, the reduced models consisted of 1-D and 2-D elements and the energy-based approximate analysis with dynamic effects were used. Based on these approaches, the structural robustness and sensitivity for progressive collapse was evaluated in column removal scenarios.
The comparison between the numerical results of the reduced models and the experimental results indicated that the computational models of the composite slab and the seismically designed connections employed in this study were suitable for the progressive collapse analysis. Additionally, they indicated that the Krawinkler model typically used in seismic research does not properly simulate the elicited behavior against gravity load. The progressive collapse resistance performance for the column removal scenario of the steel moment frames individually designed with the WUF-B and the RBS connections satisfied all the criteria specified in GSA 2003 [2]. These results were because the composite slabs designed to have more than 3.3 times the required capacity improved the stiffness of the entire structure. In the case of the building with the WUF-B connections, the reduction of the bearing capacity under the loss of a column at the short side of the plan was largest, but the structure was able to resist loads that were equal to 1.8 times the gravity load specified in the guide. Furthermore, the building with the RBS connections elicited the greatest reduction of bearing capacity when the interior column was removed, but it yielded a 14% higher bearing capacity than the building with the WUF-B connections and was considered to be less sensitive for progressive collapse. The results of this study indicated that the RBS connections showed better resistance performance against progressive collapse compared to the WUF-B connections, since the prototype structure was designed using a general steel structural plan and employed different connection details based on the standard.
In this study, the sensitivity for progressive collapse under sudden loss of a column was evaluated for seismically designed steel ordinary moment frames. Future research will focus on the analysis and comparison of the structural sensitivity of steel moment frames individually designed with different structural systems (e.g., intermediate moment frames and special moment frames) and of structures with multiple columns removed based on the guide.

Author Contributions

All authors contributed substantially to all aspects of this article.

Funding

This research received no external funding.

Conflicts of Interest

The authors declare no conflict of interest.

References

  1. ASCE 7. Minimum Design Loads for Buildings and Other Structures; American Society of Civil Engineers: Reston, VA, USA, 2010. [Google Scholar]
  2. GSA. Progressive Collapse Analysis and Design Guidelines for New Federal Office Building and Major Modernization Project; U.S. General Services Administration: Washington, DC, USA, 2003.
  3. DoD (Department of Defense). Design of Buildings to Resist Progressive Collapse; Unified Facilities Criteria 4-023-03: Washington, DC, USA, 2009.
  4. BS (British Standard) 5950. Structural Use of Steelwork in Buildings-Part 1: Code of Practice for Design-Rolled and Welded Sections; British Standard Institution: London, UK, 2000. [Google Scholar]
  5. Korea Ministry of Land, Infrastructure and Transport. Design Guidelines for Terror Prevention in Buildings; Korea Ministry of Land, Infrastructure and Transport: Sejong, Korea, 2010.
  6. Marjanishvili, S.M. Progressive Analysis Procedure for Progressive Collapse. J. Perform. Constr. Facil. 2004, 18, 79–85. [Google Scholar] [CrossRef]
  7. Sadek, F.; Main, J.A.; Lew, H.S.; El-Tawil, S. Performance of Steel Moment Connections under a Column Removal Scenario. II: Analysis. J. Struct. Eng. 2013, 139, 108–119. [Google Scholar] [CrossRef]
  8. Bao, Y.; Lew, H.S.; Kunnath, S.K. Modeling of Reinforced Concrete Assemblies under a Column Removal Scenario. J. Struct. Eng. 2014, 140, 04013026. [Google Scholar] [CrossRef]
  9. Main, J.A. Composite Floor Systems under Column Loss: Collapse Resistance and Tie Force Requirements. J. Struct. Eng. 2014, 140, A4014003. [Google Scholar] [CrossRef]
  10. Sadek, F.; El-Tawil, S.; Lew, H.S. Robustness of Composite Floor Systems with Shear Connections: Modeling, Simulation, and Evaluation. J. Struct. Eng. 2008, 134, 1717–1725. [Google Scholar] [CrossRef]
  11. Alashker, Y.; El-Tawil, S.; Sadek, F. Progressive Collapse Resistance of Steel-Concrete Composite Floors. J. Struct. Eng. 2010, 136, 1187–1196. [Google Scholar] [CrossRef]
  12. Izzuddin, B.A.; Vlassis, A.G.; Elghazouli, A.Y.; Nethercot, D.A. Progressive collapse of multi-storey buildings due to sudden column loss-Part I: Simplified assessment framework. Eng. Struct. 2008, 30, 1308–1318. [Google Scholar] [CrossRef] [Green Version]
  13. Main, J.A.; Liu, J. Robustness of Prototype Steel Frame Buildings against Column Loss: Assessment and Comparisons. In Proceedings of the 2013 Structures Congress, Pittsburgh, PA, USA, 2–4 May 2013. [Google Scholar]
  14. Bao, Y.; Main, J.A.; Noh, S.Y. Evaluation of Structural Robustness against Column Loss: Methodology and Application to RC Frame Buildings. J. Struct. Eng. 2017, 143, 04017066. [Google Scholar] [CrossRef] [Green Version]
  15. Starossek, U.; Haberland, M. Approaches to measures of structural robustness. J. Struct. Infrastruct. Eng. 2011, 7, 625–631. [Google Scholar] [CrossRef]
  16. Noh, S.Y.; Park, K.H.; Hong, S.C.; Lee, S.Y. Evaluation of Progressive Collapse Resistance of Steel Moment Frame with WUF-B Connection and Composite Slab using Equivalent Energy-based Static Analysis. J. Arch. Inst. Korea Struct. Constr. 2018, 34, 19–28. [Google Scholar]
  17. KBC (Korean Building Code). Chapter 3-Design Loads; Korea Ministry of Land, Infrastructure and Transport: Sejong, Korea, 2016.
  18. Elnashai, A.S.; Di Sarno, L. Fundamentals of Earthquake Engineering; John Wiley & Sons: West Sussex, UK, 2008; ISBN 978-0-470-02483-6. [Google Scholar]
  19. Kim, G.D.; Huh, C.; Kim, J.H.; Yoon, M.H.; Lee, M.J.; Moon, T.S.; Kim, G.S.; Kim, D.J.; Kim, D.K. A Study on the Structural Behavior of the Composite Slabs with the Composite Metal Deckplate. Mag. Korean Soc. Steel Constr. 1996, 8, 273–282. [Google Scholar]
  20. Hognestad, E. A Study of Combined Bending and Axial Load in Reinforced Concrete Members; Bulletin Series No. 399; University of Illinois Engineering Experimental Station: Urbana, IL, USA, 1951. [Google Scholar]
  21. Mondal, T.G.; Prakash, S.S. Effect of Tension Stiffening on the Behaviour of Reinforced Concrete Circular Columns under Torsion. Eng. Struct. 2015, 92, 186–195. [Google Scholar] [CrossRef]
  22. FEMA 350. Recommended Seismic Design Criteria for New Steel Moment-Frame Buildings; SAC Joint Venture and Federal Emergency Management Agency: Washington, DC, USA, 2000. [Google Scholar]
  23. AISC 341. Seismic Provisions for Structural Steel Buildings; American Institute of Steel Construction: Chicago, IL, USA, 2016. [Google Scholar]
  24. FEMA 355F. State of the Art Report on Performance Prediction and Evaluation of Steel Moment-Frame Buildings; SAC Joint Venture and Federal Emergency Management Agency: Washington, DC, USA, 2000. [Google Scholar]
  25. Krawinkler, H. Shear Design of Steel Frame Joints. Eng. J. 1978, 15, 82–91. [Google Scholar]
  26. Main, J.A.; Sadek, F. Modeling and Analysis of Single-Plate Shear Connections under Column Loss. J. Struct. Eng. 2014, 140, 04013070. [Google Scholar] [CrossRef]
  27. AISC 360. Specification for Structural Steel Buildings; American Institute of Steel Construction: Chicago, IL, USA, 2016. [Google Scholar]
  28. FEMA 355D. State of the Art Report on Connection Performance; SAC Joint Venture and Federal Emergency Management Agency: Washington, DC, USA, 2000. [Google Scholar]
  29. Lee, C.H. Lateral Stiffness of Steel Moment Frames Having Dogbone Seismic Connection. J. Comput. Struct. Eng. Inst. Korea 2002, 15, 639–648. [Google Scholar]
  30. KSSDC. Korea Steel Structure Design Code-Load and Resistance Factored Design; Korea Ministry of Land, Infrastructure and Transport: Sejong, Korea, 2016.
  31. Astaneh-Asl, A.; Madsen, E.A.; Noble, C.; Jung, R.; McCallen, D.B.; Hoehler, M.S.; Li, W.; Hwa, R. Use of Catenary Cables to Prevent Progressive Collapse of Buildings; Report No. UCB/CEE-STEEL-2001/02; University of California: Berkeley, CA, USA, 2001. [Google Scholar]
  32. Kim, S.W.; Lee, C.H.; Lee, K.K. Effects of Composite Floor Slab on Progressive Collapse Resistance of Steel Moment Frames. J. Arch. Inst. Korea Struct. Constr. 2014, 30, 3–10. [Google Scholar]
  33. AISC 358. Prequalified Connections for Special and Intermediate Steel Moment Frames for Seismic Applications; American Institute of Steel Construction: Chicago, IL, USA, 2016. [Google Scholar]
Figure 1. Dynamic analysis loading in accordance with GSA 2003 [2].
Sustainability 10 03797 g001
Figure 2. Concept of load-displacement responses in the energy-based analysis (Noh et al. [16]).
Sustainability 10 03797 g002
Figure 3. Reduced model of composite slab (Main [9]). (a) scaled thickness of steel deck; (b) reduced model of 2 × 2 bay composite slab system.
Sustainability 10 03797 g003aSustainability 10 03797 g003b
Figure 4. Composite slab test under two-point concentrated loading (Kim et al. [18]). (a) schematic of test setup; (b) ABAQUS-model of composite slab.
Sustainability 10 03797 g004aSustainability 10 03797 g004b
Figure 5. Stress-strain relationship for concrete, steel deck, and wire mesh. (a) concrete; (b) steel deck and wire mesh.
Sustainability 10 03797 g005
Figure 6. Comparison of results from the test and analysis of the composite slab. (a) vertical load- displacement curves; (b) applied tension stiffening models.
Sustainability 10 03797 g006
Figure 7. Stress contour results from the analysis of the composite slab. (a) axial stress of concrete under P = 11.04 kN; (b) von Mises stress of steel deck under P = 37.05 kN.
Sustainability 10 03797 g007aSustainability 10 03797 g007b
Figure 8. Reduced model proposed by Krawinkler [25].
Sustainability 10 03797 g008
Figure 9. Reduced models developed by Sadek et al. [7]. (a) WUF-B model; (b) RBS model.
Sustainability 10 03797 g009
Figure 10. Shear load-deformation relationship and parameters for bolt spring (Main and Sadek [26]).
Sustainability 10 03797 g010
Figure 11. Geometries and parameters of radius-cut RBS (Lee [29]).
Sustainability 10 03797 g011
Figure 12. Resistance performance test of steel moment connections proposed and conducted by Sadek et al. [7]. (a) test setup for WUF-B connection; (b) WUF-B connection details; (c) test setup for RBS connection; (d) RBS connection details.
Sustainability 10 03797 g012
Figure 13. ABAQUS modeling for tests with steel beam-column assemblies. (a) WUF-B specimen using Krawinkler model; (b) WUF-B specimen using Sadek model; (c) RBS specimen using Sadek model.
Sustainability 10 03797 g013aSustainability 10 03797 g013bSustainability 10 03797 g013c
Figure 14. Nonlinear panel zone spring and bolt spring properties. (a) panel zone spring behavior for Krawinkler model; (b) panel zone spring behavior for Sadek model; (c) bolt spring behavior for Sadek model.
Sustainability 10 03797 g014
Figure 15. Results from test and analysis of WUF-B and RBS specimens. (a) vertical load-displacement curves for WUF-B specimen; (b) beam axial force-displacement curves for WUF-B specimen; (c) vertical load-displacement curves for RBS specimen; (d) beam axial force-displacement curves for RBS specimen.
Sustainability 10 03797 g015
Figure 16. Failure mode of test specimens conducted by Sadek et al. [7]. (a) WUF-B specimen; (b) RBS specimen.
Sustainability 10 03797 g016aSustainability 10 03797 g016b
Figure 17. Deformations of WUF-B and RBS test specimens under failure load. (a) Krawinkler model for WUF-B specimen; (b) Sadek model for WUF-B specimen; (c) Krawinkler model for RBS specimen; (d) Sadek model for RBS specimen.
Sustainability 10 03797 g017aSustainability 10 03797 g017bSustainability 10 03797 g017cSustainability 10 03797 g017d
Figure 18. Overview of structure model (Noh et al. [16]). (a) plan of prototype structure; (b) ABAQUS-model of analyzed structure.
Sustainability 10 03797 g018aSustainability 10 03797 g018b
Figure 19. Arrangement of shear stud anchors.
Sustainability 10 03797 g019
Figure 20. Example of RBS connection for G1 at 1-3F.
Sustainability 10 03797 g020
Figure 21. Load factor-vertical displacement from nonlinear static analyses for column removal scenario. (a) elicited response for the building with WUF-B connections; (b) corresponding response for the building with RBS connections.
Sustainability 10 03797 g021
Figure 22. Elicited results from the building with WUF-B connections in accordance to the removal scenario of column A6. (a) deformation of structure for λ = 4.15; (b) von Mises stress for first yielding of the WUF-B connection at the roof floor.
Sustainability 10 03797 g022aSustainability 10 03797 g022b
Figure 23. Elicited results from the building with RBS connections in accordance to the removal scenario of column A4. (a) deformation of structure for λ = 5.36; (b) von Mises stress for first yielding of the RBS connection at the roof floor.
Sustainability 10 03797 g023aSustainability 10 03797 g023b
Figure 24. Load factor-vertical displacement for column removal scenario using energy-based approximate analysis. (a) building with WUF-B connection; (b) building with RBS connection.
Sustainability 10 03797 g024
Figure 25. Comparison of load factor and chord rotation relations in terms of structural robustness of the two buildings.
Sustainability 10 03797 g025
Figure 26. Failure mode of the initial structure. (a) building with WUF-B connection; (b) building with RBS connection.
Sustainability 10 03797 g026aSustainability 10 03797 g026b
Table 1. Acceptance criteria for nonlinear analyses in accordance with GSA 2003 [2].
ComponentRotation [% rad]
Steel Frames3.5
Steel Frame Connections: Fully Restrained
Welded Beam Flange or Coverplated (all types)2.5
Reduced Beam Section3.5
Table 2. Prototype building information.
RegionSeoul, Korea
Sum of floor area20,160 m2
Scale of structure7 stories
Seismic design categoryD
Type of frameSteel ordinary moment frames
Seismic connection typeWUF-B or RBS
Table 3. Member sizes of moment resisting frames.
MemberFloor and SectionMemberFloor and Section
Girder G11-3FH594×302×14/23Girder G21-3FH912×302×18/34
4-6FH594×302×14/234-6FH700×300×13/24
7FH244×175×7/117FH400×200×8/13
Girder G31-3FH596×199×10/15Girder G41-3FH582×300×12/17
4-6FH596×199×10/154-6FH582×300×12/17
7FH496×199×9/147FH496×199×9/14
External column1-3FH428×407×20/35Internal column1-3FH428×407×20/35
4-6FH406×403×16/244-6FH300×305×15/15
7FH300×300×10/157FH200×200×8/12
Table 4. Applied gravity load.
TypeDead LoadLive Load
Floor [kN/m2]4.02.5
Roof [kN/m2]2.01.0
Table 5. Equivalent effective widths and dimensions of RBS connections for moment resisting frames.
MemberFloor a [mm] b [mm] c [mm] b e q   [ mm ]
Girder G11-3F15539070197
4-6F15539070197
7F9015943108
Girder G21-3F15560075191
4-6F18046075188
7F12028050125
Table 6. Design redundancy of girder members.
FloorRedundancy
Floors 1-31.283
Floors 4-61.425
Roof Floor1.131
Table 7. Vertical displacement and chord rotation under the combination load of 1.0 D L + 0.25 L L .
Removed ColumnBuilding with WUF-B ConnectionsBuilding with RBS Connections
Vertical Displacement [mm]Rotation [% rad]Vertical Displacement [mm]Rotation [% rad]
A414.590.001813.880.0017
A632.610.004138.580.0048
E439.920.005039.970.0050
E634.070.003834.430.0038
Table 8. Maximum chord rotation for P D y n , u .
Removed ColumnBuilding with WUF-B ConnectionsBuilding with RBS Connections
Load   Factor   λ m a x   Rotation [% rad] Load   Factor   λ m a x   Rotation [% rad]
A41.780.00353.220.0080
A62.630.01364.14 (3.92)0.0422 (0.0350)
E41.890.01132.440.0172
E61.930.00782.740.0151
Table 9. Evaluation of structural sensitivity.
Removed Column Sensitivity   Index   S
Building with WUF-B ConnectionsBuilding with RBS Connections
A40.190.51
A60.390.72
E40.210.33
E60.220.40

