1. Introduction
The global transition toward sustainable mobility has positioned electric vehicles (EVs) as a primary solution for reducing greenhouse gas emissions. However, the energy performance of these vehicles under real-world operating conditions remains a critical area of study, as official range values often differ from actual on-road behavior. Recent research has shown that EV energy consumption is not determined solely by vehicle design, but is also strongly influenced by external factors such as vehicle mass and road gradient, both of which significantly increase traction demand [
1]. In particular, uphill driving substantially raises energy consumption, especially under high-load conditions, whereas downhill segments create favorable conditions for energy recovery due to gravitational assistance [
2]. This issue is especially relevant in high-altitude Andean urban environments, where topographical and atmospheric conditions impose distinct operational challenges on electric powertrains compared with those observed in conventional internal combustion vehicles [
3].
Road gradient directly modifies the longitudinal force required at the wheels and, consequently, the electrical power demanded from the battery. During uphill operation, the gravitational component acts against vehicle motion and increases traction power requirements. Conversely, during downhill operation, the same component can assist vehicle motion and increase the potential for regenerative braking. Therefore, evaluating EV performance only under flat-road or standardized laboratory conditions may not fully represent the energetic behavior observed in cities with pronounced altitude variations and steep urban gradients. This is consistent with recent systematic evidence showing that battery electric vehicle (BEV) energy consumption depends on several interacting factors, including vehicle characteristics, driving behavior, road conditions, data sources, modelling scale, and sampling frequency [
4].
Another key component in EV energy performance is the regenerative braking system (RBS), whose design and control strategy play a decisive role in extending driving range [
5]. Regenerative braking allows part of the kinetic energy normally dissipated during deceleration to be converted into electrical energy and stored in the battery. However, the amount of recoverable energy depends on several factors, including road slope, vehicle speed, braking intensity, state of charge (SoC), battery acceptance limits, and the control strategy adopted by the vehicle [
6,
7]. Previous experimental studies under real driving conditions have shown that the efficiency of regenerative braking can vary significantly among vehicles and routes, which reinforces the need for field-based energy assessment instead of relying only on standardized cycles or simulation-based analyses [
6].
Recent studies have also emphasized the importance of considering elevation changes and real-traffic routes when evaluating EV energy performance. Kropiwnicki and Gawłas [
8] analyzed real routes with regenerative braking and showed that elevation variation can strongly affect energy-efficient route selection, since regenerative braking efficiency is significantly lower than 100%. Similarly, Valladolid et al. [
7] experimentally evaluated regenerative braking in an electric vehicle under different road geographies and identified vehicle speed, torque, SoC, braking time, and road inclination as relevant factors affecting energy recovery. However, that study did not evaluate different driving modes, which remains relevant because vehicle control calibration can modify the regenerative response under the same road condition.
Other works have focused on improving the control strategy of regenerative braking systems. Recent developments have shown that advanced approaches based on artificial intelligence, optimization methods, and fuzzy control can improve braking force distribution and enhance energy recovery [
9,
10]. Similarly, adaptive strategies that account for driving conditions and user behavior have demonstrated strong potential for improving EV efficiency in urban environments [
11,
12,
13]. Cai and Liu [
14] analyzed long downhill braking and energy recovery in pure electric commercial vehicles, demonstrating that road slope, braking deceleration, and battery SoC influence the achievable recovery rate during sustained downhill operation. These studies provide valuable insights into regenerative braking control and downhill energy recovery; however, many of them are based on simulations, standardized cycles, or vehicle-specific control strategies. Therefore, further experimental evidence is still needed to quantify how road gradient and driving mode jointly affect EV traction energy demand, regenerated energy, and net energy balance under high-altitude real-world conditions.
Despite these advances, the acquisition of high-quality experimental data remains a major challenge because professional measurement systems are often costly and operationally complex. Recent studies have explored the use of low-cost data acquisition approaches as practical alternatives for monitoring vehicle performance and estimating energy consumption under real operating conditions [
15,
16]. Such methodologies are especially valuable in applications where field portability, safety, and implementation simplicity are required, including route-based studies and urban electromobility analysis [
17]. Nevertheless, the applicability of affordable instrumentation for route-level EV energy assessment in high-altitude and high-gradient environments still requires further examination, particularly when the objective is to capture representative power trends, regenerative braking events, and cumulative energy indicators under real-world operation.
In this context, the present study proposes an experimental framework for the energy-based assessment of a battery electric sport utility vehicle under real-world driving conditions in Ambato, Ecuador, at approximately 2500 m above sea level. A low-cost instrumentation setup composed of a Global Navigation Satellite System (GNSS), a Fluke 393 FC high-voltage clamp meter, and an On-Board Diagnostics (OBD-II) interface was used to acquire vehicle speed, altitude, battery current, voltage, and time-series data. The experimental design considers controlled acceleration and deceleration tests under three road-gradient conditions: zero gradient, positive gradient, and negative gradient. In addition, Normal and Sport driving modes are compared to evaluate their influence on traction power demand, regenerative braking behavior, net energy consumption, and segment-level energy recovery ratio.
The main contribution of this work is the experimental quantification of how road gradient and driving mode affect EV energy behavior under high-altitude real-world conditions using low-cost instrumentation. Unlike studies focused primarily on standardized laboratory cycles, simulation-based control strategies, or flat-road energy estimation, this work provides a practical field-oriented methodology for identifying energy consumption and regenerative braking trends in topographically complex urban environments. The proposed approach supports route-level energy assessment, real-world EV characterization, and the development of accessible experimental procedures for regions where laboratory-grade instrumentation is not always available.
2. Proposed Experimental Methodology
This study adopts a structured field-based methodological framework to evaluate the energy performance of a battery electric vehicle under high-altitude and high-gradient real-world driving conditions. The proposed methodology focuses on the use of low-cost instrumentation to quantify how road gradient and driving mode influence traction power demand, regenerative braking behavior, and route-level energy balance.
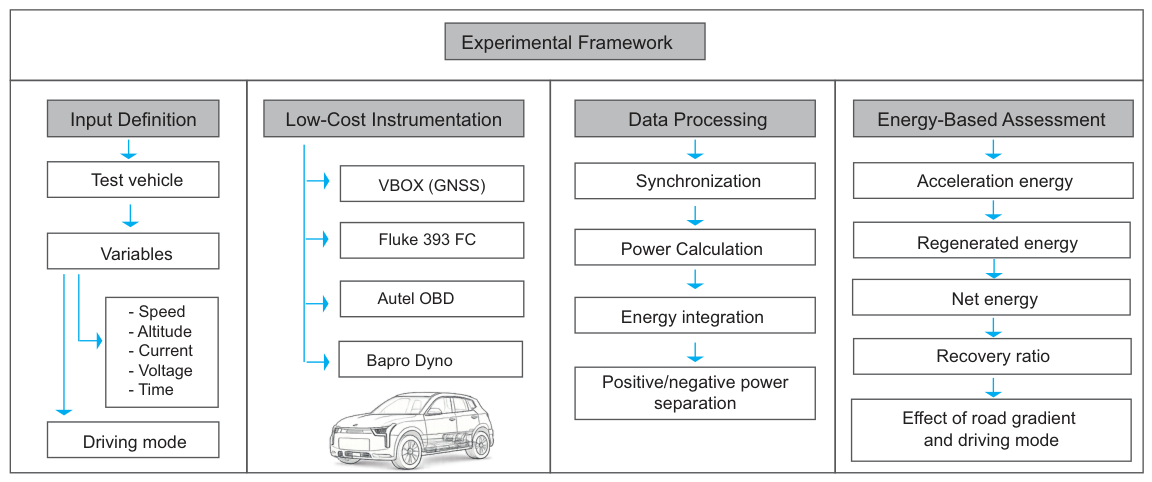
As illustrated in
Figure 1, the experimental workflow was organized into five sequential stages: input definition, low-cost data acquisition, gradient-based driving tests, data processing, and energy-based assessment. The input definition stage included the selection of the test vehicle, the characterization of the study location, and the identification of the main variables required for the analysis, including vehicle speed, altitude, battery current, voltage, time, road-gradient condition, and driving mode. The real-world tests were conducted in Ambato, Ecuador, at approximately 2500 m above sea level, using a battery electric sport utility vehicle as the experimental platform.
The data acquisition stage was based on a portable low-cost instrumentation setup composed of a Global Navigation Satellite System (GNSS), a Fluke 393 FC high-voltage clamp meter, and an On-Board Diagnostics (OBD-II) interface. The GNSS system was used to record vehicle speed, position, acceleration, and altitude, while the clamp meter measured the direct-current flow from the high-voltage battery system. The OBD-II interface provided complementary battery-related information, including voltage and state of charge. This configuration enabled the estimation of instantaneous electrical power and allowed the identification of both traction and regenerative braking intervals during real-world operation.
The experimental testing stage was designed to isolate the effect of road gradient and driving mode on the energetic response of the vehicle. For this purpose, controlled acceleration and deceleration tests were performed under three gradient conditions: zero gradient, positive gradient, and negative gradient. Each condition was evaluated in Normal and Sport driving modes. In addition, an extended high-gradient real-world segment, corresponding to the Paso Lateral route in Ambato, was included to assess the behavior of the vehicle during sustained uphill and downhill operation.
During the data processing stage, the acquired signals were synchronized and organized according to each test condition. Instantaneous electrical power was calculated from the measured voltage and current signals. Positive power values were associated with traction power demand, whereas negative power values were interpreted as regenerative braking power. Energy indicators were then obtained by numerical integration of the power signal over time.
Finally, the energy-based assessment stage included the calculation of acceleration energy, regenerated energy, net energy, and the segment-level regenerative energy recovery ratio. These indicators were used to compare the influence of road gradient and driving mode on the overall energy performance of the vehicle. This framework provides a practical and scalable approach for real-world electric vehicle energy analysis in topographically complex environments using accessible instrumentation.
2.1. Test Vehicle and Study Location
The experimental tests were performed using a battery electric sport utility vehicle commercialized in Ecuador [
18]. This vehicle was selected because it represents a typical urban and interurban electric SUV operating in a high-altitude Andean environment. The tests were conducted in Ambato, Ecuador, at an approximate altitude of 2500 m above sea level, where the road network includes frequent slope variations, steep urban gradients, and sustained uphill and downhill segments.
The study location is relevant because high-altitude Andean cities impose operating conditions that differ from flat urban environments. In these scenarios, the gravitational component associated with road gradient strongly affects the longitudinal force required at the wheels. During uphill driving, the vehicle must overcome the additional resistance caused by the positive gradient, increasing traction power demand. Conversely, during downhill driving, gravitational potential energy can contribute to vehicle motion and increase the opportunity for regenerative braking. Therefore, Ambato provides a suitable real-world environment to evaluate the combined influence of altitude, road gradient, and driving mode on electric vehicle energy performance. The main technical specifications of the test vehicle are summarized in
Table 1, based on the technical information available for the version commercialized in Ecuador/Latin America [
18].
2.2. Low-Cost Instrumentation Setup
A low-cost and portable instrumentation setup was implemented to acquire the main kinematic and electrical variables during the real-world tests. The selected equipment was chosen considering portability, electrical safety, ease of installation, and suitability for route-level energy assessment in a high-voltage electric vehicle.
The instrumentation setup included three main devices: a VBOX Performance Box Touch, a Fluke 393 FC high-voltage clamp meter, and an Autel EV diagnostic scanner. The VBOX system was used to record vehicle speed, position, acceleration, distance, and altitude. The Fluke 393 FC clamp meter was used to measure the direct-current flow associated with the high-voltage traction system. The Autel EV scanner was connected through the OBD-II interface to monitor battery-related variables, including voltage, state of charge, and temperature. The combination of these measurements enabled the estimation of instantaneous electrical power and the identification of traction and regenerative braking intervals. The technical specifications, along with the manufacturer and geographic origin of the instrumentation used in this study, are summarized in
Table 2.
The main characteristics and functions of the instrumentation systems are summarized in
Table 3.
During the tests, the Fluke 393 FC was connected to the high-voltage current path between the battery system and the traction inverter, allowing current measurements without interrupting the electrical circuit. The OBD-II interface provided complementary voltage and battery information, while the GNSS system provided the time-based kinematic and altitude data required to classify each test according to its road-gradient condition. The acquired signals were later synchronized for power and energy calculation.
Since the proposed methodology relies on portable field instrumentation, the main sources of measurement uncertainty were identified to contextualize the reliability of the energy indicators obtained in this study. These uncertainty sources are not intended to represent a full metrological calibration of the measurement chain, but rather to describe the main factors that may affect route-level power and energy estimation under real-world conditions. As summarized in
Table 4, the most relevant sources are associated with GNSS-based speed and altitude acquisition, the logging rate of the Fluke current measurement, the sampling frequency of OBD-II voltage data, and the influence of driver input during acceleration and deceleration events. To reduce these effects, the same road sections were repeatedly tested, the signals were synchronized during post-processing, and the final indicators were interpreted at segment level through energy integration rather than instantaneous high-frequency analysis.
2.3. Gradient-Based Real-World Experimental Design
The experimental design was structured to evaluate the influence of road gradient and driving mode on the energetic response of the vehicle under real-world operating conditions. Previous studies have shown that road gradient is one of the most relevant route-related factors affecting EV energy consumption, since uphill segments increase traction demand whereas downhill segments modify the available regenerative braking potential [
8,
19]. In addition, real-world EV energy consumption is affected by route characteristics, traffic conditions, driver behavior, vehicle weight, and regenerative braking calibration [
20]. Therefore, controlled acceleration and deceleration tests were performed under three representative road-gradient conditions: zero gradient, positive gradient, and negative gradient. Each condition was evaluated in both Normal and Sport driving modes. In addition, the Paso Lateral segment of Ambato was included as an extended real-world scenario to analyze sustained uphill and downhill operation.
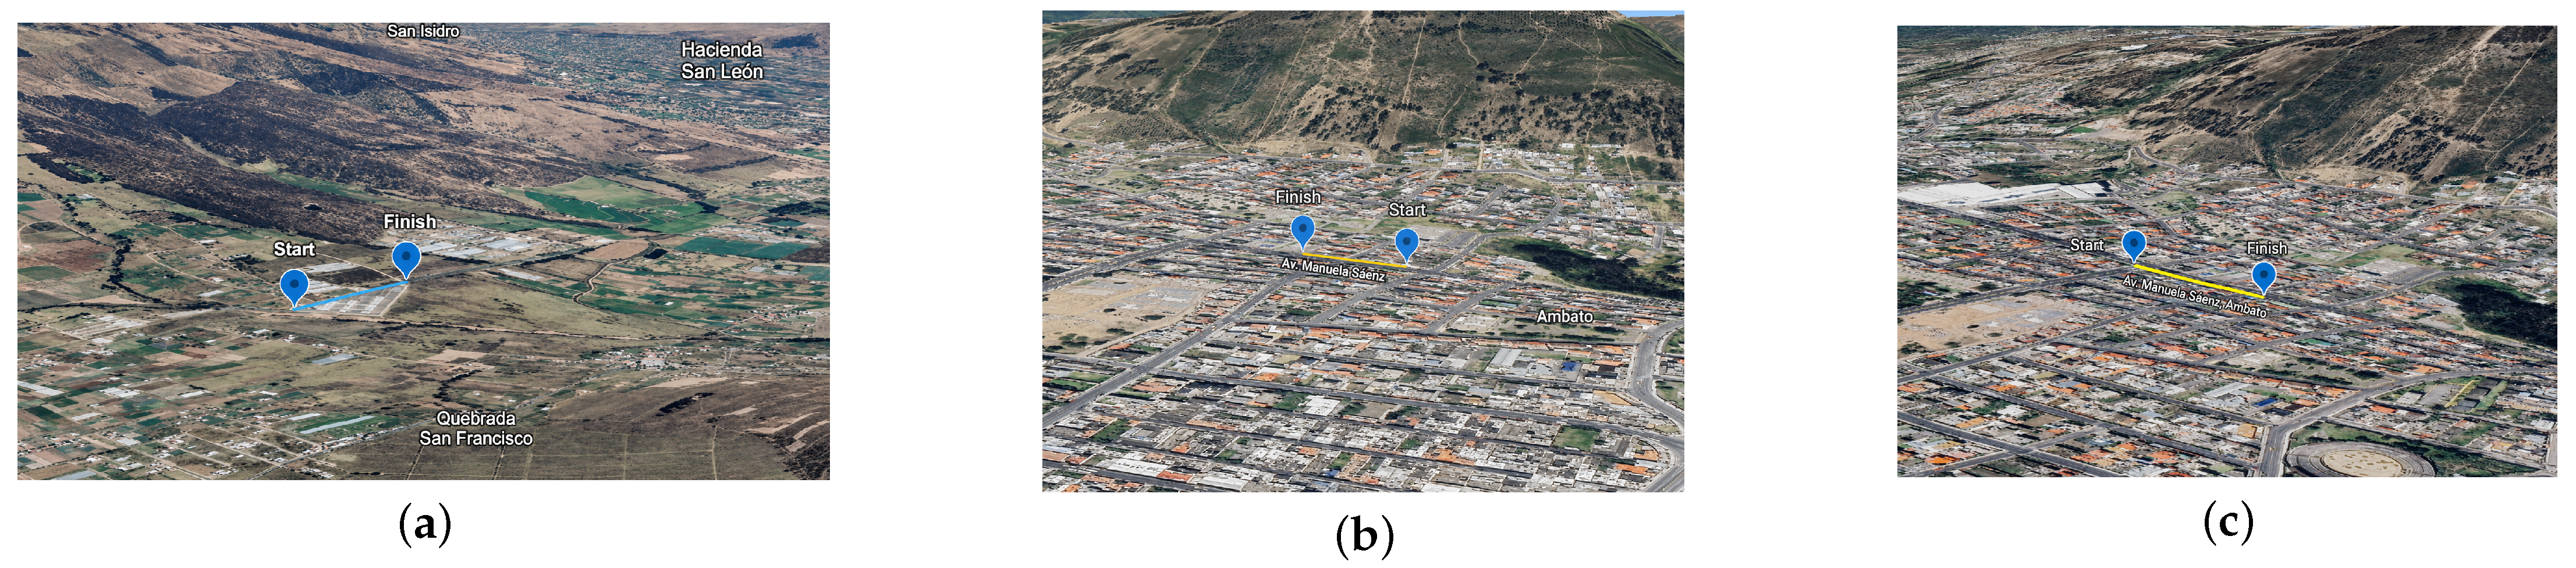
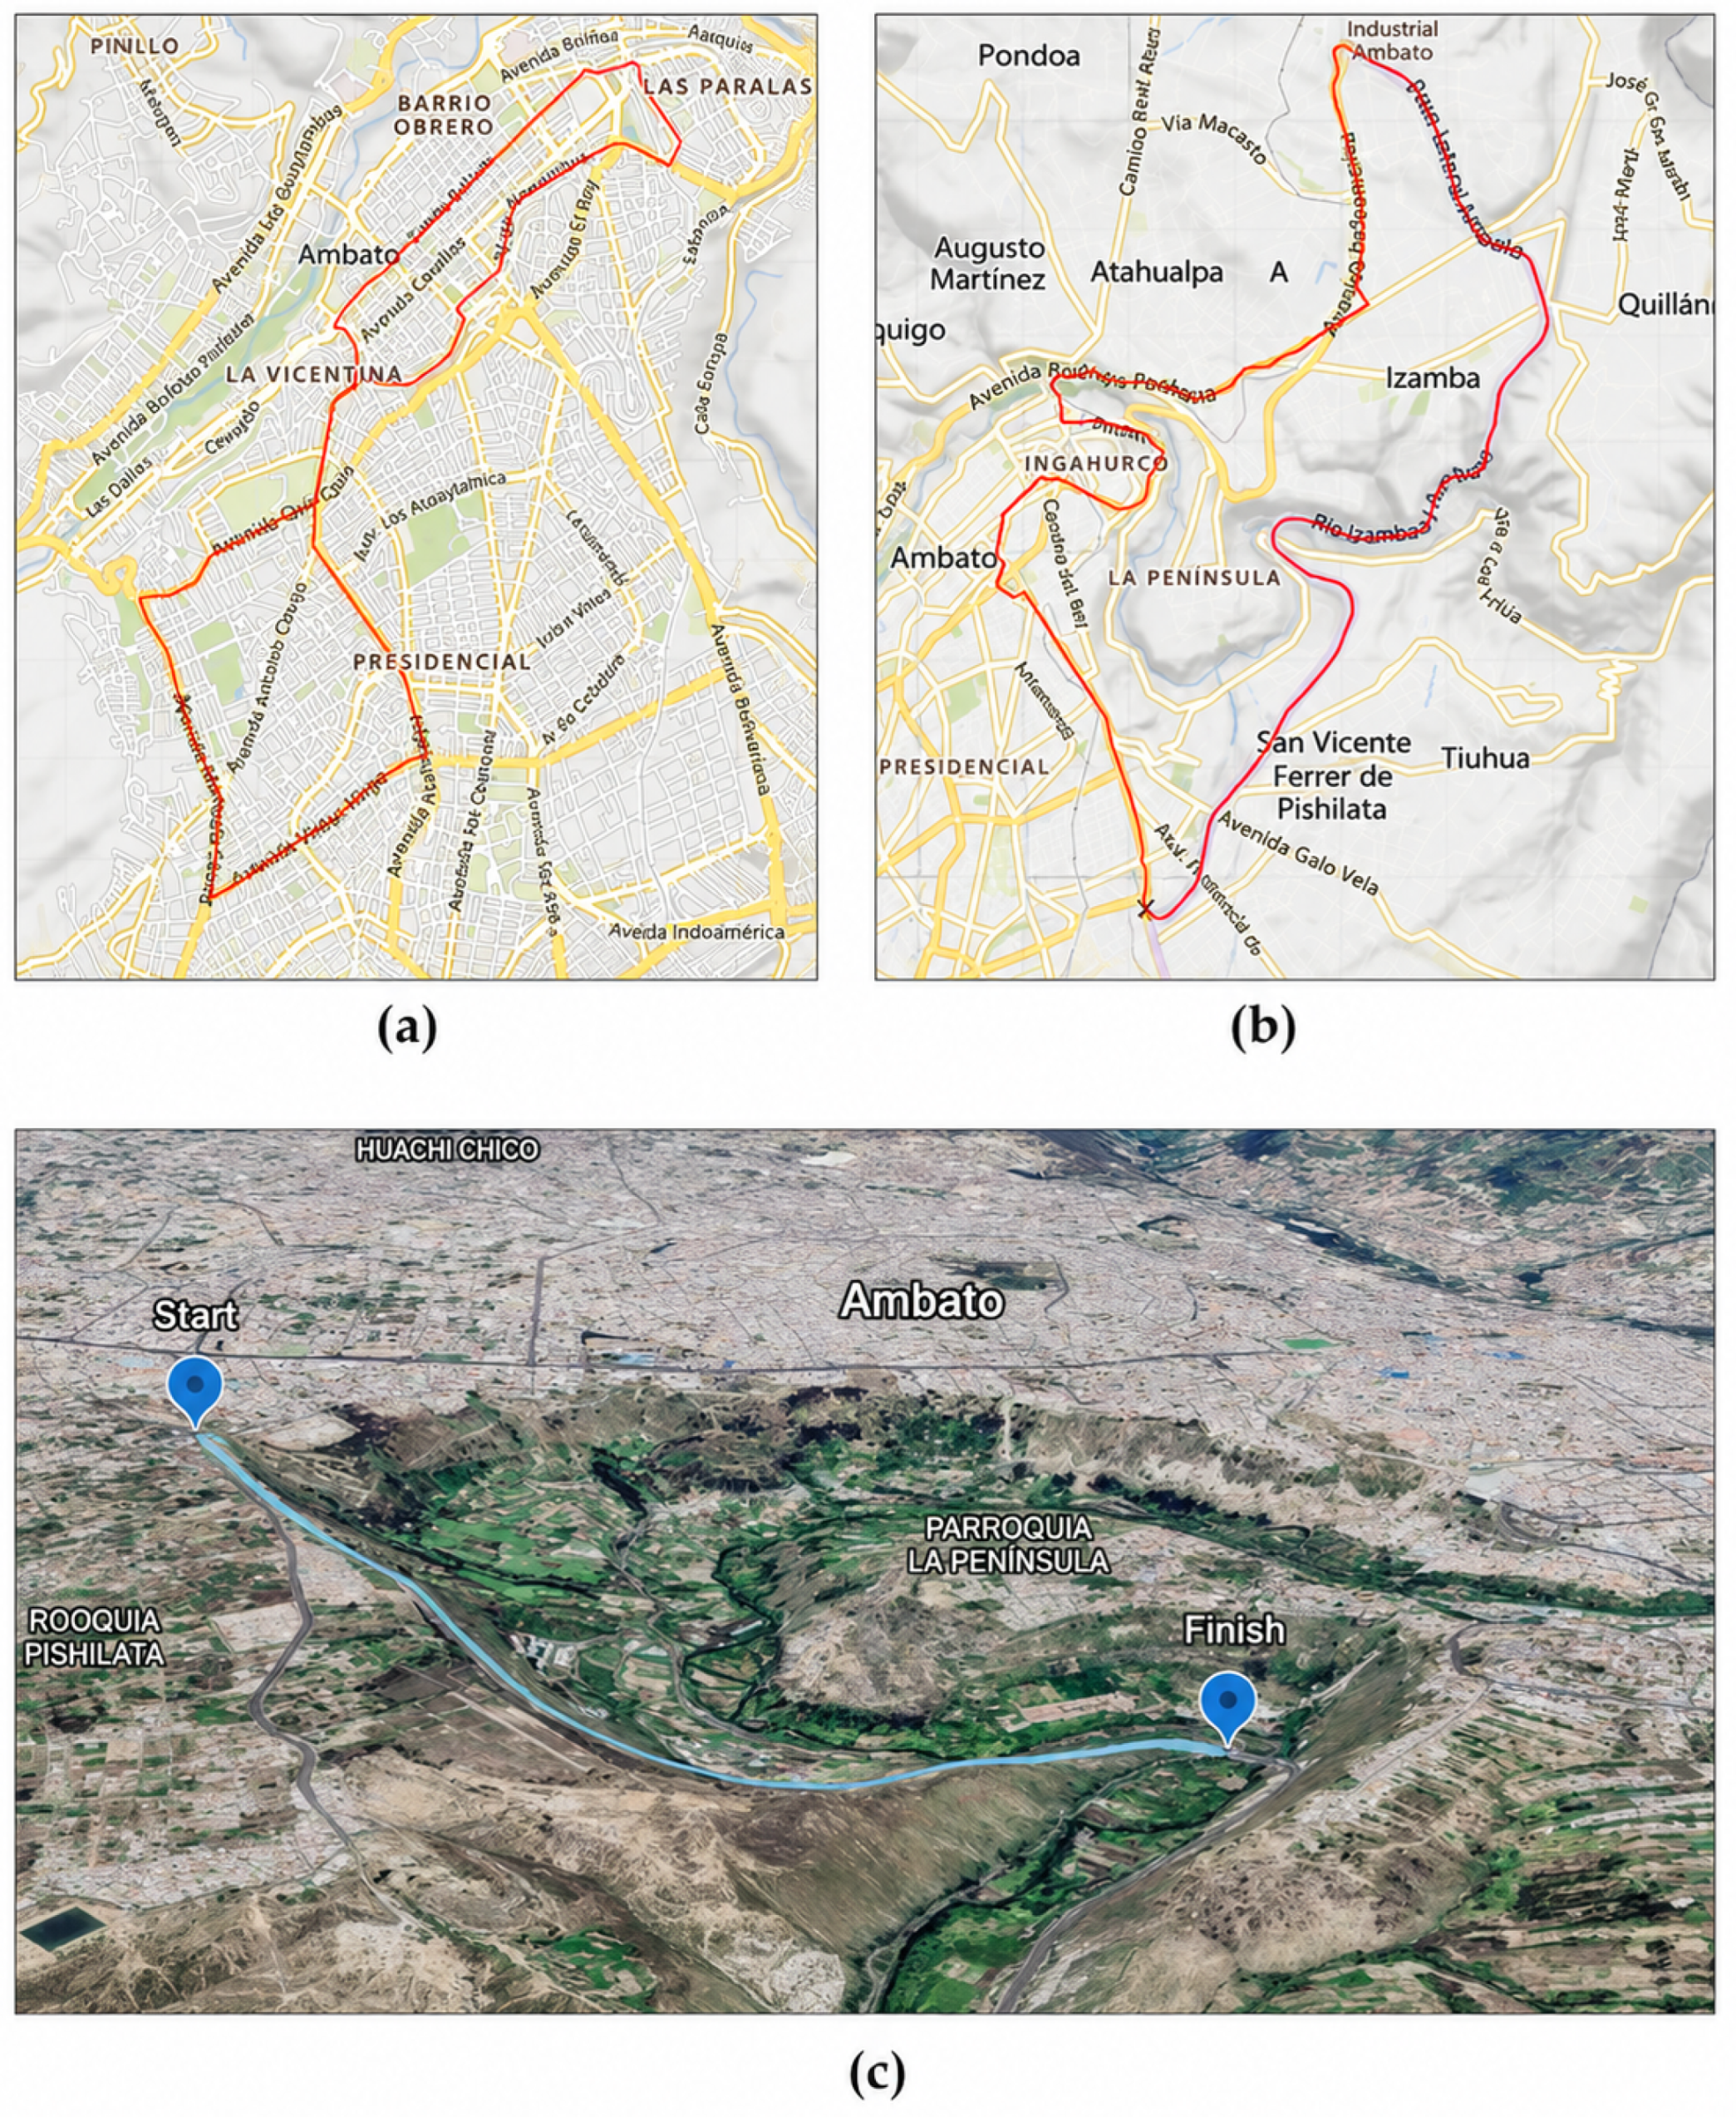
The zero-gradient tests were performed on an approximately 400 m segment located in the San Isidro area of Ambato, as shown in
Figure 2a. Although finding a completely flat segment in this Andean urban environment is difficult, this road section presented the most stable altitude profile among the available test locations and was considered representative of near-zero gradient operation.
The positive-gradient and negative-gradient tests were performed on a segment of Av. Manuela Sáenz in Ambato, as shown in
Figure 2. The selected road section had an approximate length of 70.22 m. In the uphill direction, corresponding to
Figure 2b, the segment presented an altitude increase of approximately 6.2 m, which produced a gradient close to 10%. In the downhill direction, corresponding to
Figure 2c, the same road section produced a negative gradient of approximately 13%, making it suitable for evaluating regenerative braking under a short but pronounced descent.
The extended high-gradient scenario was evaluated on the Paso Lateral segment of Ambato. This road section has an approximate length of 3.4 km and an altitude variation of 258 m, increasing from approximately 2373 m to 2631 m during the ascent. The segment presents an average gradient of approximately 4.1% and a maximum gradient of up to 20.9%, representing a demanding real-world operating condition for the electric powertrain. The reverse direction of this segment was used to evaluate energy recovery during sustained downhill operation.
The gradient-based experimental design was therefore defined to compare vehicle behavior under baseline, uphill, downhill, and sustained-gradient conditions. The zero-gradient condition was used as a reference to evaluate the vehicle response without a dominant slope effect. The positive-gradient condition was used to quantify the increase in traction energy demand during uphill operation, while the negative-gradient condition was used to evaluate the regenerative braking response during downhill operation. The use of repeated tests under the same road section, driving mode, initial condition, and target speed was intended to improve the repeatability of the measured power profiles and to reduce the influence of driver-related variability on the final mean energy indicators.
Table 5 summarizes the experimental design considered in this study.
For the short controlled segments, five repetitions were performed for each combination of gradient condition and driving mode. The vehicle started from rest and accelerated up to approximately 40 km/h. After the acceleration phase, the driver released the accelerator pedal to allow the analysis of deceleration and regenerative braking behavior. Although driver input cannot be completely eliminated in real-world testing, the tests were conducted under controlled and repeatable conditions, maintaining the same road section, similar initial conditions, and the same target speed.
In addition to the controlled short-segment tests, route-level real-world evaluations were performed to characterize the vehicle energy response under representative urban and mixed driving conditions in Ambato. Route-level EV energy assessment commonly relies on the combined analysis of speed profiles, elevation information, vehicle operating data, and driver-related effects to estimate cumulative energy consumption under real operating conditions [
21,
22]. Therefore, these routes were included to complement the gradient-based tests with longer driving scenarios involving variable traffic conditions, altitude changes, acceleration events, and braking opportunities. The urban route represents a low-to-moderate speed scenario with frequent stop-and-go operation, while the mixed route combines urban and extra-urban driving with higher speed variations and more pronounced elevation changes. The Paso Lateral segment was retained as a high-gradient reference route for sustained ascent and descent analysis. The geographical configuration of these routes is shown in
Figure 3.
2.4. Data Processing and Energy Metrics
The acquired signals were synchronized and processed in order to calculate instantaneous electrical power and energy-related indicators. The use of time-series vehicle data, route information, and onboard energy-related measurements has been widely applied in real-world EV energy studies to characterize the influence of terrain, driving behavior, and route conditions on cumulative energy consumption [
21,
22]. In the present study, the electrical power was obtained from the measured voltage and current as:
where
is the instantaneous electrical power,
is the battery voltage, and
is the measured current. In this study, positive power values were associated with traction energy demand during acceleration, while negative power values were associated with regenerative braking during deceleration or downhill operation. The acceleration energy was calculated by integrating the positive part of the power signal:
Similarly, the regenerated energy was obtained by integrating the negative part of the power signal:
In this convention,
is reported as a negative value because it represents energy flowing back into the battery system. The net energy was then calculated as:
Finally, the segment-level regenerative energy recovery ratio was defined as:
This indicator compares the amount of regenerated energy with respect to the traction energy consumed over the same test segment. Therefore, it should be interpreted as a segment-level energy recovery ratio rather than as a thermodynamic efficiency of the drivetrain. Values greater than 100% may occur in downhill segments when the recovered energy includes a significant contribution from gravitational potential energy. This interpretation is consistent with studies showing that road gradient affects both energy consumption and regenerative behavior, particularly because downhill operation can increase braking opportunities and energy recovery while uphill operation increases the required traction energy [
8,
19].
For each test condition, the energy indicators were first calculated for each repetition and then averaged to obtain representative values. The standard deviation was calculated during post-processing to evaluate repeatability, although the main results are reported as mean values for clarity.
The integration-based approach was selected because the objective of this study is to evaluate cumulative route-level and segment-level energy behavior rather than high-frequency electrical transients. For this reason, the analysis focuses on the time integral of the measured power signal, which is more representative of the total energy exchanged between the battery and the traction system over each test condition. This approach is consistent with energy-based vehicle assessment, where cumulative energy consumption and recovered energy are the main indicators used to compare operating conditions. In addition, this approach is suitable for field-based data acquisition because route-level energy studies commonly rely on speed, elevation, and onboard vehicle data to estimate the energy required for a specific route or driving segment [
21,
22].
2.5. Complementary Laboratory Reference Dataset
In addition to the real-world gradient-based tests, a complementary laboratory dataset obtained from a second electric vehicle under standardized NEDC and WLTC-2 cycles was retained only as a contextual reference. These tests were performed using a high-resolution Dewesoft Sirius data acquisition system under controlled dynamometer conditions. However, this dataset was not used as a direct validation of the low-cost instrumentation because the measurements were not performed simultaneously on the same vehicle. Therefore, the laboratory results are interpreted only as an indirect comparison to support the discussion of general energy-consumption trends under standardized conditions, while the main contribution of this study remains the real-world high-altitude and high-gradient assessment performed with the low-cost instrumentation setup.
2.6. Justification and Limitations of Low-Cost Instrumentation
Rigorous evaluation of electric vehicle performance under real-world topographical conditions requires the continuous and reliable capture of voltage and current data. Traditionally, the characterization of electric motors, inverters, and battery packs is performed using benchtop power analyzers or high-frequency data acquisition systems. Although these high-end instruments provide high precision and very high sampling rates, their elevated cost, installation complexity, and reduced portability can limit their applicability for repeated on-road testing.
To address these limitations, this study used a low-cost instrumentation strategy based mainly on the Fluke 393 FC high-voltage clamp meter, complemented by GNSS-based kinematic measurements and OBD-II battery data. This configuration provides a practical balance between safety, portability, and implementation simplicity. In particular, the Fluke 393 FC is suitable for high-voltage DC measurements up to 1500 V and enables current monitoring without intrusive modifications to the traction system.
The experimental protocol was also contextualized with reference to recognized vehicle-testing practices. Standardized procedures from the Society of Automotive Engineers (SAE), such as SAE J1634 [
23], provide a reference framework for battery electric vehicle energy-consumption and range assessment, while the Worldwide Harmonized Light Vehicles Test Procedure/Worldwide Harmonized Light Vehicles Test Cycle (WLTP/WLTC), defined within the United Nations Economic Commission for Europe (UNECE) Global Technical Regulation (GTR) No. 15 [
24] and UN Regulation No. 154 [
25], establishes standardized speed profiles for light-duty vehicle testing. In addition, SAE J2951 [
26] provides criteria for evaluating the conformity between target and actual drive speeds during chassis-dynamometer and on-road testing using standard drive schedules. Although the present work does not claim full regulatory certification under these procedures, these standards support the methodological rationale for using repeatable speed targets, controlled acceleration/deceleration events, and energy-based indicators. Furthermore, road-load and rolling-resistance considerations are consistent with practices such as SAE J1263/SAE J2263 [
27,
28] and International Organization for Standardization (ISO) 28580 [
29], which provide reference procedures for road-load characterization and tyre rolling-resistance measurement. Therefore, the proposed protocol should be interpreted as a field-based experimental assessment inspired by recognized vehicle-testing practices, rather than as a formal certification or homologation procedure.
In addition, the proposed low-cost setup is aligned with recent real-world EV assessment approaches that use onboard diagnostics, vehicle telemetry, GNSS/GPS information, and route-level variables to characterize energy consumption outside laboratory conditions [
21,
22]. These studies show that real-world energy assessment can benefit from non-intrusive onboard data acquisition and route-based information, particularly when the objective is to understand cumulative energy behavior under actual operating conditions rather than to reproduce a full laboratory-grade electrical characterization.
To contextualize the economic and technical viability of this selection,
Table 6 presents a comparison between standard high-end power analyzers used in EV research and the selected portable equipment.
The selected Fluke 393 FC has an estimated cost of approximately USD 800, which is substantially lower than laboratory-grade alternatives. This represents a reduction of approximately 77% compared with the Chroma 66205 and more than 95% compared with systems above USD 16,000, such as the Keysight PA2203A, Dewesoft SIRIUS XHS, Hioki PW8001, and Yokogawa WT5000.
As observed in
Table 6, high-end systems provide sampling rates in the kilo-samples or mega-samples per second range and are therefore suitable for laboratory-based analysis of fast electrical transients, inverter switching behavior, and harmonic content. However, the main objective of this work is not the high-frequency characterization of the traction inverter, but the estimation of route-level energy consumption and regenerative recovery. These quantities are mainly governed by vehicle-level dynamics such as acceleration, deceleration, rolling resistance, aerodynamic drag, and road gradient, which evolve at much lower frequencies. This distinction is consistent with real-world EV energy studies in which route characteristics, speed profiles, elevation changes, and onboard measurements are used to evaluate cumulative energy consumption and recovery trends [
19,
20,
21,
22].
Consequently, although the 3 S/s logging rate of the Fluke 393 FC is significantly lower than that of laboratory-grade systems, it is adequate for the cumulative energy-balance approach adopted in this study. Since the energy indicators are obtained by integrating power over time, the selected instrumentation is suitable for capturing representative route-level trends in traction demand and regenerative braking.
Nevertheless, the proposed low-cost setup presents important limitations. First, short-duration high-frequency transients may not be fully captured due to the limited logging rate of the clamp meter. Second, the voltage data obtained through the OBD-II interface may present a lower sampling frequency than the current and kinematic signals, requiring synchronization during post-processing. Third, the driver input cannot be completely eliminated under real-world conditions, although the tests were repeated under the same route and target-speed conditions to reduce variability. Finally, the complementary laboratory dataset was not acquired simultaneously on the same vehicle; therefore, it is interpreted only as a contextual reference and not as a direct validation of the low-cost instrumentation.
Despite these limitations, the proposed instrumentation setup is suitable for practical real-world EV energy assessment when the main objective is to identify route-level consumption trends, regenerative braking behavior, and the influence of road gradient under topographically complex operating conditions. Therefore, the value of the proposed setup lies in its ability to provide a portable and accessible measurement strategy for cumulative energy analysis, especially in high-altitude and high-gradient environments where standardized laboratory cycles may not fully reproduce the energetic behavior observed during real driving.
3. Results
3.1. Power Profiles Under Road-Gradient Conditions and Driving Modes
The real-world energy performance of the battery electric SUV was first evaluated through controlled acceleration and deceleration tests under three road-gradient conditions: zero gradient, positive gradient, and negative gradient. Each condition was tested in Normal and Sport driving modes.
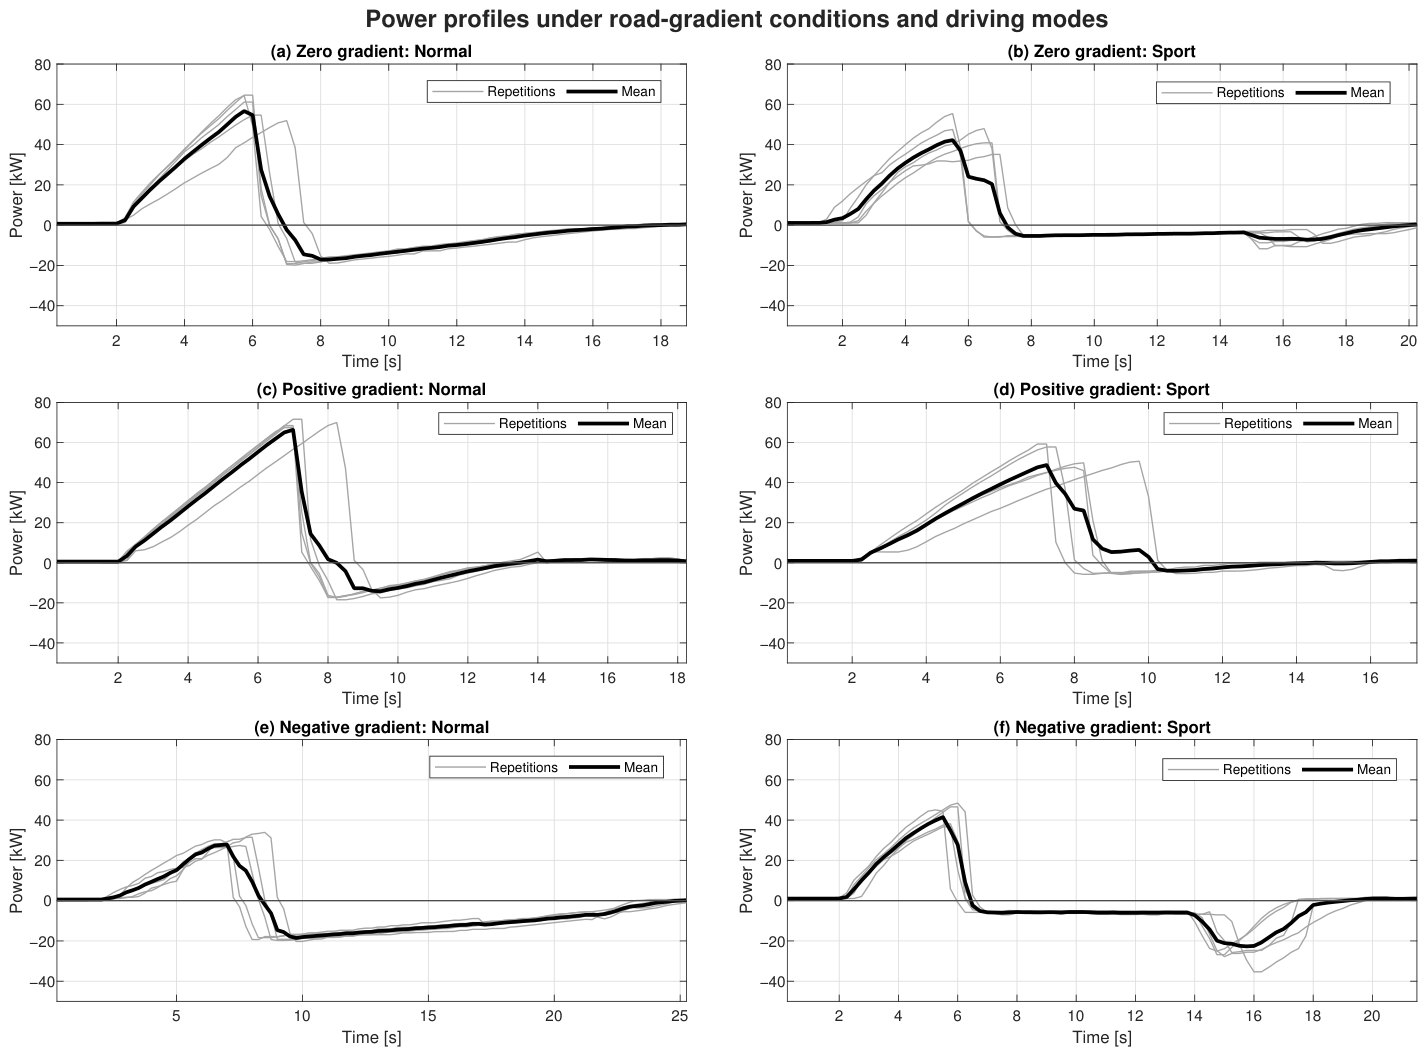
Figure 4 presents the resulting power profiles, where gray lines correspond to the individual repetitions and the black line represents the mean power profile for each condition.
As shown in
Figure 4, the zero-gradient condition provides the baseline response of the vehicle without a dominant slope effect. In this condition, both driving modes exhibit a clear traction phase followed by a regenerative phase. However, the Normal mode shows a higher regenerative response after acceleration, while the Sport mode presents a shorter and less intense regenerative interval. This behavior suggests that the Sport mode prioritizes a more direct dynamic response, whereas the Normal mode allows a more pronounced energy recovery during deceleration.
Under positive-gradient conditions, the traction power demand increases because the gravitational component acts against vehicle motion. This effect is especially visible in the Normal mode, where the mean power profile reaches higher traction levels than under zero-gradient conditions. In the Sport mode, the acceleration phase is also affected by the uphill condition, but the regenerative phase is strongly reduced. This indicates that, during uphill operation, the vehicle control strategy in Sport mode prioritizes propulsion response over regenerative recovery.
Under negative-gradient conditions, the power profiles show the opposite behavior. The downhill segment favors regenerative braking, and the mean power profile presents a stronger negative-power region, particularly in Normal mode. This confirms that the vehicle can recover a significant amount of energy when gravitational potential energy contributes to vehicle motion during descent. In Sport mode, the regenerative response is lower and the net balance is closer to zero, showing that the selected driving mode has a clear influence on the amount of energy recovered in downhill operation.
3.2. Energy Balance Under Gradient-Based Tests
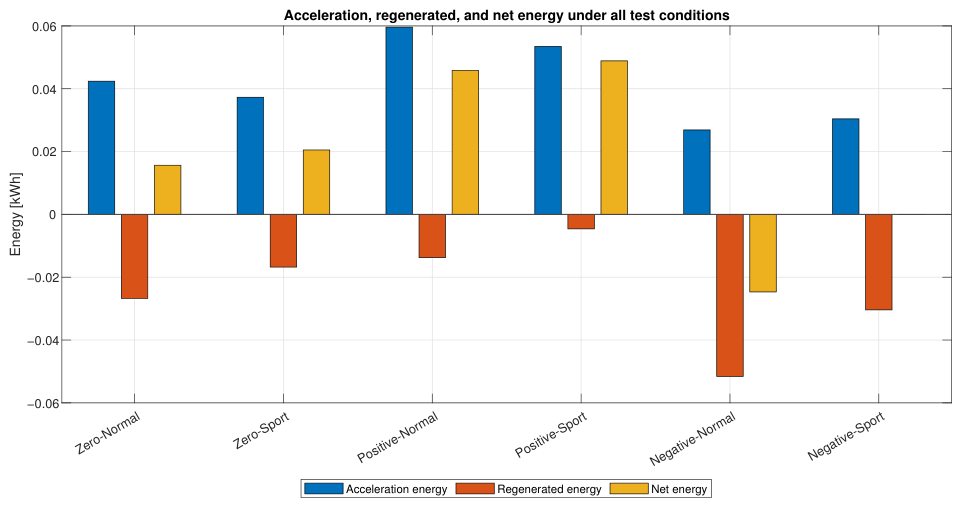
The energy indicators obtained from the power profiles are summarized in
Table 7 and
Figure 5. The results include acceleration energy, regenerated energy, and net energy for each combination of road-gradient condition and driving mode. In this analysis, regenerated energy is reported as a negative value because it represents energy flowing back into the battery system.
The results show that road gradient has a direct influence on the energy balance of the vehicle. Under zero-gradient conditions, the Normal mode required 0.0454 kWh during the acceleration phase and recovered kWh during deceleration, resulting in a net energy demand of 0.0195 kWh. In comparison, the Sport mode required 0.0351 kWh and recovered kWh, resulting in a similar net energy value of 0.0185 kWh. Although both modes show comparable net energy under near-flat conditions, the Normal mode recovered more energy during deceleration.
Under positive-gradient conditions, the acceleration energy increased in both driving modes. In Normal mode, the acceleration energy reached 0.0658 kWh, while in Sport mode it reached 0.0535 kWh. However, the most relevant difference appears in the regenerated energy. The Normal mode recovered kWh, whereas the Sport mode recovered only kWh. As a result, the Sport mode presented the highest net energy demand among the controlled tests, with 0.0487 kWh. This confirms that uphill operation increases the energetic demand of the vehicle and that the Sport mode substantially reduces the contribution of regenerative braking under positive-gradient conditions.
Under negative-gradient conditions, regenerative braking became dominant. The Normal mode consumed 0.0272 kWh during the positive-power portion of the test but recovered kWh during the regenerative phase, producing a net energy balance of kWh. This means that, over the analyzed downhill segment, the vehicle recovered more energy than it consumed. In contrast, the Sport mode presented a nearly balanced response, with 0.0314 kWh of acceleration energy, kWh of regenerated energy, and a net energy of 0.0011 kWh. These results show that the Normal mode provides a more favorable regenerative response during downhill operation.
3.3. Segment-Level Regenerative Energy Recovery Ratio
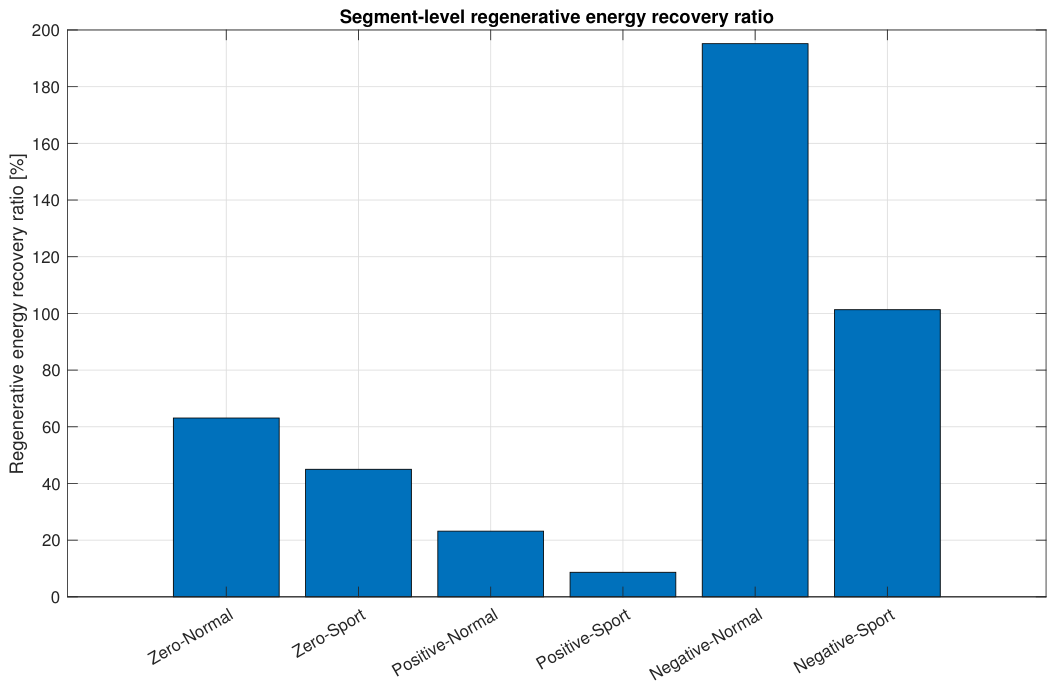
To compare the regenerative behavior across all conditions, the segment-level regenerative energy recovery ratio was calculated as the ratio between the absolute value of regenerated energy and the acceleration energy over the same test segment. The results are shown in
Figure 6.
The zero-gradient condition showed recovery ratios of 57.14% in Normal mode and 47.53% in Sport mode. This confirms that, under near-flat conditions, both modes allow energy recovery during deceleration, but the Normal mode provides a higher regenerative contribution.
Under positive-gradient conditions, the recovery ratio decreased to 44.22% in Normal mode and to only 8.96% in Sport mode. This reduction is associated with the higher traction demand required during uphill acceleration and the lower availability of regenerative braking during the subsequent deceleration phase. The very low recovery ratio observed in Sport mode indicates that this driving mode strongly prioritizes traction response under uphill operation, reducing the amount of energy recovered.
The negative-gradient condition produced the highest regenerative contribution. In Normal mode, the recovery ratio reached 194.38%, while Sport mode reached 99.05%. The value above 100% should not be interpreted as a drivetrain efficiency greater than unity. Instead, it indicates that the vehicle recovered not only part of the kinetic energy associated with deceleration, but also a significant portion of the gravitational potential energy released during downhill motion. Therefore, under this specific road segment, the vehicle behaved as a net energy generator from the perspective of the onboard battery energy balance.
3.4. Route-Level Urban and Mixed Driving Evaluation
In addition to the controlled gradient-based tests, longer real-world routes were evaluated in Ambato to analyze the energy response of the electric SUV under representative urban and mixed driving conditions at approximately 2500 m above sea level.
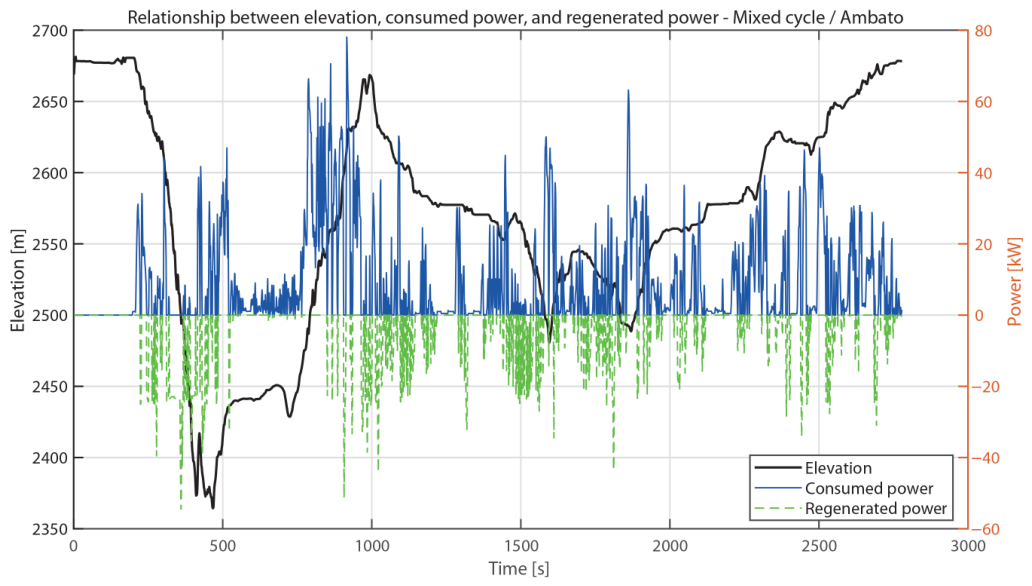
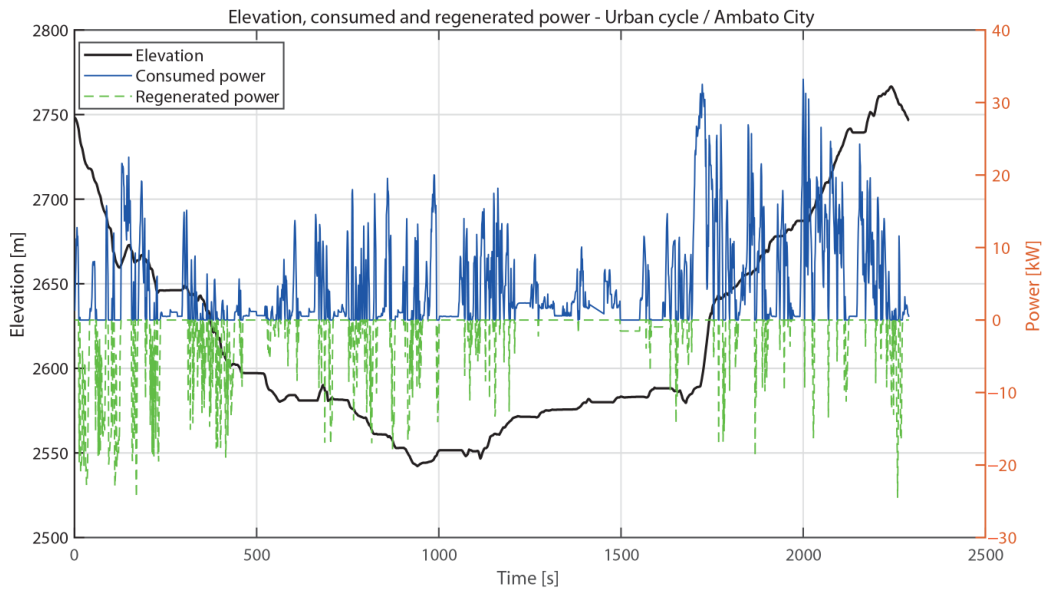
Figure 7 and
Figure 8 show the relationship between elevation profile and instantaneous power for the mixed and urban routes, respectively.
The mixed route shows a clear relationship between elevation variation and power demand. Positive power peaks are mainly associated with ascending sections, where the vehicle must overcome the gravitational component of the road profile. Conversely, negative power values occur predominantly during downhill portions, where the regenerative braking system recovers part of the energy released by the vehicle motion and terrain profile. This behavior is particularly relevant in Ambato because the city combines high altitude with pronounced topographical variation, which directly affects both consumption and regeneration.
The urban route presents a different energetic pattern. Although its elevation changes are less pronounced than those observed in the mixed route, the power signal exhibits more frequent oscillations. These oscillations are associated with repeated acceleration and braking events caused by urban traffic, intersections, and speed variations. Therefore, the urban route demonstrates that regenerative energy recovery is not only influenced by road gradient, but also by the frequency of deceleration events and the transient nature of real-world driving.
The route-level energy balance is summarized in
Table 8. The mixed route consumed 6.845 kWh and regenerated 2.842 kWh, resulting in a net energy demand of 4.004 kWh and a recovery ratio of 41.51%. In comparison, the urban route consumed 2.872 kWh and regenerated 1.144 kWh, producing a net energy demand of 1.728 kWh and a recovery ratio of 39.84%.
Although the mixed route required a higher total energy input due to its longer distance, higher speeds, and greater altitude variation, it also achieved a slightly higher recovery ratio. This result is explained by the presence of extended downhill segments that increased the opportunity for regenerative braking. In contrast, the urban route presented lower total energy consumption but maintained a comparable recovery ratio due to the higher frequency of braking events. These findings confirm that, under high-altitude Andean conditions, energy recovery depends on both topographical variation and driving dynamics.
3.5. Extended Real-World Evaluation: Paso Lateral Segment
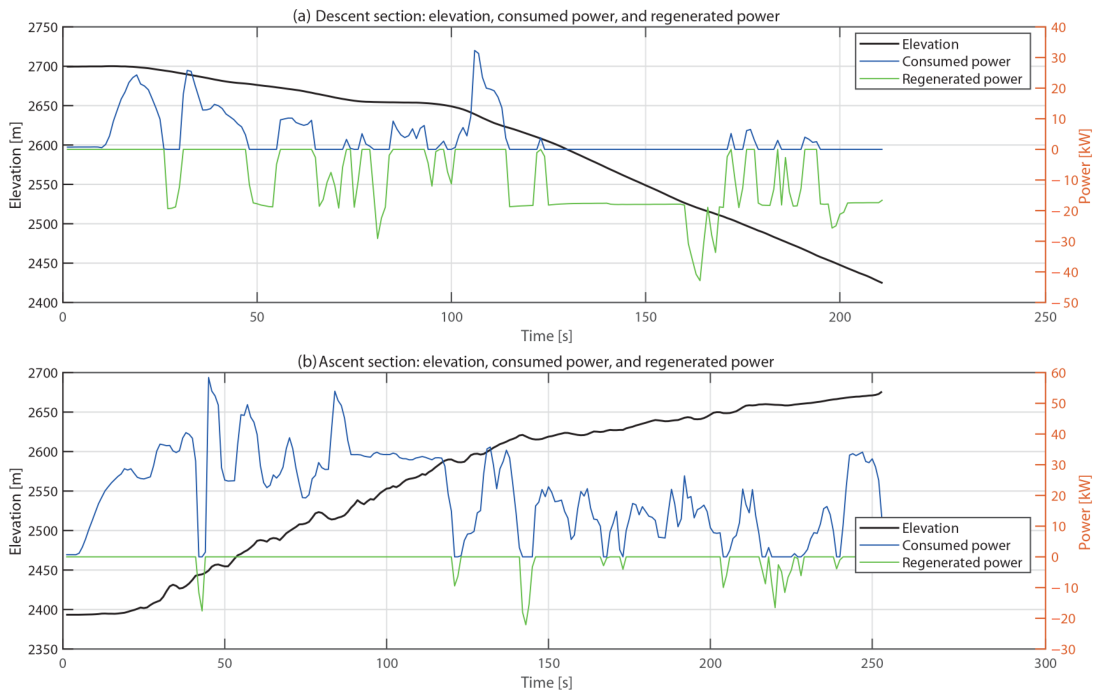
To complement the controlled short-segment tests and the route-level urban/mixed analysis, the effect of sustained road gradients was evaluated using the Paso Lateral segment in Ambato. This route represents a more demanding real-world scenario, with an approximate length of 3.4 km, a total altitude variation of 258 m, and gradients reaching up to 20.9%. The elevation and power behavior during ascent and descent conditions are presented in
Figure 9.
The corresponding energy distribution is summarized in
Table 9.
Figure 9 shows two clearly different operating regimes. During ascent, positive power values dominate, indicating sustained traction power demand. This condition produced 1.460 kWh of consumed energy and only 0.058 kWh of recovered energy, resulting in a net energy consumption of 1.402 kWh and a recovery ratio of 3.95%. These results confirm that sustained uphill driving represents one of the most energy-demanding conditions for an electric vehicle operating in high-altitude Andean environments.
During descent, the opposite behavior was observed. The vehicle consumed only 0.245 kWh but regenerated 0.569 kWh, resulting in a net energy balance of kWh and a recovery ratio of 232.10%. This result is physically consistent because the additional recovered energy comes from the conversion of gravitational potential energy during the downhill segment. Therefore, the Paso Lateral results reinforce the findings obtained in the controlled negative-gradient tests and confirm the strong influence of road gradient on real-world EV energy performance.
3.6. Complementary Standardized-Cycle Reference
A complementary laboratory dataset obtained from a second electric vehicle under standardized NEDC and WLTC-2 cycles was retained only as a contextual reference. These tests were not used as a direct validation of the low-cost instrumentation because the measurements were not performed simultaneously on the same vehicle. Therefore, the results summarized in
Table 10 are interpreted only as an indirect reference to support the discussion of general energy-consumption trends under standardized conditions.
The laboratory dataset shows that standardized driving cycles provide useful reference values for energy consumption and power demand under controlled conditions. However, these results should be interpreted with caution because the vehicles, instrumentation systems, and test environments were different. In this study, the main experimental contribution is therefore not the direct comparison between vehicles, but the real-world characterization of the electric SUV under high-altitude and high-gradient operating conditions using low-cost instrumentation.
4. Discussion
The results obtained in this study demonstrate that road gradient and driving mode have a direct influence on the energy performance of the evaluated electric SUV under high-altitude real-world driving conditions. Unlike standardized laboratory cycles, which are typically performed under controlled and repeatable conditions, the tests conducted in Ambato capture the combined effect of altitude, local topography, transient driver demand, and regenerative braking response. This is particularly relevant for Andean urban environments, where steep road segments and frequent elevation changes can substantially modify the expected energy consumption and recovery behavior of electric vehicles.
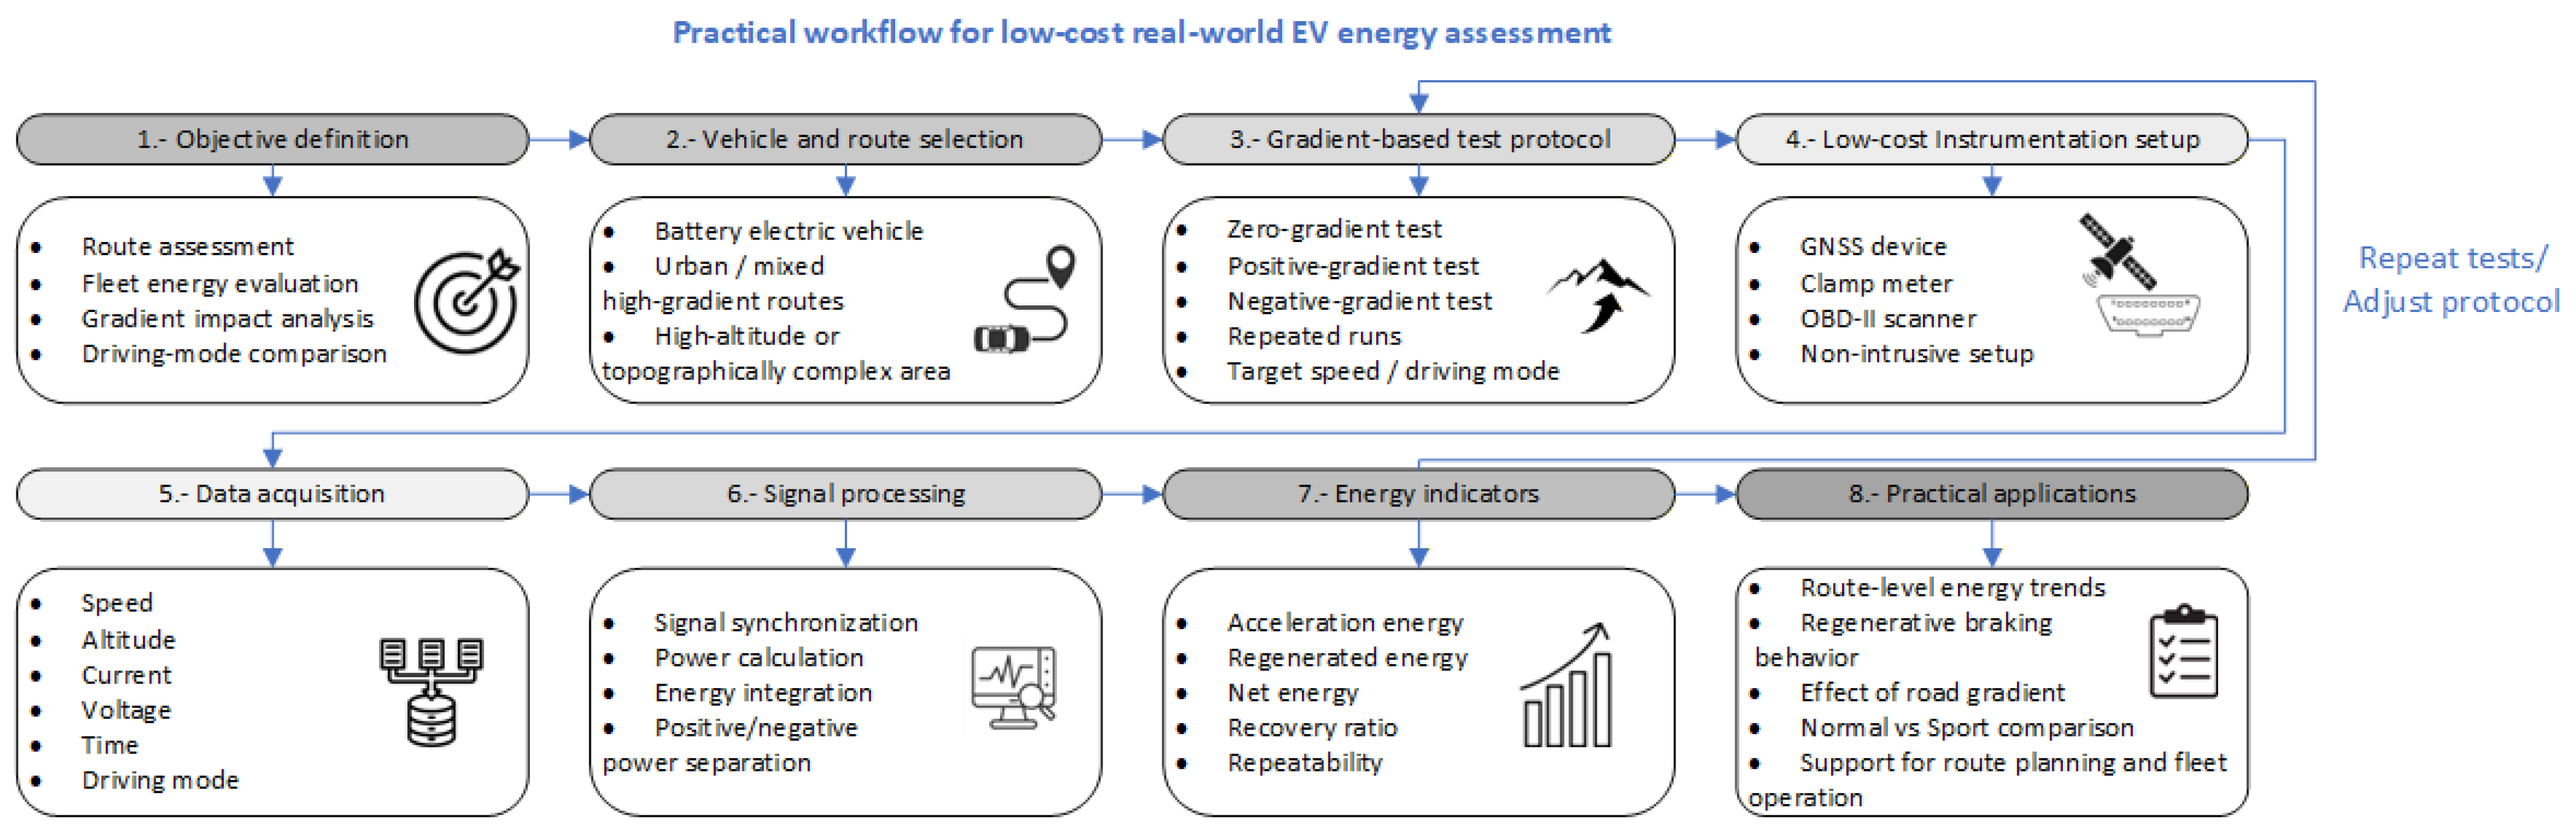
To facilitate the practical application and replication of the proposed approach,
Figure 10 summarizes the workflow for applying the low-cost methodology to real-world EV energy assessment. The process begins with the definition of the evaluation objective, such as route assessment, fleet energy evaluation, gradient-impact analysis, or driving-mode comparison. It then considers vehicle and route selection, the definition of gradient-based tests, low-cost instrumentation setup, data acquisition, signal processing, and the calculation of energy indicators. The final outputs can support route-level energy trend identification, regenerative braking analysis, road-gradient evaluation, Normal versus Sport mode comparison, and preliminary fleet or route-planning applications. In addition, the feedback loop included in the workflow highlights that repeated tests or adjustments to the protocol may be required to improve repeatability and adapt the procedure to different real-world driving scenarios.
Beyond its practical implementation, the proposed workflow also provides a structured basis for interpreting the experimental findings in relation to previous real-world EV energy studies. The results obtained in this work are consistent with previous research showing that road gradient, vehicle load, route characteristics, and driving dynamics strongly influence EV energy consumption and regenerative braking potential [
8,
19,
20]. Liu et al. [
19] demonstrated that including road-gradient information improves the modelling of EV electricity consumption, since uphill and downhill sections affect energy demand and regenerative opportunities differently. Similarly, Lee et al. [
20] showed under real-world driving conditions that EV energy efficiency is influenced by route characteristics, traffic conditions, driver behavior, vehicle weight, and regenerative braking settings. Kropiwnicki and Gawłas [
8] further emphasized that elevation variation can affect energy-efficient route selection because regenerative braking efficiency is lower than 100%. In this context, the present study extends previous findings by experimentally quantifying the combined effect of road gradient and driving mode under high-altitude Andean conditions. In particular, the comparison between Normal and Sport modes shows that the same road segment can produce substantially different regenerative behavior depending on the vehicle control calibration. This contribution is relevant because standardized driving cycles and flat-road evaluations do not fully capture the energetic response of EVs operating in cities with steep gradients and pronounced altitude variations.
The controlled gradient-based tests provide a clear interpretation of how the vehicle responds to different slope conditions. Under zero-gradient operation, the energy balance between Normal and Sport modes was relatively similar in terms of net energy demand. However, the Normal mode recovered more energy during deceleration, reaching a segment-level recovery ratio of 57.14%, compared with 47.53% in Sport mode. This indicates that, even under near-flat conditions, the selected driving mode modifies the regenerative braking response and therefore affects the final route-level energy balance.
The influence of road gradient became more evident under positive-gradient conditions. In this case, the acceleration energy increased to 0.0658 kWh in Normal mode and 0.0535 kWh in Sport mode, reflecting the additional traction power required to overcome the gravitational component opposing vehicle motion. Although the Sport mode presented a lower acceleration energy over the analyzed short segment, it also showed a substantial reduction in regenerated energy, reaching only kWh and a recovery ratio of 8.96%. This behavior suggests that, during uphill operation, the Sport mode prioritizes immediate traction response and dynamic performance over energy recovery. Consequently, Sport mode produced the highest net energy demand among the controlled tests, with 0.0487 kWh.
Under negative-gradient conditions, the opposite trend was observed. The downhill segment favored regenerative braking, especially in Normal mode, where the vehicle consumed 0.0272 kWh but regenerated kWh, producing a net energy balance of kWh. The corresponding recovery ratio reached 194.38%, indicating that the recovered energy exceeded the traction energy consumed over the same segment. This result should not be interpreted as a drivetrain efficiency greater than unity. Instead, it reflects the contribution of gravitational potential energy during downhill motion. In this condition, the vehicle behaves as a net energy generator from the perspective of the onboard battery energy balance, because part of the potential energy associated with the descending trajectory is converted into electrical energy through regenerative braking.
The route-level urban and mixed driving tests further support the relevance of topography and driving dynamics in the real-world energy behavior of the vehicle. The mixed route consumed 6.845 kWh and regenerated 2.842 kWh, resulting in a net energy demand of 4.004 kWh and a recovery ratio of 41.51%. In comparison, the urban route consumed 2.872 kWh and regenerated 1.144 kWh, resulting in a net energy demand of 1.728 kWh and a recovery ratio of 39.84%. Although the mixed route required more total energy due to its longer distance, higher speeds, and greater altitude variation, it also provided more opportunities for energy recovery during extended downhill segments. Conversely, the urban route maintained a comparable recovery ratio despite lower total energy consumption, mainly because of the higher frequency of acceleration and braking events typical of urban traffic.
The Paso Lateral segment represents the most demanding real-world case analyzed in this study. During the ascent, the vehicle consumed 1.460 kWh and regenerated only 0.058 kWh, resulting in a net energy demand of 1.402 kWh and a recovery ratio of 3.95%. This confirms that sustained uphill operation is one of the most energy-intensive driving conditions for electric vehicles in high-altitude mountainous environments. During the descent, however, the vehicle consumed only 0.245 kWh and regenerated 0.569 kWh, producing a net energy balance of
kWh and a recovery ratio of 232.10%. This result is also consistent with studies on downhill EV operation showing that road slope, braking demand, and battery operating conditions influence the achievable energy recovery during sustained descent [
14].
From an instrumentation perspective, the results show that the proposed low-cost setup is capable of capturing representative route-level energy trends under real-world operating conditions. The Fluke 393 FC, combined with GNSS-based kinematic measurements and OBD-II battery data, allowed the estimation of traction power demand, regenerative braking intervals, and cumulative energy indicators. Although this instrumentation does not provide the high-frequency resolution required for detailed inverter switching or transient waveform analysis, it is suitable for the objective of this work: route-level energy assessment based on cumulative power integration. This distinction is important because the dominant dynamics of vehicle-level energy consumption, such as acceleration, deceleration, rolling resistance, aerodynamic drag, and road gradient, evolve at much lower frequencies than inverter switching phenomena.
The complementary standardized-cycle dataset was retained only as a contextual reference. The NEDC and WLTC-2 results show that laboratory cycles provide useful baseline values for energy consumption and power demand under controlled conditions. However, these results should not be interpreted as a direct validation of the low-cost instrumentation because the measurements were not performed simultaneously on the same vehicle. Therefore, the laboratory reference is useful only to contextualize general energy-consumption trends, while the main contribution of this study remains the real-world high-altitude and high-gradient assessment performed with the low-cost instrumentation setup.
Overall, the findings indicate that EV energy assessment in high-altitude cities should not rely exclusively on standardized driving cycles or flat-road assumptions. The interaction between road gradient, driving mode, and regenerative braking can significantly change the energy balance of the vehicle. In particular, Normal mode showed a more favorable regenerative response in both zero-gradient and negative-gradient conditions, while Sport mode reduced regenerative recovery, especially during uphill operation. These results highlight the importance of considering local topography and driving mode calibration when evaluating electric vehicle energy performance, route planning, and real-world range behavior in mountainous urban environments.
4.1. Instrumentation Reliability and Applicability
A relevant aspect of the proposed methodology is the use of portable and safety-rated instrumentation for field-based electric vehicle energy assessment. The selected low-cost setup was not intended to replace laboratory-grade data acquisition systems for high-frequency electrical characterization. Instead, it was designed to provide a practical method for estimating route-level energy consumption and regenerative braking behavior under real driving conditions.
The main distinction between laboratory-grade instrumentation and the proposed field-based setup lies in their measurement objective. High-end systems, such as multi-channel power analyzers or high-speed data acquisition platforms, are suitable for resolving fast electrical transients, harmonic content, inverter switching effects, and detailed waveform behavior. In contrast, the Fluke 393 FC prioritizes electrical safety, portability, and practical deployment in high-voltage DC environments. This difference is fundamental because the objective of this study is not transient inverter characterization, but cumulative energy analysis over real-world driving segments.
For route-level energy assessment, the dominant phenomena are associated with vehicle acceleration, deceleration, road gradient, rolling resistance, aerodynamic drag, and regenerative braking. These processes occur at much lower characteristic frequencies than inverter switching phenomena. Therefore, although the 3 S/s logging rate of the Fluke 393 FC is lower than that of laboratory-grade systems, it remains appropriate for identifying the main power trends that dominate cumulative energy consumption and recovery. The integration-based approach adopted in this study further supports this application, since the final indicators are obtained from the time integration of the power signal rather than from instantaneous high-frequency waveform analysis.
The proposed setup also offers practical advantages for field testing in topographically complex environments. The clamp meter allows current measurements without interrupting the high-voltage circuit, the GNSS system provides speed and altitude information required for route characterization, and the OBD-II interface provides complementary battery-related variables. This combination makes the methodology suitable for repeated on-road tests where installation simplicity, safety, and portability are essential.
Nevertheless, the limitations of this instrumentation must be clearly recognized. Short-duration power spikes may be partially attenuated or missed due to the logging rate of the clamp meter. In addition, differences in sampling frequency between the current, voltage, and GNSS signals require synchronization during post-processing. As a result, the proposed setup should be interpreted as a route-level energy assessment tool and not as a substitute for laboratory-grade instrumentation in applications requiring transient electrical analysis or formal metrological validation.
4.2. Study Limitations and Future Research
Although this study provides relevant insights into the energy behavior of an electric vehicle under high-altitude and high-gradient real-world conditions, several limitations must be acknowledged.
First, the real-world tests were influenced by unavoidable operational variability. Although the short-segment tests were repeated under the same route, target speed, and driving-mode conditions, the driver input could not be completely eliminated. Variations in accelerator release, pedal modulation, traffic interaction, and local road conditions may affect the magnitude of traction power demand and regenerative braking. Future work could reduce this variability by using more controlled driving protocols or automated driving procedures where feasible.
Second, the low-cost instrumentation setup presents limitations related to sampling frequency and synchronization. The Fluke 393 FC provides a logging rate suitable for cumulative energy analysis, but it may not capture very short-duration transients. In addition, voltage and battery-related data obtained through the OBD-II interface may have lower sampling frequency than the current and GNSS signals. Therefore, post-processing synchronization is required, and the resulting indicators should be interpreted at the route or segment level rather than as high-frequency transient measurements.
Third, the study focused on one electric SUV and one high-altitude urban environment. Although the selected routes in Ambato are representative of Andean topographical conditions, the results may vary for other vehicle architectures, battery chemistries, regenerative braking calibrations, tire-road conditions, and driver profiles. Additional testing with different EV models and in other high-altitude cities would strengthen the generalizability of the proposed methodology.
Fourth, the complementary laboratory dataset was retained only as a contextual reference. Since the low-cost and high-resolution measurements were not acquired simultaneously on the same vehicle, a formal point-to-point validation of the Fluke-based setup was not possible in the present study. Future research should implement simultaneous dual-instrumentation measurements on the same vehicle and under the same driving conditions. This would enable a formal uncertainty analysis and a direct comparison between low-cost and laboratory-grade systems.
5. Conclusions
This study presented a low-cost instrumentation framework for the energy-based assessment of a battery electric SUV under high-altitude and high-gradient real-world driving conditions. The proposed methodology was applied in Ambato, Ecuador, at approximately 2500 m above sea level, using a portable setup composed of a GNSS system, a Fluke 393 FC high-voltage clamp meter, and an OBD-II diagnostic interface. The approach enabled the estimation of traction power demand, regenerative braking behavior, acceleration energy, regenerated energy, net energy, and segment-level energy recovery ratio under representative real-world conditions.
The controlled gradient-based tests demonstrated that road gradient and driving mode strongly affect the energy balance of the vehicle. Under zero-gradient conditions, the Normal mode required 0.0454 kWh during acceleration and recovered kWh, resulting in a recovery ratio of 57.14%. In comparison, the Sport mode required 0.0351 kWh and recovered kWh, reaching a recovery ratio of 47.53%. Although both modes presented similar net energy demand under near-flat conditions, the Normal mode showed a higher regenerative contribution.
Under positive-gradient conditions, the energy demand increased due to the gravitational component opposing vehicle motion. The Normal mode required 0.0658 kWh during acceleration, while the Sport mode required 0.0535 kWh. However, Sport mode showed a strong reduction in regenerated energy, reaching only kWh and a recovery ratio of 8.96%. This result indicates that, during uphill operation, Sport mode prioritizes traction response and dynamic performance over regenerative recovery, producing the highest net energy demand among the controlled tests.
Under negative-gradient conditions, regenerative braking became dominant. The Normal mode consumed 0.0272 kWh but regenerated kWh, resulting in a net energy balance of kWh and a segment-level recovery ratio of 194.38%. This value does not represent drivetrain efficiency greater than unity; rather, it reflects the contribution of gravitational potential energy during downhill operation. In contrast, the Sport mode presented a nearly balanced response, with 0.0314 kWh consumed, kWh regenerated, and a net energy demand of 0.0011 kWh.
The extended route-level tests confirmed the relevance of local topography and driving dynamics in high-altitude urban environments. The mixed route consumed 6.845 kWh and regenerated 2.842 kWh, resulting in a net energy demand of 4.004 kWh and a recovery ratio of 41.51%. The urban route consumed 2.872 kWh and regenerated 1.144 kWh, resulting in a net energy demand of 1.728 kWh and a recovery ratio of 39.84%. These results show that regenerative behavior depends not only on road gradient, but also on the frequency of acceleration and braking events associated with real traffic conditions.
The Paso Lateral segment further highlighted the strong influence of sustained gradients. During ascent, the vehicle consumed 1.460 kWh and regenerated only 0.058 kWh, resulting in a net energy consumption of 1.402 kWh and a recovery ratio of 3.95%. During descent, the vehicle consumed 0.245 kWh and regenerated 0.569 kWh, producing a net energy balance of kWh and a recovery ratio of 232.10%. This confirms that steep downhill segments in Andean topographies can allow the vehicle to behave as a net energy generator over specific route sections because of the conversion of gravitational potential energy through regenerative braking.
From an instrumentation perspective, the results indicate that the proposed low-cost setup is suitable for route-level energy assessment when the objective is cumulative power integration rather than high-frequency transient electrical characterization. Although the Fluke 393 FC has a lower logging rate than laboratory-grade data acquisition systems, it was able to capture representative power trends, identify regenerative braking intervals, and quantify route-level energy indicators under real-world operation. The complementary NEDC and WLTC-2 laboratory dataset was retained only as a contextual reference and should not be interpreted as a direct validation of the low-cost instrumentation, since the measurements were not performed simultaneously on the same vehicle.
Overall, this work shows that low-cost instrumentation can provide a practical and scalable approach for evaluating electric vehicle energy performance in topographically complex high-altitude environments. The findings emphasize the need to consider road gradient, driving mode, and local route characteristics when estimating energy consumption, regenerative braking potential, and real-world range behavior. Future work should include simultaneous low-cost and laboratory-grade measurements on the same vehicle, additional EV models, repeated routes under different traffic conditions, and a more detailed analysis of battery temperature and state-of-charge effects.




 ,
,