1. Background
Heavy duty vehicles (HDVs), despite forming only about 2% of Europe’s vehicle fleet, contribute to about a quarter of European road transport emissions. To match the 2040 climate target and Fit for 55 package, the EU is currently transitioning to zero emissions in the HDV sector, with the European parliament having adopted measures to reduce emissions from trucks and buses by 45% for the period 2030–2034, 65% for 2035–2039 and 90% as of 2040. In response, the market is already shifting. The sales of battery electric HDVs (including light, medium and heavy trucks and buses) in the EU have more than doubled in 2023. However, in terms of fleet share, the numbers remain very low: only about 0.35% of trucks in the EU are battery electric [
1].
The zero tailpipe emission trucks have two main prime mover options: electricity and hydrogen converted to electricity in a fuel cell. Both chains are feeding the same electric drive (power converter and e-motor). Electricity as the prime mover can be provided through static charging (either in private or public location) and stored in on-board batteries (BETs, the main market trend currently), or through dynamic in-motion catenary charging buffered by a small battery (catenary electric truck CETs, out of scope for the present work). For fuel cell as the prime mover for the FCETs, hydrogen-refilling infrastructure as well as on-board H
2 storages are required. Earlier research on the potential of battery electric [
2] or fuel cell trucks [
3] require updates in terms of technology, performance and market maturity. As shown by [
4] the CET has the lowest tank-to-wheel (TTW) energy consumption, followed by the BET and FCET. The difference between BETs and FCETs comes from the fact that energy storage in batteries has a higher energy efficiency than H
2-to-electricity conversion in fuel cells. While BETs are already being deployed and infrastructure is relatively straightforward to organise, FCETs are still to move from niche trials towards large-scale deployments [
5].
To improve competitiveness of zero-emission HDVs towards regional and long-haul logistics, it is essential that a holistic approach comprising technological, environmental, and economic aspects towards vehicle deployment are considered. This requires development of both vehicular and powertrain solutions and the necessary infrastructures to support operation of the vehicles. This combination ensures that the rapid development in key technologies, especially batteries and charging is accounted for. Environmental aspects can be analysed through life cycle assessment (LCA), whereas techno-economics through total cost of ownership (TCO) analysis is a good indicator of overall competitiveness and viability of different vehicular and system solutions.
The project ESCALATE puts forward three physical zero-emission truck demonstrators piloted in real operation by freight operators on regional and long-haul missions of three zero-emission modular and scalable powertrain approaches: fully electric truck (BET), fuel cell electric truck (FCET) and fuel cell range-extended BET (BET-FCRE). The pilots are currently under final development and preparing to roll out operations together with freight operator partners in 2026. The LifeCostDrive strategy (LCDS) of ESCALATE [
6] provides a tailored approach, addressing vital aspects of sustainability, economic considerations, and vehicular performance centred on a zero-emission heavy-duty fleet and cross-analysis of TCO as part of the overall assessment. The present paper deals with the TCO part of the analysis concentrating on the first-owner period of 6 years after purchase, assuming the trucks will continue to the second hand market at a residual value using simplified valuation models. Preliminary design and operational planning data were used for the analysis, alongside assumptions on piloting missions. Final validation can be done after the roll-out of the pilots and collection of design and operational data, including observed operational and market data variations as well as component performance and ageing. The end-of-life back-end cost elements were not analysed.
The contribution of this paper is threefold: (i) it defines a harmonised cross-pilot analysis matrix of long-haul missions and representative zero-emission powertrain configurations to support comparability across heterogeneous demonstrator designs; (ii) it combines forward-facing simulation-based energy use and mission time estimates with a transparent TCO; and (iii) it identifies the dominant uncertainty drivers (electricity procurement for public fast charging, hydrogen retail pricing, utilisation, and technology CAPEX) to guide subsequent sensitivity analysis and updates using measured pilot operation data. The present paper is a revised and extended version of the original contribution to EVS38 [
7].
2. Approach and Methodology
Innovative modular and scalable next generation powertrain solutions are analysed for zero-emission trucks operating in regional and long-haul missions. This includes different combinations of energy options for these powertrains, including the necessary infrastructure options and implications for energy procurement. The methodology for the TCO analysis will include combination of BETs, FCETs and different degrees of BET and FCET hybridization (range-extending BET) to be analysed in conjunction with various combinations of input parameters and their variation across all ESCALATE pilots. The collection of input and operational environment parameters from the physical pilots in different geographic locations will ensure the real design and operational data that provide diverse dataset sensitivity to local energy commodity prices can be identified. The baseline operational scenarios will be based on the initial haulier plans on route and the schedule and preliminary design data for both vehicles and supporting infrastructure, analysed through a joint simulation approach. A subsequent more detailed analysis of some of the pilots will later be considered based on the final designs and real tracked data. Energy consumption will first be based on modelling and simulation using the approach described in [
8,
9] for one of the ESCALATE pilots, later to be validated from real data collected from the pilot operations.
The current paper presents methodology and elements of the life cycle costing part of the ESCALATE approach through TCO analysis. The methodology of the TCO covers both capital and operational expenditures arising from owning and operating zero-emission trucks, including all three main powertrain and prime mover energy options as well as supporting infrastructures they require. Besides presenting the methodology for TCO analysis as part of ESCALATE’s LCDSLifeCostDrive strategy, the study will cross-analyse the four physical pilot demonstrations across Europe, namely (1) SISU pilot in Finland, (2) BMC pilot in Turkey–Bulgaria and France–Germany, (3) Electra pilot in the UK and Germany, and additionally (4) a virtual Ford pilot in France–Spain [
10].
2.1. Powertrain and Vehicle Configurations
For the cross-analysis of the pilots, we constructed representative powertrain and vehicle configurations for the demonstrator vehicles relevant for the ESCALATE project. The designs boil down to the following four powertrain and prime mover variants, which can also be derived from the conceptual analysis presented earlier [
8]:
Conventional diesel truck (baseline case across the analysis);
Battery electric truck with a large battery aiming at maximum range with overnight depot charging;
Battery electric truck with an intermediate battery combining overnight depot charging and fast opportunity charging;
Range-extending plug-in battery electric fuel cell truck (two variants analysed, depending on the energy management strategy; see
Section 2.3);
Fuel cell truck with a small non-chargeable battery.
The details of zero-emission powertrains and operational configurations are given in
Table 1, as well as the hauler-specific operational scenarios planned for the actual piloting phase in 2025. This initial TCO baseline assessment contains the demonstrator designs and operational planning as of preparation status in early 2025.
The baseline vehicle with a conventional diesel powertrain is a Volvo FH 42 tractor (4 × 2) with a curb weight of 7000 kg [
11], or a Volvo FH 64 (6 × 4) with a curb weight of 9000 kg [
12]. All semitrailers were assumed to be a 3-axle trailer with a weight of 7500 kg, which is the mass defined for the standard semitrailer in the declaration of CO
2 values for heavy-duty vehicles according to Commission Regulation (EU) 2017/2400 [
13]. The maximum allowable gross vehicle weight (GVW) of the baseline vehicles is 40 tonnes resulting in payload capacities of 25.5 tonnes and 23.5 tonnes of the 4 × 2 and 6 × 2/6 × 4 configurations, respectively.
Zero-emission powertrains introduce a mass penalty relative to conventional diesel configurations, driven primarily by battery capacity, fuel cell system mass and hydrogen storage. In the baseline assessment, this is reflected through (i) an assumed maximum GVW increase from 40 t to 42 t for zero-emission trucks, and (ii) payload reductions when curb weight exceeds the allowable GVW. In the next iteration of ESCALATE analyses, the baseline payload assumptions will be revisited using final demonstrator mass breakdowns and validated operational payload distributions from the pilots. For the demonstrator 1, there is also a high-capacity transport (HCT) configuration, which includes two semitrailers and a dolly of 2500 kg and has the maximum GVW of 68 tonnes for the baseline vehicle and 70 tonnes for the zero-emission vehicle.
The baseline vehicle for the BET design is a Volvo FH 42 Tractor Electric with a 450 kWh battery [
14,
15]. The specific energy of the battery pack was assumed to be 5.6 kg/kWh (≈0.178 KWh/kg) equal to the said Volvo FH 42 which is taken from [
16] for Volvo trucks, and it is also consistent with technological trend prediction in battery density [
17], which is 0.14 kWh/kg in 2020 to 0.23 kWh/kg in 2030. FC gravimetric power density 2.8 kg/kW, and the H
2 storage tank gravimetric density 17 kg/kgH
2 (5.88 wt%) is consistent with next generation 700 bar hydrogen storage architectures between 5.5 wt% interim and 6.5 wt% ultimate on-board storage system targets defined by [
18]. The gravimetric density of the e-motor and inverter was assumed to be 1.07 kg/kW. Furthermore, it was assumed that the weight of FC auxiliaries was 300 kg per FC unit (of 120 kW), whereas the weight of cabling, other electrical components and fixtures in demonstrators 1 and 4 was 1000 kg and in demonstrator 2500 kg.
The estimated payload capacities relevant for weight-constrained freight use cases are shown in
Table 1. The values used arise from the high-level preliminary demonstrator data from ESCALATE partners and do not necessarily fully reflect the final designs of the demonstrators. For example, for the definition of the tractor curb weights, several design details of the demonstrator trucks were not available during the analysis.
2.2. Pilot Missions, Infrastructure and Operational Schemes
The pilot locations, routes and operational missions for the baseline analysis were derived from the preliminary ESCALATE piloting plan. The general high-level information on the pilots and their key related infrastructure are listed in
Table 2.
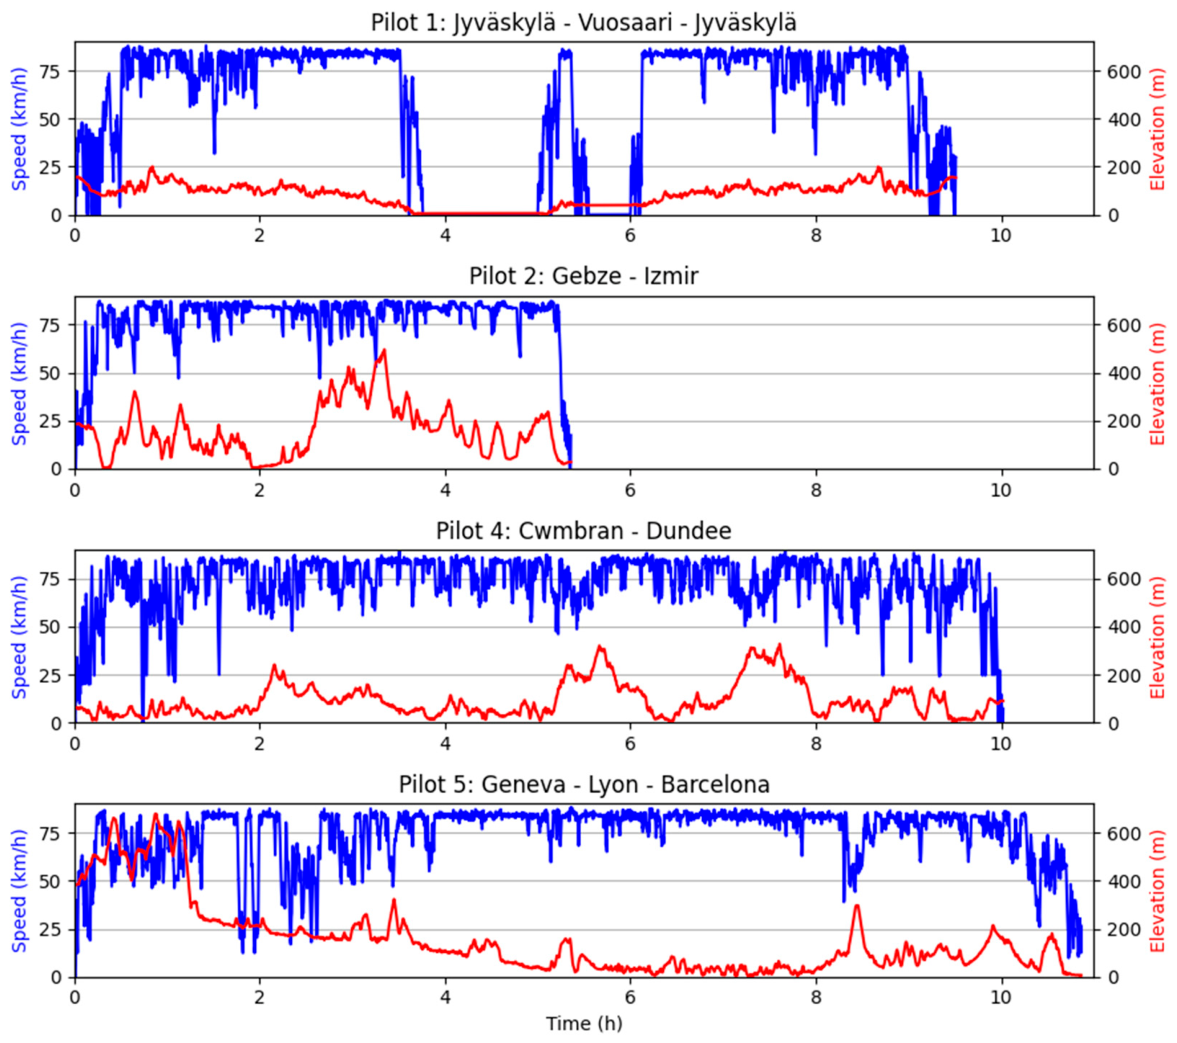
The anticipated driving cycles and elevation curves for the long-haul missions are illustrated in
Figure 1. The driving cycles were generated by VTT’s Smart eFleet toolbox, and they are based on combinations of real road sections between origin–destination, route topology and speed limits. The approach is described in [
19].
2.3. TCO Matrix and Key Inputs to Simulation
Combining the powertrain and vehicle configuration with the pilot missions resulted in the analysis matrix shown in
Table 3. For pilot 1, the missions a and b represent the nominal and HCT case, respectively. The GVW given in the table indicate the actual GVW at full allowable payload relevant to a weight-constrained use case. It should be noted that configuration C based on demonstrator 1 suffers some weight penalty in the energy consumption simulations from the fact that the vehicle actually also contains a FC system with complete auxiliaries, which are not relevant for case C. This weight penalty is to some extent reflected in the energy consumption through simulations. For the TCO analysis variant E is assumed to be a 3-axle configuration (6 × 2) so that its maximum payload becomes 23.5 t (different from the actual demonstrator 2 preliminary design shown in
Table 1) and therefore aligns with the baseline A.
Configuration C represents a fuel cell plug-in hybrid vehicle operating as a BEV. Under battery power alone, this vehicle is unable to complete any of the drive cycles, so intermediate charging is needed. The vehicle starts with the battery charged at 100%, and it is recharged to 90% during each intermediate charging event. In configuration D, the vehicle is operated in hybrid mode with the fuel cell and battery each providing power. The power split is determined by the equivalent consumption minimization strategy, which is tuned using the methodology described by Skeel et al. [
9].
All configurations and missions outlined in
Table 3 were simulated with a forward-facing simulation software, meaning that the actual speed depends not only on the route, but also on the powertrain performance. For the sake of comparison, the energy consumption and the active driving time was recorded for all cases.
The simulation software is implemented using a modular architecture, with specific modules for the route information, vehicle components, vehicle dynamics, and the driver. The core of the simulation consists of the well-known longitudinal dynamics equation, which describes the relationship between the speed and the forces acting on the vehicle. The resistive forces consist of the rolling resistance, air drag, and gravitational force. The rolling resistance and air drag depend on the vehicle parameters and the speed, while the gravitational force is dependent on the slope of the route. The traction force must meet the resistive forces at all time instances in order to maintain a constant speed. In the simulation model, the traction force is evaluated from the motor torque and gear selection. The motor torque is controlled by the driver module utilising a PI controller, and a simple gear selection algorithm based on speed limits is implemented. The driver module also controls the mechanical brakes. The module is designed to prioritise regenerative braking, and the mechanical brakes are activated only if the motor braking is not sufficient to meet the speed setpoint. The speed setpoint is formed in the route module, and it serves as an input to the driver module. The route module extracts data from open sources, e.g., the route topology, speed limits, traffic light locations, road curvature, and stopping locations.
The simulations are executed using a constant time step, and the platform is designed for efficient computational performance. Physical components of the vehicle are modelled utilising efficiencies based on look-up tables or constant efficiency values. The simulation software has previously been validated against laboratory data; however, as no measurement data are yet available for the pilot vehicles, the existing models have been updated using vehicle-specific parameter values.
Main vehicle parameters in the energy consumption simulation are the efficiencies of the powertrain and the road load parameters for rolling resistance and aerodynamic drag. Electrical drive efficiency, which is defined as a function of rotation speed and motor torque, has a peak efficiency of 96%. The inverter efficiency is assumed to be 98%, and battery efficiency also 98%. A diesel engine is assumed to have a peak efficiency of 49%, in accordance with the efficiency level given in marketing material [
20]. Driveline efficiency including transmission efficiency and axle efficiency is assumed to be 93% for electric powertrains [
4] and 92% for the diesel powertrain, which is a value based on measurements of a tractor on a chassis dynamometer. The rolling resistance coefficient is 5.5 N/kN corresponding to the energy efficiency label C in European tyre categorization and presenting an average value for all seasons in delivery and long-haul type of driving missions. The CdA value for the tractor and semitrailer configuration is 5.63 m
2, which is a value in line with the average CdA value of certified category 5-LH, the vehicles given in [
21], and 8.0 m
2 for the 68 tonne-vehicle combination with tractor, B-link semitrailer and another semitrailer, which is extracted from vehicle data of one representative vehicle combination.
The vehicle performance might deviate from the simulated results in real life, as exact data on all vehicle components is not available. The simulation model will be validated against chassis dynamometer data for one of the pilot vehicles later on. The validation will include driving at constant speed levels, accelerations and deceleration with varying payloads, and the utilisation of VECTO driving cycles to properly assess the vehicle parameters. The target of the validation is to achieve an energy consumption error of 2% maximum.
2.4. TCO Methodology and Inputs
The TCO analysis largely follows the methodology and approach from several related TCO studies both on BETs and FCETs, the levelized cost of driving (LCOD) and NPV approach in [
22]. Reference works analysing BETs and FCETs include [
23,
24], and they also provide useful input data from technology and the market. A novelty of ESCALATE is through pilot 1 to present the FC range-extended plug-in BET, and through the design of the pilot 1 demonstrator, the addition of the MCS-capable opportunity charging BET (configuration C). As real operational data on zero-emission trucks continues to be scarce, the approach has extensively utilised energy consumption estimates from simulations. This brings an additional advantage to the present approach providing good flexibility when analysing a variety of different powertrain and vehicle configurations and their energy consumption. This marks an improvement compared to [
22,
23,
24] where the energy consumption estimates were either indirectly inferred from conventional trucks, fixed, or extrapolated beyond validity.
The elements of TCO have been aggregated towards high-level analysis using the main capital (CAPEX) and operational (OPEX) cost elements to enable cross-analysis across the ESCALATE pilots without knowledge of the detailed designs and component selections. The main cost categories are first expressed as an equivalent annual cost (
EAC) for the first year of ownership:
where in the subscripts
C is CAPEX,
O is OPEX,
v is vehicle (all parts except for powertrain),
b is battery,
fch is fuel cell and the H
2 tanks,
c is private chargers owned by the haulier,
energy is the price of purchased energy (diesel, electricity, H
2),
S&M is service and maintenance, and
labour is the salary cost of the driver. For the CAPEX categories the analysis spreadsheet uses the PMT function with interest rate, length of the contractual/ownership period in years (N, equal to depreciation time), initial purchase price and the residual value. In other words, the capital investments are treated as a leasing deal for a fixed duration with even annual payments. Public charging as a service and all H
2 refilling are not regarded as an infrastructure investment, rather they are energy commodities where the retailer costs and margins are included in the price. For the OPEX categories, energy cost comes from energy consumption times average energy carrier price, and S&M are estimated based on the literature. The labour cost for the driver is calculated from the simulated active driving times for the various missions, plus the mandatory break times (EU regulation of a 45 min break after each 4.5 h of consecutive driving).
The
TCO over the ownership period is then formed by summing up the
EAC(n) over the length of the ownership period
N (years) using the NPV function
where the
EAC(n) represents the equivalent annual cost of a year of ownership. The rate is the annual inflation/deflation rate for OPEX categories and the interest rate for CAPEX categories. Finally, the
LCOD is obtained by dividing the
TCO by either the total mileage run during the period (€/km), or by both mileage and payload tonnage transported during the period (€/tonne-km). As the curb weight, payload and gross vehicle weight only affect the
TCO through energy consumption, the
LCOD (especially €/tonne-km) can show differences taking into account the freight carrying capacity.
The ownership and depreciation period assumed in the analysis was
N = 6 years and the residual value of all vehicle parts including the battery and the fuel cell was set to 30% at the end―this is a simplification and should be understood as an average as different components and structures wear out at different rates. For the battery, a very simple energy throughput model depending on the average depth of discharge adapted from [
25] was employed and battery lifetime of 6 years or above was suggested. For the fuel cell, a constant 20,000 h lifetime was assumed, also enabling 6 years of operation for all pilots. A more detailed residual value analysis including design and operation-specific lifetime estimates for battery, fuel cell and other electric components is deemed relevant for the future. Methods discussed in, for example, [
26,
27] on fuel cells and [
28,
29] on batteries estimate remaining useful life of power sources based on operational and design-related stress factors such as current density (power rating) and temperature can be implemented and validated through data analysis and modelling. Such analysis is out of scope for this baseline study. The interest rate was 5% and the inflation rate for OPEX categories was assumed to be 3%. Battery system price for NMC was 250 €/kWh and for LTO 1000 €/kWh; FC system price was 800 €/kW and H
2 tank price 1000 €/kgH
2 (700 bar). The battery system price assumption for NMC is supported by the most comprehensive meta-analysis of battery cost projection by [
30], which indicates that the cost in 2024/25 lies around 250 €/kwh (compared to 300 €/kwh in 2020 and 174 €/kwh in 2030), and the FC system price is taken from [
31]. The actively useable area of the battery (net SoC window) was assumed to be 85% of the SoC area, and 95% of the H
2 tank capacity. Zero-emission powertrain variants profit markup was assumed to be 50% for the electric drive and 30% for battery, fuel cell and H
2 tank as the market is still at an early stage. Depot chargers were assumed to be private and their price to be 400 €/kW and have a residual value of 0% at the end of the period. The price of a conventional baseline vehicle was 120,000 €, one semitrailer was 70,000 €.
The key inputs used in the TCO analysis are summarised in
Table 4. The diesel price given is the average of 2023, 2024 and 2025 without VAT, and the electricity price is the average of 2024 without VAT. While private charging at the depot is using the market electricity price as shown in
Table 4 plus 50% assumed for distribution and tax, it is assumed that public charging as a service by a CPO increase the commodity price further by a factor of 2, to cover the capital and running costs of the charging hub as well as the profit margin for electricity. For H
2 price at a commercial filling station dispenser the H
2 price was assumed to be 50% higher than the production cost. This assumption is consistent with European-level TCO studies by [
31]. In their studies Basma and Rodríguez assumed a green hydrogen retail price of €10.30/kg in 2023 for long-haul trucks with a daily driving range between 500 and 800 km based on the lowest cost hydrogen production pathway in their European truck decarbonization TCO study. The 50% uplift used in the present study reflects additional downstream cost components, compression, storage, distribution, refuelling station CAPEX/OPEX, and supplier margins, and provides a reasonable estimate in contexts where retail hydrogen prices remain unavailable in most piloting countries due to the early stage of hydrogen refuelling station deployment. Diesel prices were obtained from [
32], electricity prices from [
33] and H
2 production prices from [
34]. Service and maintenance costs for the vehicles were taken from [
31] and were 18.5 €/100 km for diesel trucks, FCETs and FC range-extending trucks, and 13.24 €/100 km for BETs. European-average distance-based road charges were used for the different trucks based on [
31], except in those cases where these were known to be zero (Finland). Zero-emission trucks were assumed to have 50% of the road tolls of the conventional trucks for pilot 5. The annual taxation on zero-emission truck ownership is determined by the taxation policies of pilot countries. Germany and the UK exempt zero-emission trucks from annual ownership taxes, although semitrailer fees still apply [
35,
36]. Türkiye and Spain offer reduced annual taxes for electric trucks, while Finland employs the same weight-based taxation structure as that for diesel powered trucks [
37]. The labour cost for the driver and the annual insurance cost at 2.14% of the purchase price of the vehicle were taken from [
31], unless a more specific value for the piloting country was available.
The annual mileage for each of the pilot cases analysed comes from the given daily mileage, further assuming that the pilot missions are driven 300 days per year and the vehicle utilisation is constant during the 6-year period. Therefore, the different pilot missions will end up at different total mileages after the ownership period.
4. Discussion
The large variety of powertrain and vehicle configurations within ESCALATE showcase the variability and range of total energy consumption of the trucks on the missions analysed. The analysis presented contains several compromises as the demonstrator vehicle designs vary and include a range of base requirements and missions. Energy consumption between the prime movers is easier when converting all energy use to a single unit. Assuming a diesel energy density of 9.9 kWh/L and a hydrogen energy density of 33.3 kWh/kg, configuration B consumed the least energy in all cases, followed by configuration C. Both these vehicles are BETs. Still, between configurations B and C, quite a large difference in terms of kWh/km for the same mission can be observed, varying between 4 and 25%. Final validations of the various vehicle models against observed real-world performance will help to harmonise the results. The demonstrators have differences in powertrain, power conversion, transmission and also aerodynamics.
The next lowest energy consumption comes from configuration D2, which is a fuel cell battery hybrid that additionally operates with intermediate battery charging, followed by D1 which is the same vehicle in the range-extending mode without intermediate charging. The diesel vehicle from configuration A has the highest energy consumption, followed by the fuel cell vehicle of configuration E. Though these results do not consider well-to-wheel consumption, they indicate that battery electric trucks are capable of completing long-haul driving routes with the lowest energy consumption. In cases where intermediate charging is not available, or longer driving range is required, the BET-FCRE vehicle of configuration D1 is a promising option.
When bringing together all the high-level inputs shown in the analysis towards TCO, several additional factors are highlighted. The five missions show quite different utilisations, and assuming the missions being repeated for 300 days per year the highest utilisation from a single mission per day exceeds 50% when taking into account the time required for the mandatory breaks. The highest mileages during the contract period approach 1.5 million km. One limitation of the current analysis is that the battery and fuel cell lifetime estimates as well as the definition of residual values are not fully aligned with the utilisation (mileage). While the simple battery lifetime estimator used does account for the battery service life through the leasing function, the same is not true for the fuel cell and rest of the vehicle components. This points to further work going more into depth especially on the batteries implemented and the fuel cells.
Overall, the BET is most often the most competitive configuration within the ZE trucks, in comparison with conventional fossil diesel. Advanced biodiesel or e-diesel was not analysed, but the sensitivity of the overall TCO parity to diesel price in configuration A is clear. For greenhouse gas reduction targets, the real option to zero-emission energies should be advanced biodiesel, biomethane and e-fuels (diesel or methane). Such sustainable fuel can easily be 20% or more expensive than conventional fossil fuels and therefore tip the scale towards ZEV alternatives.
Of the BET variants, the configuration B with a large battery shows somewhat lower TCO except for pilot 2. The TCO for the opportunity charging BET comes with an uncertainty arising from two parts: energy consumption (higher energy consumption of configuration C compared to B came out from the simulations), and secondly the price of electricity for both private and public charging. It is very likely that electricity from private depot chargers is cheaper than public charging, a multiplying factor of 2 was assumed for public fast charging. What is more, smart charging can create further competitive edge for private charging. Large differences in electricity price and varying share of public of total electricity charged resulted in a range of energy costs for BETs. This sensitivity is clearly shown by pilots 4 and 5 in the UK and FR/SP where the electricity price used in the analysis was the highest of all cases. Generally speaking, BETs start to be competitive with diesel when average electricity price approaches 0.2 €/kWh or below, naturally depending on the local diesel price.
Almost all of the opportunity charging events during the missions were assumed to take place during the mandatory breaks. It should be noted that this will require MW charging by MCS and create the need for the CPOs to upgrade charging hubs with more powerful systems. Any delays in the logistics missions due to deviation from the optimal route or waiting for the battery to be charged or H2 filled will lead to time lost from productive work and therefore reflect on the overall TCO through labour cost and lost revenue.
Regarding the TCO on range-extending FC-BET and FCETs, another big uncertainty comes from H2 price. The analysis shown in this paper has assumed H2 pump prices between 7.2 and 9.5 €/kgH2, which may be on the low side of the observed market price today. An increase of 50% from the documented production price was assumed, but in reality the early market H2 pump price for hydrogen-driven trucks is not known.
Analysing the TCO including factors from freight capacity gives an additional insight. Configurations B (depot charging large-battery BETs) and D (FC range-extended BETs with intermediate sized battery and FC) resulted in curb weights, which reduce the maximum payload capacity due to limitations of GVW. Within the assumptions of the analysis, these two configurations had 87–95% of the payload capacity compared to diesel baseline. When presenting the TCO in terms of €/tonne-km, variants C (intermediate-sized BETs) and E (FCETs) were able to carry full maximum payload and therefore gained in comparison to the heavier ZEV. It should be noted that this difference only arises for weight-constrained transports where the vehicle operates close to the maximum GVW. For competitive real-life ZEV truck operations, careful energy management planning will become important to optimise energy sourcing and to take into account ahead of time the effects of payload, weather and road condition, etc. Such factors will be addressed in subsequent work.
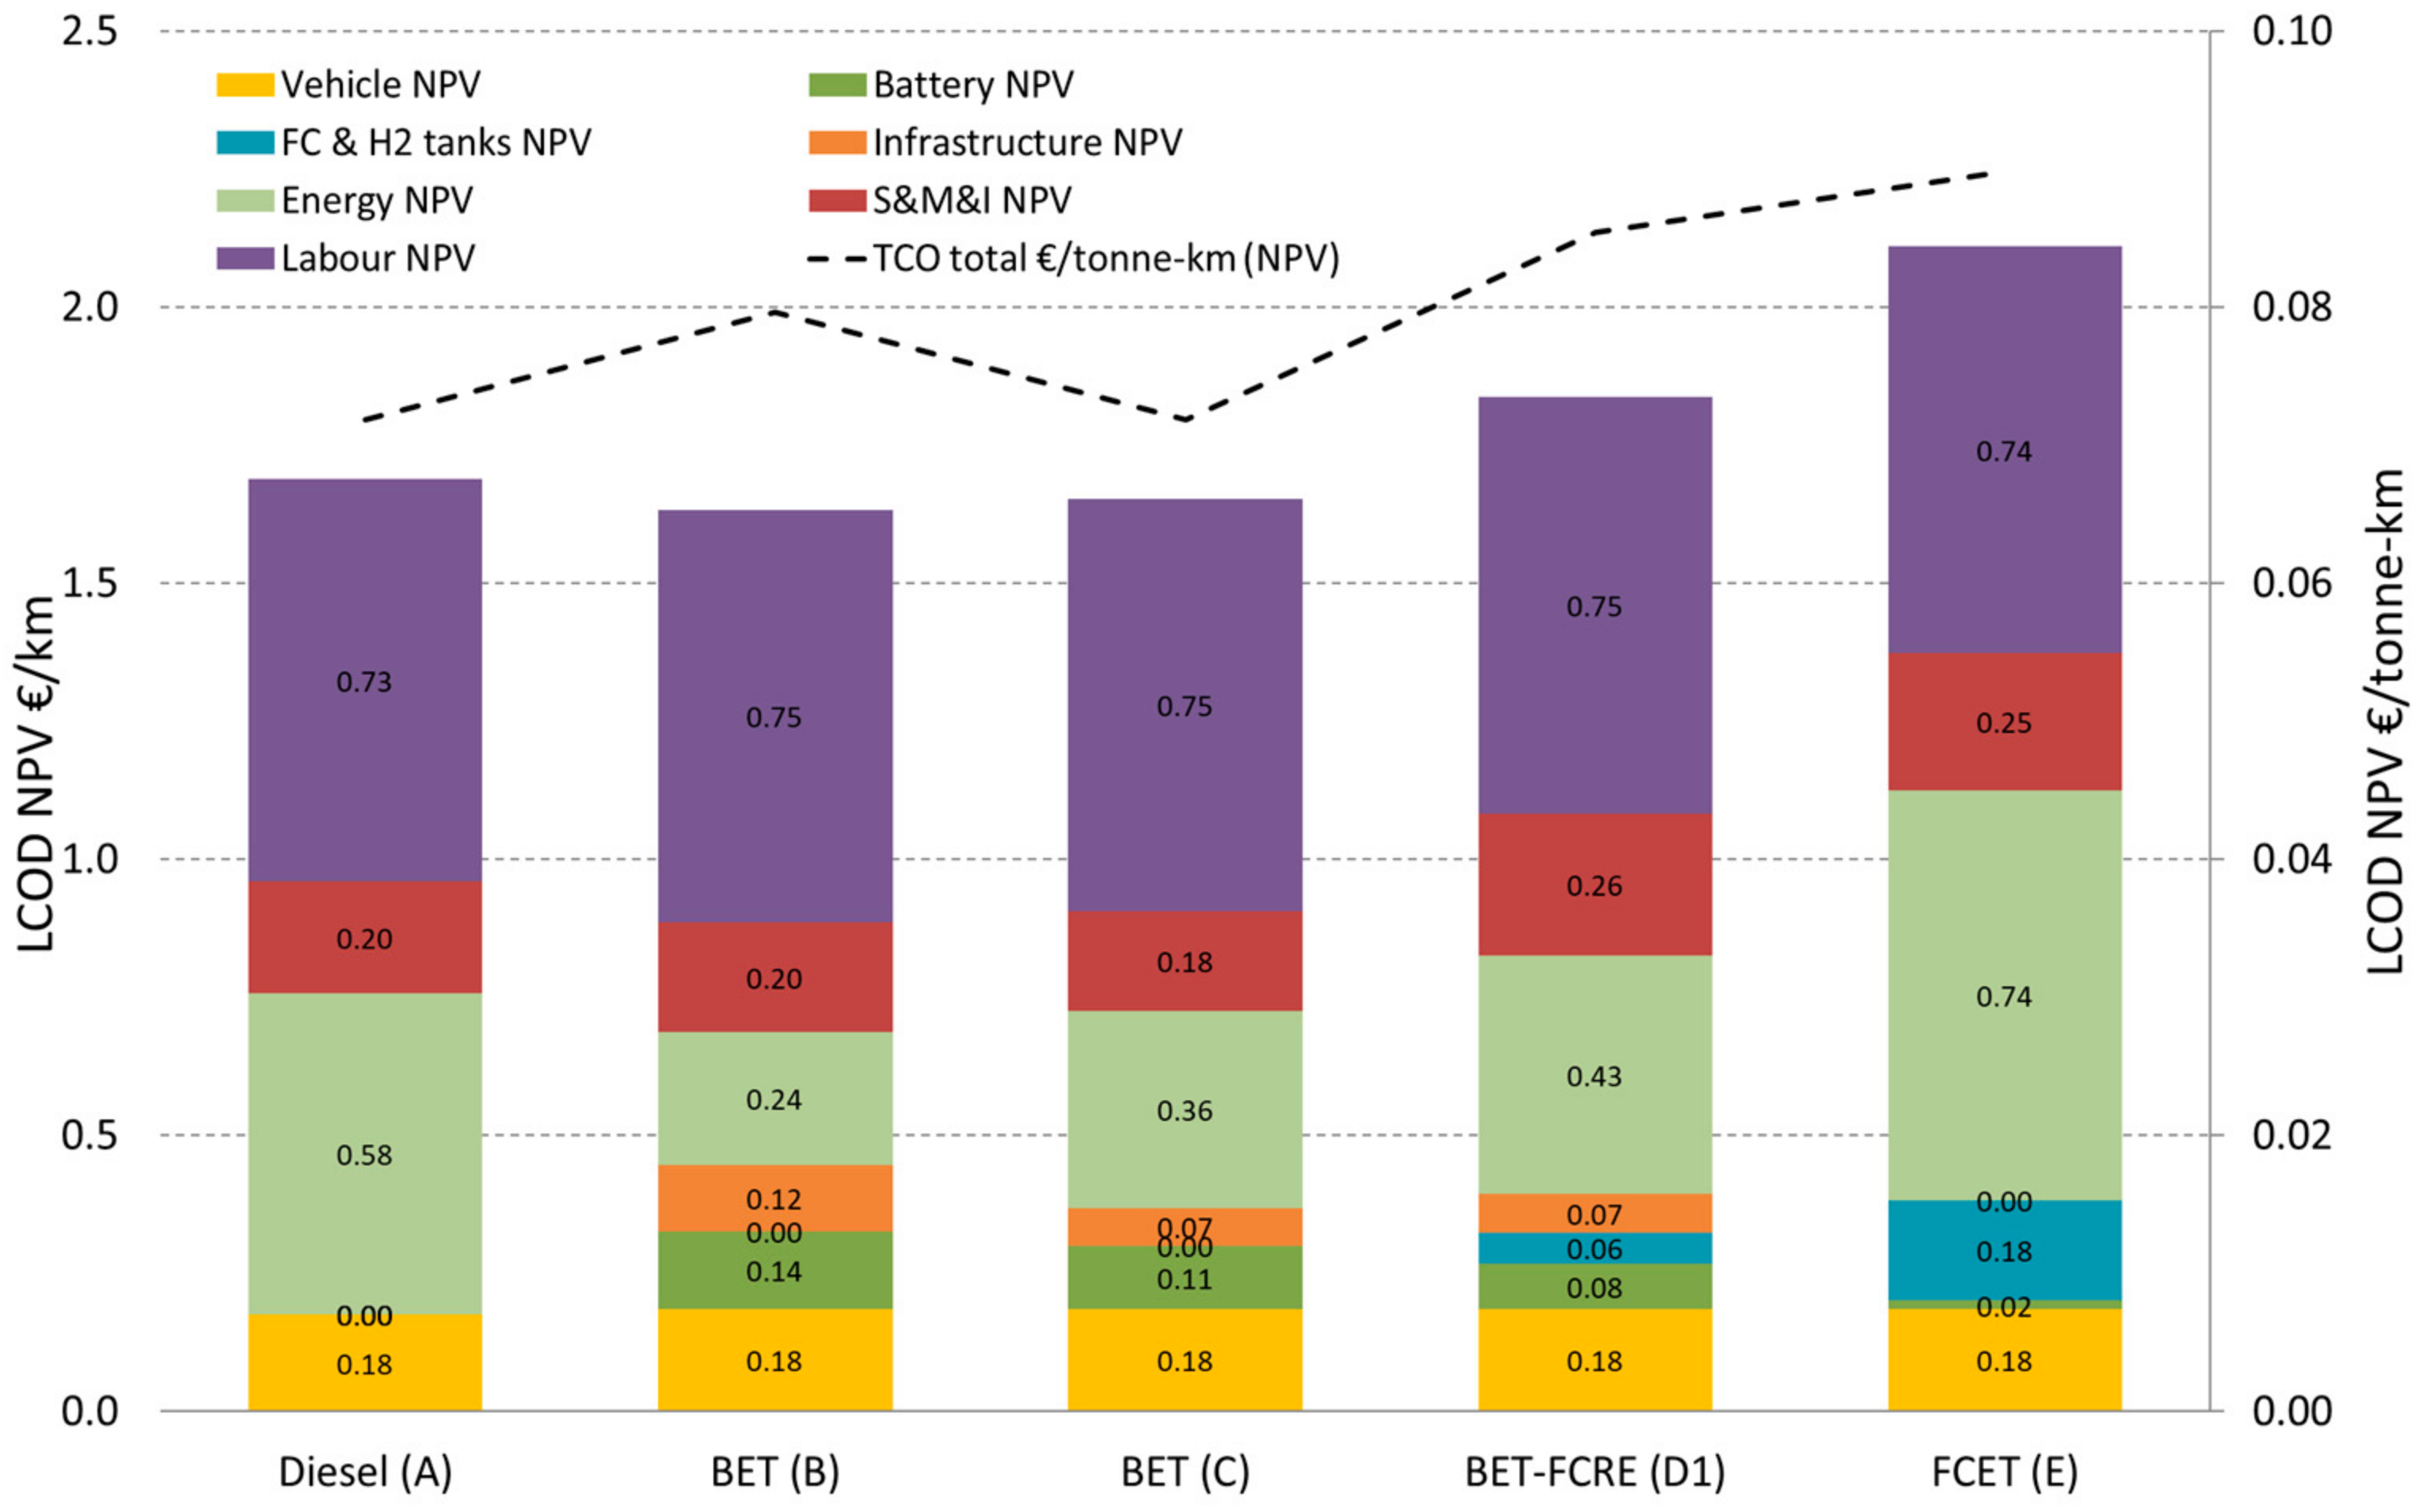
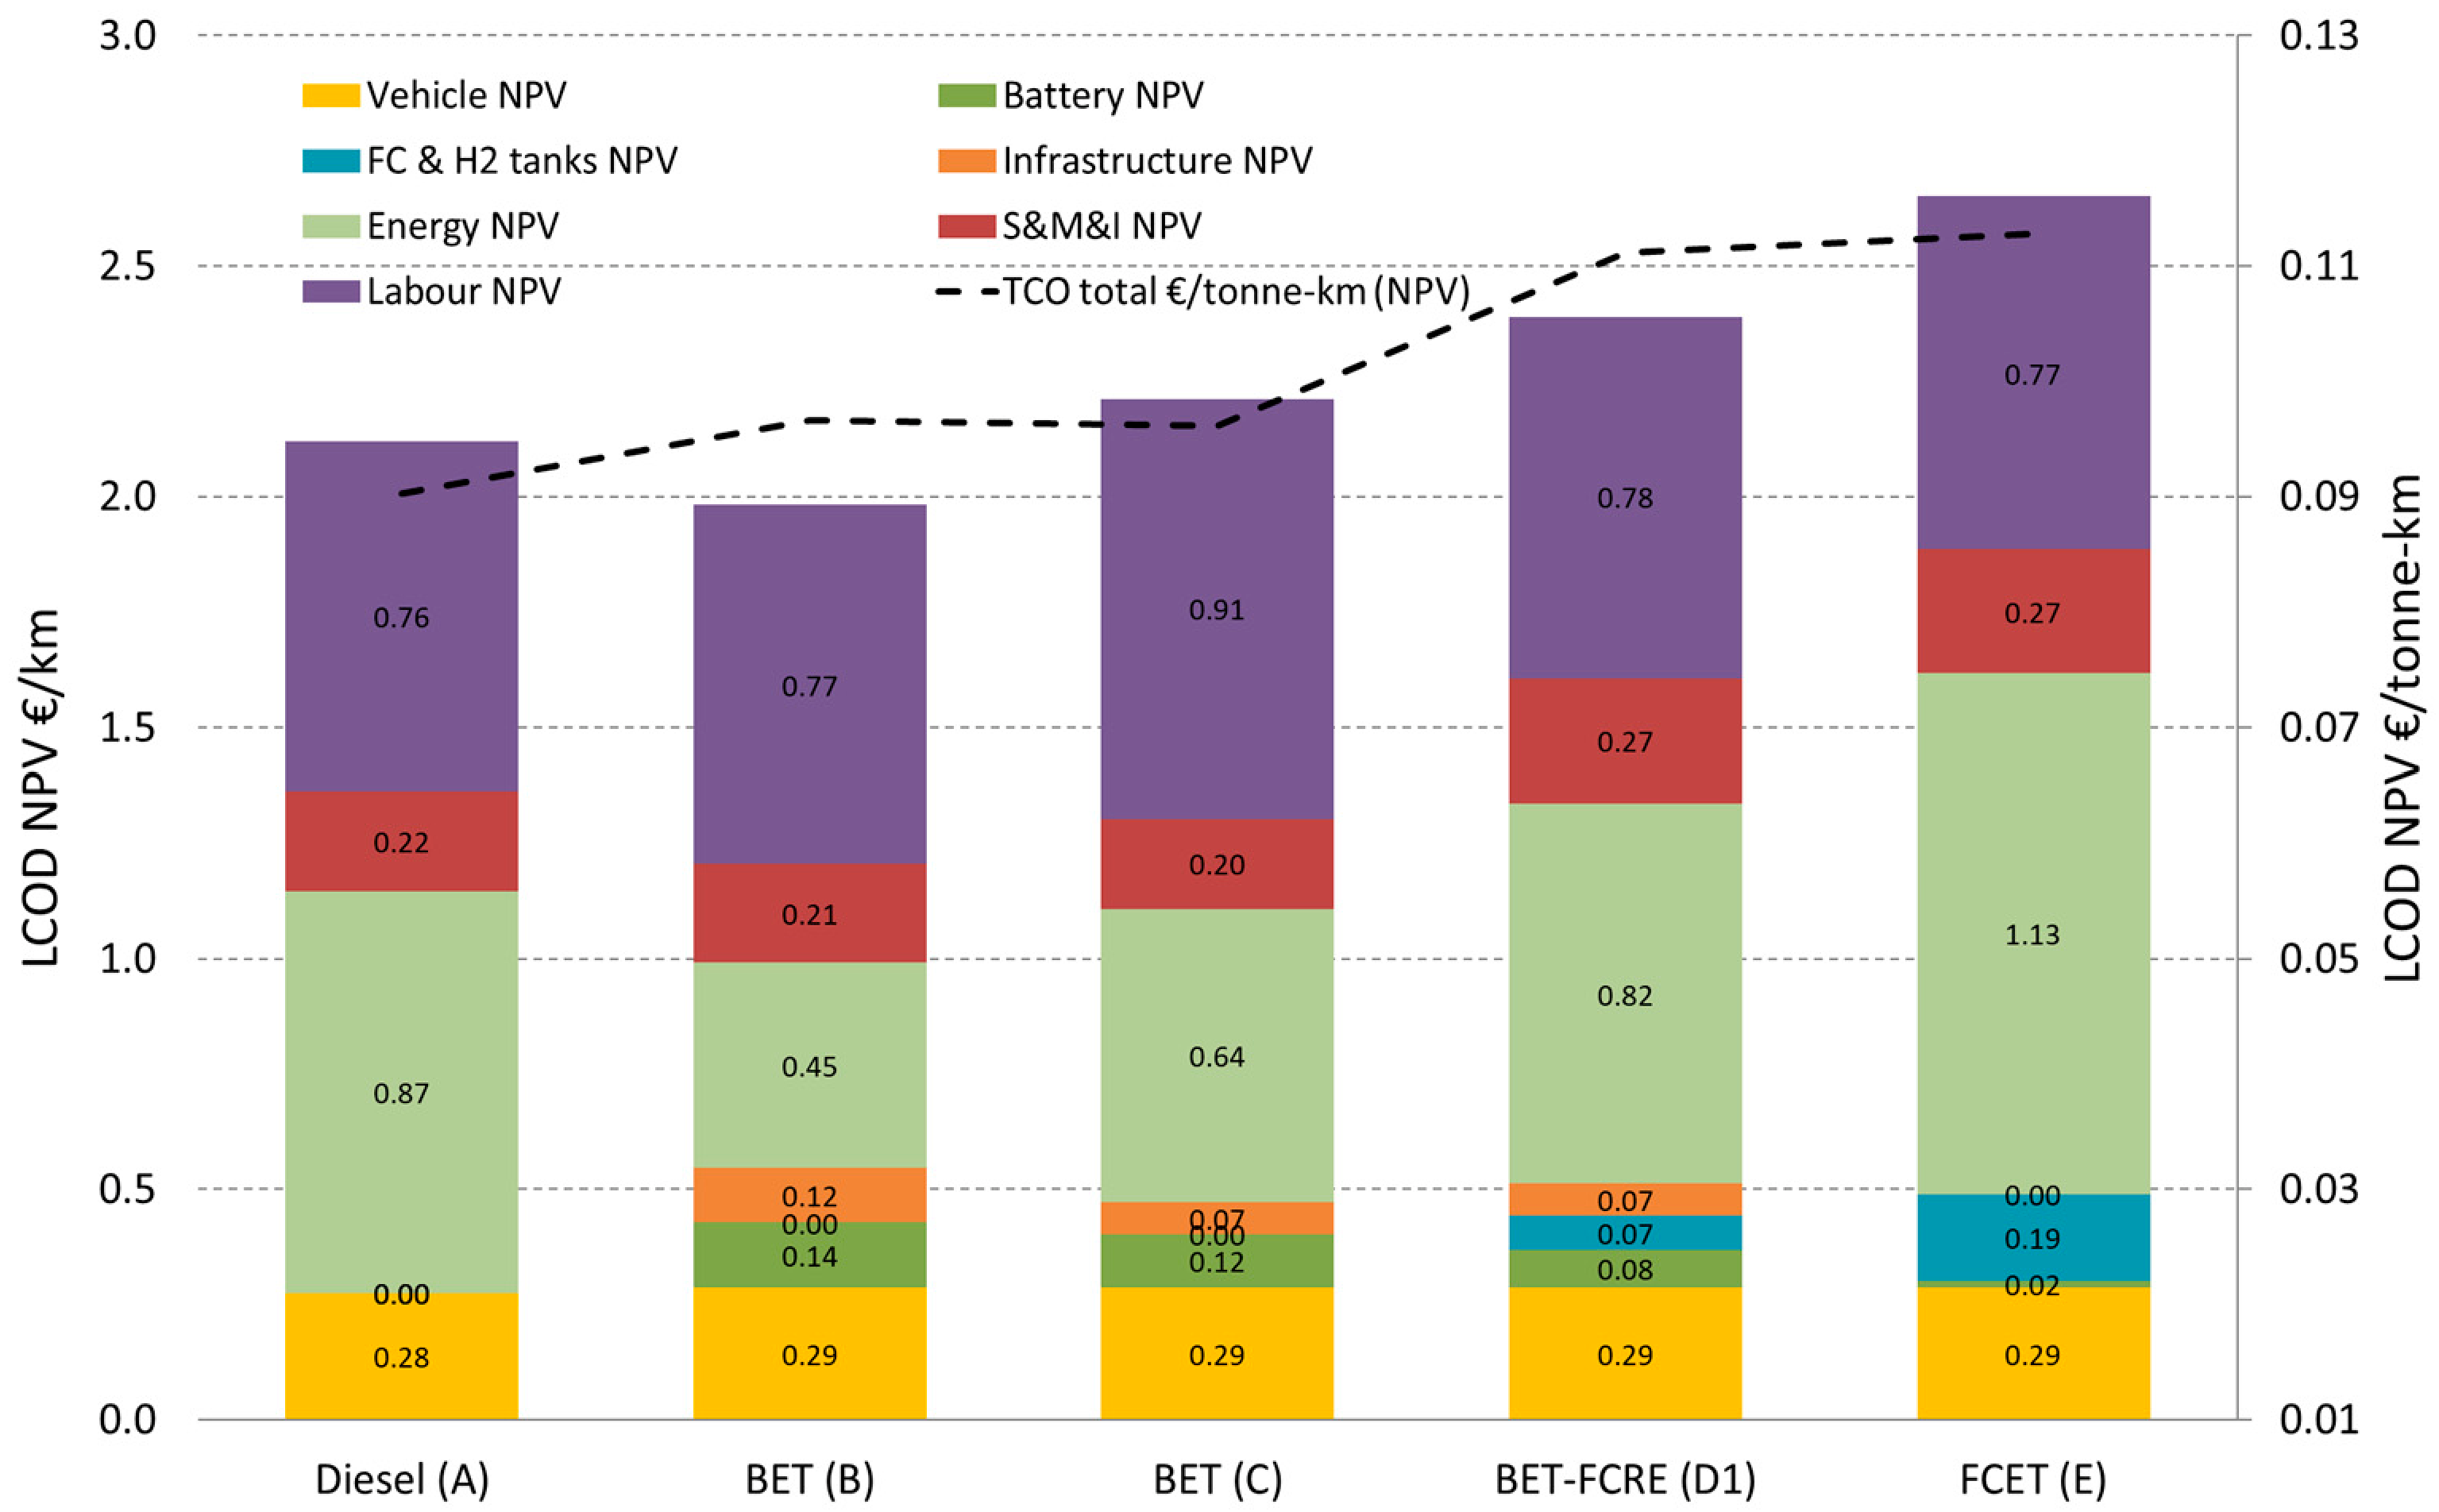
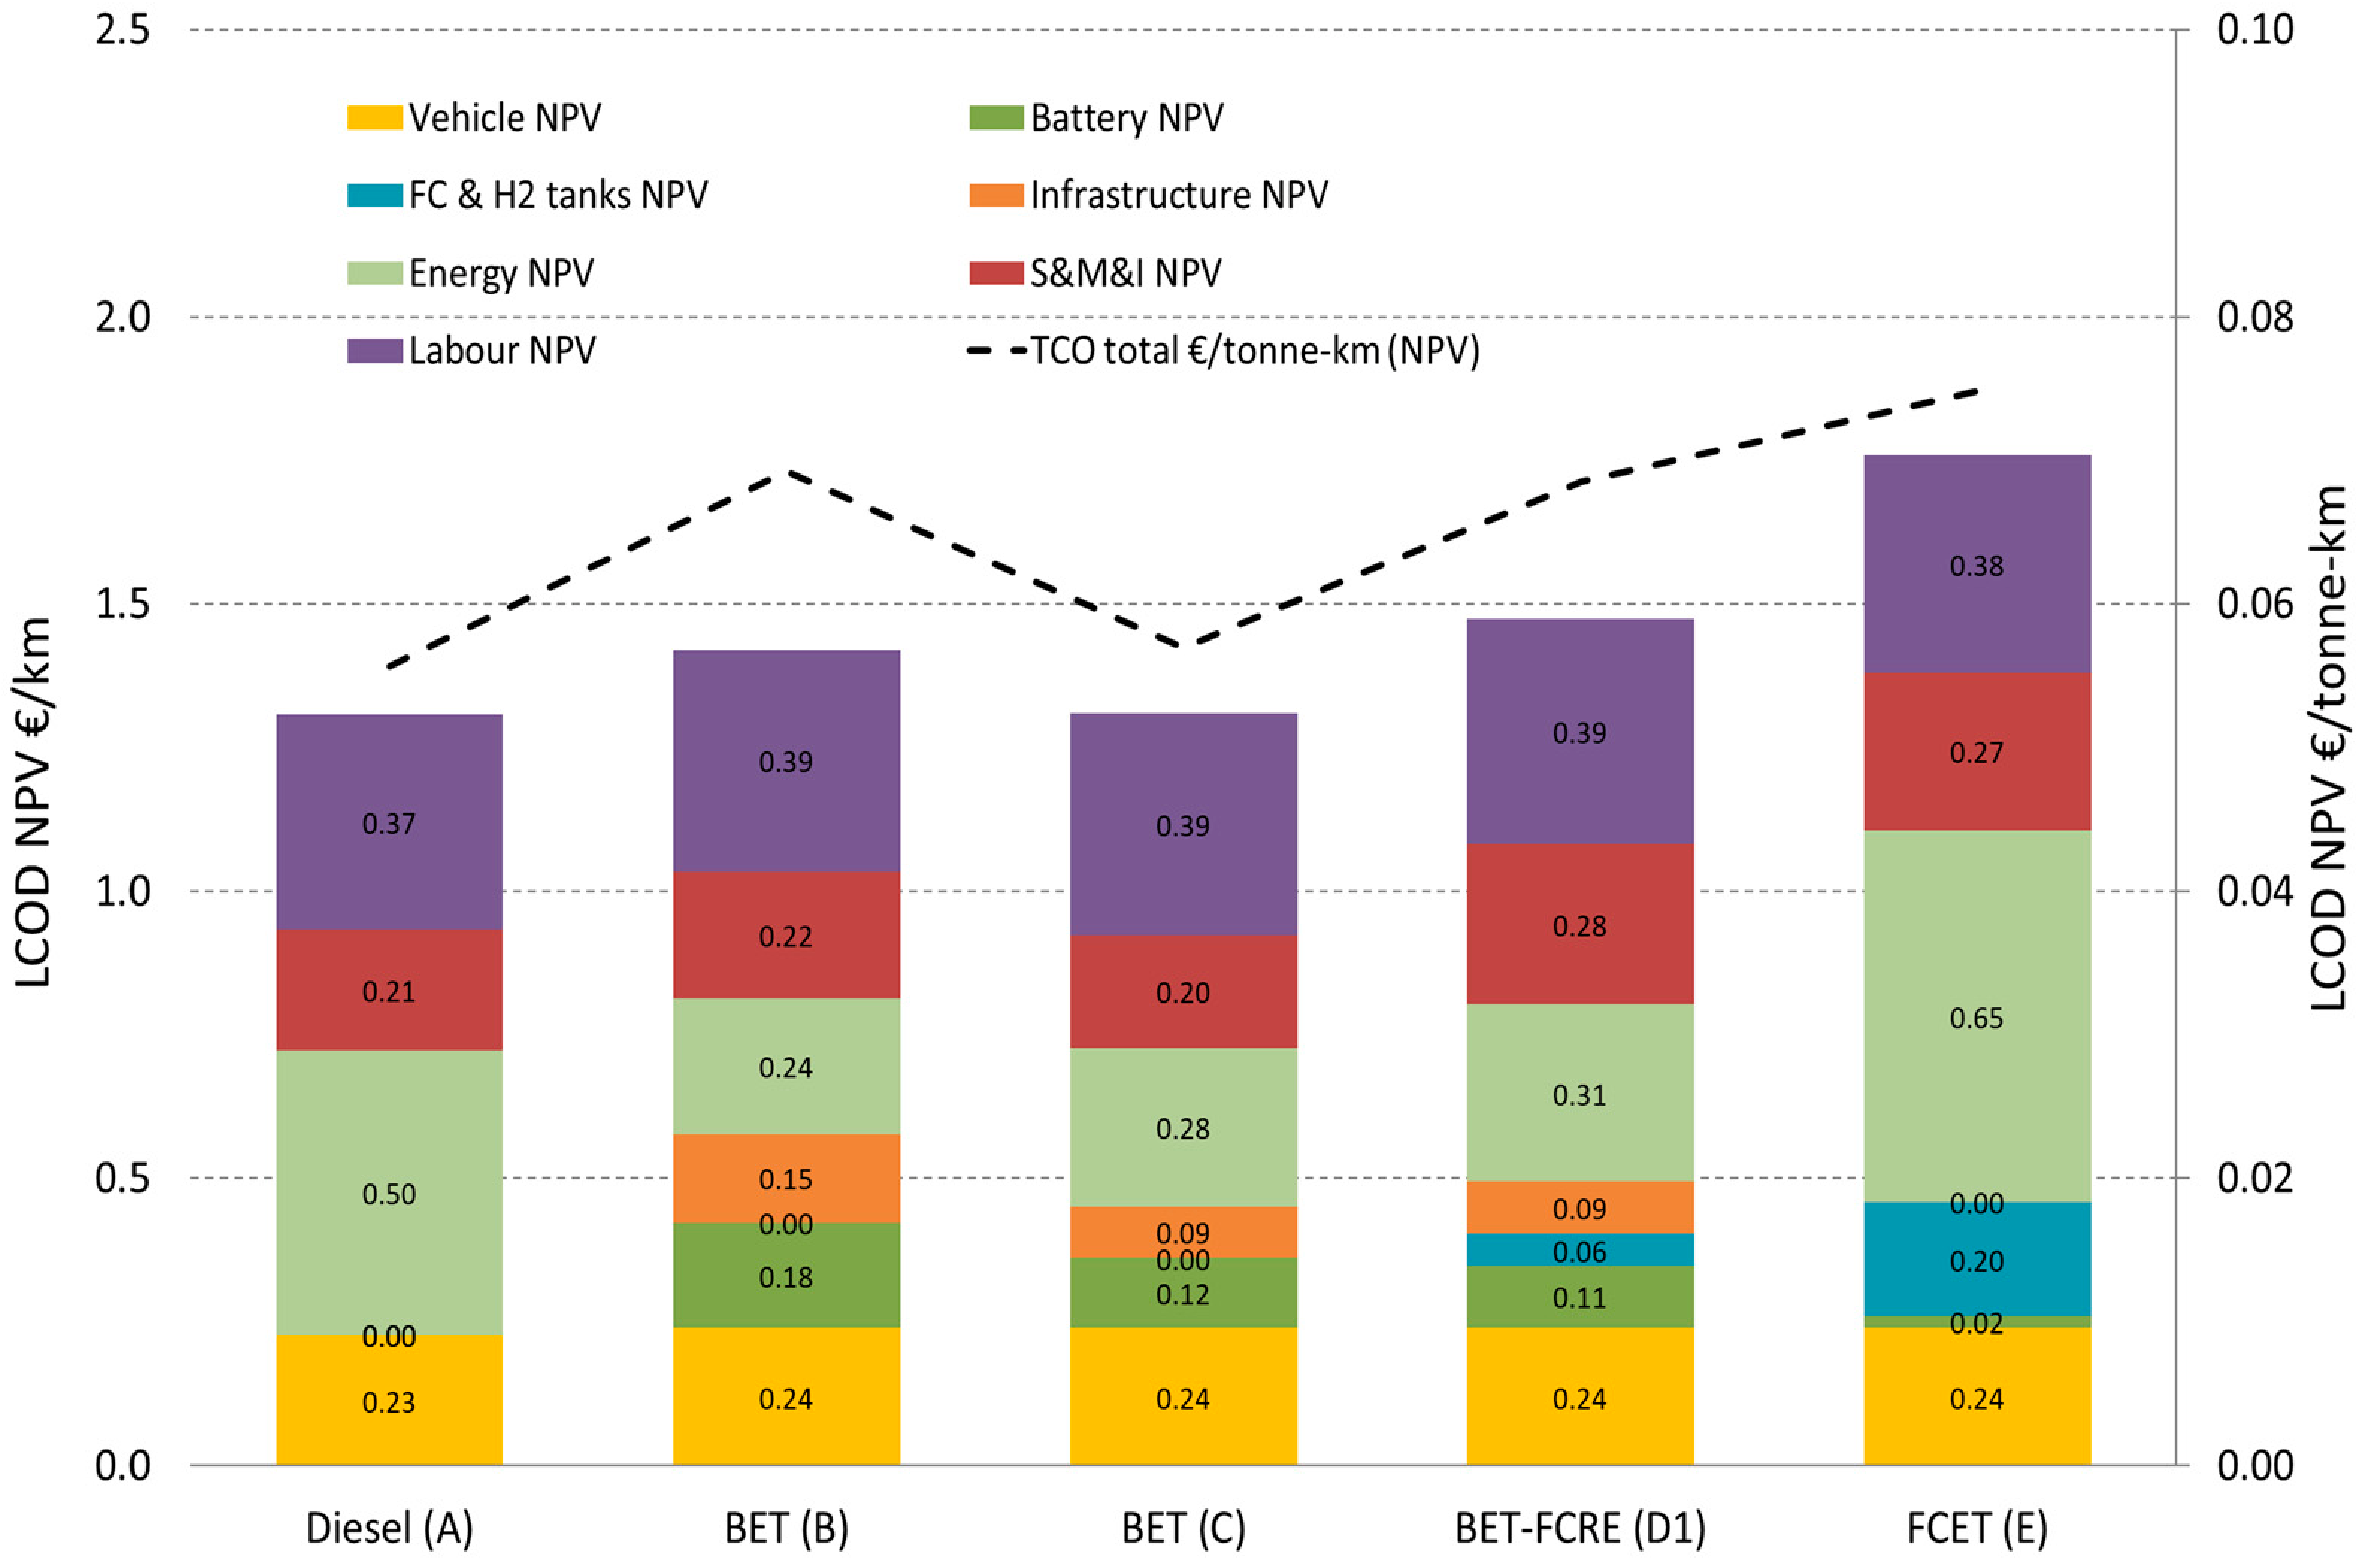
Critical analysis of the inputs used in the present TCO analysis reveals that the main differences between the four pilot cases studied arises from energy cost categories. Most of the financial and contractual inputs as well as residual values were kept constant across the pilot locations due to a lack of relevant information on such local variables. For energy consumption assessment through simulations, all five vehicle/powertrain variants were analysed in each location and errors between the powertrain variants pending validation A-E are likely to be systematic. At the same time, variations in energy commodities listed in
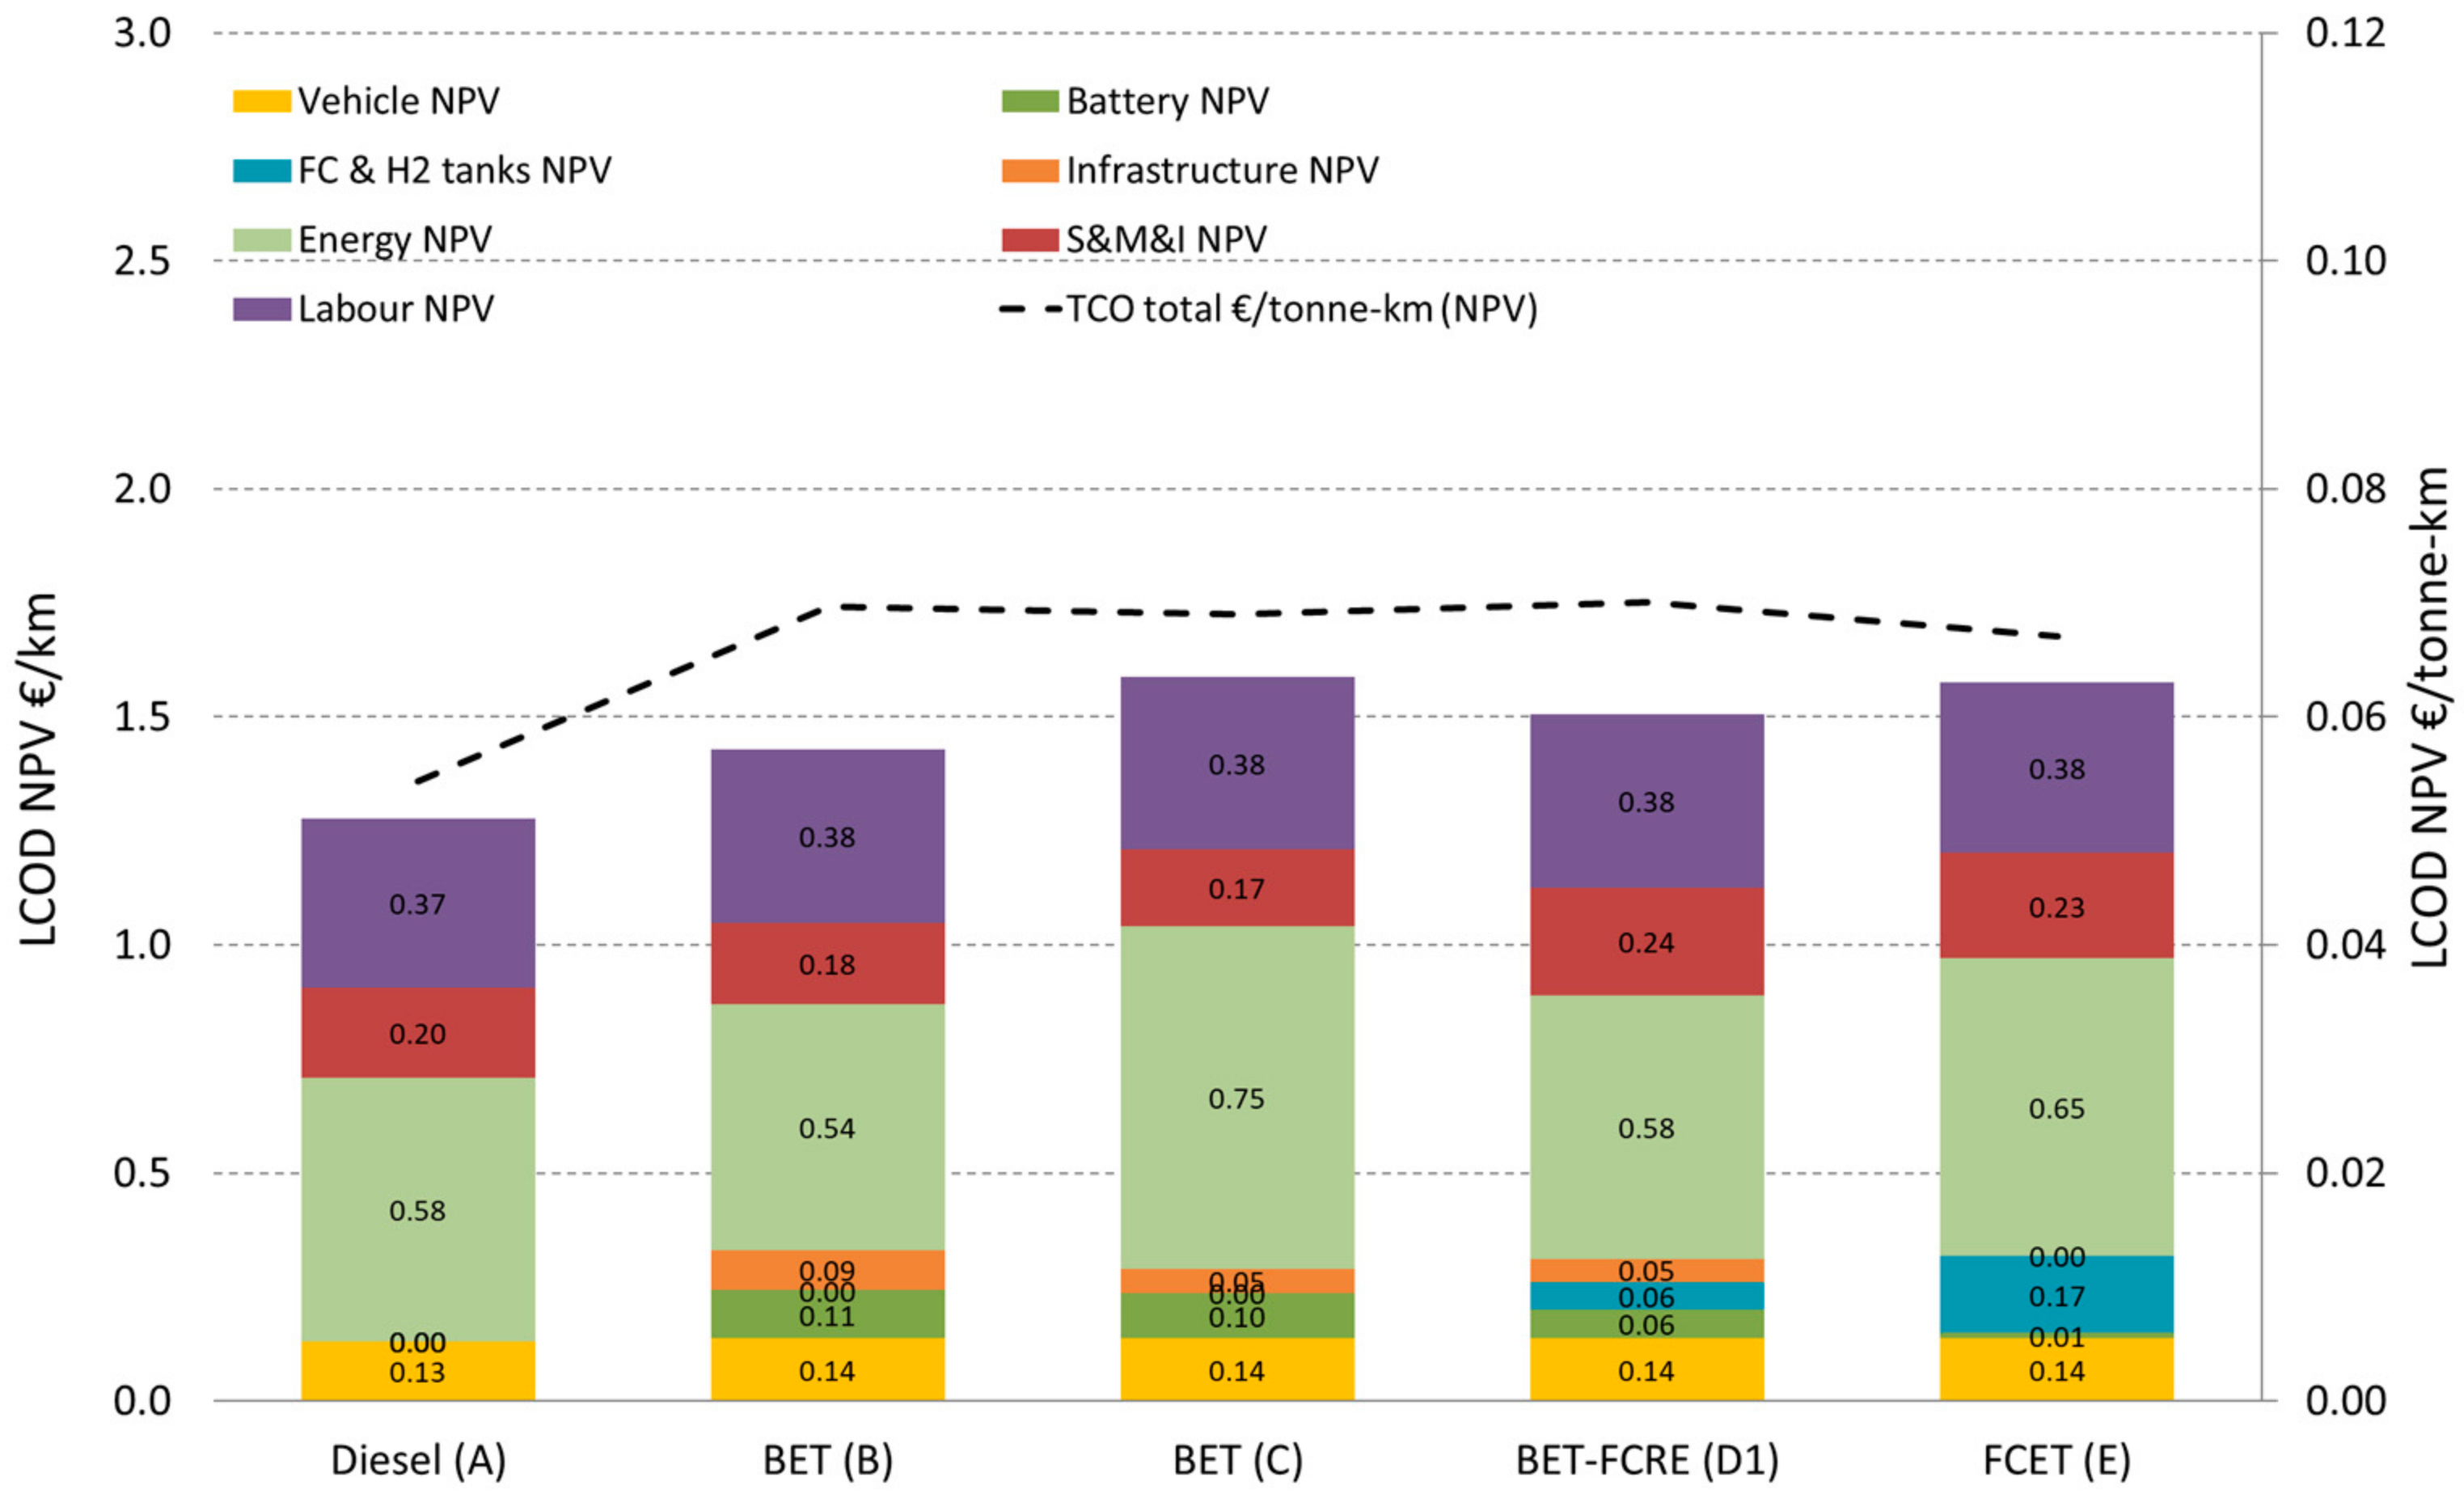
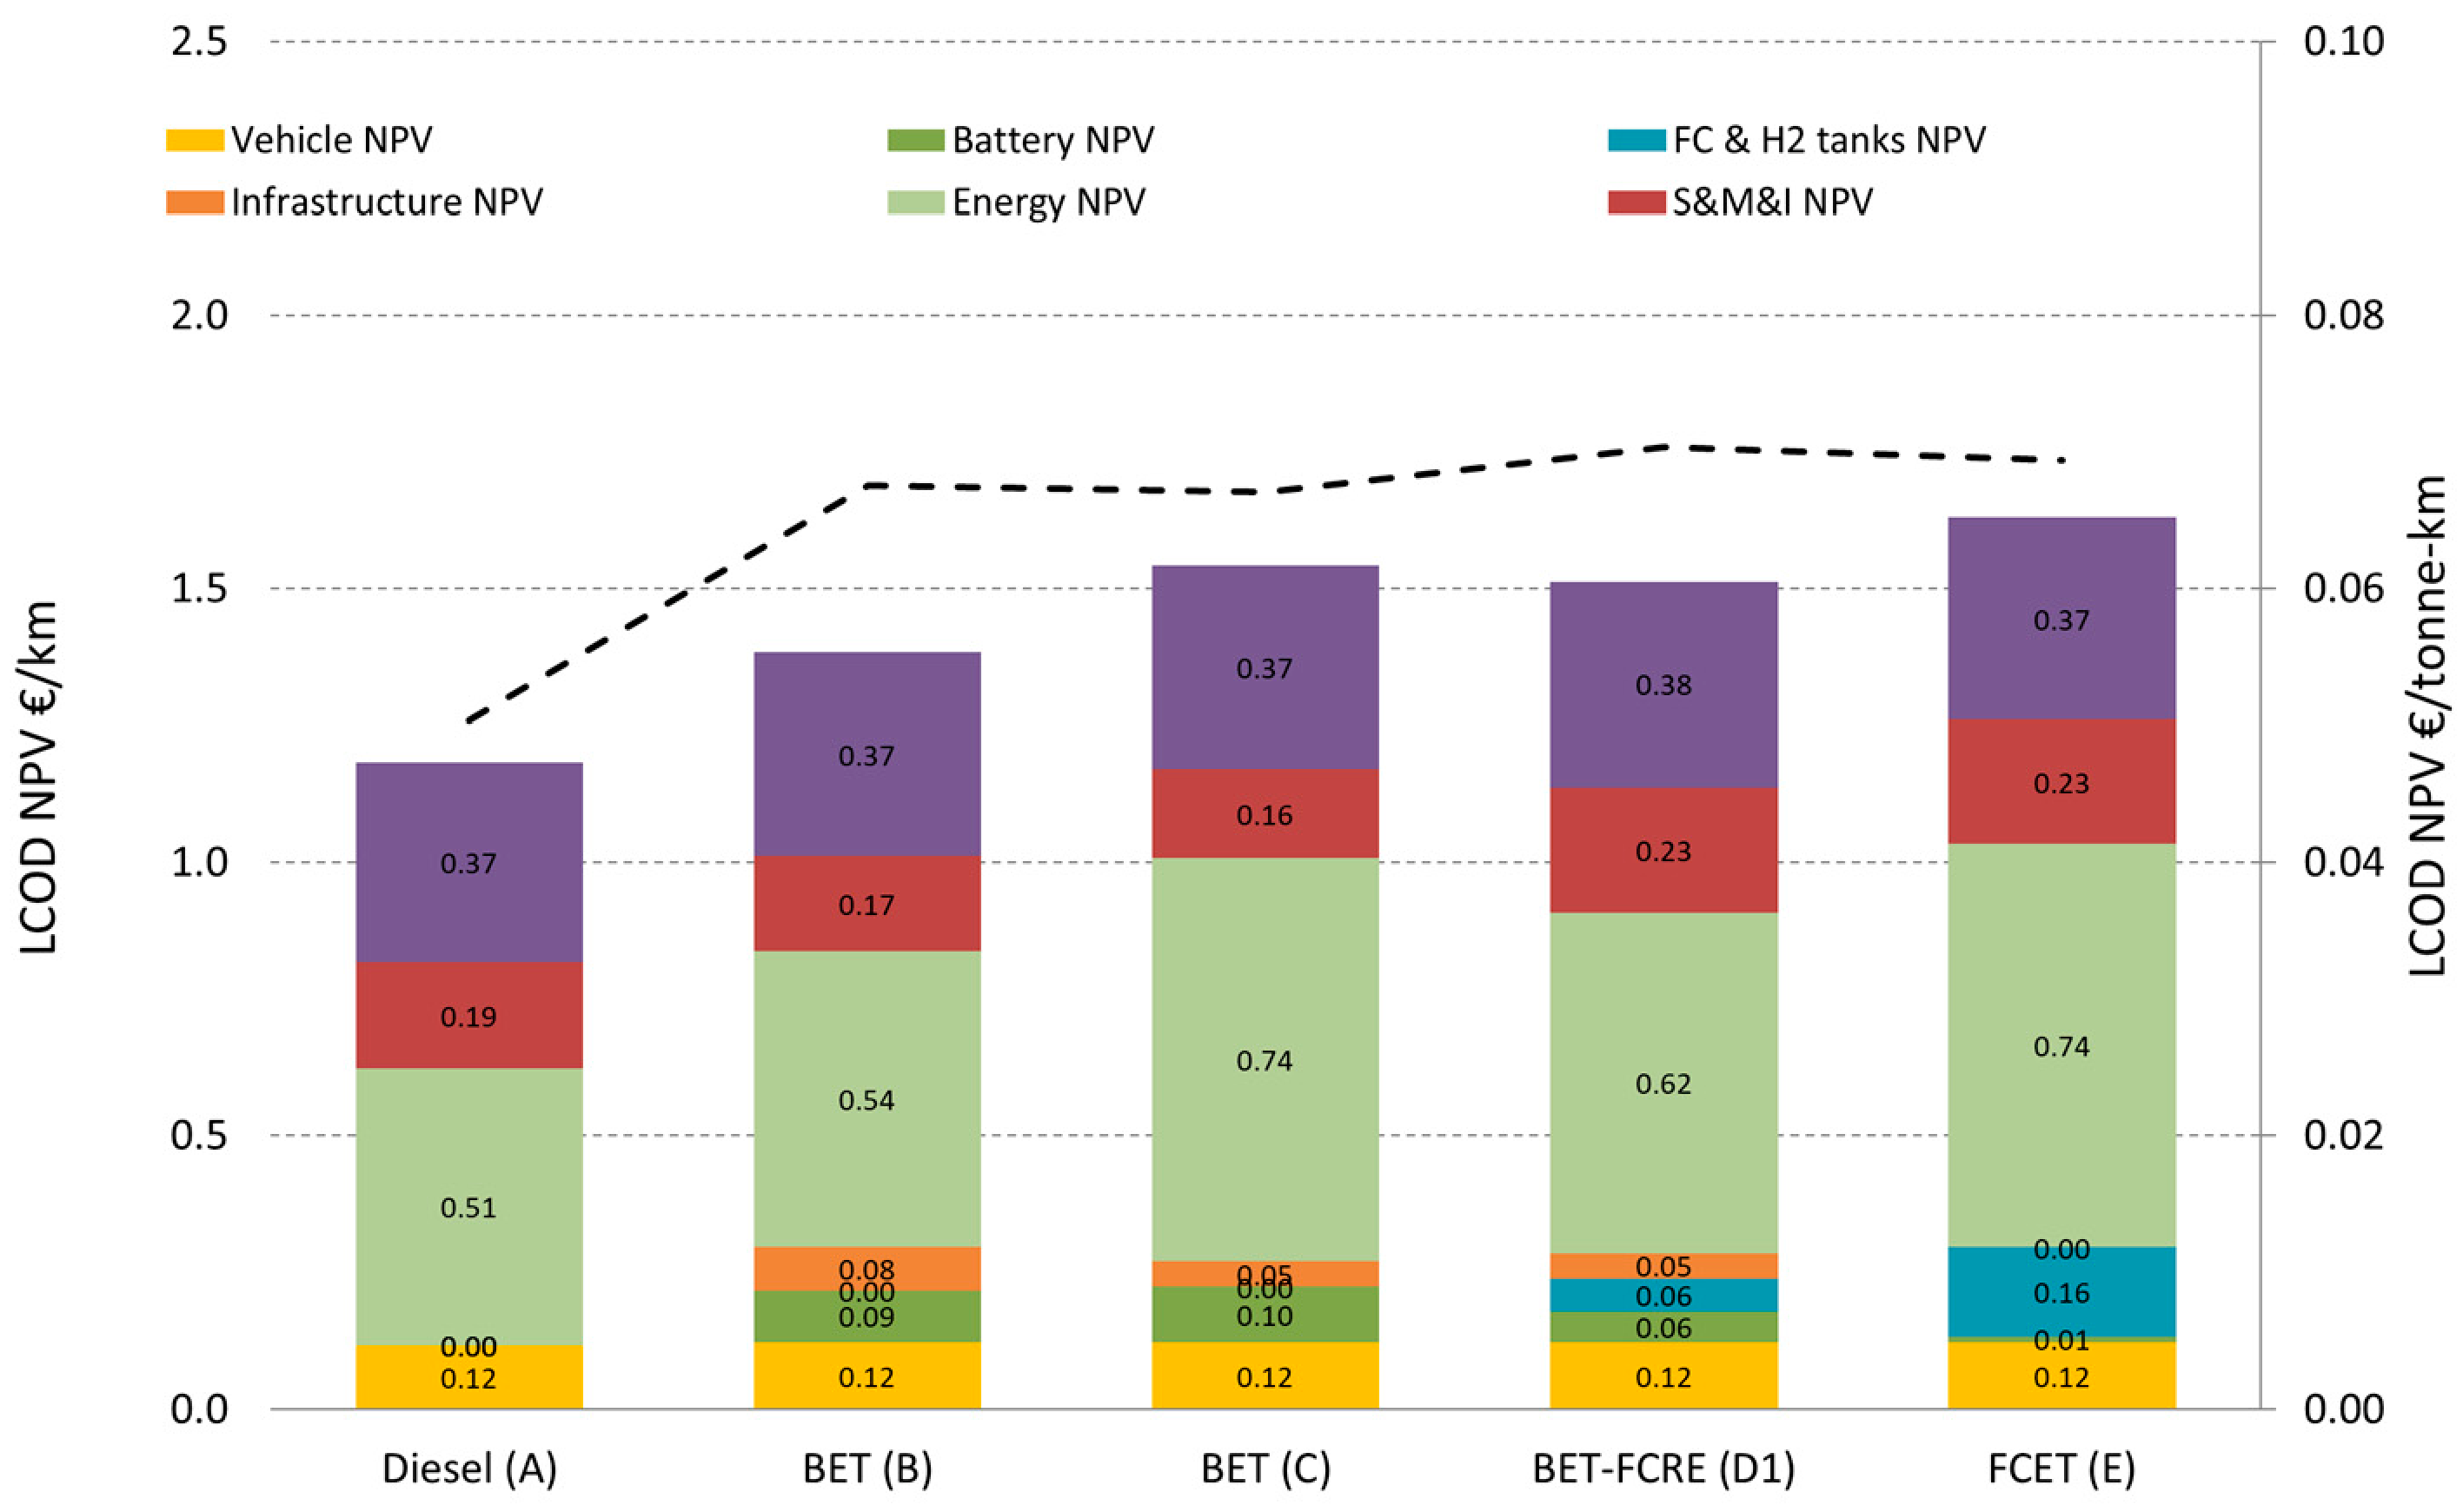
Table 4 lead to quite large differences in energy costs across the pilots as shown by the light-green bars in
Figure 3,
Figure 4,
Figure 5 and
Figure 6.
The overall setting of the present analysis therefore enables only a qualitative sensitivity analysis mostly related to the energy costs.
Table 6 shows a summary of the energy price of diesel, private electricity, public electricity and hydrogen, all converted to the same unit €/kWh of energy for each pilot. The lower part of the table calculates the price differential for the energy carrier compared to diesel; in all cases diesel (in 2024) was the cheapest alternative, and a positive gradient shows how much more expensive electricity or hydrogen was in the analysis. These price gradients constitute the energy price drivers in each pilot’s local context. For electricity, pilots 1 (FI) and 2 (TR) show the largest energy cost drive (gradient) vs. diesel, whereas pilots 2 (TR) and 4 (UK) are slightly more favourable for H
2 than the other pilots.
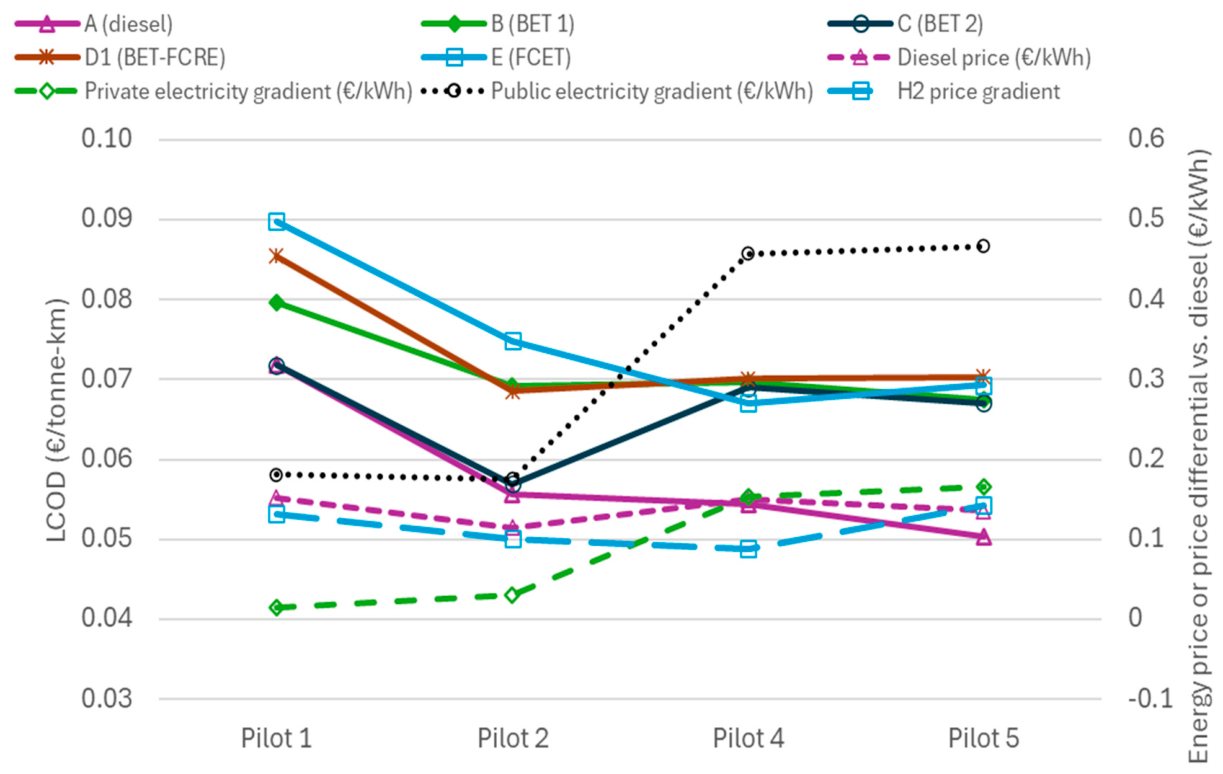
Figure 7 summarises the TCO (LCOD) in terms of €/tonne-km for each of the five powertrain variants and the four pilot location across the ESCALATE demonstration baselines. The price level of fossil diesel in 2024 constitutes a baseline which is only paralleled by BETs (C) in pilots 1 and 2. If the comparison would be made in terms of €/km (valid for volume-constrained transports), BETs (B) would also compete with diesel in pilot 1. A remarkable effect and sensitivity to energy prices leading to reduced competitiveness in terms of TCO between the variants can be observed for pilot 4 (UK) and pilot 5 (FR/ES) where the electricity is more expensive than in pilots 1–2 whereas, surprisingly, H
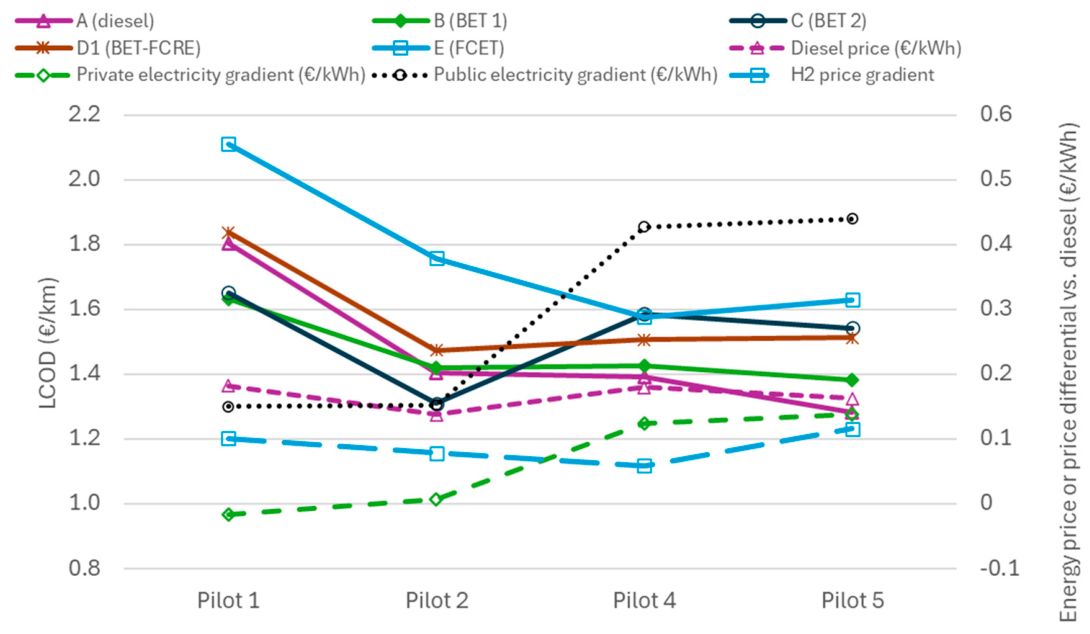
2 price is assumed to be much more evenly priced. Yet another sub-study was done focusing on the sensitivity of the relative TCO competitiveness to a diesel price increase of 20%.
Figure 8 shows the results across the pilots, expressed now in terms of LCOD €/km (volume-constrained transports). In this comparison, pilot 1 shows both BETs as the cheapest option and pilot 2 suggests lowest TCO for variant C (BET2), whereas diesel remains as the cheapest option in pilots 4–5, although with a much narrower margin.
This qualitative sensitivity study stresses the importance of cost-optimised and resilient energy sourcing at a competitive price for the freight operators.
The initial results shown in this paper will be cross-checked for inputs and assumptions at later stages of the follow-up analysis and will likely produce additional pilot-specific detailed studies and scenarios. Several parameters in the baseline TCO carry some uncertainty and are country- and time-dependent, e.g., electricity prices, public charging availability, hydrogen price, utilisation and technology CAPEX. As energy-related costs contribute significantly to the TCO, the dependency of energy consumption on external parameters such as ambient temperature, road condition, payload, driving speed and driving style are all location- and scenario-specific and warrant further studies. To improve robustness and interpretability, the next assessment step will include structured sensitivity analysis and multi-parameter scenarios, preferably using a statistical approach, reporting the impact on TCO and identifying which levers dominate TCO outcomes.
5. Conclusions
A range of different zero-emission truck powertrain and system implementations were analysed in terms of their powertrains, vehicular configurations and operational aspects, to cross-analyse the planned truck demonstrations in the ESCALATE project. In total, five different vehicle configurations operating on four geographically different routes in different parts of Europe were analysed. The initial results show that great variety exists in terms of powertrains, vehicle configurations, energy and infrastructure use as well as the market parameters. The relative competitiveness of the different configurations and prime mover variants depend on several factors such as the essential capital and operational costs, energy price and consumption, powertrain dimensioning and performance.
Overall, the TCO analysis shows several key factors affecting the relative competitiveness of the different zero-emission powertrains and vehicles. A primary qualitative finding in the comparison was high impact of relative gradients between energy carriers for the different prime movers. Long-haul operation poses clear challenges to vehicle design and long-range vehicles on single charge or refill show increased curb weight limiting allowable payload due to GVW limits. The best payload capacity is shown for opportunity charging BETs and FCETs. BETs are generally the closest competitor to conventional trucks, but a key factor is the relative energy price difference between diesel, electricity (private or public) and hydrogen. Energy sourcing will be an important factor for end users to enable the competitive shift to zero-emission options. Access to cheap private electricity or local green hydrogen may facilitate a choice between the options.
The research in the ESCALATE project continues as the demonstrator vehicles are commencing their real-world piloting. Based on this initial baseline TCO analysis, further research will update and elaborate this baseline based on the final data and operational insights. Another future track of research will be to conduct full sensitivity analysis covering technology, operational and market parameters and the foreseen development scenarios.





 ,
,