1. Introduction
The adoption of battery electric vehicles (EVs) has thus far predominantly taken place in households residing in single-family houses [
1]. One important explanation for this pattern is that such households generally have favorable technical, spatial, and legal conditions for installing private home charging infrastructure. Access to home charging reduces the effort associated with EV ownership and enables charging to be integrated into everyday routines, which has been shown to be a key driver of EV adoption even in regions without strong policy incentives [
1].
The importance of home charging for EV users has been consistently highlighted in previous research. Real-world charging data show that when home charging is available, it accounts for the majority of charging events and is strongly associated with higher convenience and predictability for users [
2]. Reviews of consumer interactions with charging infrastructure further confirm that access to private or semi-private charging is one of the most influential factors for EV adoption and everyday charging behavior [
3].
As EV markets mature and policy goals aim for large-scale diffusion, reliance on households with access to private parking and home charging is no longer sufficient. A substantial share of the population in many countries resides in multi-dwelling units or housing contexts characterized by shared or on-street parking, where residents often lack both the physical possibility and the legal mandate to install private charging infrastructure. Research on charging infrastructure requirements suggests that such structural conditions pose significant challenges for achieving high EV penetration in dense urban areas and risk limiting adoption if charging strategies are not adapted to these contexts [
4].
Although a growing body of literature has examined charging behavior among EV users, most empirical studies implicitly focus on users with access to home or workplace charging. As a result, empirical knowledge about how EV users adapt their daily routines and charging strategies when home charging is not available remains limited. The relevance of this knowledge gap is particularly pronounced in urban contexts, where parking availability varies substantially between and within countries. An investigation in Denmark found that while approximately 80% of households nationwide have access to parking at their residence, the corresponding share in the capital city of Copenhagen is only around 20% [
5]. This is one example of the scale of the challenge faced by urban households and suggests that a significant proportion of potential EV users may lack access to home charging.
Recent research highlights inefficiencies in the utilization of existing charging infrastructure in multi-dwelling units (MUDs). The average maximum utilization rate of charging infrastructure in MUDs has been estimated at only about 29% [
6]. At the same time, the installation and use of home chargers in MUDs can be hindered by capital and installation cost burdens [
7]. These structural and economic constraints suggest that alternative organizational models may be required. In mixed land-use areas where residential and commercial activities coexist, shared parking and charging management within MUDs may represent a potentially viable business model that increases utilization rates while improving access to charging for residents without dedicated home charging availability.
Complementary to business alternatives, policy measures could also address the issues related to inefficiencies in the utilization of charging infrastructure. Policy measures influence when and how often EV drivers use public chargers, showing relatively low utilization during daytime hours and varying occupancy patterns depending on policy implementation [
8]. More broadly, research on mobility transitions has emphasized that such structural conditions can influence how disruptive innovations, including electric mobility, are adopted across different societal groups [
9].
Addressing this gap is increasingly important from both policy and planning perspectives. Without a better understanding of how EV users without home charging manage charging in everyday life and perceive public charging infrastructure, there is a risk that charging strategies primarily focus on advantaged user groups, thereby reinforcing inequalities in access to electric mobility. Insights into this group are essential for informing infrastructure planning, regulatory frameworks, and commercial charging services aimed at enabling a broader and more equitable transition to electric mobility.
The aim of this study is to investigate what the sociodemographic characteristics, charging behaviors, daily routines, and perceptions of public charging among EV users without access to home charging are. By providing empirical evidence regarding this under-studied user group, the study contributes knowledge that is directly relevant for infrastructure planning, policy development, and commercial decision-making related to the expansion of public charging networks.
The study addresses the following research questions:
RQ1. Do EV users who do not have home charging availability differ from EV owners who have home charging in terms of sociodemographic variables, behavioral patterns, attitudes, and perceptions of public charging?
RQ2. What are the main needs of Swedish EV users who do not have home charging availability?
RQ3. What are the charging behavior patterns of EV users without home charging?
RQ4. How do EV users without home charging perceive public charging infrastructure?
2. Materials and Methods
An online survey was sent out by a parking and charging operator to EV users, the majority of whom were in Gothenburg. The survey covers overall evaluations of routines for charging, such as charging location, possibility of charging at work, and overall evaluation of public charging. An appendix with the survey questions is available upon request to the authors.
A convenience sample of 250 respondents completed 80% of the survey’s questions (86 incomplete surveys were not considered for the analysis). The majority of the respondents are men (N = 195; 78%), with no children in the household (N = 161; 64.4%), and living in an apartment owned (N = 106; 42.4%) or rented (N = 90; 36%). They mostly own/lease one car (N = 195; 78%), the majority of the cars are Battery Electric Vehicle BEVs (N = 179; 71.6%), and a total of 119 respondents (47.6%) reported not having home charging availability.
The survey comprised 27 questions, divided into three main blocks: (1) driving and charging behavior (frequency of charging, charging availability, types of charging), (2) attitudes and perceptions of EV users (perceptions of public charging infrastructure, availability, comfort, price), and (3) sociodemographic characteristics (household characteristics, amount and types of cars in the household, and presence of children in the household, gender, and age).
The respondents were divided into two groups based on the question: “Think about your routine at home, do you have access to a charger when you park at home?”. The options for answers were: “No”, “Yes”, “Yes, but it is rarely available when I want to charge”, “I don’t know”, and “Not applicable”. For the purpose of the analyses, two groups were formed: the Group without home charging availability (those who answered “No”) and the Group with home charging availability (those who answered “Yes” and “Yes, but it is rarely available when I want to charge”). The other answers were not considered for analyses. The two groups accounted for 80% of the respondents to the survey.
The block of questions covering attitudes and perceptions (block 2 of questions) was further analyzed with inferential statistical testing, in order to identify what factors differ between the two groups. Because these questions were measuring latent variables, they are inherently subject to greater variability from individual experiences and subjective assessments compared to the more descriptive variables in Blocks 1 and 3. Therefore, inferential statistical methods were employed to ensure the robustness of the findings by controlling for individual-level variation and verifying that observed group differences are statistically significant rather than driven by random variation. Variables included in regression models were those capturing perceived usability and experiential aspects of charging, while the variables from Blocks 1 and 3 (e.g., descriptive sociodemographic characteristics or general usage patterns) were analyzed descriptively to provide contextual background.
3. Results
This section is organized by the four research questions stated in the introduction. The results focus on the group of interest in this study—EV users who do not have home charging availability.
RQ1—Do EV users who do not have home charging availability differ from EV owners who have home charging in terms of sociodemographic variables, behavioral patterns, attitudes, and perceptions of public charging?
Table 1 shows the sociodemographic differences between both groups, addressing the first research question RQ1. There were no substantial differences between the groups regarding gender, age, presence of children in the household, number of cars, car types and time of car ownership. The only difference is that the group without home charging availability have a prevalence of residence in apartments.
RQ2—What are the main needs of Swedish EV users who do not have home charging availability? RQ3—What are the charging behavior patterns of this group?
The results that address research question RQ2 and RQ3 are interconnected, as they both show the needs and current behavioral patterns of EV users. These results are also reported with comparisons between the two groups—users with and without home charging availability.
Distance to public charging: Respondents were asked to type the distance in meters to the most used public charger and the closest public charging to their homes. The median for the group without home charging was 500 m (SD = 3893.9), and for the group with home charging availability, the median distance was 400 m (SD = 45,796.28). When asked for the distance to the closest public charging to their homes, both groups reported a median distance of 300 m (SD = 4995.19 for the group with home charging availability and SD = 750.53 for the group without home charging availability).
Minimum State of Charge (minimum SoC): The participants were asked to type numbers in percentages of their preferred minimum SoC levels. Both groups with and without home charging availability reported a median value of 20% SoC (SD = 16.73 for the group with home charging availability and SD = 11.32 for the group without home charging availability).
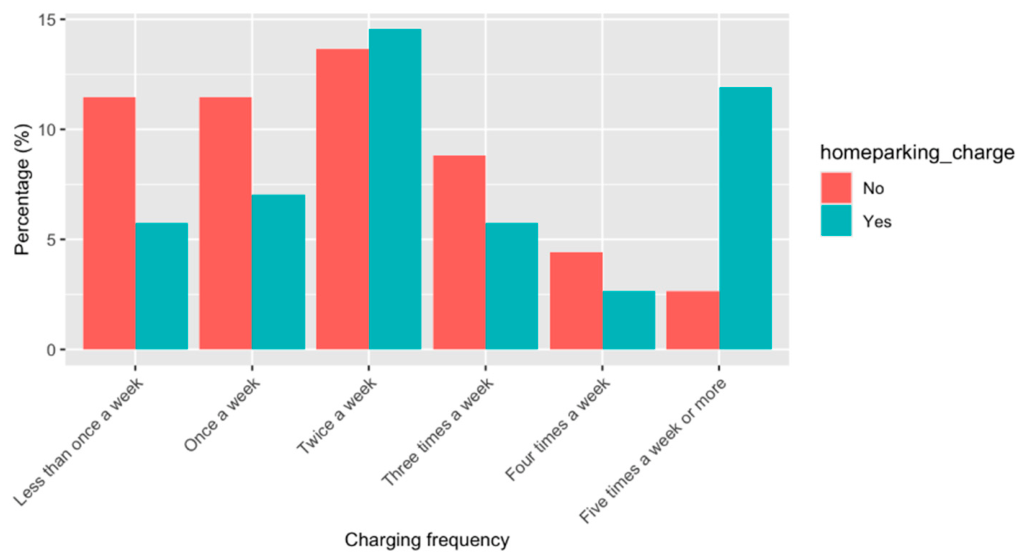
Charging frequency: The participants were asked to indicate in a multiple-choice question their charging frequency on a weekly basis. The median frequency of charging is twice per week for both groups (SD = 1.7 for the group with home charging availability and SD = 1.42 for the group without home charging availability) (see
Figure 1).
Charging triggers: To identify potential charging triggers, respondents were asked to select from a set of options the main determinants of when and where they charge their vehicles. Respondents could choose several options and no limit of options was set. The goals of this question were to (1) identify potential differences between the groups in terms of charging triggers; and (2) identify a potential pattern of triggers for charging. Therefore, some of the options were more goal-oriented, such as “I have a routine that I follow”, while others reflected a more spontaneous approach, such as “When I pass by a charging station”. The complete list of options was:
“When I reach a certain percentage/km left in the battery.”
“When I pass by a charging station.”
“Convenience.”
“Low price.”
“When I have free time.”
“I have a routine/strategy that I follow.”
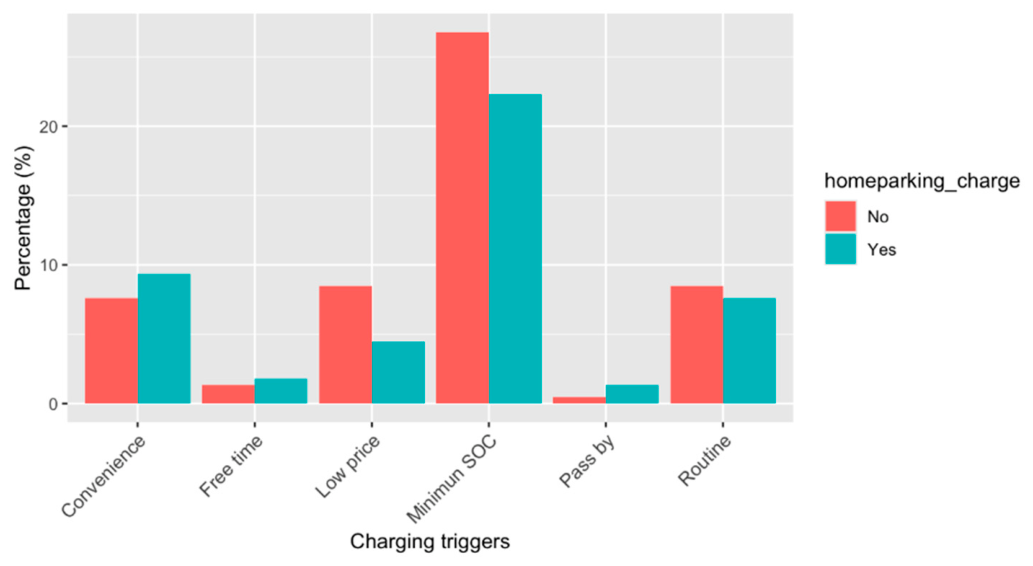
As shown in
Figure 2, for both groups, the minimum SoC was the main charging trigger. Additionally, for both groups, the more spontaneous triggers “When I have free time” and “When I pass by a charging station” were the least selected options, indicating that charging is rather a goal-oriented behavior than spontaneous.
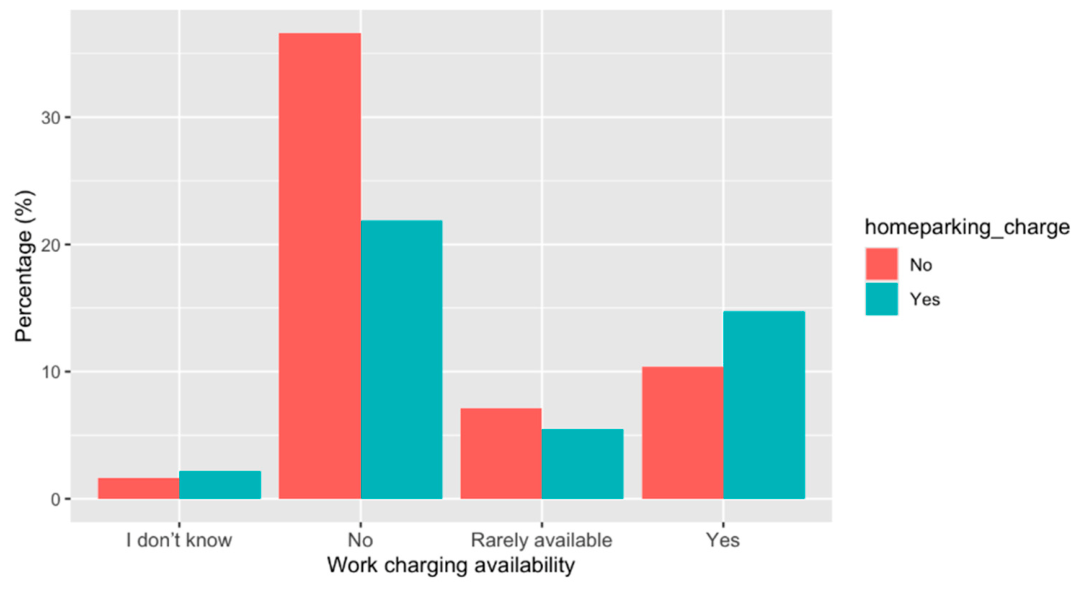
Charging availability at workplace: The participants were asked to indicate in a multiple-choice question if there were chargers available at their workplace. The group without home charging availability also reported having less availability for charging at work, if compared to the group with home charging availability (see
Figure 3).
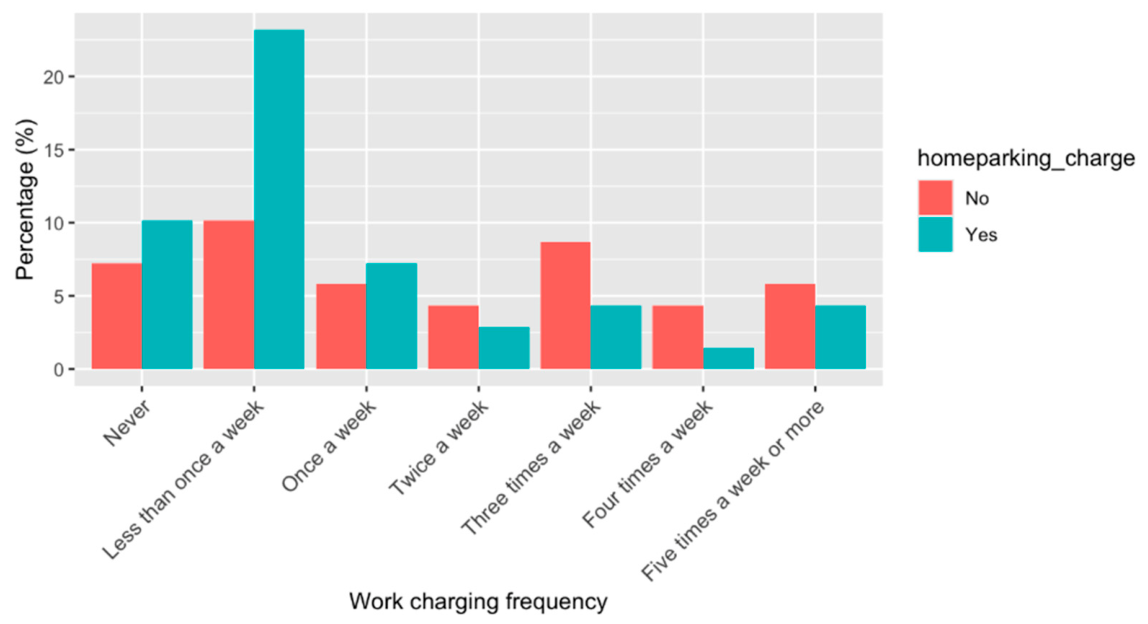
Charging frequency at workplace: Those that reported having some availability for charging at work were asked to indicate in a multiple-choice question how often they charge their EVs at their workplace. The group with home charging availability reported charging less than once a week at work (Median = 2; SD = 1.77) and the group without home charging availability reported charging once a week at work (Median = 3.5; SD = 2.03). See the results in
Figure 4.
RQ4—What are the perceptions of public charging of EV users without home charging availability?
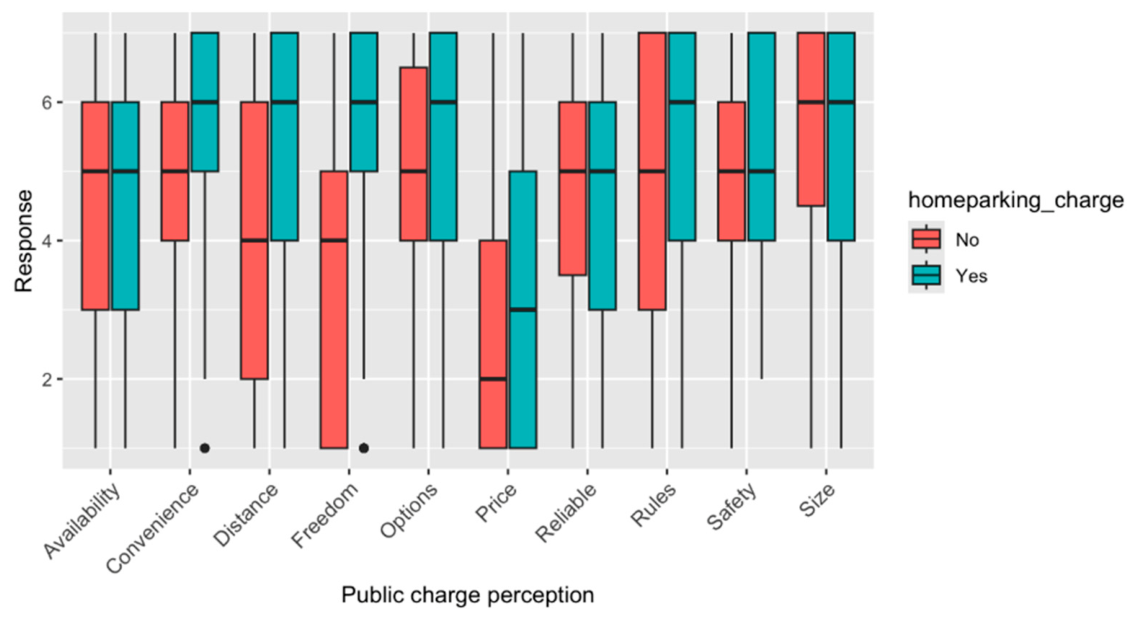
To address research question RQ4, 10 independent latent variables related to public charging perception were measured using a 7-point Likert scale, where 1 means “totally disagree” and 7 means “totally agree.” The participants indicated on the Likert scale to what extent they agreed with the statements about the public charging station that they mostly use. The median and SD for each item about public charging perception are presented in
Table 2.
The reasons for asking about the public charging station that the participants mostly use were to facilitate the cognitive task of recalling their previous experiences and form an overall evaluation of them, and to reduce the variability of the qualities of different stations that the users may have previously encountered.
Figure 5 visualizes the responses of each item for both groups.
To test for differences between the two groups, linear regression models were performed, in which the variables Convenience, Distance and Freedom were set as outcomes and home charging availability as a predictor. For all three models, there is statistical evidence that the perceptions of users that do not have access to home charging were lower than those of users who have home charging availability (see
Table 3).
4. Discussion
This paper presents results that build upon knowledge of a previously overlooked group of existing and potential EV adopters—households lacking the ability to install their own home charger. Previous research has mainly focused on early adopters of EVs, a group that predominantly consists of households with the ability to install home charging. Conventional wisdom that most of the charging is done at home is based on studies with EV users who have home charging availability. This study and the research project from which it is based is one of the first research initiatives to target this specific group of users. More research is needed in this area for several reasons. First, vehicle owners residing in multi-dwelling houses have so far been laggards in EV adoption, and more knowledge is needed to understand why. Second, an improved understanding of charging needs and the preferences of users without home charging is important for enabling efficient policy and the commercial planning of placement and design of future public charging infrastructure. Actors with a commercial interest in public charging in urban environments ought to have significant financial incentives to explore this further, as this group will likely utilize public charging more than users with access to home charging. Initial evidence that commercial charging actors have an interest in understanding this group has been seen in the significant interest of these actors to participate in this research project. Third, limited access to charging may be a barrier not only for EV adoption but also an important factor for EV discontinuance in the future [
11].
In summary, the results of this study show that the group of users who do not have home charging availability perceive public charging as less convenient, further from their homes, and they have a lower perception of freedom to charge, compared to the group of users with access to home charging. This group also reported having less access to charging at work, and among those who have the ability to charge at work, the frequency was relatively low. Lower charging access at work for this user group is an interesting finding. If true for the large population of potential EV adopters, without access to either home or work charging these EV users or potential users will be completely reliant on public charging.
In terms of similarities, both groups have approximately the same distances to access charging infrastructure, their charging frequencies are similar (twice per week), and they report similar preferences for minimum SoC. Although the average charging frequency is similar, the results identified a behavioral pattern of frequent charging (five times per week) among a certain share of EV users who have home charging availability. This pattern may indicate a tendency to start charging as soon as the car is parked at home, regardless of the SoC.
Another similarity was the triggers for charging; for both groups, minimum SoC was the main charging trigger. Additionally, for both groups, the more spontaneous triggers “When I have free time” and “When I pass by a charging station” were the least selected options, indicating that charging is rather a goal-oriented behavior than spontaneous. This result suggests that charging behavior is triggered by economic factors, convenience, and routine, rather than spontaneous contextual factors. Therefore, we reason that the mere availability of charging locations may not be sufficient to fulfill the needs of these users. Their needs are rather connected to a routine, planned around the SoC and the minimum SoC that they feel comfortable with.
This is an interesting finding that should be explored further in future studies. First, the results indicate that charging infrastructure may be most effective when located in residential areas with a high share of multi-dwelling units, where access to home charging is often limited. In such contexts, public or semi-public charging infrastructure can play a compensatory role in ensuring equitable access to charging opportunities. This also points to a potential role for municipalities in facilitating collaboration between housing associations and parking operators. If housing associations have limited incentives or resources to invest in charging infrastructure, cities could support models where parking facilities are enabled to provide structured charging services. Second, the results suggest that charging facilities located in retail or shopping areas may not be the most preferred option for users in their current form. The utilization of such locations appears less interesting unless they offer faster charging technologies.
The sample size of the study is not large (N = 250), but it is in line with common practices in the literature concerning consumer behavior studies [
12]. However, other limitations are important to discuss regarding the sampling process, such as the geographical spread of this study and the convenience sampling. The recruitment process was managed by one parking operator and a charging point operator, mostly in Gothenburg city, which limits the representativeness of participants’ profiles, because they were all clients of these specific companies and were willing to answer the survey (e.g., convenience sample). Another limitation is the sample composition; with a majority of male respondents, gender aspects cannot be covered in this study, limiting the implications and understanding of women’s perception of charging infrastructure.
Evidence from studies in Sweden shows that home charging plays a dominant role in everyday electric vehicle use, with the majority of charging events occurring at the residential location, typically during overnight parking [
13]. Additionally, EV adoption has been shown to significantly increase household electricity demand, with charging concentrated in evening hours, placing additional pressure on residential energy systems [
14]. Studies of Swedish residential areas further indicate that existing electricity grids may face capacity constraints as EV penetration increases, particularly in settings where many users depend on home charging [
15]. In urban contexts such as Gothenburg, where a large share of residents live in multi-dwelling units with shared parking arrangements, these factors can limit access to home charging and expose the electricity grid to higher constraints.
An expansion of this study geographically and with more users would be highly relevant to better understand the behavioral patterns of EV users who do not own a home charger and rely on public charging, and in what ways the EV adoption curve will affect the electricity grid. A better understanding of this group of EV users is important for the design of government policy as well as for industry in how to better cater to the needs and preferences of potential EV adopters who will need to rely on public charging and other charging infrastructure not located at their point of residence.