1. Introduction
The rapid electrification of the transportation sector has positioned electric vehicles (EVs) as a cornerstone of sustainable mobility. As EV adoption accelerates, the demand for accessible, reliable, and cost-efficient charging infrastructure becomes increasingly critical. Integrating EVs into urban infrastructure presents both challenges and opportunities for parking operators and energy systems. Public charging stations, essential for supporting EV users, are increasingly viewed not only as service points but also as potential nodes for providing grid flexibility by modulating consumption, relieving network stress, and enabling vehicle-to-grid (V2G) technology. V2G allows bidirectional energy flow between EV batteries and the grid, positioning parked EVs as distributed energy resources [
1]. In this context, public parking lots emerge as promising assets to enhance grid stability, reduce operational costs, and unlock new revenue streams.
Parking lot operators are uniquely positioned in this sustainable transition. Due to their control over the spatial and temporal availability of chargers, they can provide scalable charging services while leveraging idle vehicle time and onboard energy storage. This allows them to participate in electricity markets, reduce peak demand, and contribute to ancillary services such as frequency regulation and load balancing. However, realizing these benefits depends on understanding real-world charging behavior and the operational dynamics of public parking environments.
In the literature, there has been several studies focusing on parking lot optimization. Awad et al. [
2] proposed a smart parking-lot based optimization model to minimize the operational costs by determining the optimal sizing of solar-based distributed generation along with EVs charging price by analyzing two scenarios: a coordinated and uncoordinated scenario of EV demand. The results show a reduction in costs for the coordinated case without the need for any distributed generation. Zanvettor et al. [
3] analyzed the problem of energy pricing under vehicle uncertainty and addressed it by proposing a new energy pricing strategy where the daily profit of the parking lot is guaranteed with a given probability level. Fallah-Mehrjardi et al. [
4] proposed a multi-stage stochastic programming approach using Stochastic Dual Dynamic Programming (SDDP) to optimize EV charging schedules in a public parking lot, considering admission control and uncertain future demands to minimize expected energy costs, and the results showed that the method significantly reduces total energy costs and rejected charging requests compared to a myopic strategy. Jhala et al. [
5] developed a centralized linear programming strategy for coordinating EV charging at renewable-powered parking lots, aimed to maximize parking lot operator profits under time-varying electricity prices while meeting customer demand and system constraints. Secchi et al. [
6] proposed a centralized smart charging algorithm for public EV parking lots using real EV charging dynamics, minimizing both EV charging costs for owners and electricity provision costs for the charging point operator, but without considering V2G capability. Chandra et al. [
7] proposed a three-stage Energy Management System for coordinated EV charging in community parking lots, demonstrating that day-ahead scheduling combined with real-time power management can significantly reduce peak loads and operational costs for parking lot operators. Bragatto et al. [
8] highlighted that DSOs must proactively assess hosting capacity and consider grid reinforcements as public EV charging infrastructure expands, underscoring the need for coordinated charging strategies from the network operator’s perspective. While these studies underscore the economic viability of optimizing EV parking lots, they focus solely on grid-to-vehicle (G2V) charging.
In contrast, V2G integration offers additional flexibility and revenue potential. Sevdari et al. [
9] reviewed the existing literature in terms of the flexibility potential of EV participation in different services through V2G and the potential returns of such services. Alinejad et al. [
10] proposed a particle swarm optimization to maximize the returns of a parking lot utilizing V2G services while addressing the randomness of the EV owners behavior. Harighi et al. [
11] proposed an aggregated stochastic model for car parks with multiple EV charging stations, estimating flexibility margins for intra-day ancillary service provision to the DSO, and showing that parking lot operators can offer both upward and downward flexibility. Sharma and Jain [
12] introduced a risk-averse stochastic optimization framework for parking lot operators participating in day-ahead energy and ancillary service markets via V2G, finding a 22% reduction in cost when shifting from risk-neutral to risk-averse scheduling. Chandra Mouli et al. [
13] proposed a work place PV-installed parking lot optimization with V2G services based on Mixed-Integer Linear Programming (MILP) optimization, in which results show a 32% to 651% reduction in costs for EV charging. Salvatti et al. [
14] proposes a dynamic programming-based Energy Management System (EMS) for microgrids integrating EV parking lots, PV generation, and dynamic loads, optimizing EV charging and discharging profiles to reduce grid dependence, enhance efficiency, and respect user preferences. Firouzjah et al. [
15] developed an energy management strategy for public parking lots integrating V2G under multi-scenario simulations, demonstrating the potential for peak-load shaving during high-tariff periods by up to 28% while increasing renewable energy utilization [
15]. Similarly, Osório et al. [
16] modeled a solar-rooftop EV parking lot participating in reserve and ancillary service markets, but as with most studies in this area, EV owner behavior was based on assumed trip patterns rather than empirical charging data.
Despite extensive work in the area, most existing studies on EV parking lot optimization focus on residential, workplace, or fleet charging contexts, where connection times are predictable and operator control is high. Public charging stations which are characterized by high user turnover, heterogeneous charging needs, and short, unpredictable dwell times remain comparatively underexplored. Furthermore, the majority of existing optimization models rely on synthetically generated or statistically assumed user behavior profiles, rather than empirical charging data, which limits their real-world applicability and may lead to overly optimistic estimates of flexibility potential. To the authors’ knowledge, no study has evaluated smart charging and V2G strategies for a public parking lot using real transactional session data under realistic tariff structures. This study aims to fill that gap through a data-driven analysis of charging session records from public stations in Gothenburg, Sweden. By grounding the optimization in observed charging patterns, this paper provides a more realistic assessment of the economic and operational impacts of direct charging, smart charging, and V2G strategies for parking lot operators and DSOs.
The findings of this research contribute to the broader discourse on sustainable urban mobility and energy systems by demonstrating how public charging infrastructure can be transformed as an active participant within the energy ecosystem. The insights presented here provide a foundation for parking operators, policymakers, and energy stakeholders to collaboratively design and implement ideal solutions in public charging stations that balance environmental, economic, and operational considerations.
The remainder of this paper is organized as follows.
Section 2 presents the methodology adopted in this study, including the optimization problem formulation, objective function, and associated constraints.
Section 3 describes the case study considered in this work.
Section 4 presents and discusses the results obtained from applying the proposed methodology to the case study, including the key takeaways, limitations of the study and including the future suggestions of expansion. Finally,
Section 5 concludes the paper and summarizes the main remarks of the study.
4. Results and Discussion
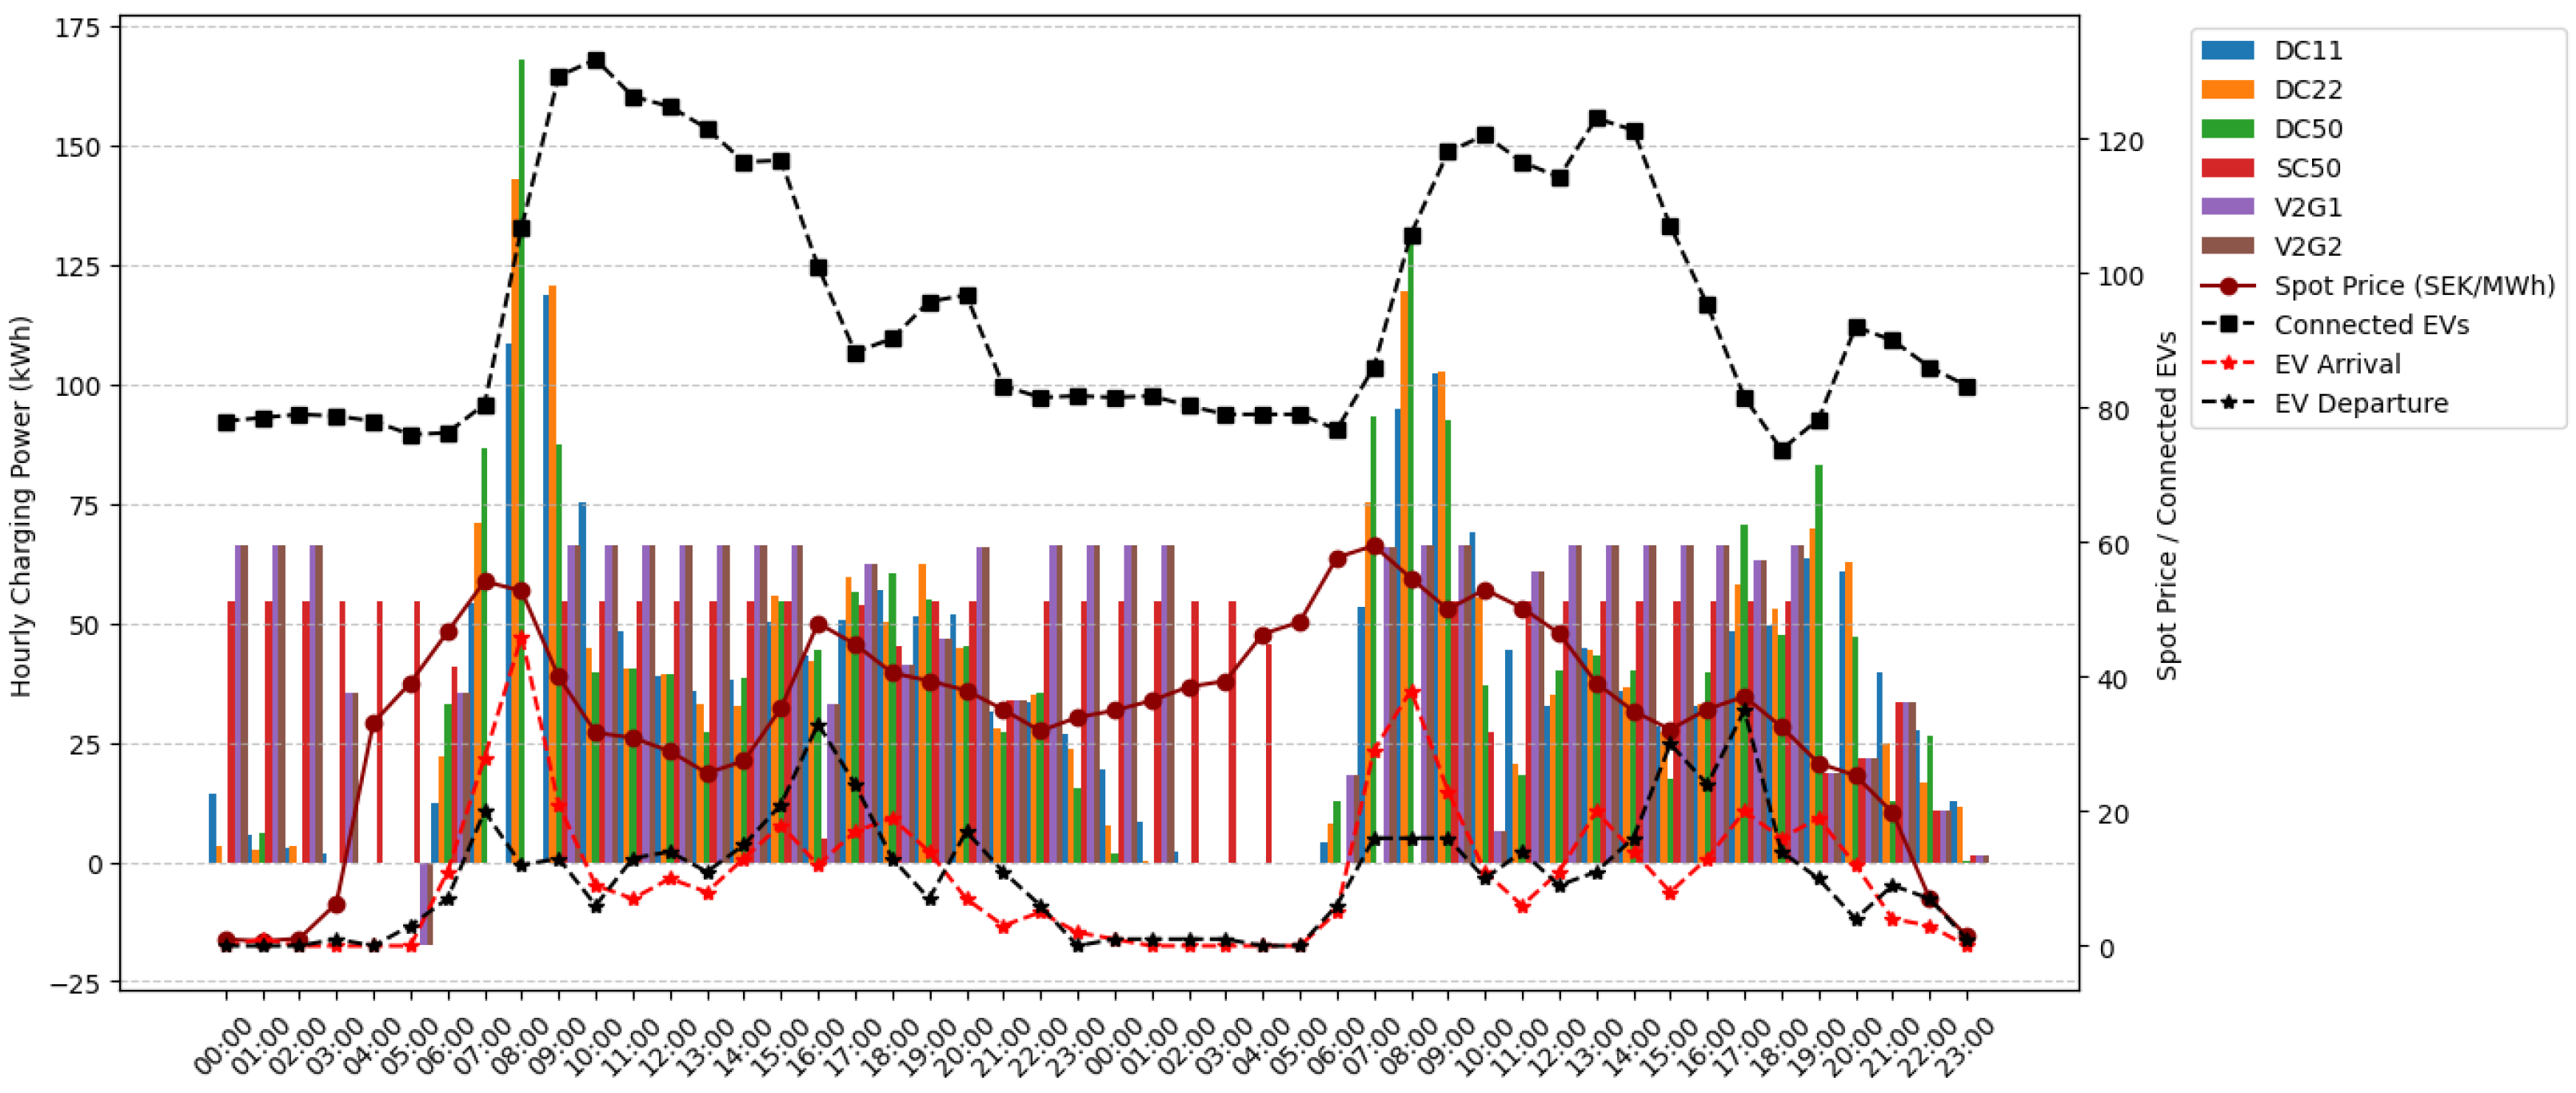
Based on the case study presented above, the optimization model was formulated in the Pyomo package in Python (version 3.9.6) and solved using Gurobi solver (version 12.0.3). The optimization model was simulated for the different scenarios and the overall results can be observed in
Table 3, and the charging power for two typical days in 2023 for selected scenarios can be seen in
Figure 6.
From
Figure 6, it can be observed that there are multiple EVs arriving at morning time around 06:00–09:00 and multiple EVs departing at evening times around 15:00–18:00, which is due to the commuting pattern. Furthermore, the total charging power remains below the maximum rated power of each scenario multiplied by the number of connected EVs, indicating that the charging power constraints are respected throughout the analyzed time horizon. Since the optimization problem was solved to global optimality, the SOE constraints were also satisfied within their predefined operational limits. From
Figure 6, it can be observed that the SC50 and V2G scenarios are utilizing a lower charging power in comparison to DC11, DC22 and DC50 cases during off-peak hours and vice-versa during peak hours in order to optimize the charging. The highest peak was observed for DC50 at 07:00 in these specific days, highlighting the higher peaks of the DC50 scenario in comparison to the other scenarios. In terms of discharging in V2G scenarios, the discharge back to the grid typically happens during the high price hours in the mornings and within the V2G scenarios.
From
Table 3, the overall costs of charging electric vehicles over the first six months of 2023 are summarized for all considered scenarios. The DC50 scenario results in the highest total cost of approximately 372 k€ which is due to its assumption of a charging the EV directly from the time of connection at 50 kW.
The costs in direct charging scenarios increase with the maximum rated power of the charger. Since charging begins immediately upon connection without any scheduling or load optimization, these scenarios closely reflect typical real-world behavior. As a result, they experience significantly higher peak loads, with DC50 reaching a peak power of 1286 kW, which is the highest observed.
The Avg scenario achieves lower overall costs than the direct charging scenarios. By distributing each EV’s energy demand evenly across its connection period, it reduces peak loads and smooths demand profiles. This flexibility yields moderate cost savings.
Smart charging scenarios (SC11, SC22, SC50) offer even greater cost reductions compared to Avg. Notably, SC11, SC22 and SC50 yield identical outcomes, suggesting that increasing the maximum charging power from 11 kW to 50 kW offers no substantial advantage under the optimization framework used.
In the V2G1 scenario, the overall costs are similar to SC scenarios but with a small reduction. Though the discharged energy back to the grid is around 44 MWh, the overall costs are not significantly different from that of smart charging. In the V2G2 scenario, when the discharge power is accounted for in the peak cost calculation, there is a reduction in total discharge back to the grid. Around 29 MWh of discharged energy is reduced in V2G2 case when compared with V2G1. The overall costs of V2G2 is also higher than that of V2G1 cases due to the formulation of peak power as observed in Equation (
5) but still lower than the SC cases.
4.1. Key Takeaways
From the analysis of the presented results, four key takeaways emerge that are particularly relevant for parking operators, policymakers, and energy sector stakeholders.
First, the findings clearly indicate that direct charging strategies (DC11–DC50) lead to significantly high peak loads, posing challenges for both DSOs and parking infrastructure operators. For instance, the DC50 scenario resulted in a peak demand of 1286 kW, highlighting that uncoordinated, simultaneous EV connections can cause substantial load spikes. As EV adoption continues to rise and public charging infrastructure expands, these peaks are likely to become more severe, leading to increased operational strain and higher peak tariffs. However, implementing smart charging or V2G strategies can effectively mitigate this issue by reducing peak demand by nearly 50%, down to 680 kW. This is supported by the existing literature: Bian et al. showed that large-scale uncoordinated access of EVs to the power grid may increase the peak-to-valley load difference, cause operational constraints to exceed their limits, and reduce power quality [
17]. Franzelin et al. further demonstrated that peak load reductions of up to 38% are achievable through high levels of V2G participation [
18], though the larger reduction observed in the present study reflects the more extreme baseline imposed by simultaneous full-power connections in the DC50 scenario.
Second, both smart charging and V2G scenarios offer notable economic benefits, demonstrating an approximate 74% reduction in total charging costs compared to DC50. This reinforces their potential as cost-efficient strategies for optimizing public charger operations and leveraging the inherent flexibility of EVs. This is on par with the existing literature: Zhour et al. arrived to the conclusion that fast charging stations under a coordinated charging scheme could experience a monthly bill curtailment of 20–30% compared to uncoordinated circumstances [
19] and Yanqing Qu claimed that EV owners can experience 27–35 % cost reduction through V2G usage in comparison to current charging methods [
20].
Third, the results also show that V2G1 yields limited changes in cost in comparison to the smart charging cases. This contrasts with the existing literature, where V2G participation in electricity spot markets is shown to generate 10–70% more revenue compared to smart charging alone [
21]. One reason for this could be the losses considered by the charge/discharge cycle together with the limited connection time for many of the EVs, limiting the potential revenue that could be achieved by discharging the EVs, making the smart charging strategy as effective as the V2G strategy. The additional savings that could be achieved per kWh discharged for the simulated charge session was found to be 0.026 € in the V2G case compared to the smart charging case, which might be to low to compensate for potential battery degradation.
Fourth, while the V2G2 configuration enables grid discharging, it also results in higher costs compared to the V2G1 case but still lower than SC cases. This outcome can be attributed to the way peak power is accounted for by the network operator. In the present formulation, peak power is calculated as the net difference between imports and exports to the grid (i.e., charging and discharging the fleet), as represented in the V2G1 scenario. However, extensive feed-ins to the grid can exacerbate issues such as voltage instability and line congestion. With the growing adoption of EVs and the increasing number of projects exploring the potential of V2G, network operators may eventually revise their calculation models for peak power to better reflect these operational concerns. Despite this, V2G remains a promising long-term strategy, as it facilitates participation in ancillary service and local flexibility markets, which are typically more profitable. This positions V2G not only as a tool for load management but also as a strategic asset for enhancing revenue streams and improving grid stability, particularly as regulatory frameworks and market structures continue to evolve.
4.2. Limitations and Suggestions for Future Work
Despite the valuable insights generated by this study, several limitations must be acknowledged to accurately interpret the findings and their practical implications.
First, the optimization model aggregates EV charging loads across all chargers, fulfilling the requested energy requirements before each vehicle’s departure. While this approach enables a tractable system-level analysis and ensures feasibility within the model (i.e., no unfulfilled charging sessions were observed), it may not capture individual-level charging failures that could arise in real-world operations. In practice, localized constraints such as charger availability or user preferences could lead to unmet energy demands for specific vehicles, which are not reflected in this aggregated modeling approach. To address this, solving each charger connection point individually would be the the best way but is computationally complex and is saved as a suggestion for future work.
Second, the treatment of peak cost estimation utilized in this optimization model acts as a simplification. In Sweden, peak charges are determined monthly based on the single highest hourly power demand and settled at the end of each month. However, in this study, the parking lot is optimized on a daily basis, which limits the ability to optimize peak loads over a longer horizon. As a workaround, the model estimates peak costs by applying a daily average peak charge based on the maximum of each day’s maximum power usage and the previous monthly peak encountered. While this method offers a practical approximation for optimization purposes, the final cost assessment in this study employs the actual calculation of monthly peaks, performed ex post after optimization.
Third, battery degradation costs are not explicitly modeled in the optimization objective. Degradation costs in V2G applications typically range from 0.02 to 0.15 €/kWh per cycle depending on battery chemistry, depth of discharge, and temperature [
22], and their inclusion would further reduce the economic advantage of V2G over smart charging. This suggests that even modest degradation costs could eliminate the economic benefit of V2G discharging in the public parking context, reinforcing the conservative nature of the results reported in this study.
Fourth, for chargers recording only daily aggregate energy across multiple sessions, per-session energy was estimated proportionally based on connection duration which is a heuristic method that preserves total daily energy but could not be formally validated against individual session metering data. Similarly, a fixed battery capacity of 65 kWh and arrival SOC of 0.4 were applied uniformly across all sessions. The 65 kWh value reflects the Volvo EX30 P8 AWD battery size in the market, while the arrival SOC was calibrated to ensure feasibility across all sessions, as higher values produced physically inconsistent results in which requested energy exceeded the remaining battery capacity. Although these assumptions simplify the heterogeneity present in real-world public charging, the aggregate peak demand and cost comparisons between strategies are not expected to be materially affected, as the primary scheduling dynamics are governed by the empirical session data.
Finally, in this study, the peak power tariff was calculated based on the aggregated load profile for all chargers, while in reality each parking lot would have a separate grid connection.
Furthermore, extending the deterministic optimization framework to a stochastic setting by sampling over randomized EV arrival, departure, and energy demand profiles would enable confidence intervals to be placed on the cost differences between strategies, particularly for the marginal gap between V2G and smart charging scenarios.
5. Conclusions
This study examined the operational performance and cost implications of various EV charging strategies at a public parking facility, using real-world data and a series of realistic charging scenarios. The results highlight key trade-offs between direct charging, average consumption methods, smart charging, and V2G integration.
The findings demonstrate that direct charging methods, while straightforward and reflective of current practice, result in significantly higher peak loads up to 1286 kW in the worst-case scenario while placing stress on the distribution network and increasing monthly peak cost burdens for parking operators. In contrast, smart charging and V2G strategies can reduce peak loads by approximately 47% and cut overall costs by around 75%, offering a strong case for their adoption in future urban charging infrastructure.
However, the effectiveness of V2G is highly dependent on the availability of EVs and their connection period. With no additional incentives in place, discharging can occur, but the economic benefits are marginal under current assumptions, mainly due to the dynamic nature of EV arrivals and departures in urban parking environments. In the case of V2G2 where discharge is also accounted for in peak cost calculation, the discharge back to the grid is limited and has a slightly higher cost in comparison with V2G1.
A key contribution of this work lies in its data-driven foundation. Unlike much of the existing literature, which relies on synthetic profiles or assumed user behavior, the charging scenarios evaluated here are grounded in real session records from public stations in Gothenburg, Sweden. This anchors the results in actual usage patterns and enhances their practical relevance for parking operators and DSOs facing real deployment decisions. Furthermore, while prior research has predominantly focused on residential or fleet charging contexts, this study explicitly addresses the public parking environment which is characterized by high user turnover, unpredictable connection times, and limited operator control thereby introducing distinct operational constraints that are often absent from existing models.
Ultimately, while smart charging emerges as the most practical and cost-effective solution in the short term, V2G capability remains promising, particularly for participation in ancillary service markets. For parking operators and policymakers, this study underlines the importance of coordinated optimization, regulatory support, and well-designed incentives to unlock the full flexibility potential of public EV charging infrastructure.