


Abstract
This study presents a comprehensive techno-economic and environmental evaluation of ten standalone solar-powered mobile charging station configurations for mini electric vehicles (MEVs) in Kuwait, simulated using HOMER Pro (v3.18.4). The configurations span DC–AC and pure DC-bus architectures, fixed and tracking photovoltaic (PV) systems, hybrid designs incorporating diesel generator backup, and fully renewable zero-emission systems. All configurations were evaluated under identical load demand (6460 kWh/year), solar resource, and economic assumptions derived from Kuwait’s desert climate at Al-Wafra farms (28°33′52.7″ N, 48°03′45.8″ E, annual average GHI = 5.49 kWh·m−2·day−1). Performance was assessed using Net Present Cost (NPC), Levelised Cost of Energy (LCOE), annual PV energy production, CO2 emissions, Energy Production Density (EPD), Renewable Fraction (RF), and the PV Energy Production-to-Load Ratio (PV-EPTLR). The results demonstrate that two-axis tracking on a DC-bank architecture without a generator (System 8) achieves the highest annual PV output of 13,635 kWh/year, representing a 36% increase over a fixed-tilt DC-bank system while eliminating 100% of operational CO2 emissions. Among the hybrid configurations, vertical single-axis tracking on a DC-bank architecture with generator backup (System 6) yields the lowest lifecycle cost (NPC = USD 6271.8; LCOE = 0.0751 USD/kWh), representing a 57% reduction relative to the fixed-tilt DC–AC baseline. EPD analysis confirms that tracking-based systems improve structural energy efficiency by up to 36%, making them particularly suitable for mobile and weight-constrained deployments. The findings provide actionable guidance for deploying sustainable off-grid MEV charging infrastructure in regions with limited grid access, offering a scalable pathway toward zero-emission rural transportation in solar-rich arid environments. The study further provides a systematic comparison between DC–AC and pure DC-bank charging architectures under identical operating conditions.
1. Introduction
The global transition toward sustainable transportation has accelerated markedly over the past decade, with electric vehicles (EVs) and mini electric vehicles (MEVs) emerging as key solutions for mitigating greenhouse gas (GHG) emissions and reducing dependence on fossil fuels. Unlike conventional internal combustion engine vehicles, MEVs operate solely on electric motors, producing zero tailpipe emissions and eliminating both air and noise pollution in operational environments [1]. These compact, low-speed vehicles have gained considerable traction in agricultural, industrial, campus, and urban last-mile delivery applications where short-range transport is required [2].
Global EV stock surpassed 40 million units by the end of 2023, with annual sales exceeding 13.5 million units, representing approximately 18% of total new car registrations [3]. Despite this growth, the widespread adoption of EVs and MEVs faces significant infrastructure challenges, particularly in regions with unreliable or absent grid electricity. Approximately 760 million people worldwide still lack access to electricity, and many developing and rural regions experience persistent grid instability [4]. Current EV charging infrastructure relies on utility grid power, creating a fundamental paradox: when grid electricity is generated from fossil fuels, EV charging merely shifts emissions from vehicles to power plants rather than eliminating them [5].
The uncontrolled charging of large MEV fleets can adversely affect grid power quality, voltage stability, and operational reliability [6]. As EV adoption scales, the associated increase in charging demand will impose significant additional capacity requirements on distribution grids, while high battery storage investment costs continue to challenge both investors and policymakers pursuing clean energy objectives [7]. Unplanned charging station installations and high grid-dependency rates may further compromise grid reliability, energy costs, and environmental targets [8].
These challenges have motivated growing research interest in off-grid and hybrid renewable-energy-based charging solutions, which can operate independently of the utility grid while reducing the carbon footprint of EV charging. Among renewable technologies, solar photovoltaic (PV) systems are particularly well-suited for off-grid charging applications due to their modularity, declining costs, and compatibility with battery energy storage systems (BESSs). PV arrays can be installed on rooftops, parking structures, or mobile platforms, providing weather shelter and requiring no additional land in developed areas [9]. When integrated with BESSs, solar-powered charging stations can serve remote locations, reduce infrastructure costs, and deliver clean energy autonomously [10].
Kuwait presents an exceptionally favourable context for solar-powered MEV charging infrastructure. The country receives high solar irradiance with an annual average global horizontal irradiance (GHI) of approximately 5.49 kWh·m−2·day−1, supported by a subtropical desert climate with long daylight hours and minimal cloud cover [11,12]. Kuwait’s national energy strategy, Vision 2035, targets a 15% renewable energy share in the electricity mix by 2030, creating policy incentives for renewable energy deployment [13]. Agricultural regions such as Al-Wafra farms and Al-Abdali farms represent Kuwait’s primary MEV operational environments, where vehicles are used for the short-distance transport of goods and personnel. These areas frequently experience power disruptions during peak summer demand hours and suffer from severe charging infrastructure shortfalls [14].
Mobile solar charging stations offer a promising solution for these settings: they are self-contained, deployable without fixed infrastructure, and capable of serving MEVs directly in the field. A previous study by the authors established the feasibility of an off-grid PV–battery mobile charging station for three MEVs at Al-Wafra (each with a 10 kW motor, travelling 30 km/day), identifying an optimal baseline configuration with a 6.19 kW PV array, 37.1 kWh battery bank, an NPC of USD 14,696, and LCOE of 0.1767 USD/kWh [14]. While that system demonstrated reliable off-grid operation with zero operational emissions, it exhibited substantial excess electricity generation (34.2% of annual PV production) and a high battery mass contribution, motivating the present investigation into improved system configurations.
Integrating solar tracking systems into PV installations offers a well-established strategy for increasing energy yield without proportionally increasing the installed capacity. Single-axis horizontal, single-axis vertical, and two-axis tracking systems continuously reorient PV modules toward the sun, capturing a greater fraction of available irradiance than fixed-tilt panels. Studies in comparable arid climates have demonstrated that two-axis tracking can increase PV energy production by 25–40% relative to fixed-tilt configurations, with vertical single-axis tracking providing substantial gains at a lower mechanical complexity [15,16]. However, the techno-economic trade-offs between increased energy capture, system weight, cost, and complexity require systematic evaluation—particularly in the context of mobile, off-grid MEV charging platforms.
Despite the growing body of literature on photovoltaic-powered EV charging systems, several important research gaps remain. Existing studies have primarily focused on fixed-grid charging infrastructure, conventional stationary photovoltaic installations, or single charging architectures without systematic comparison between DC-bank and DC–AC configurations under mobile off-grid operating conditions. Furthermore, limited attention has been given to the combined impact of photovoltaic tracking systems, mobile deployment constraints, and Energy Production Density on standalone MEV charging stations operating in harsh desert environments.
The present study addresses these gaps through a comprehensive techno-economic and environmental evaluation of ten standalone solar-powered mobile charging station configurations under Kuwait’s climatic conditions. The scientific contributions of this work are fourfold:
- A systematic comparison between DC-bank and DC–AC charging architectures under identical operating conditions.
- Quantitative assessment of fixed, horizontal single-axis, vertical single-axis, and two-axis photovoltaic tracking systems for mobile MEV charging applications.
- Introduction of Energy Production Density (EPD) as a mobility-oriented metric for evaluating structural energy efficiency in mobile charging platforms.
- Comprehensive evaluation of hybrid generator-supported and fully renewable zero-emission configurations within a unified HOMER Pro optimisation framework.
- The findings provide both engineering and policy-level guidance for the deployment of sustainable off-grid MEV charging infrastructure in Kuwait and other solar-rich regions with limited grid access.
2. Literature Review
2.1. MEV Charging Infrastructure: Challenges and Critical Needs
Mini electric vehicles are gaining increasing relevance as sustainable mobility solutions for short-distance applications in agriculture, campuses, logistics, and urban environments [1,2]. Despite their advantages, MEV adoption is constrained by insufficient charging infrastructure globally, particularly in rural and developing regions. Off-grid charging infrastructure, which uses fossil fuels and renewable energy sources individually or in combination to generate electricity locally without a grid connection, has emerged as a key solution for areas where grid access is absent or unreliable [17].
Several challenges characterise current EV and MEV charging ecosystems. First, uncontrolled charging adversely affects grid power quality and voltage stability [6]. Second, the spatial distribution of demand is highly heterogeneous: each region presents different load patterns, parking availability, and building structures, creating uncertainty in planning which regions will consume, generate, or store PV electricity [18]. Third, underestimating uncertainties in EV charging load forecasting can lead to investment planning errors of up to 10% [18]. Fourth, high battery storage capital costs continue to hinder the deployment of off-grid charging systems and complicate governmental clean energy targets [7].
2.2. Solar-Based EV Charging Stations: System Architectures
Off-grid charging systems (OGCSs) employ three primary bus architectures: AC-based, DC-based, and combined AC/DC configurations [17,19,20]. In AC-based architectures, diesel generators, biomass generators, PV arrays, and wind turbines generate AC power collected on a common AC bus. However, integrating DC sources such as PV arrays requires a DC-to-AC conversion stage, introducing cost, complexity, and efficiency penalties [19]. DC-based architectures connect PV systems, fuel cells, BESSs, and EV batteries via DC-DC converters through a common DC bus, eliminating DC-AC conversion stages and enabling more efficient power transfer [20]. Combined AC/DC architectures permit simultaneous AC and DC generation from multiple sources feeding directly into their respective buses, with power exchange via a single bidirectional AC/DC converter, offering advantages in flexibility and efficiency but representing few deployed implementations [17].
Among renewable sources, solar PV has been the most extensively deployed technology in OGCS designs, with reported ratings reaching up to 468 kWp in DC-based configurations [17]. Wind turbines (2.4–250 kW range) have been combined with PV in several hybrid studies, while diesel generator sets have been used as backup in systems up to 31 kW [17]. For DC-based systems, the elimination of multiple conversion stages reduces losses and enables more compact designs—a particularly important characteristic for mobile applications [20]. A comprehensive review of EV charging stations with PV integration by Ahmad et al. [21] identified DC-based architectures as the preferred topology for standalone off-grid systems due to their superior efficiency and reduced component count.
2.3. Solar Tracking Systems for PV Performance Enhancement
PV tracking systems increase energy yield by continuously orienting modules toward the sun. Three primary configurations have been studied: horizontal single-axis tracking (HSAT), which rotates modules around an east–west axis to track daily solar motion; vertical single-axis tracking (VSAT), which adjusts module tilt to follow seasonal solar elevation changes; and two-axis tracking (TAT), which combines both motions for continuous optimal alignment [15].
A techno-economic comparative study of grid-connected PV systems with different tracking configurations using HOMER Pro—encompassing fixed, HSAT, VSAT, and TAT—demonstrated that two-axis tracking systems consistently delivered the highest energy production and the lowest LCOE in high-irradiance locations [16]. In comparable arid environments, TAT has been reported to increase annual energy production by 25–40% relative to fixed-tilt systems, while VSAT provides gains of 15–25%, with significantly reduced mechanical complexity [15,22]. Pirayawaraporn et al. [23] demonstrated a 37.87% increase in energy generation for a 20 kW plant in Tehran through dual-axis tracking adoption. These gains reduce battery storage requirements in off-grid systems, directly lowering capital costs and system mass.
However, the economic viability of tracking systems depends on the trade-off between increased energy capture and the additional cost, weight, and maintenance requirements of the tracking mechanism. For mobile platforms—where system mass is a critical deployment constraint—this trade-off is particularly important. The Energy Production Density (EPD), defined as annual energy production per unit station mass (kWh·yr−1·kg−1), provides a useful metric for quantifying this relationship in mobile charging contexts.
2.4. HOMER Pro Simulation for Hybrid Energy System Optimisation
HOMER Pro (v3.18.4) (Hybrid Optimisation Model for Multiple Energy Resources) is the most widely used software platform for simulating, optimising, and evaluating hybrid energy systems, including off-grid solar–battery and solar–battery–generator configurations [24,25]. The software performs an hourly time-series simulation over a specified project’s lifetime, evaluating thousands of system configurations and identifying cost-optimal solutions subject to reliability constraints [24]. Key outputs include NPC, LCOE, annual energy production, renewable fraction, unmet load, and emissions. Sensitivity analysis capabilities allow for the assessment of performance under variable solar radiation, load demand, and component cost scenarios [26].
Several studies have applied HOMER Pro to solar-powered EV and MEV charging stations. Al Wahedi and Bicer [27] used HOMER to optimise standalone renewable-based EV charging stations in Qatar, identifying the role of BESS sizing in balancing cost and reliability. AlRukaibi et al. [28], in a comparative study of private EV charging stations in Kuwait using HOMER, reported that a 5 kW PV–wind hybrid configuration achieved a 78% renewable fraction and reduced CO2 emissions by approximately 7027 kg/year. Praveenkumar et al. [29] applied HOMER to evaluate PV-based EV charging under five Indian climatic conditions, demonstrating the site-specific nature of optimal configurations. The authors’ previous work [14] demonstrated the feasibility of a PV–battery mobile charging station at Al-Wafra, Kuwait, establishing the baseline configuration that motivates the present study.
2.5. Kuwait Solar Energy Potential and MEV Applications
Kuwait ranks among the highest-irradiance countries globally, with annual GHI values of 1900–2100 kWh·m−2·year−1 and daily sunshine averaging 9–12 h [11,30]. A techno-economic analysis of 100 MW solar plants in Kuwait by Althuwaini et al. [31] identified Al-Wafra as the optimal location for both PV and CSP technologies, consistent with its high solar radiation metrics. Baidas et al. [32] demonstrated the feasibility of hybrid PV–wind off-grid systems for remote cellular base stations in Kuwait, including at the Wafra site. Kuwait’s Vision 2035 targets 15% renewable electricity by 2030 through projects including the Al-Shagaya Renewable Energy Park, expected to incorporate up to 2.7 GW of PV capacity [13].
Al-Wafra farms and Al-Abdali farms represent the primary operational environments for MEVs in Kuwait, where vehicles are used to transport agricultural goods over short distances. These areas experience summer peak temperatures exceeding 45 °C, power disruptions during high-demand periods, and a severe shortage of charging infrastructure [14]. The combination of high solar resource, MEV operational need, and grid unreliability makes Al-Wafra an ideal test case for mobile solar charging station design and optimisation.
2.6. Research Gap and Contribution
Despite the growing body of literature on solar-powered EV charging, several critical gaps remain. First, no published study has systematically compared multiple PV tracking configurations (fixed, HSAT, VSAT, and TAT) within a pure DC-bank mobile charging architecture for MEVs, particularly under the combined constraint of system weight and off-grid operation. Second, existing studies on Kuwait’s solar energy potential have focused on large-scale fixed installations; mobile, weight-constrained, and off-grid MEV charging systems in Kuwait have received minimal attention. Third, the EPD metric—which quantifies energy yield per unit system mass and is critical for mobile platform design—has not been applied in comparative tracking studies for MEV charging. Fourth, the economic and environmental trade-offs between hybrid (generator-supported) and fully renewable DC-bank configurations with tracking have not been quantified for the Kuwaiti agricultural context.
The present study directly addresses these gaps by (i) evaluating ten system configurations spanning DC–AC and DC-bank architectures with four tracking strategies and two fuel strategies; (ii) introducing EPD as a comparative metric alongside NPC, LCOE, RF, and PV-EPTLR; (iii) situating the analysis within Kuwait’s specific solar resource and MEV operational context; and (iv) providing actionable design guidance for zero-emission mobile charging in solar-rich, grid-limited environments.
2.7. Technical Implications of DC-Bank and DC–AC Architectures
The selection of electrical bus architecture plays a decisive role in determining the efficiency, reliability, and operational flexibility of standalone EV charging systems. In photovoltaic-powered charging stations, the native electrical output of photovoltaic modules is direct current (DC), while battery energy storage systems (BESSs) and electric vehicle batteries also inherently operate using DC power. Consequently, the use of a pure DC-bank architecture enables direct energy transfer between the generation, storage, and charging subsystems while minimising intermediate power conversion stages. In conventional DC–AC charging architectures, the PV-generated DC electricity must first be converted into alternating current (AC) through an inverter before being delivered to AC loads or reconverted back into DC during battery charging operations. These repeated DC–AC–DC conversion stages introduce cumulative efficiency losses, increase thermal loading on power-electronic components, and raise system complexity. The overall conversion efficiency of a DC–AC charging pathway can be represented as:
where
- represents the PV output efficiency.
- is the inverter efficiency.
- is the rectification efficiency during charging.
- represents the battery charging efficiency.
Typical inverter efficiencies range between 93 and 97%, while AC rectification stages introduce additional losses of approximately 2–5%. Consequently, total conversion losses in DC–AC–DC systems may exceed 10% under practical operating conditions. In contrast, DC-bank systems eliminate redundant conversion stages and therefore improve effective energy utilisation, particularly in off-grid systems where energy availability is constrained.
Beyond energy efficiency, DC-bank architectures also provide operational advantages, including:
- Reduced harmonic distortion.
- Elimination of reactive power management.
- Simplified synchronisation requirements.
- Lower component count.
- Reduced maintenance needs.
- Improved compatibility with battery storage and photovoltaic systems.
These characteristics are particularly important for mobile charging platforms deployed in remote agricultural regions, where reliability, low maintenance requirements, and reduced system mass are critical operational considerations. However, DC-bank architectures also introduce technical challenges, including DC fault-protection complexity, voltage-regulation requirements, and specialised DC switching equipment. Despite these limitations, recent studies have increasingly identified DC microgrid architectures as the preferred solution for standalone renewable EV charging applications due to their superior energy efficiency and compatibility with modern battery-based transportation systems.
The present study therefore investigates both DC–AC and pure DC-bank charging architectures under identical climatic, economic, and operational conditions in order to quantify the techno-economic and environmental implications of architecture selection for mobile MEV charging stations in Kuwait.
3. System Description and Methodology
3.1. Site Characteristics and Solar Resource
The case study is situated at Al-Wafra farms, Kuwait (28°33′52.7″ N, 48°03′45.8″ E), a rural agricultural region where MEVs are routinely used for short-distance goods transport and where charging infrastructure is absent. Kuwait exhibits a subtropical desert climate characterised by long, hot, and dry summers (maximum temperatures exceeding 45 °C) and mild winters. Annual average GHI is 5.49 kWh·m−2·day−1, with peak irradiance in June–August (reaching 0.74 kW/m2) and minimum values in December–January (0.32–0.35 kW/m2). [33]. This pronounced seasonal variability necessitates robust energy storage to maintain off-grid reliability during winter months. Solar resource data used in HOMER simulations were obtained from NASA’s Surface Meteorology and Solar Energy (SSE) dataset.
3.2. Load Profile and Station Demand
The station serves three MEVs, each equipped with a 10 kW AC motor and lithium-ion or lead–acid battery packs (120–350 Ah nominal capacity), travelling approximately 30 km/day [14]. Total annual energy demand is 6460 kWh·year−1, comprising 5548 kWh·year−1 (85.9%) for AC MEV charging and 912 kWh·year−1 (14.1%) for DC auxiliary station loads (lighting, monitoring). Charging is primarily scheduled during daylight hours (08:00–18:00) to maximise direct PV utilisation. The daily average load is approximately 17.7 kWh, with a peak of approximately 21 kWh. These load parameters are consistent with the authors’ prior validated model [14].
3.3. System Configurations and Scenarios
Four scenarios are defined to investigate the combined effects of system architecture, PV tracking strategy, and generator integration on system performance:
- Scenario 1 (System 1): DC–AC bus architecture with fixed-tilt PV and no generator (fully renewable).
- Scenario 2 (System 2): DC–AC bus architecture with fixed-tilt PV and diesel generator backup (hybrid).
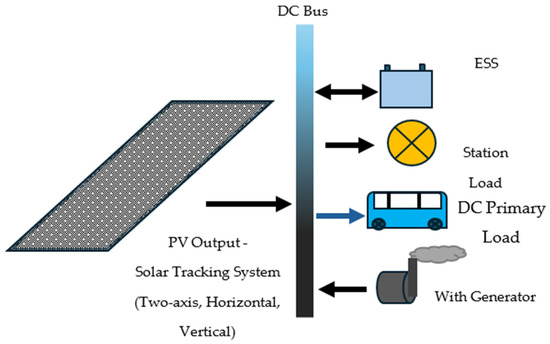
- Scenario 3 (Systems 3–6): Pure DC-bank architecture with fixed and three tracking configurations (HSAT, VSAT, and TAT) plus diesel generator support (hybrid).
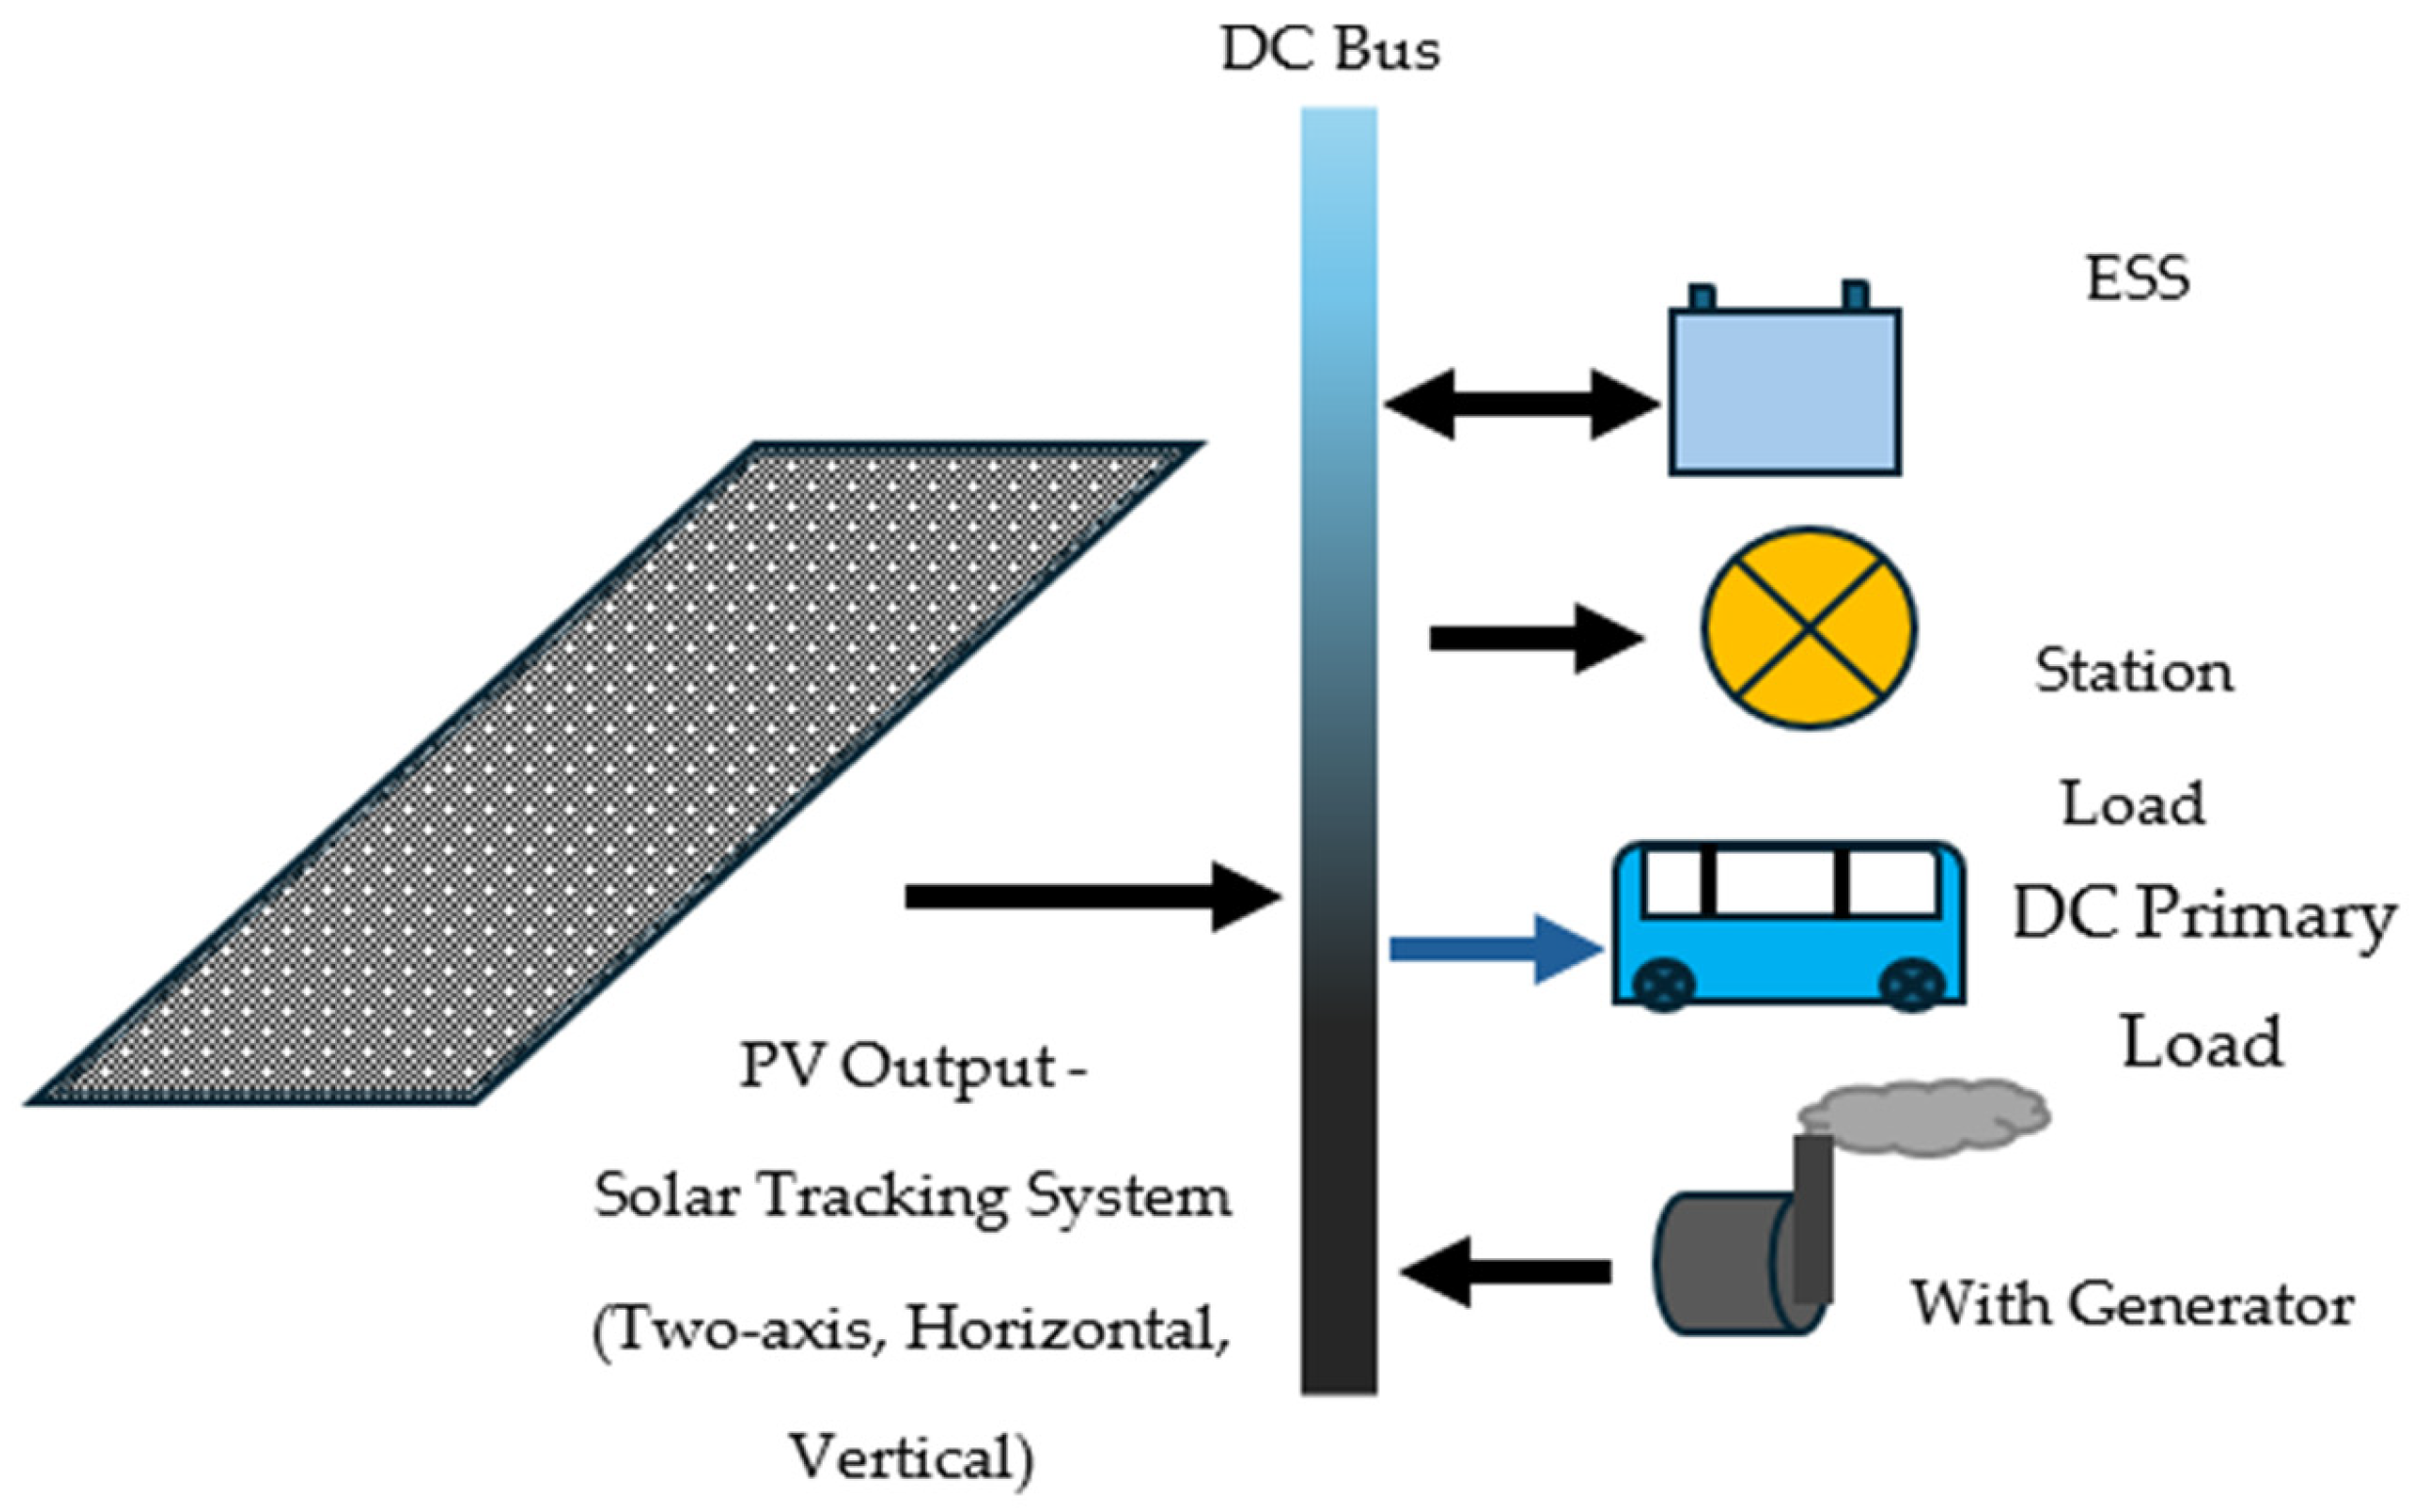
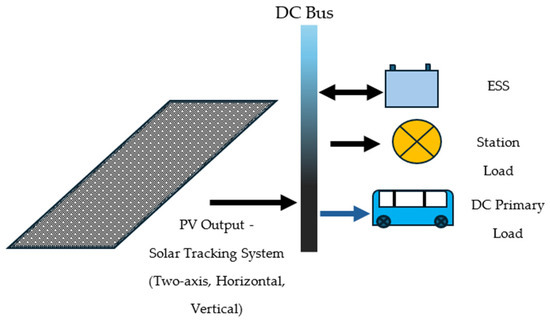
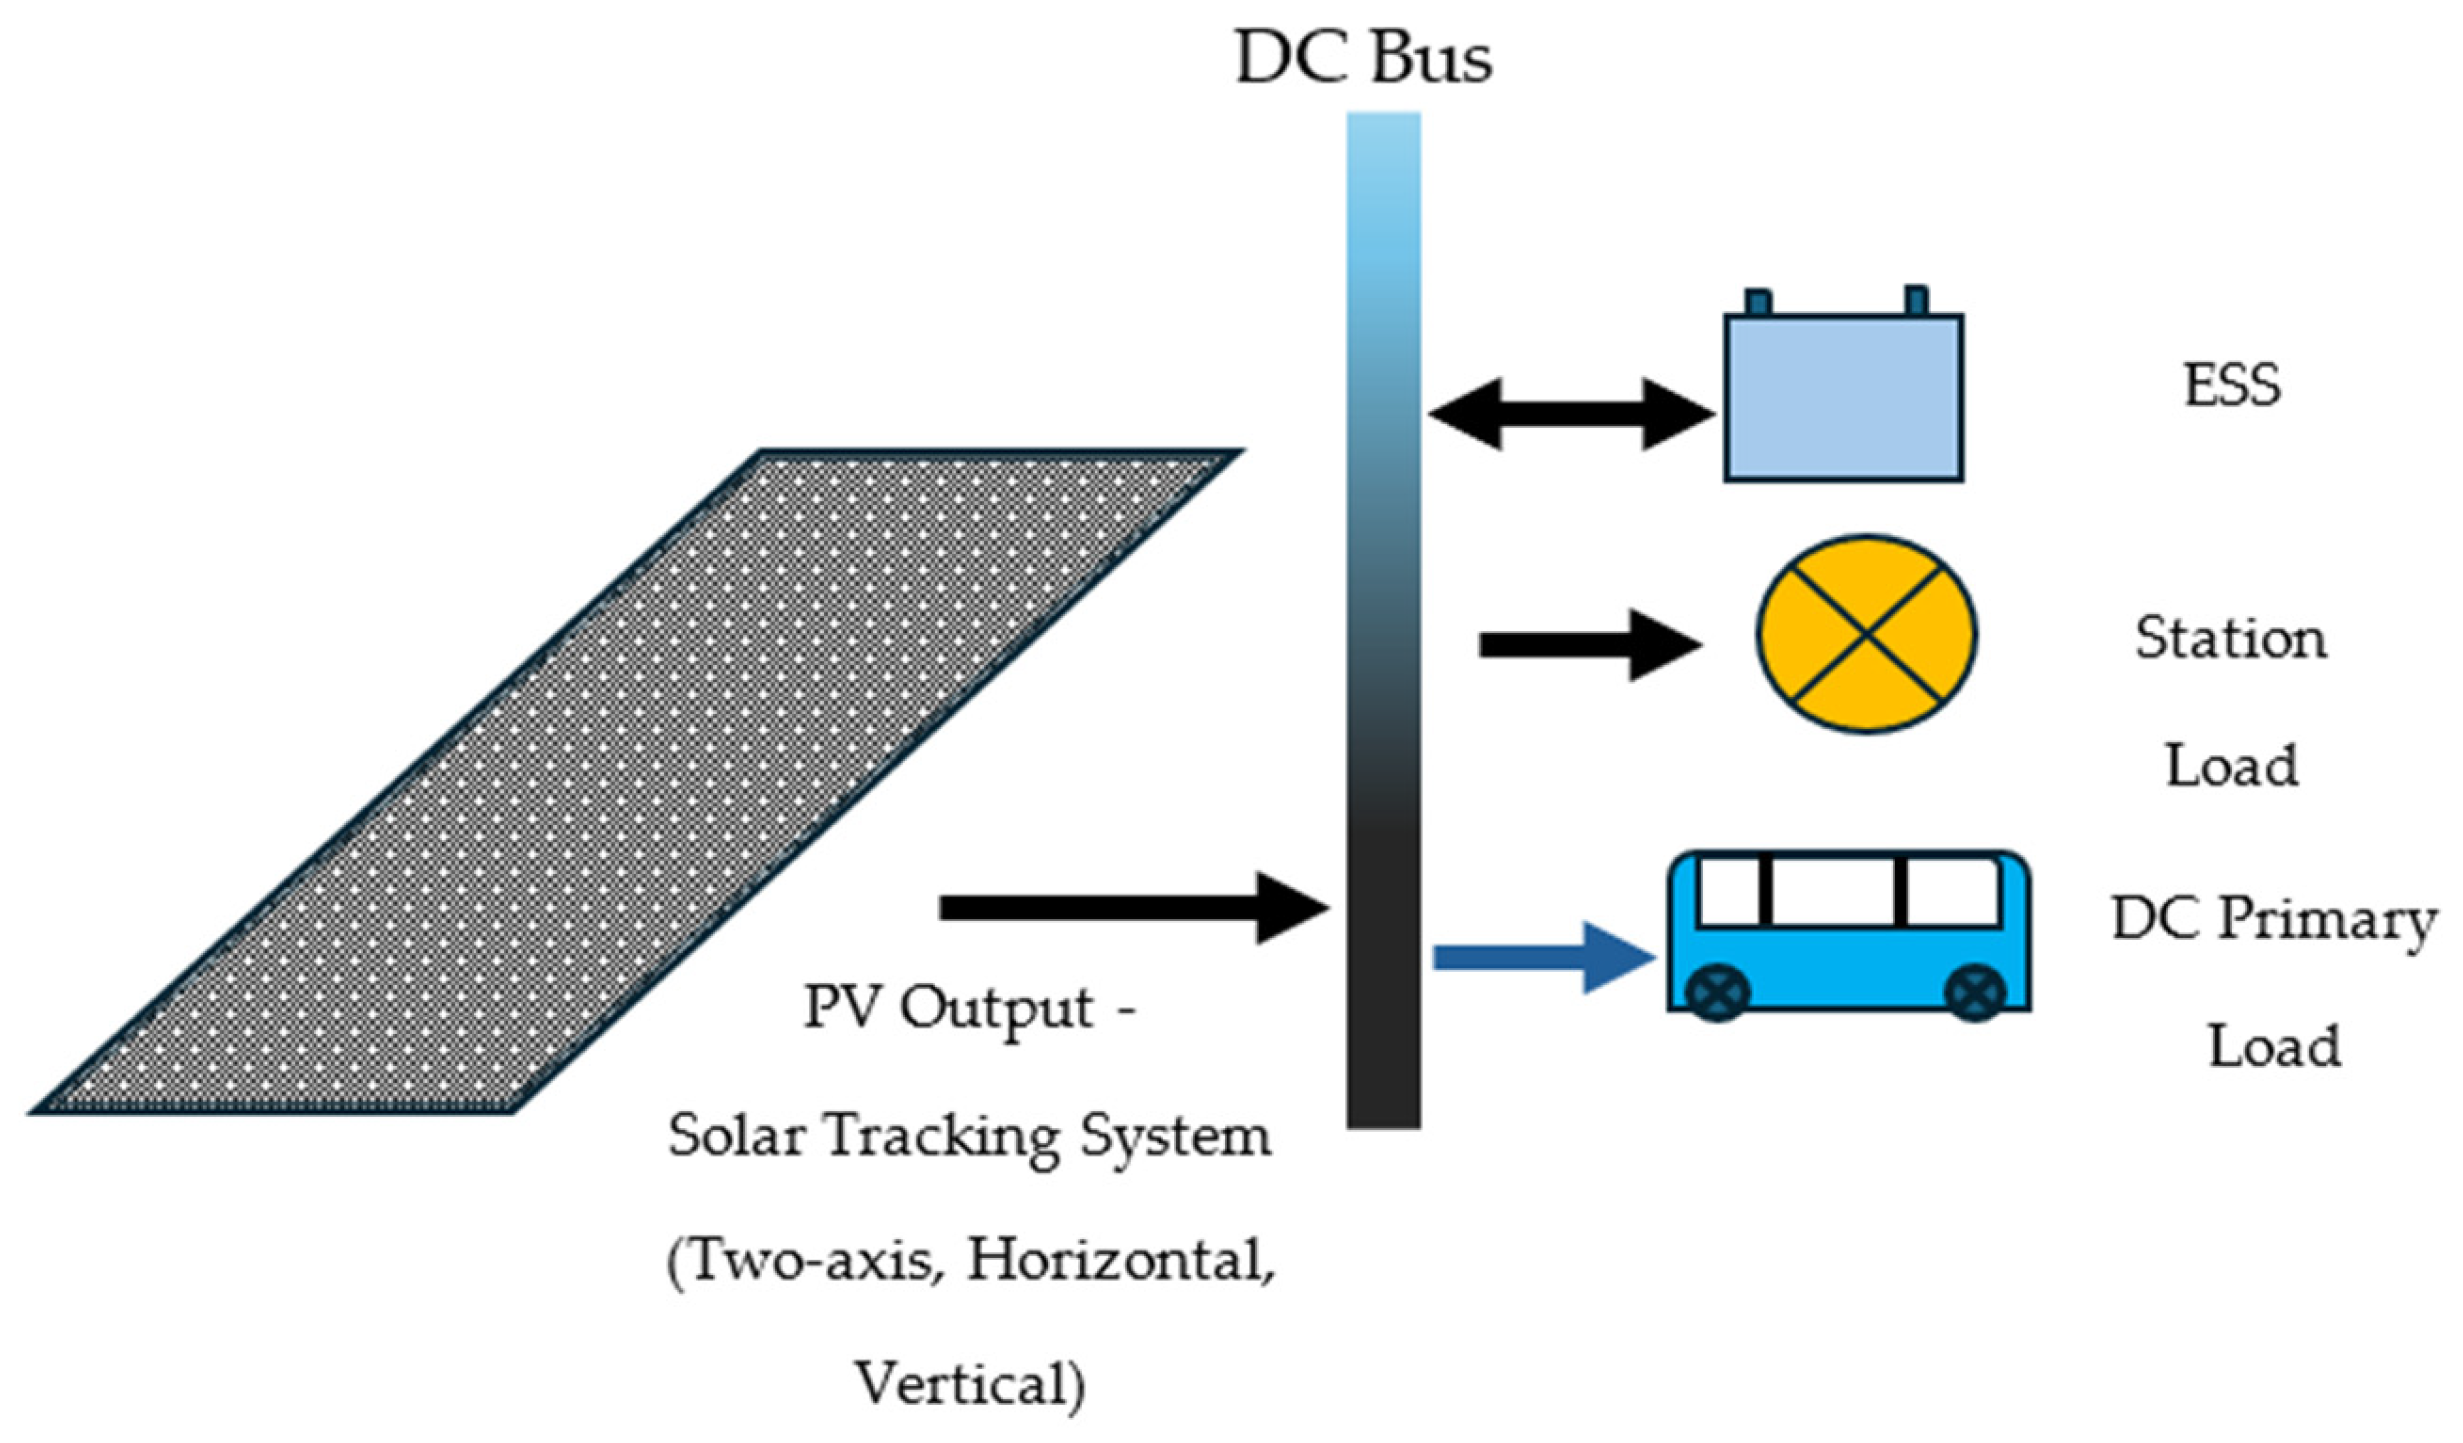
- Scenario 4 (Systems 7–10): Pure DC-bank architecture with fixed and three tracking configurations (HSAT, VSAT, and TAT), fully renewable with no generator.
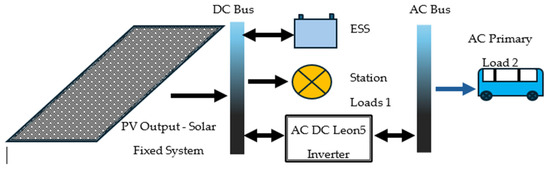
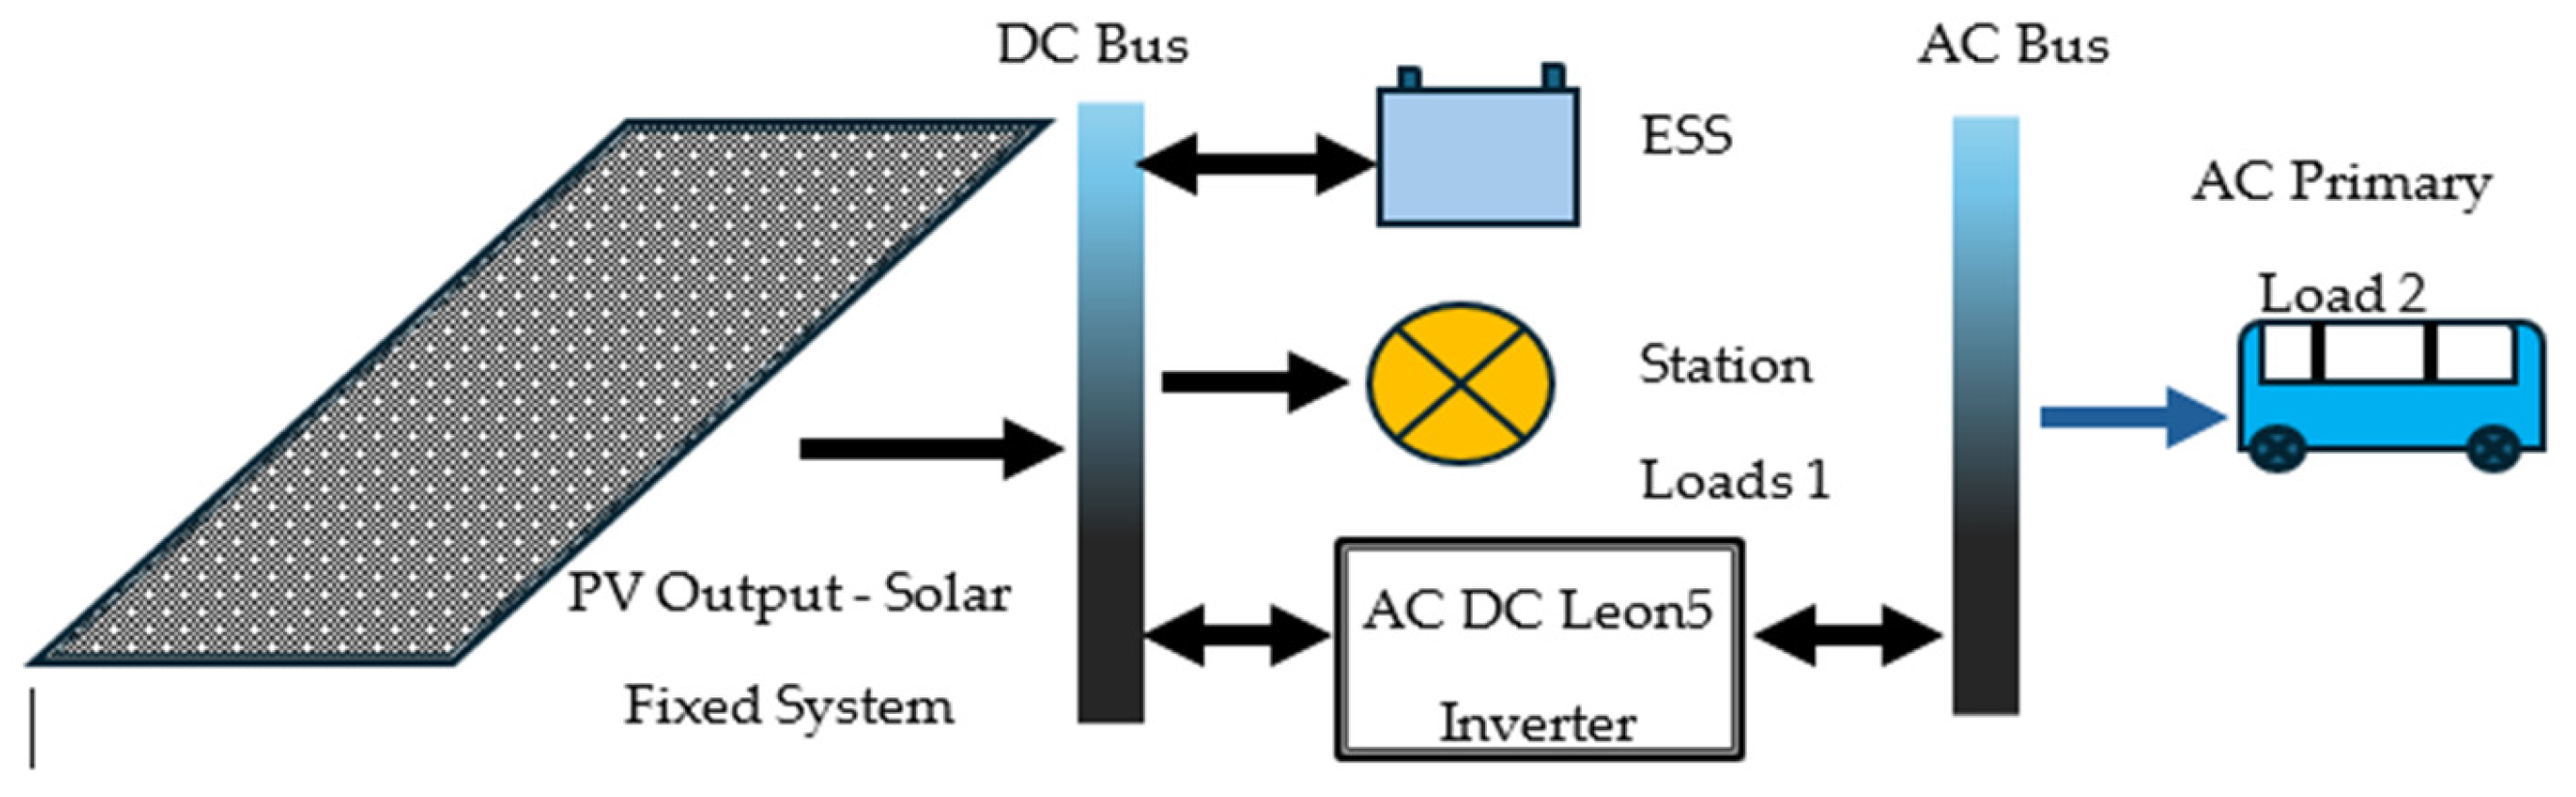
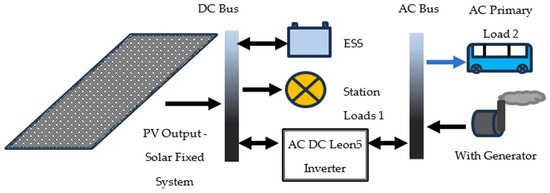
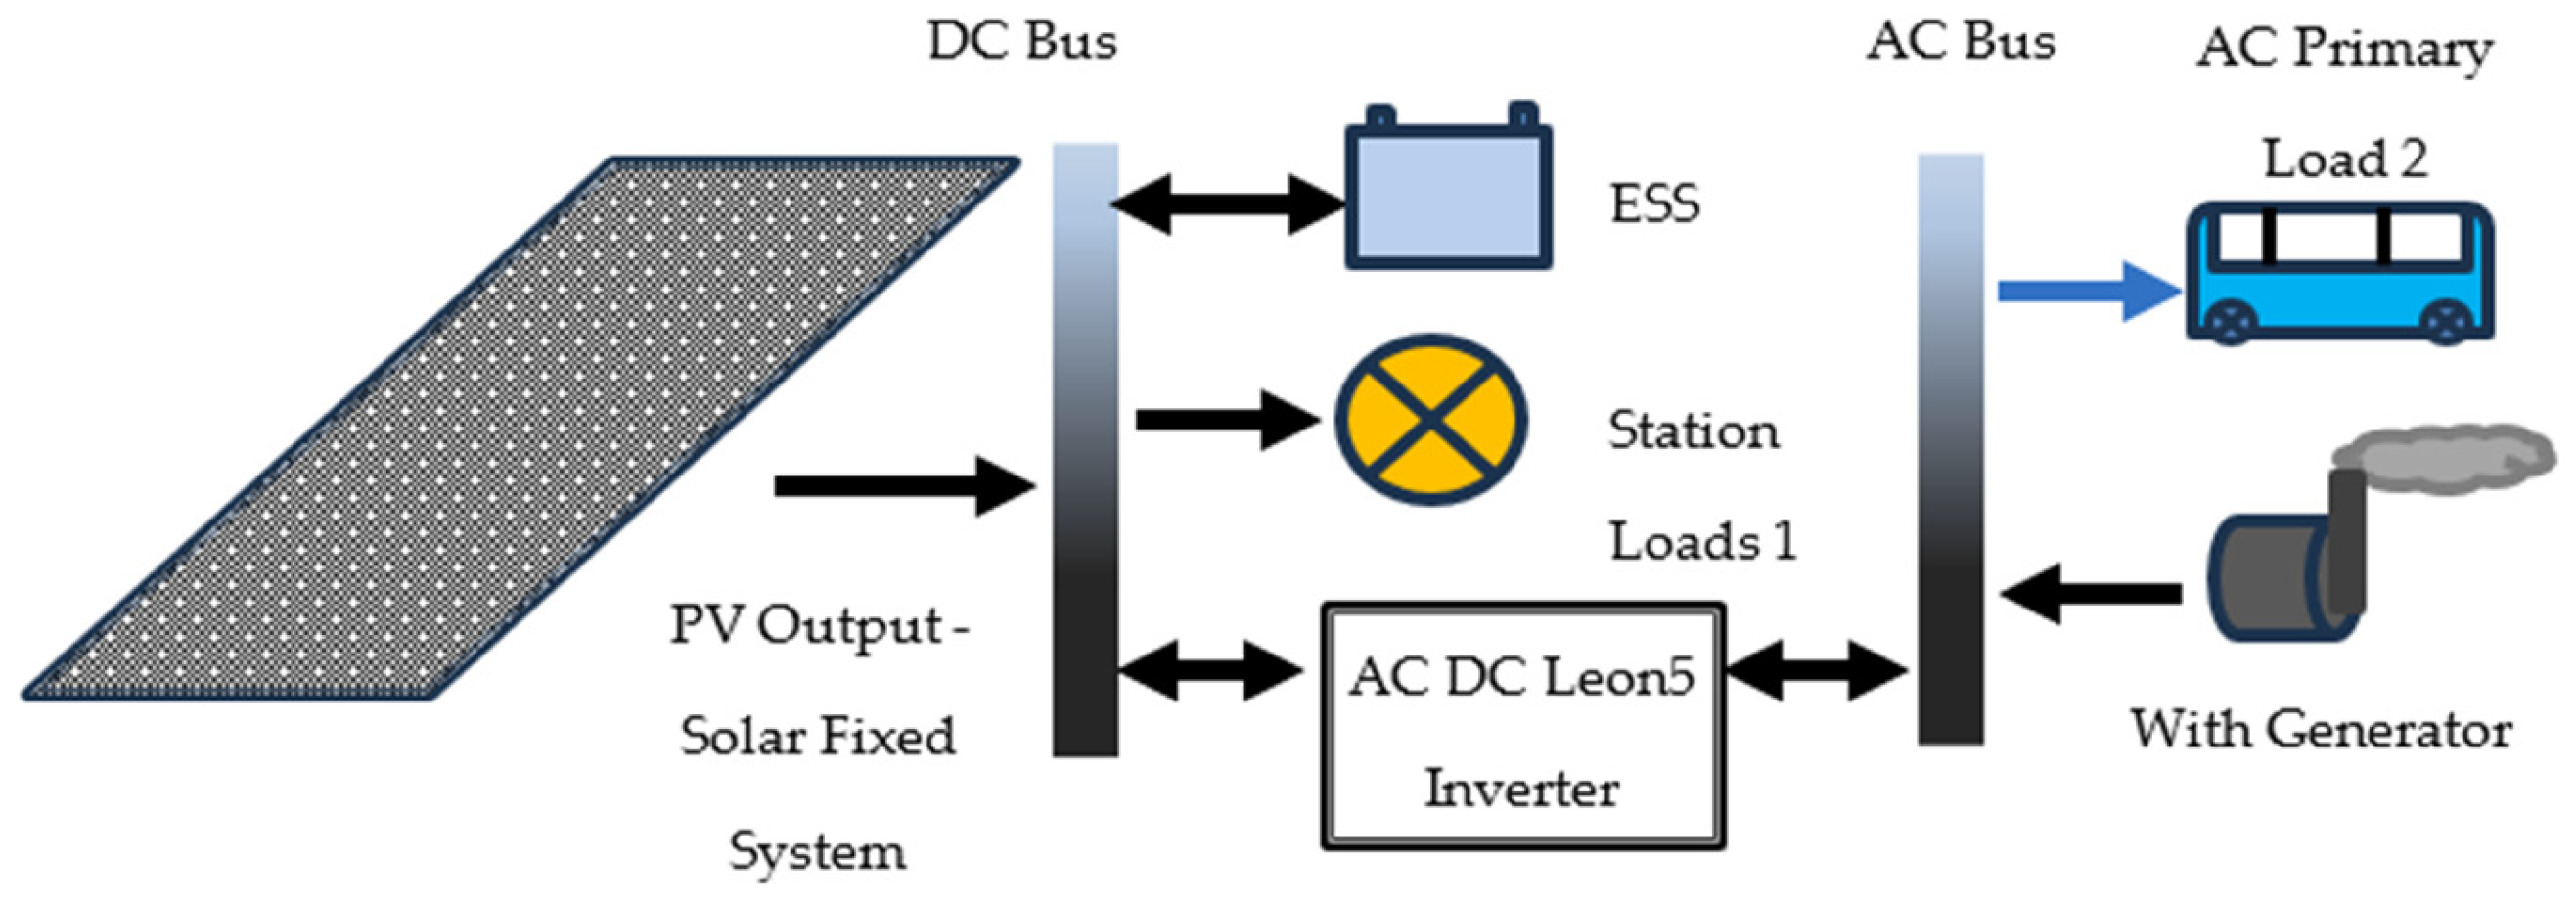
In Scenarios 1 and 2 (Figure 1 and Figure 2), an inverter (DC–AC, 5 kW) interfaces the DC bus with the AC load. In Scenarios 3 and 4 (Figure 3 and Figure 4), all components connect directly to a common DC bus, eliminating the inverter and all DC-to-AC conversion losses. The use of a pure DC architecture in Scenarios 3 and 4 improves system efficiency by avoiding repeated DC–AC–DC conversion cycles [20].
Figure 1.
Scenario 1: DC–AC bus with fixed PV and no generator (System 1).
Figure 2.
Scenario 2: DC–AC bus with fixed PV and diesel generator support (System 2).
Figure 3.
Scenario 3: DC-bus with fixed and tracking PV and diesel generator support (Systems 3–6).
Figure 4.
Scenario 4: DC-bus with fixed and tracking PV operating as a fully renewable, zero-emission system without a generator (Systems 7–10).
3.4. Component Specifications
The PV module selected is the BEIJIAYI 600 W monocrystalline panel (21.2% efficiency, 25-year lifetime). The battery is the Solar SSIG 12-255 deep-cycle lead–acid unit (nominal capacity 3.09 kWh per unit; round-trip efficiency 80%; and minimum state of charge 30%). The inverter (where applicable) is a 5 kW generic unit with 95% efficiency and a 15-year lifetime. The diesel generator (where applicable) is rated at 3 kW. All component technical and cost parameters are reported in Table 1.
Table 1.
Component technical and cost parameters used in HOMER Pro simulations.
3.5. Mathematical Modelling
3.5.1. PV Power Output
HOMER Pro computes the instantaneous PV electrical output using the following irradiance-based formulation with a derating factor [24]:
where PPV is the PV output power (kW); fPV is the PV derating factor (accounting for soiling, wiring losses, and temperature effects; set to 0.85 in this study); YPV is the rated PV capacity under standard test conditions (kW); IT is the incident solar irradiance on the array surface (kW·m−2); and IS is the irradiance at standard test conditions (1 kW·m−2). For tracking systems, IT is recalculated at each timestep based on the tracking geometry applied.
3.5.2. Battery Storage and Lifetime
Battery behaviour is modelled using charge/discharge constraints, a minimum state of charge (SOC_min = 30%), round-trip efficiency (η = 80%), and a throughput-based lifetime formulation. HOMER estimates battery lifetime as:
where Rbatt is the battery lifetime (years); Nbatt is the number of battery units; Qlifetime is the total lifetime throughput per unit (kWh); Qthrpt is the annual throughput (kWh·year−1); and Rbatt,f is the maximum calendar life. Replacement and salvage costs are computed internally by HOMER within the lifecycle economic model.
3.5.3. Levelised Cost of Energy (LCOE)
LCOE is calculated using HOMER as the annualised total system cost divided by the total electrical energy served to loads [24]:
where Cann,tot is the total annualised system cost (USD/year), computed as the NPC multiplied by the capital recovery factor; and Eserved is the total annual electrical load served (kWh/year). For purely electrical systems with no thermal load, the boiler cost term in the full HOMER LCOE equation is set to zero.
3.5.4. Renewable Fraction (RF)
The renewable fraction is defined as the proportion of total annual electrical energy delivered to loads that originates from renewable sources (PV in this study):
where E_renewable is the annual energy from PV (kWh/year), and E total, served is the total annual energy served to all loads (kWh/year) [34].
3.5.5. Energy Production Density (EPD)
EPD quantifies the annual energy production per unit total station mass (kWh·yr−1·kg−1), serving as a proxy for mobility efficiency:
where E_annual, PV is the total annual PV energy production (kWh/year), and M_station is the total station mass (kg), including PV array, battery bank, inverter (where applicable), and generator (where applicable). Higher EPD values indicate that more energy is produced per unit mass, improving the practical deployability of mobile stations.
3.5.6. PV Energy Production-to-Load Ratio (PV-EPTLR)
PV-EPTLR expresses annual PV energy production as a percentage of annual load demand, providing a measure of PV generation surplus relative to demand:
Values exceeding 100% indicate surplus PV generation, which in off-grid systems is either stored in batteries or dispatched as excess electricity.
3.6. Simulation Settings and Optimisation Framework
All simulations are performed in HOMER Pro (v3.18.4) using hourly time-series analysis over a 25-year project lifetime, consistent with the PV module design life. The optimisation objective is the minimisation of NPC subject to a maximum annual unmet load fraction of 1% and a maximum capacity shortage fraction of 1%. The real discount rate is set at 6%, the annual inflation rate to 2%, and the PV derating factor to 0.85. The PV derating factor of 0.85 was selected to account for aggregate performance degradation including dust accumulation, elevated operating temperatures, wiring losses, and general environmental derating effects. However, dynamic seasonal variations associated with severe dust storms and temperature fluctuations were not explicitly modelled within the simulations and are discussed further in Section 6.5 as a study limitation. Component costs are based on current Kuwaiti market prices and are reported in Table 1. Sensitivity analyses were performed on solar radiation (±10%), load demand (±15%), and battery cost (±20%) to assess the robustness of the recommended configurations.
HOMER Optimisation and Dispatch Strategy
HOMER Pro performs chronological hourly simulations over the entire project lifetime while evaluating thousands of feasible system combinations to identify the configuration that minimises the total Net Present Cost (NPC) subject to predefined reliability constraints. In the present study, the optimisation objective function was defined as the minimisation of lifecycle costs while maintaining reliable electrical supply under off-grid operating conditions. The optimisation framework considered the following decision variables:
- Photovoltaic array size;
- Battery bank capacity;
- Diesel generator operation;
- Photovoltaic tracking configuration.
The simulations employed hourly solar radiation and load-demand profiles over a 25-year project lifetime. Reliability constraints included:
- Maximum annual unmet load fraction of 1%.
- Maximum annual capacity shortage fraction of 1%.
- Minimum battery state of charge of 30%.
A load-following dispatch strategy was implemented for hybrid systems containing diesel generator backup. Under this strategy, the generator supplies only the instantaneous electrical demand required to satisfy the load while prioritising photovoltaic energy utilisation and battery charging whenever renewable generation is available. This operational strategy minimises generator fuel consumption and associated CO2 emissions. For fully renewable systems, the battery bank compensates for short-term irradiance variability and nighttime operation. During periods of excess photovoltaic production, surplus electricity is directed toward battery charging. Any remaining excess electricity after battery saturation is considered curtailed energy by HOMER Pro. Sensitivity analyses were additionally performed for the following:
- Solar irradiance variability (±10%).
- Battery cost uncertainty (±20%).
- Load-demand fluctuations (±15%).
These analyses were conducted to evaluate the robustness of the recommended configurations under realistic operational and economic uncertainties characteristic of Kuwait’s desert environment.
4. Results and Discussion
4.1. Scenarios 1 and 2: DC–AC Bus Architecture (Systems 1 and 2)
Table 2 presents the techno-economic and environmental performance metrics for Systems 1 and 2, both employing a DC–AC bus architecture with a fixed-tilt PV array.
Table 2.
Techno-economic and environmental performance of DC–AC bus systems (Scenarios 1 and 2).
4.1.1. System 1: Fully Renewable DC–AC System
System 1 is a fully renewable configuration comprising a 6.19 kW PV array, a 12-unit battery bank (37.1 kWh nominal), and a 5 kW DC–AC inverter. The system achieves a 100% renewable fraction and zero annual CO2 emissions, producing 10,504 kWh/year of PV electricity at a PV-EPTLR of 163%. Energy reliability is maintained through deliberate PV and storage oversizing, which compensates for periods of reduced solar irradiance, particularly during winter months. However, this strategy results in significant excess electricity (approximately 34.2% of annual PV production, consistent with the authors’ prior work [14]), indicating imperfect PV–load–storage matching. The NPC of USD 14,696 and LCOE of 0.176 USD/kWh are the highest among all ten systems, driven primarily by the large battery bank capital cost. The EPD is 8.82 kWh·yr−1·kg−1, reflecting the mass contribution of the oversized storage system.
4.1.2. System 2: Hybrid DC–AC System with Diesel Generator
System 2 introduces a 3 kW diesel generator alongside a reduced 4.77 kW PV array and a three-unit battery bank (9.26 kWh). The generator provides backup power during periods of insufficient PV generation and low battery SOC, enabling a 24% reduction in PV capacity and a 75% reduction in battery bank size compared to System 1. Annual PV production is 8101 kWh/year, supplemented by 484 kWh/year from the generator (156 L of diesel), yielding a PV-EPTLR of 125% and a renewable fraction of 92.5%. The significant reduction in battery bank mass raises the EPD to 13.07 kWh·yr−1·kg−1, a 48% improvement over System 1. The NPC falls to USD 11,208 and LCOE to 0.134 USD/kWh, representing a 24% and 24% reduction, respectively, relative to System 1. However, generator operation introduces 408 kg CO2/year and additional operational complexity including oil changes, air filter replacements, and fuel logistics, which are non-trivial considerations for remote agricultural deployments.
4.1.3. Comparative Analysis: Systems 1 and 2
The comparison between Systems 1 and 2 illustrates the fundamental trade-off between environmental sustainability and economic efficiency in DC–AC mobile charging architectures. System 1 achieves complete decarbonisation at the expense of higher capital cost and system mass, while System 2 offers a more cost-effective and weight-efficient solution at the cost of 7.5% fossil-fuel energy input and approximately 408 kg CO2/year. For deployments in environmentally sensitive regions or where fuel logistics are impractical, System 1 is the preferred choice. For cost-constrained applications where limited emissions are acceptable, System 2 provides a viable compromise. Neither system exploits PV tracking, which limits both the energy yield and EPD relative to the DC-bank configurations evaluated in subsequent scenarios.
4.2. Scenario 3: DC-Bank Architecture with Generator Support (Systems 3–6)
Table 3 presents the performance metrics for Systems 3–6, all implemented as pure DC-bank architectures with diesel generator backup. In these configurations, PV arrays, BESSs, and the generator connect directly to a common DC bus, eliminating DC-to-AC conversion losses. Within this unified architecture, Systems 3–6 employ fixed-tilt, two-axis, horizontal single-axis, and vertical single-axis tracking, respectively, with three battery units (9.26 kWh nominal) in the tracking configurations and twelve units (37.1 kWh) in the fixed-tilt configuration.
Table 3.
Techno-economic and environmental performance of DC-bank hybrid systems (Scenario 3, Systems 3–6).
4.2.1. Impact of DC-Bank Architecture
Comparing System 3 (fixed-tilt DC-bank, USD 9719 NPC) with System 1 (fixed-tilt DC–AC, USD 14,696 NPC) reveals a 34% NPC reduction attributable to the pure DC architecture, even before any tracking benefit is applied. This improvement arises from the elimination of inverter capital and replacement costs, reduced conversion losses improving effective energy delivered per unit of PV production, and consistency of the DC supply with the native DC architecture of both PV modules and battery storage.
4.2.2. PV Tracking Performance in DC-Bank Hybrid Systems
Within the DC-bank hybrid configurations (Systems 3–6), the tracking strategy exerts a decisive influence on PV energy production, storage requirements, cost, and environmental impact. System 4 (two-axis tracking) achieves the highest annual PV output at 13,635 kWh/year, followed by System 6 (vertical single-axis, 12,474 kWh/year), System 5 (horizontal single-axis, 10,901 kWh/year), and System 3 (fixed, 10,509 kWh/year). The 30% increase in PV yield by System 4 over System 3 at approximately the same PV capacity (5.91 vs. 6.19 kW) enables the battery bank to be reduced from 12 units (37.1 kWh) to three units (9.26 kWh), dramatically reducing capital cost and system mass.
System 6 achieves the lowest NPC (USD 6272) and LCOE (0.0751 USD/kWh) among all ten systems, representing a 57% cost reduction relative to System 1. This outcome reflects the combination of DC-bank efficiency, vertical tracking yield, and minimal storage sizing. System 4 is marginally more expensive (USD 6286 NPC) but delivers a higher energy yield and EPD. System 5 exhibits the least improvement among tracking configurations, consistent with horizontal tracking’s limited ability to compensate for seasonal solar elevation changes in Kuwait’s subtropical latitude.
The superior performance of two-axis tracking systems is primarily attributed to their continuous orthogonal alignment with incident solar irradiance throughout both daily azimuthal motion and seasonal solar elevation changes. Under Kuwait’s desert climate, where solar elevation angles vary substantially between summer and winter periods, this capability significantly increases effective irradiance capture duration relative to fixed-tilt systems. In contrast, horizontal single-axis tracking primarily improves east–west solar tracking during daytime operation but provides limited compensation for seasonal elevation variation, thereby reducing its relative performance advantage under subtropical climatic conditions. Vertical single-axis tracking offers an intermediate solution by improving seasonal irradiance capture while maintaining a lower mechanical complexity than two-axis systems. Consequently, the VSAT configuration demonstrates an advantageous balance between the energy yield, lifecycle cost, structural simplicity, and operational reliability.
4.2.3. Environmental Performance
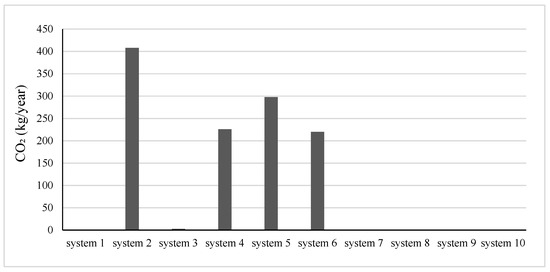
System 3 achieves a renewable fraction of 100%; however, this result requires clarification. HOMER reports RF = 100%, because the generator only operates for approximately 0.3 h/year, producing 1.02 L of fuel (2.66 kg CO2/year)—a contribution so small that rounding in HOMER’s RF calculation yields 100%. In practice, System 3 is therefore a near-100% renewable system that retains generator backup capability. Among tracking-based hybrid systems, System 6 records the lowest CO2 emissions (220 kg/year), closely followed by System 4 (226 kg/year), while System 5 produces the highest emissions at 298 kg/year due to greater generator reliance attributable to its limited seasonal compensation.
4.3. Scenario 4: Fully Renewable DC-Bank Systems (Systems 7–10)
Systems 7–10 represent fully renewable zero-emission DC-bank configurations with no generator, using 15 battery units (46.3 kWh nominal) to ensure energy autonomy. All systems share identical PV capacity (5.91 kW) and battery sizing; performance differences arise exclusively from the PV tracking strategy. Table 4 presents the performance metrics.
Table 4.
Techno-economic and environmental performance of fully renewable DC-bank systems (Scenario 4, Systems 7–10).
4.3.1. PV Energy Production and EPD
System 8 (two-axis tracking) achieves the highest PV production at 13,635 kWh/year—a 36% increase over System 7 (fixed, 10,033 kWh/year), 25% over System 9 (horizontal single-axis, 10,901 kWh/year), and 9% over System 10 (vertical single-axis, 12,474 kWh/year). These production gains translate directly into improved EPD: System 8 reaches 10.21 kWh·yr−1·kg−1 compared to 7.51 for System 7, 8.16 for System 9, and 9.34 for System 10—improvements of 36%, 9%, and 25% over the fixed-tilt baseline, respectively. The 36% gain in EPD for System 8 is consistent with the two-axis tracking performance reported in comparable arid climates [15,16,22].
4.3.2. Economic Performance Under Equal Component Sizing
Since all four systems sharee identical PV capacity, battery bank, and economic assumptions, their absolute NPC and LCOE values are equal (USD 10,618 and 0.127 USD/kWh, respectively). This is an important modelling constraint that reflects HOMER’s optimisation under fixed component assumptions. However, when interpreted in terms of cost per unit of energy delivered, the advantage of tracking is significant: System 8’s 36% higher annual energy output at the same lifecycle cost implies a 26% reduction in the effective cost per useful kWh relative to System 7. This interpretation is consistent with the way LCOE would evolve if component sizing were re-optimised for tracking configurations, as demonstrated in Scenario 3.
4.3.3. Renewable Surplus and Reliability
All four systems achieve zero CO2 emissions and a 100% renewable fraction. The PV-EPTLR values—211% for System 8, 193% for System 10, 169% for System 9, and 155% for System 7—indicate that all systems generate substantial surplus PV electricity beyond the load demand. This surplus, stored in the 46.3 kWh battery bank, ensures reliable energy delivery during low-irradiance winter periods and overnight. The higher surplus in Systems 8 and 10 provides greater resilience against prolonged cloudy periods, making these configurations better suited to Kuwait’s winter months (November–February).
5. Comparative Analysis Across All Ten Systems
Table 5 provides a consolidated comparison of all ten systems across the seven key performance indicators, enabling cross-scenario assessment.
Table 5.
Consolidated performance comparison of all ten mobile MEV charging station configurations.
5.1. Comparative Environmental Performance
Zero-emission performance (Figure 5) is achieved with all fully renewable systems (Systems 1, 3, 7, 8, 9, and 10). Among hybrid systems, System 6 records the lowest annual CO2 emissions (220 kg/year), followed closely by System 4 (226 kg/year). System 2 produces the highest emissions (408 kg/year), reflecting greater generator dependency in the DC–AC architecture. The fully renewable DC-bank systems (Systems 7–10) provide a 100% reduction in operational emissions compared to all hybrid configurations—a critical advantage for deployments in environmentally sensitive agricultural zones or under strict net-zero operational mandates.
Figure 5.
Annual emissions (CO2).
5.2. Economic Performance
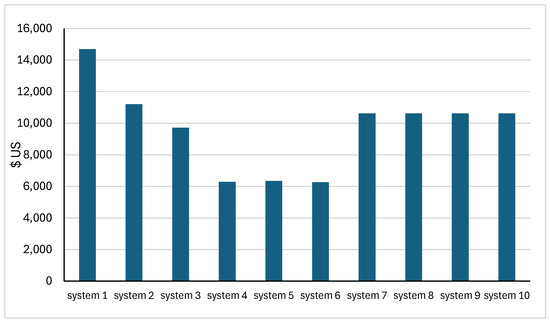
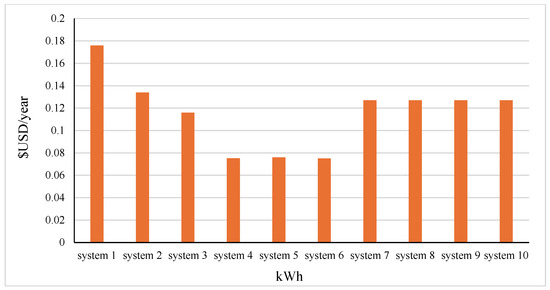
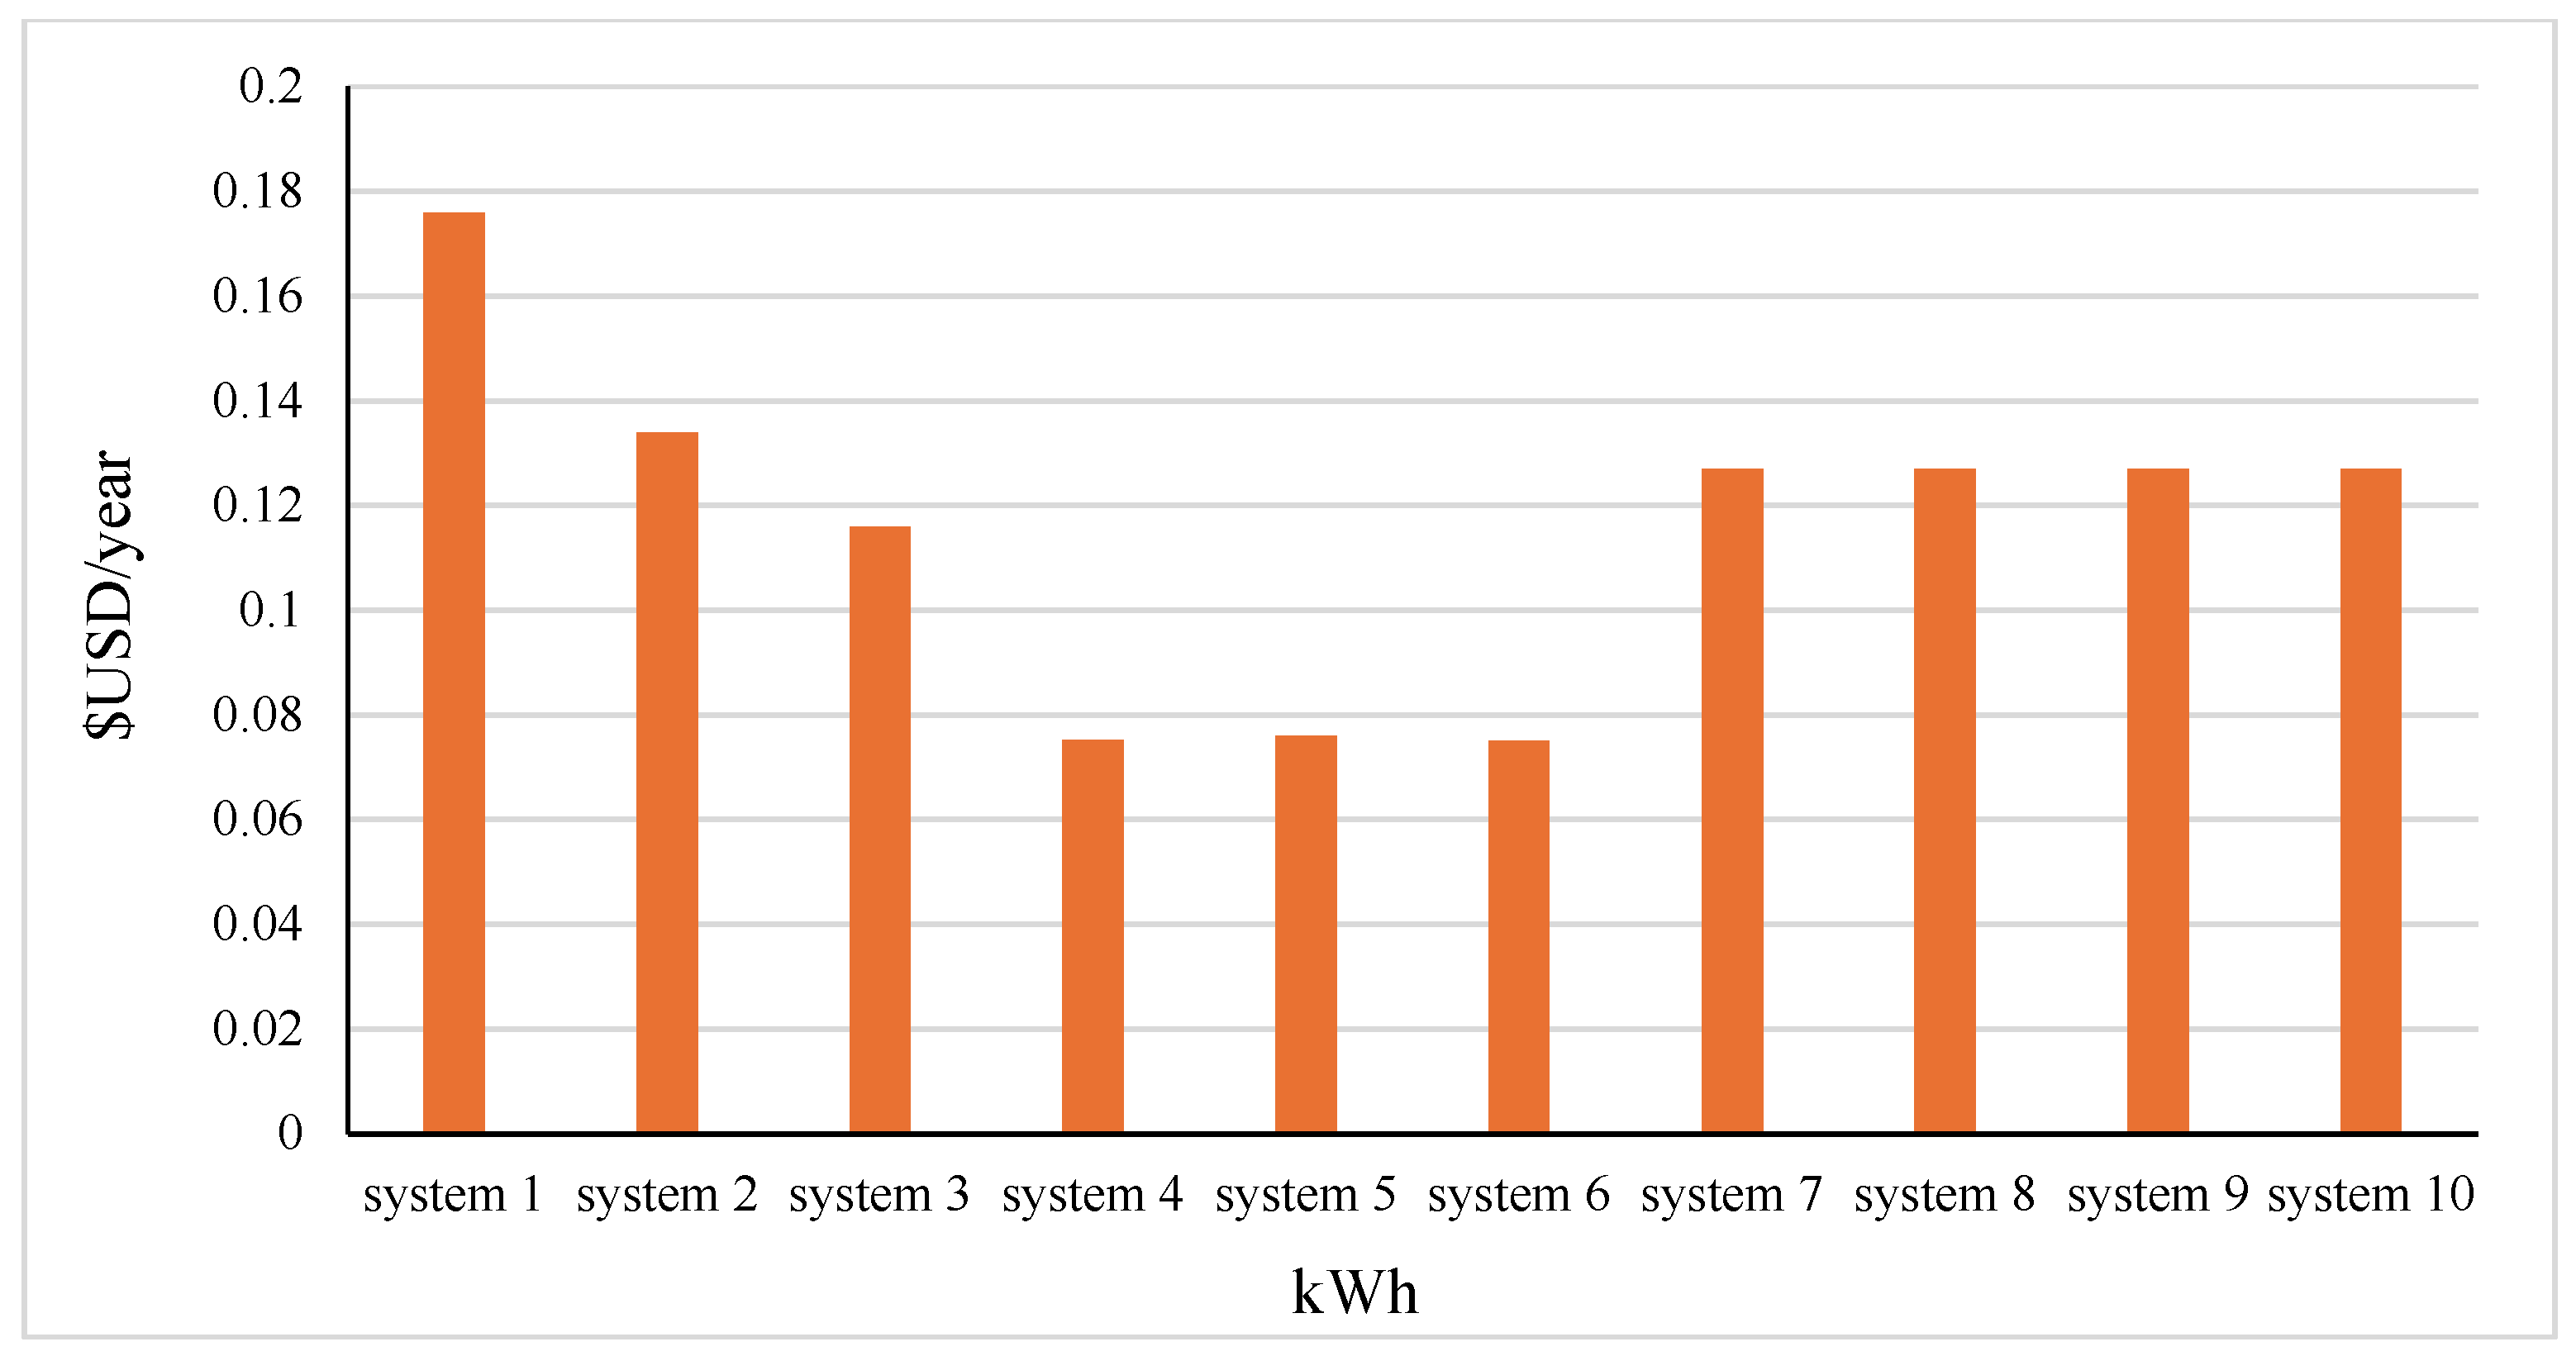
System 6 (VSAT, DC-bank with generator) achieves the lowest NPC (USD 6272) and LCOE (0.0751 USD/kWh) across all ten configurations, representing a 57% cost reduction relative to System 1 (the baseline DC–AC fixed-tilt system) (Figure 6). This result is driven by the combination of DC-bank efficiency, vertical single-axis tracking yield, and minimal battery storage (9.26 kWh). Systems 4 and 6 are nearly cost-equivalent (USD 6286 vs. 6272 NPC), with System 6 marginally superior due to its slightly higher PV yield relative to the generator dependency ratio. The fully renewable systems (Systems 7–10) carry a moderate cost premium (NPC ≈ USD 10,618; LCOE = 0.127 USD/kWh) relative to the hybrid configurations, attributable to the larger battery bank required for off-grid reliability without generator backup (Figure 7). This premium represents the “cost of zero emissions” and should be evaluated against carbon pricing, fuel supply logistics costs, and long-term fossil-fuel price risk in Kuwait.
Figure 6.
Net Present Cost ($US).
Figure 7.
Levelised Cost of Energy ($/kWh).
5.3. Mobility and Structural Efficiency (EPD)
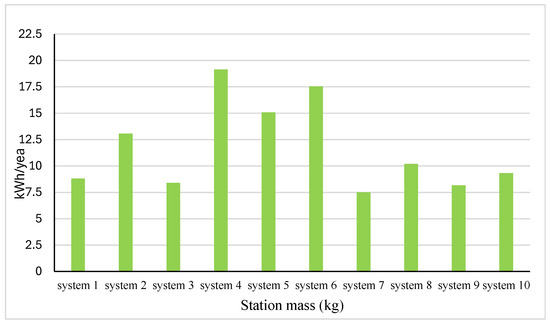
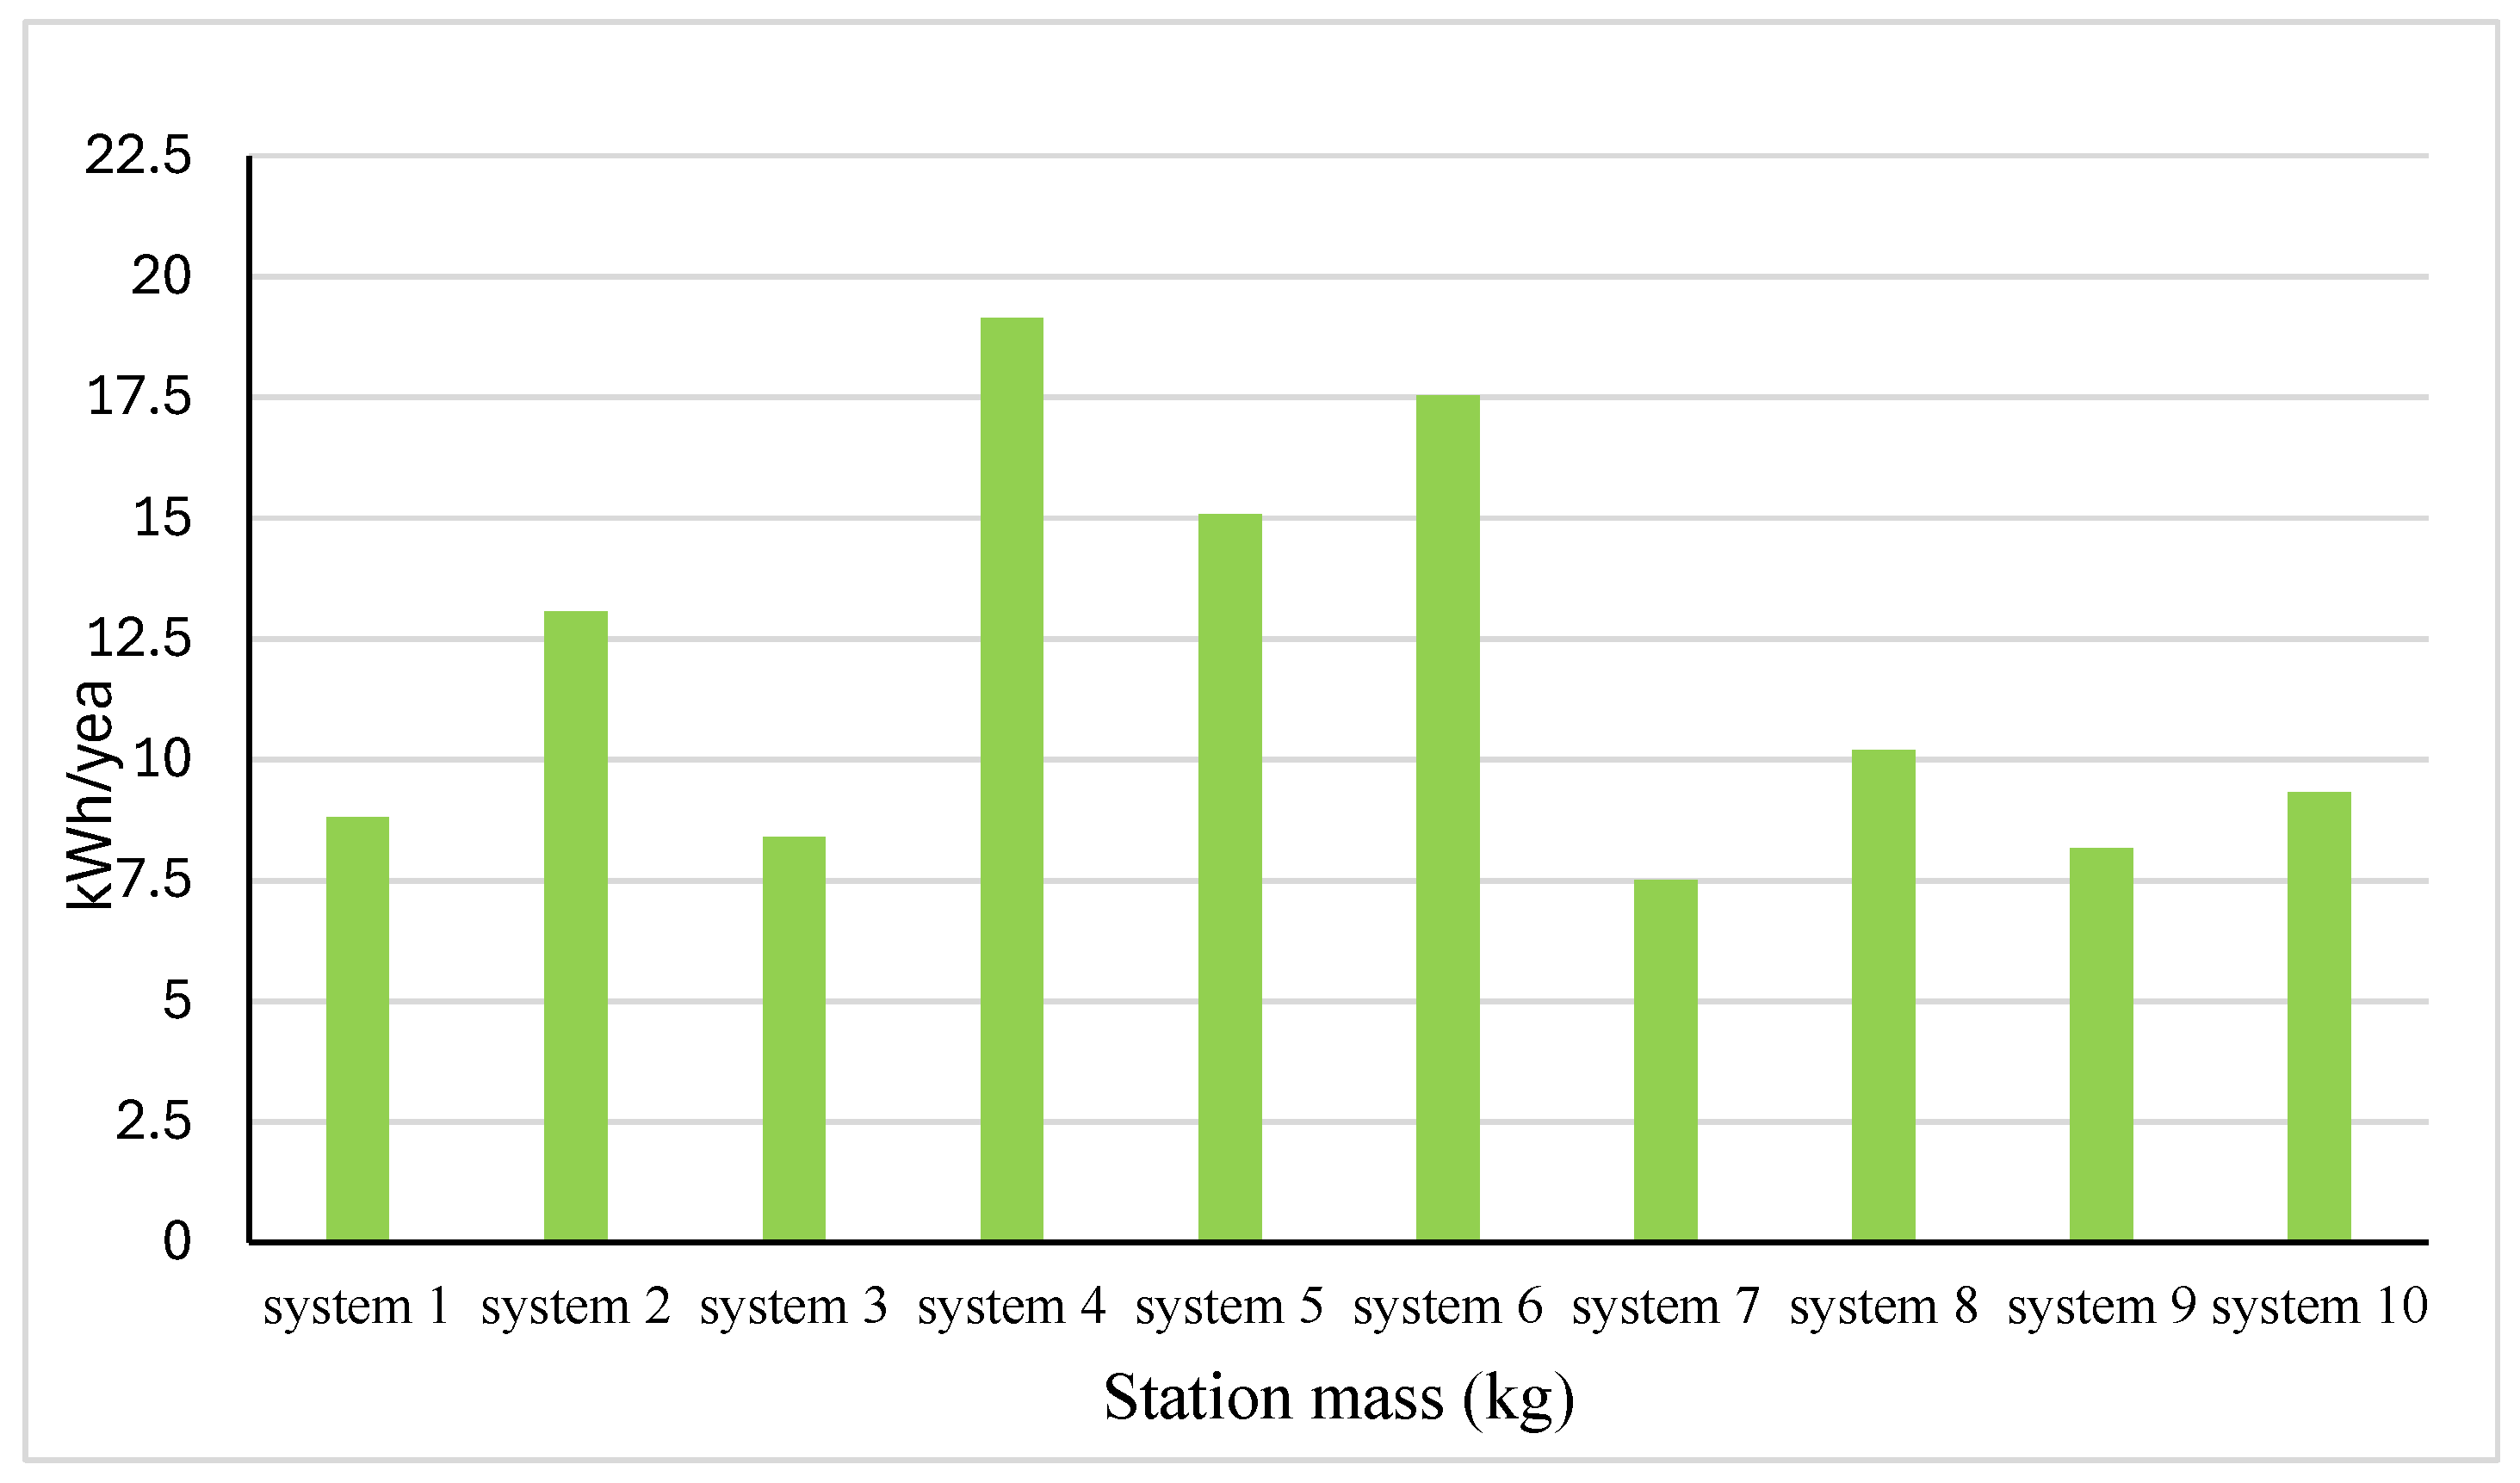
System 4 (TAT, DC-bank with generator) achieves the highest absolute EPD (19.15 kWh·yr−1·kg−1), owing to its combination of high two-axis tracking yield and minimal battery bank mass (Figure 8). System 8 (TAT, DC-bank without generator) achieves 10.21 kWh·yr−1·kg−1—the highest EPD among fully renewable configurations, 36% above the fixed-tilt zero-emission baseline (System 7, 7.51 kWh·yr−1·kg−1). For mobile charging platforms where transportation constraints are paramount, System 4 offers the best mass efficiency but carries fossil-fuel dependency; System 8 offers the best mass efficiency among zero-emission options.
Figure 8.
Energy Production Density—EPD (kWh/year.kg).
5.4. Optimal System Selection by Design Objective
Based on the multi-criteria analysis, three systems emerge as recommended choices depending on the primary design objective:
- System 8 (TAT, DC-bank, and no generator): Best for sustainability and clean energy. Achieves maximum PV production (13,635 kWh/year), 100% RF, zero CO2 emissions, and the highest EPD among zero-emission systems (10.21 kWh·yr−1·kg−1). Recommended for deployments where environmental performance and grid independence are paramount.
- System 6 (VSAT, DC-bank, and generator): Best for lifecycle cost minimisation. Achieves lowest NPC (USD 6272) and LCOE (0.0751 USD/kWh) with 96.5% RF. Recommended for cost-sensitive deployments where limited generator use is operationally acceptable.
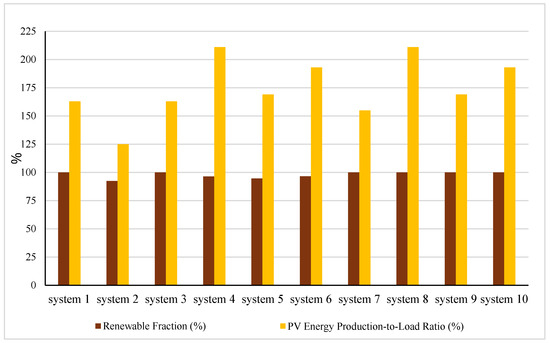
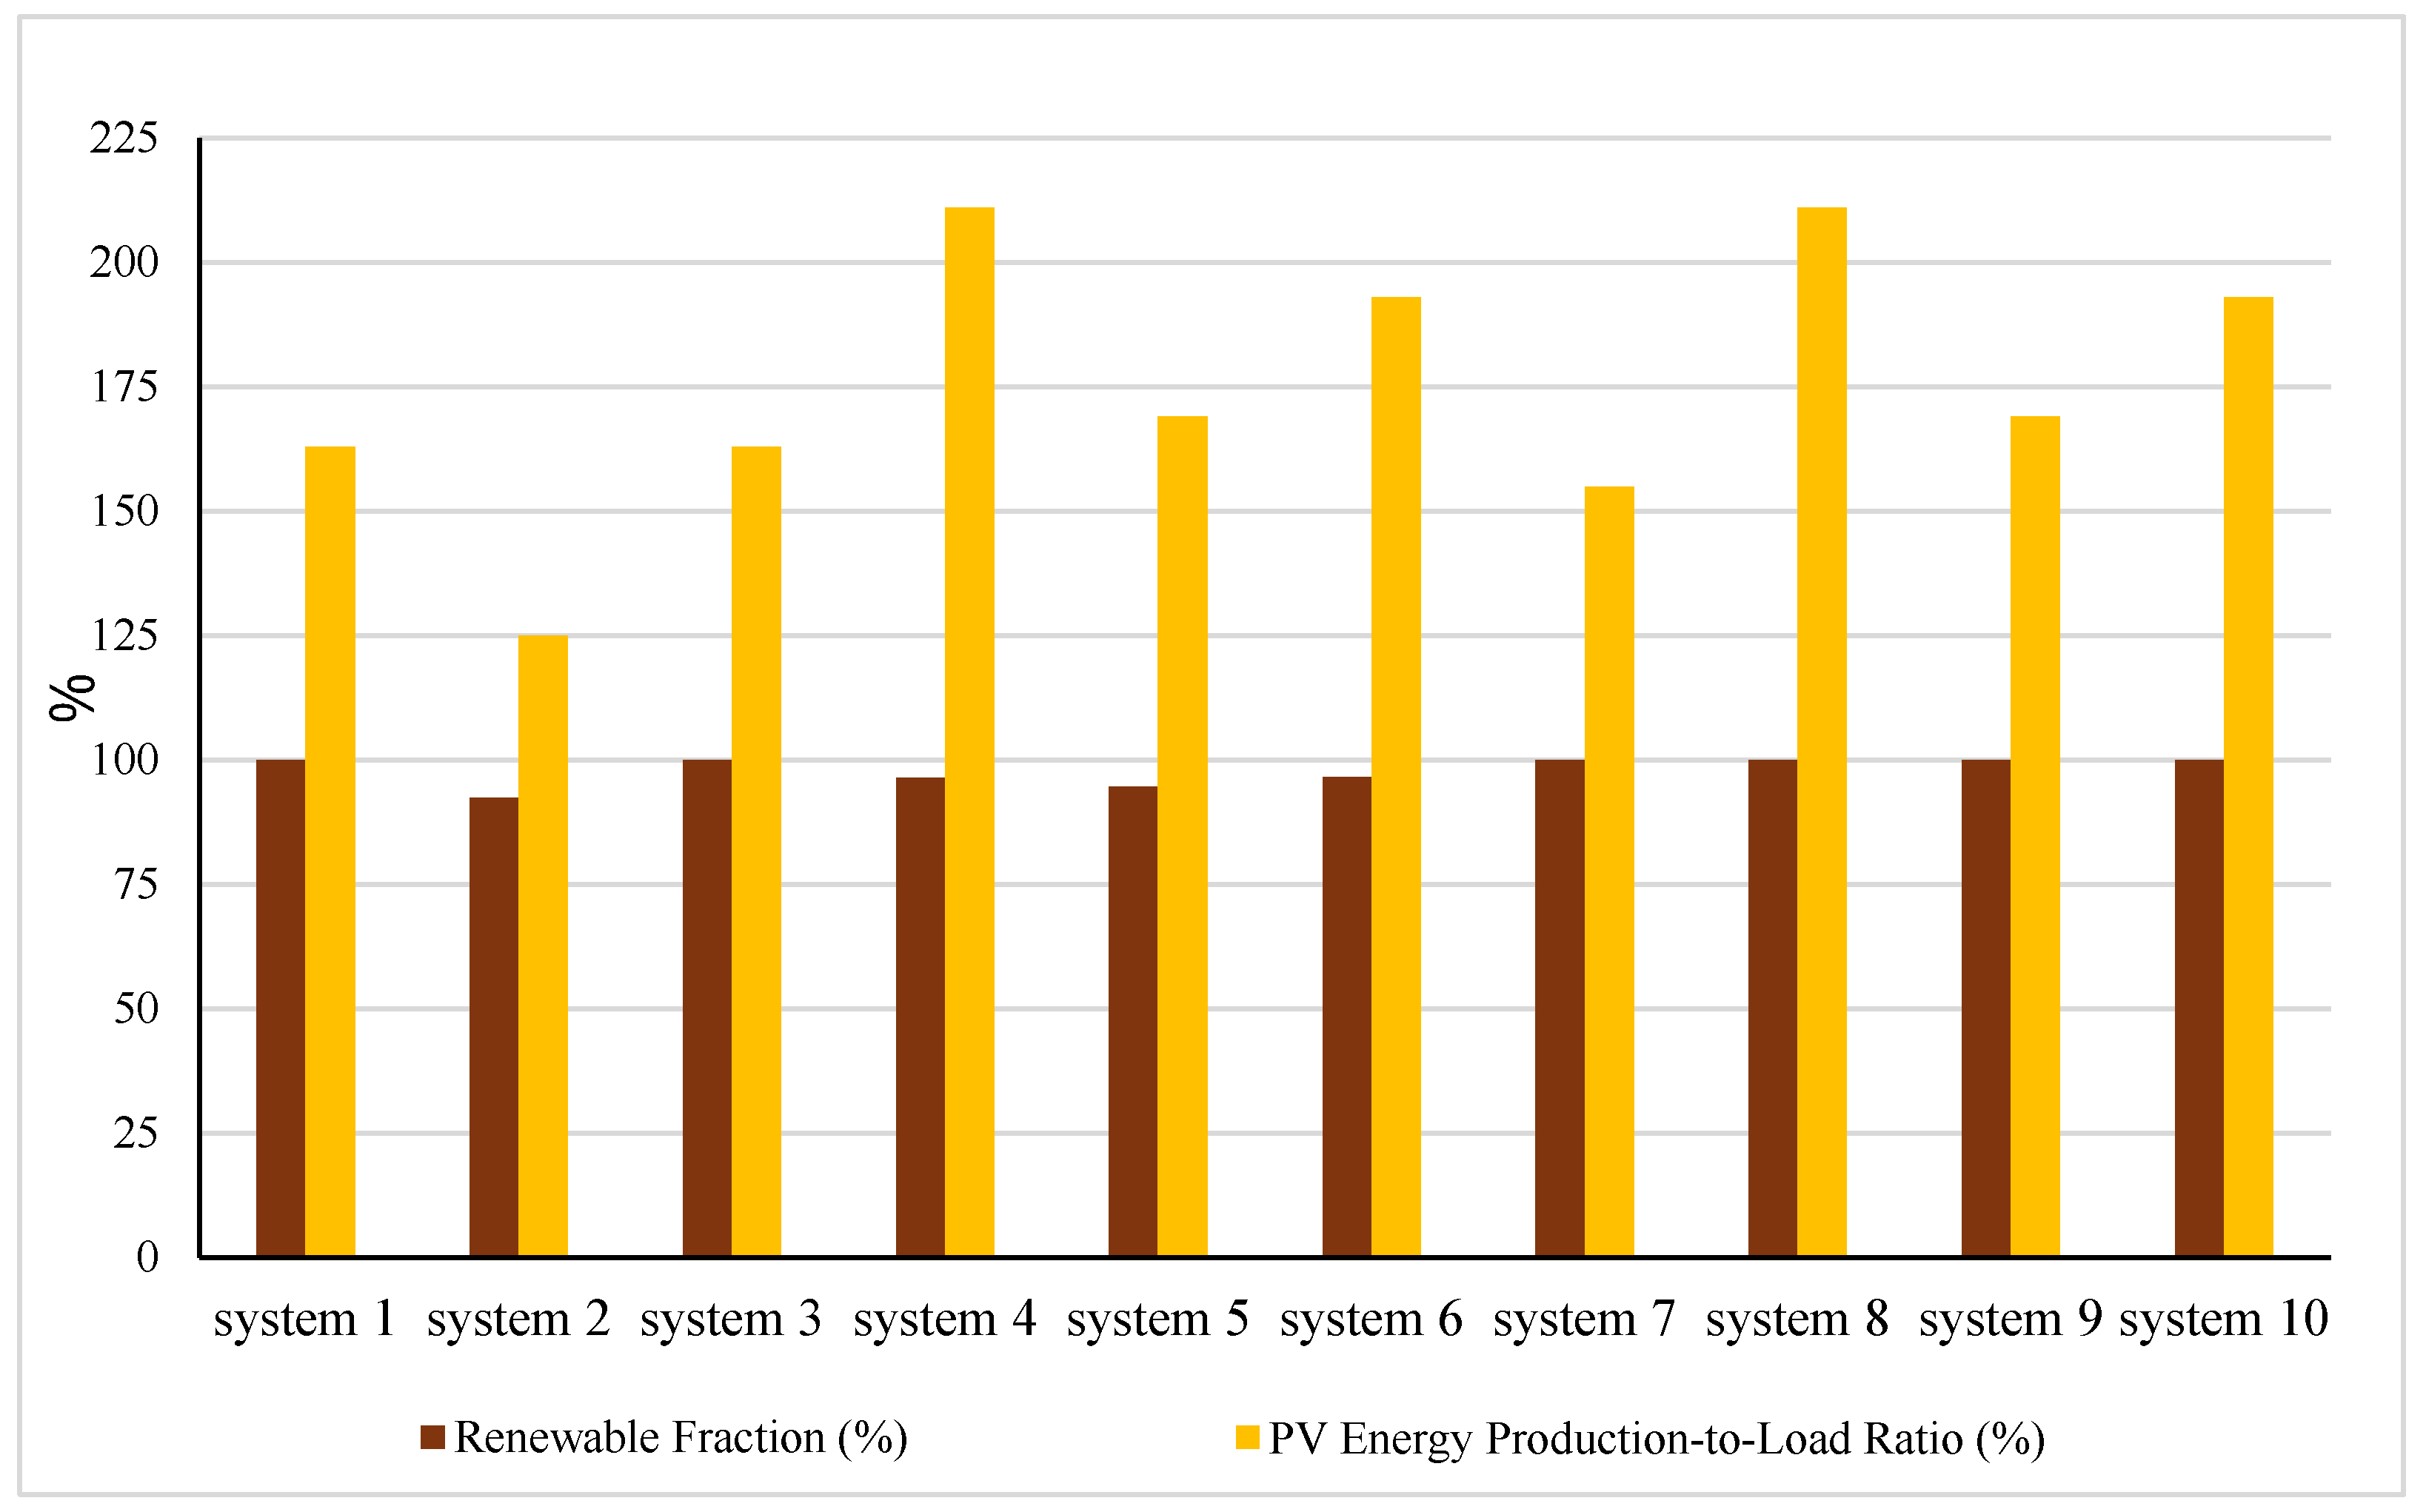
- System 10 (VSAT, DC-bank, and no generator): Best balanced solution. Delivers 12,474 kWh/year PV production, zero emissions, 100% RF, and an EPD of 9.34 kWh·yr−1·kg−1 at the same cost as System 8, with substantially lower mechanical complexity than two-axis tracking (Figure 9). Recommended as the most practical zero-emission option for field deployment.Figure 9. Renewable fraction (%) and Energy Production Density (EPD).
6. Discussion
6.1. PV Tracking Performance: Contextualisation Against the Existing Literature
The 36% increase in annual PV energy production achieved by two-axis tracking (System 8: 13,635 kWh/year) relative to fixed-tilt operation (System 7: 10,033 kWh/year) is well aligned with performance gains reported in the literature for comparable high-irradiance arid environments. Iqbal et al. [15] reported dual-axis tracking gains of 32–38% over fixed panels under similar desert conditions, while Pirayawaraporn et al. [22] documented a 37.87% energy production increase for a 20 kW dual-axis plant in Tehran. Dursun et al. [16], using HOMER Pro for a PV–reformer–fuel cell hybrid in Algeria, identified two-axis tracking as the optimal configuration with the lowest LCOE outcome, mirroring the economic advantage of System 6 (VSAT, 0.0751 USD/kWh) identified here. The present study extends these findings to the specific context of a mobile off-grid MEV charging platform, confirming that two-axis tracking energy yield gains are reproducible across high-irradiance arid sites regardless of the application scale.
The relative performance of vertical single-axis tracking (System 10: 12,474 kWh/year, +24% over fixed) versus horizontal single-axis tracking (System 9: 10,901 kWh/year, +9%) is consistent with the latitude-specific advantage of VSAT at Kuwait’s location (~28.5° N). At subtropical latitudes, seasonal variation in solar elevation is pronounced, and VSAT’s capacity to compensate for this variation provides a material yield advantage over HSAT, which primarily improves daily east–west capture. This result is consistent with Dursun et al. [16], who noted that VSAT consistently outperforms HSAT in locations with large seasonal irradiance swings. The practical implication is that VSAT delivers approximately two-thirds of the absolute gain of two-axis tracking at a substantially lower mechanical complexity—a trade-off that strongly favours VSAT for mobile platforms where maintenance access is constrained.
Electrical Efficiency and Conversion Pathways
The comparative performance differences observed between DC–AC and DC-bank architectures are fundamentally linked to the electrical conversion pathways associated with each configuration. In DC–AC systems, electrical power generated by photovoltaic arrays undergoes multiple conversion stages before reaching the final charging load. These stages include DC-to-AC inversion, AC transmission, and AC-to-DC rectification during battery charging. Each conversion stage introduces efficiency penalties and thermal losses. Even under high-performance inverter operation (95–97% efficiency), repeated power conditioning stages reduce the effective usable electrical energy delivered to the charging system. Additionally, inverter operation introduces harmonic distortion, switching losses, and reactive power management requirements, increasing both operational complexity and maintenance demand.
In contrast, pure DC-bank systems provide direct coupling between photovoltaic generation, battery storage, and charging loads. This configuration minimises intermediary conversion stages and therefore improves effective energy utilisation. The elimination of repeated conversion processes also reduces thermal stress on electronic components, improving long-term system reliability under Kuwait’s extreme ambient temperatures.
The findings of the present study confirm that the efficiency advantages of DC-bank architectures translate directly into reduced battery sizing requirements, lower lifecycle cost, improved Energy Production Density (EPD), and reduced dependence on generator backup operation.
6.2. Economic Performance: Benchmarking Against Comparable Studies
The LCOE range of 0.0751–0.176 USD/kWh across the ten systems compares favourably with published values for analogous applications in the Gulf and Middle East. AlRukaibi et al. [28] reported LCOE values of 0.09–0.15 USD/kWh for grid-connected PV–wind EV charging stations in Kuwait—a range overlapping the hybrid DC-bank configurations (Systems 3–6: 0.075–0.116 USD/kWh) despite the grid-connected context providing an inherent economic advantage. Al Wahedi and Bicer [27] reported NPC values of USD 1.2–2.8 million for a larger-scale standalone renewable EV charging station in Qatar, broadly corresponding to LCOE values in the 0.12–0.20 USD/kWh range—consistent with the fully renewable DC-bank systems (Systems 7–10: 0.127 USD/kWh) found here. Praveenkumar et al. [29], evaluating PV-based EV charging across five Indian climatic conditions, reported LCOE values of 0.08–0.18 USD/kWh for high-irradiance arid sites, again consistent with the present findings.
The 57% NPC reduction from the DC–AC fixed-tilt baseline (System 1: USD 14,696) to the best-performing hybrid configuration (System 6: USD 6272) reflects two compounding effects: (i) elimination of inverter capital and replacement costs through pure DC-bank architecture, contributing a 34% NPC reduction alone when comparing System 1 with System 3; and (ii) reduction in required battery bank size from 37.1 kWh to 9.26 kWh, enabled by VSAT yield. This decomposition is consistent with Rivera et al. [20], who identified DC-bus architectures as inherently more cost-efficient for off-grid EV charging due to the elimination of redundant conversion stages. The additional 35% reduction from System 3 to System 6 confirms that PV tracking is not merely an energy performance enhancement but a primary cost-reduction lever in off-grid solar MEV charging design.
6.3. System 8 vs. System 10: Trade-Off Analysis for Zero-Emission Deployment
Among the fully renewable zero-emission configurations (Systems 7–10), the selection between System 8 (two-axis tracking) and System 10 (vertical single-axis tracking) represents the most consequential design decision. Both systems share an identical NPC (USD 10,618), LCOE (0.127 USD/kWh), PV capacity (5.91 kW), and battery bank (46.3 kWh), and both achieve a 100% renewable fraction and zero CO2 emissions. The differentiation lies in the energy yield and EPD: System 8 delivers 13,635 kWh/year versus 12,474 kWh/year for System 10—a 9.3% yield advantage—while its EPD is 10.21 vs. 9.34 kWh·yr−1·kg−1, which is an 8.8% improvement in structural efficiency. These gains come at the cost of significantly greater mechanical complexity: a two-axis tracking mechanism requires two independent drive axes, a more sophisticated solar position algorithm, greater structural reinforcement on a mobile platform, and higher susceptibility to wind-induced vibration and mechanical failure in harsh desert conditions.
For the Al-Wafra agricultural context, where the station must be periodically relocated and operated by non-specialist personnel, the operational robustness of VSAT (System 10) is a significant practical advantage. The 9.3% yield gap translates into approximately 1161 kWh/year of additional PV production for System 8—surplus that, given the already substantial PV-EPTLR values of 193% (System 10) and 211% (System 8), primarily constitutes excess electricity rather than meaningful improvement in load coverage. Both systems maintain a near-zero unmet load (<1%) under HOMER’s reliability constraints. Consequently, for most field deployment scenarios at Al-Wafra, System 10 is recommended as the more practical zero-emission solution, with System 8 reserved for high-priority showcase deployments where maximum renewable surplus and EPD are explicitly required.
6.4. Environmental Impact and the Cost of Zero Emissions
The fully renewable DC-bank systems (Systems 7–10) achieve a 100% elimination of operational CO2 emissions compared to the best-performing hybrid configuration (System 6: 220 kg CO2/year). The incremental cost of this complete decarbonisation is represented by the NPC difference between System 6 (USD 6272) and System 10 (USD 10,618)—an additional USD 4346 over 25 years, approximately USD 174/year. Expressed per unit of avoided CO2, this corresponds to roughly USD 0.79/kg CO2 avoided—a value exceeding current voluntary carbon market prices but is competitive with carbon pricing levels projected for Gulf Cooperation Council countries under ambitious net-zero scenarios [13]. As carbon pricing mechanisms mature in the Gulf region, the economic case for fully renewable configurations will strengthen considerably, improving the competitiveness of Systems 7–10 relative to hybrid alternatives without requiring any change in technical design.
Beyond direct operational emissions, the fully renewable configurations eliminate the logistical burden and cost volatility associated with diesel fuel supply in remote agricultural settings. Fuel delivery to Al-Wafra during peak summer months, when road conditions and extreme temperatures complicate transport operations, represents an operational risk and hidden cost not captured in the HOMER economic model. The complete elimination of fuel dependency in Systems 7–10 therefore provides energy security benefits that reinforce the economic case beyond the direct cost differential, consistent with the broader literature on the strategic value of energy independence for off-grid systems in developing regions [4].
Although lithium-ion batteries provide a substantially higher energy density, lower mass, deeper depth-of-discharge capability, and improved cycle life compared to lead–acid batteries, lead–acid technology was selected in the present study primarily due to its lower capital cost, widespread commercial availability, operational simplicity, and compatibility with low-cost off-grid charging applications in agricultural regions. The use of lithium-ion batteries could further improve the Energy Production Density (EPD) and reduce total station mass, which is particularly beneficial for mobile charging platforms. However, lithium-ion systems also introduce a higher initial investment cost, more complex battery management requirements, and additional thermal management considerations under Kuwait’s extreme desert temperatures. Future work should therefore investigate lithium-ion and hybrid battery technologies within the same optimisation framework to evaluate their techno-economic trade-offs relative to lead–acid systems.
6.5. Operational Constraints: Soiling and Temperature Degradation in Kuwait
Two operational factors specific to Kuwait’s desert climate warrant explicit discussion: dust-induced soiling of PV panels and temperature-accelerated battery degradation. A dedicated study of PV soiling in Kuwait [35] reported that, without any mitigation, more than 25% of total generated electricity can be lost annually due to dust accumulation, with efficiency losses increasing by approximately 50% during sandstorm-heavy periods. A broader review of soiling in GCC countries [36] identified a typical monthly power output reduction of 10% in the absence of cleaning. In the context of this study, the PV derating factor of 0.85 applied in all HOMER simulation accounts for a generalised efficiency reduction but did not model the dynamic, time-varying soiling characteristic of Al-Wafra. For tracking configurations, module orientation changes may accelerate dust redistribution on the glass surface, further complicating the soiling profile. Formal weekly cleaning schedules during peak summer months (June–August) are therefore a critical operational requirement that must be explicitly budgeted for in any real deployment.
Temperature-accelerated degradation of the lead–acid battery bank represents a second critical operational risk. Prasad et al. [37] demonstrated that lead–acid battery capacity and cyclability degrade substantially at temperatures above 40 °C, with accelerated failure modes including irreversible lead sulphate crystallisation and increased self-discharge. The well-established Arrhenius relationship predicts that, for every 8–10 °C increase in the operating temperature above 25 °C, the battery lifetime is reduced by approximately 50% [38]. Given Kuwait’s summer ambient temperatures routinely exceeding 45 °C, the HOMER-modelled battery lifetime—based on throughput cycling alone—is likely optimistic. Effective thermal management of the battery enclosure (shading, ventilation, or insulated housing) is essential for approaching the modelled 25-year project lifetime without premature replacement cycles that would significantly increase lifecycle costs. Future work should incorporate temperature-corrected battery lifetime modelling to produce more conservative and realistic cost estimates for Kuwait’s climate.
6.6. Study Limitations
This study is subject to five principal limitations. First, solar resource data were sourced from the NASA-SSE database; on-site pyranometer measurements at Al-Wafra would enable higher-fidelity simulation and validation of seasonal irradiance patterns including sub-hourly variability from dust haze events. Second, the economic analysis uses 2024 component costs; given that global PV module prices declined from USD 0.38/Wp in 2020 to approximately USD 0.16/Wp in 2024, the relative cost advantage of fully renewable configurations over hybrid systems is likely to increase further over the 25-year project horizon, strengthening the case for Systems 7–10 beyond current modelling. Third, the HOMER battery lifetime model is throughput-based without temperature correction, likely underestimating the replacement frequency and associated lifecycle cost in Kuwait’s extreme heat. Fourth, component sizing in Scenarios 3 and 4 was fixed rather than co-optimised with the tracking configuration; a fully integrated optimisation varying the PV capacity, battery bank size, and tracking type simultaneously could identify further cost reductions. Fifth, the structural and mechanical loads imposed on the mobile trailer platform by the tracking mechanism were not modelled, requiring finite element analysis outside the scope of this study.
The present study employed a constant representative daily load profile corresponding to three MEVs operating under typical Al-Wafra agricultural conditions to establish a consistent comparative framework between charging architectures and photovoltaic tracking configurations. Although this approach enables controlled techno-economic comparison, actual field operation may involve variable charging demands associated with seasonal agricultural activity, weekday–weekend variations, and fluctuating vehicle fleet size. Future work should therefore investigate dynamic and stochastic load profiles involving larger MEV fleets and variable charging schedules to further evaluate system scalability, operational flexibility, and long-term charging-demand uncertainty.
6.7. Policy Implications and Deployment Recommendations
The results carry direct implications for Kuwait’s energy and transport policy. The LCOE of 0.127 USD/kWh for fully renewable DC-bank mobile charging (Systems 7–10) is competitive with estimated diesel-only generation costs at remote Al-Wafra sites (approximately 0.15–0.20 USD/kWh when fuel delivery, generator capital, and O&M are fully priced, confirming economic rationality without subsidy. For hybrid configurations (System 6: 0.0751 USD/kWh), the economic case is unambiguous, representing the lowest-cost MEV charging option available in an infrastructure-absent setting.
Three specific policy mechanisms would accelerate adoption. First, the Kuwait Ministry of Electricity, Water and Renewable Energy could incorporate mobile solar MEV charging into the Al-Shagaya Renewable Energy Park’s rural electrification extension programme, which already targets 2.7 GW of the PV capacity [13]. Second, the Public Authority for Agricultural Affairs and Fish Resources could offer capital grants or concessional financing for Al-Wafra and Al-Abdali farm operators to procure DC-bank solar charging stations, reducing payback below five years. Third, a national green certificate scheme recognising the 100% renewable fraction of Systems 7–10 would provide ongoing revenue to offset lifecycle costs and improve the relative economics of zero-emission configurations. For the wider GCC region and analogous solar-rich, grid-limited areas in the Middle East, North Africa, and South Asia, the modular DC-bank tracking architectures identified in this study provide a replicable, scalable template for zero-emission rural electric mobility that can be adapted to different MEV fleet sizes and load profiles without fundamental redesign.
7. Conclusions
This study presented a comprehensive techno-economic, environmental, and engineering evaluation of ten standalone solar-powered mobile charging station configurations for mini electric vehicles under Kuwait’s desert climate conditions using HOMER Pro optimisation software. The investigation systematically compared DC–AC and pure DC-bank architectures combined with fixed photovoltaic systems, horizontal single-axis tracking, vertical single-axis tracking, and two-axis tracking configurations under both hybrid and fully renewable operating conditions. The results demonstrate that architecture selection and photovoltaic tracking strategy substantially influence energy conversion efficiency, lifecycle cost, renewable penetration, structural energy efficiency, and long-term operational sustainability for mobile off-grid charging platforms. The key conclusions are as follows:
- DC-bank architecture significantly outperforms DC–AC architecture: replacing the DC–AC inverter with a pure DC-bank design reduces the NPC by up to 34% for fixed-tilt systems, establishing DC-bank as the preferred architecture for standalone solar MEV charging.
- PV tracking substantially enhances performance: two-axis tracking increases the annual PV production by 36% (13,635 vs. 10,033 kWh/year) and EPD by 36% relative to fixed-tilt DC-bank systems, while vertical single-axis tracking delivers an approximately 24% improvement at a lower mechanical complexity.
- System 8 (two-axis tracking, DC-bank, and no generator) is the optimal zero-emission configuration: it achieves 100% RF, zero CO2 emissions, maximum PV production (13,635 kWh/year), and the highest EPD among fully renewable systems (10.21 kWh·yr−1·kg−1), making it the most suitable design for environmentally critical deployments.
- System 6 (VSAT, DC-bank, and generator) delivers the lowest lifecycle cost: NPC of USD 6272 and LCOE of 0.0751 USD/kWh represent 57% reductions relative to the DC–AC fixed-tilt baseline, making it the most economically attractive option for cost-constrained deployments.
- System 10 (VSAT, DC-bank, and no generator) offers the best practical compromise: zero emissions, 100% RF, strong EPD (9.34 kWh·yr−1·kg−1), and reduced mechanical complexity relative to two-axis tracking make it the recommended field-deployable solution.
- The findings are transferable: the DC-bank tracking configurations evaluated here are applicable to other solar-rich, grid-limited regions globally, supporting scalable zero-emission rural electric mobility.
Future work should investigate: (i) the impact of high-temperature battery degradation on lifecycle costs and reliability in Kuwait’s climate; (ii) re-optimised sizing for tracking configurations using HOMER’s full optimisation mode; (iii) on-site validation of simulation results; and (iv) the integration of demand-side management strategies to further reduce excess electricity generation.
Author Contributions
Conceptualisation, J.A. (Jasem Alazemi) and J.A. (Jasem Alrajhi); methodology, J.A. (Jasem Alazemi), J.A. (Jasem Alrajhi) and K.A.A.; software, J.A. (Jasem Alazemi) and N.A.A.; validation, J.A. (Jasem Alazemi) and J.A. (Jasem Alrajhi); formal analysis, J.A. (Jasem Alazemi); investigation, J.A. (Jasem Alazemi) and K.A.A.; writing—original draft preparation, J.A. (Jasem Alazemi); writing—review and editing, J.A. (Jasem Alrajhi) and K.A.A.; supervision, J.A. (Jasem Alrajhi). All authors have read and agreed to the published version of the manuscript.
Funding
This research received no external funding.
Data Availability Statement
The HOMER Pro simulation files and load profile data used in this study are available from the corresponding author upon reasonable request.
Conflicts of Interest
The authors declare no conflicts of interest.
References
- Alazemi, J.; Alrajhi, J.; Khalfan, A.; Alhaifi, K. Mobile Solar Charging Station for Mini Electric Vehicles in Kuwait: Optimization and Economic Analysis Using HOMER Simulation Software. SSRG Int. J. Mech. Eng. 2025, 12, 1–16. [Google Scholar] [CrossRef] [Scilit]
- Ahmad, F.; Alam, M.S.; Alsaidan, I.S.; Shariff, S.M. A Comprehensive Review of Electric Vehicle Charging Stations with Solar Photovoltaic System Considering Market, Technical Requirements, Network Implications, and Future Challenges. Sustainability 2023, 15, 8122. [Google Scholar] [CrossRef] [Scilit]
- International Energy Agency (IEA). Global EV Outlook 2024; IEA: Paris, France, 2024; Available online: https://www.iea.org/reports/global-ev-outlook-2024 (accessed on 15 March 2025).
- IEA. Tracking SDG7: The Energy Progress Report 2023; World Bank: Washington, DC, USA, 2023. [Google Scholar]
- Al-Ogaili, A.S.; Hashim, T.J.T.; Rahmat, N.A.; Ramasamy, A.K.; Marsadek, M.B.; Faisal, M.; Hannan, M.A. Review on Scheduling, Clustering, and Forecasting Strategies for Controlling Electric Vehicle Charging: Challenges and Recommendations. IEEE Access 2019, 7, 128353–128371. [Google Scholar] [CrossRef] [Scilit]
- Mastoi, M.S.; Zhuang, S.; Munir, H.M.; Haris, M.; Hassan, M.; Usman, M.; Bukhari, S.S.H.; Ro, J.-S. A Study of Charging-Dispatch Strategies and Vehicle-to-Grid Technologies for Electric Vehicles in Distribution Networks. Energy Rep. 2023, 9, 1777–1806. [Google Scholar] [CrossRef] [Scilit]
- Bilal, M.; Rizwan, M. Electric Vehicles in a Smart Grid: A Comprehensive Survey on Optimal Location of Charging Station. IET Smart Grid 2020, 3, 267–279. [Google Scholar] [CrossRef] [Scilit]
- Fachrizal, R.; Ramadhani, U.H.; Munkhammar, J.; Widén, J. Combined PV–EV Hosting Capacity Assessment for a Residential LV Distribution Grid with Smart EV Charging and PV curtailment. Sustain. Energy Grids Netw. 2021, 26, 100445. [Google Scholar] [CrossRef] [Scilit]
- Tran, V.T.; Nguyen, T.T.; Nguyen, T.L.; Phan, T.M. Solar-Powered Electric Vehicle Charging System: A Comprehensive Review. Discov. Electron. 2025, 2, 96. [Google Scholar] [CrossRef] [Scilit]
- Hossain, M.N.; Cho, H.M. Techno-Economic Feasibility of Photovoltaic-Powered Electric Vehicle Charging Stations: A Global Review and Future Outlook. Sustain. Energy Res. 2026, 13, 9. [Google Scholar] [CrossRef] [Scilit]
- Baidas, M.W.; Almusailem, M.F.; Kamel, R.M.; Alanzi, S.S. Renewable-Energy-Powered Cellular Base-Stations in Kuwait’s Rural Areas. Energies 2022, 15, 2334. [Google Scholar] [CrossRef] [Scilit]
- Muhaisen, N.A.N.; Habaebi, M.H.; Suliman, F.E.M.; Khan, S.; Elsheikh, E.A.A.; Islam, M.R.; Al Husaini, M.A.S. Techno-Economic Feasibility Analysis of Kuwait-Specific Photovoltaic-Based Street Lighting System. Energy Explor. Exploit. 2024, 42, 01445987231197686. [Google Scholar] [CrossRef] [Scilit]
- Al-Shehhi, A.M.; Al-Riyami, M.; Al-Badi, A.H. Impacts of Kuwait’s Proposed Renewable Energy Goals on Grid Operations. Int. J. Sustain. Energy 2023, 42, 776–792. [Google Scholar] [CrossRef] [Scilit]
- Alazemi, J.; Alrajhi, J.; Alhaifi, N.; Alhaifi, K. Private Electric-Vehicle Charging Station Optimisation and Sensitivity Analysis Using HOMER Microgrid Software: A Case Study of Kuwait. Int. J. Appl. Eng. Res. 2025, 20, 87–105. [Google Scholar]
- Iqbal, A.; Iqbal, M.T.; Dhimish, M. Energy, Exergy, Economical and Environmental Analysis of Photovoltaic Solar Panel for Fixed, Single and Dual Axis Tracking Systems. Case Stud. Therm. Eng. 2023, 51, 103614. [Google Scholar] [CrossRef] [Scilit]
- Dursun, B.; Gokcol, C.; Umut, I.; Ucar, E.; Kocabey, S. Techno-Economic Comparative Study of Grid-Connected PV/Reformer/FC Hybrid Systems with Distinct Solar Tracking Systems. Sustain. Energy Technol. Assess. 2023, 56, 103084. [Google Scholar] [CrossRef] [Scilit]
- Mbungu, N.T.; Naidoo, R.M.; Bansal, R.C.; Siti, M.W.; Tungadio, D.H. An Overview of Renewable Energy Resources and Grid Integration for Commercial Building Applications. J. Energy Storage 2020, 29, 101385. [Google Scholar] [CrossRef] [Scilit]
- Fachrizal, R.; Munkhammar, J. Improved Photovoltaic Self-Consumption in Residential Buildings with Distributed and Centralized Smart Charging of Electric Vehicles. Energies 2020, 13, 1153. [Google Scholar] [CrossRef] [Scilit]
- Dragicevic, T.; Lu, X.; Vasquez, J.C.; Guerrero, J.M. DC Microgrids—Part I: A Review of Control Strategies and Stabilization Techniques. IEEE Trans. Power Electron. 2016, 31, 4876–4891. [Google Scholar] [CrossRef] [Scilit]
- Rivera, S.; Kouro, S.; Vazquez, S.; Goetz, S.M.; Lizana, R.; Romero-Cadaval, E. Electric Vehicle Charging Infrastructure: From Grid to Battery. IEEE Ind. Electron. Mag. 2021, 15, 37–51. [Google Scholar] [CrossRef] [Scilit]
- Ahmad, F.; Khalid, M.; Panigrahi, B.K. Development in Energy Storage System for Electric Transportation: A Comprehensive Review. J. Energy Storage 2021, 43, 103153. [Google Scholar] [CrossRef] [Scilit]
- Pirayawaraporn, A.; Sappaniran, S.; Nooraksa, S.; Prommai, C.; Chindakham, N.; Jamroen, C. Innovative Sensorless Dual-Axis Solar Tracking System Using Particle Filter. Appl. Energy 2023, 338, 120946. [Google Scholar] [CrossRef] [Scilit]
- Sanyal, A.; Mohanta, J.C.; Ahmed, M.F. Development of a Dual-Axis Solar Tracker for Efficient Sun Energy Harvesting. Proc. Inst. Mech. Eng. Part E J. Process Mech. Eng. 2024, 240, 888–900. [Google Scholar] [CrossRef] [Scilit]
- HOMER Energy LLC. HOMER Pro User Manual; HOMER Energy LLC: Boulder, CO, USA, 2023. [Google Scholar]
- Lambert, T.; Gilman, P.; Lilienthal, P. Micropower System Modeling with HOMER. In Integration of Alternative Sources of Energy; John Wiley & Sons: Hoboken, NJ, USA, 2006; pp. 379–418. [Google Scholar]
- Elkholy, M.H.; Metwally, H.; El-Hameed, M.A.; El-Fergany, A.A. Optimization and Analysis of Standalone Photovoltaic System for Hydrogen Production through the Electrolyser. Int. J. Hydrogen Energy 2023, 48, 24951–24970. [Google Scholar] [CrossRef] [Scilit]
- Al Wahedi, A.; Bicer, Y. Techno-Economic Optimization of Novel Stand-Alone Renewables-Based Electric Vehicle Charging Stations in Qatar. Energy 2022, 243, 123008. [Google Scholar] [CrossRef] [Scilit]
- AlRukaibi, D.; Alqallaf, R.; Al-Dahash, R.; Rasool, A. A Comparative Study of Private EV Charging Stations Using Grid-Connected Solar and Wind Energy Systems in Kuwait with HOMER Software. World Electr. Veh. J. 2025, 16, 647. [Google Scholar] [CrossRef] [Scilit]
- Praveenkumar, S.; Agyekum, E.B.; Ampah, J.D.; Afrane, S.; Velkin, V.I.; Mehmood, U.; Awosusi, A.A. Techno-Economic Optimization of PV System for Hydrogen Production and Electric Vehicle Charging Stations Under Five Different Climatic Conditions in India. Int. J. Hydrogen Energy 2022, 47, 38087–38105. [Google Scholar] [CrossRef] [Scilit]
- Al-Enezi, F.Q.; Sykulski, J.K.; Ahmed, N.A. Visibility and Potential of Solar Energy on Horizontal Surface at Kuwait Area. J. Electron. Sci. Technol. 2011, 9, 103–113. [Google Scholar] [CrossRef] [Scilit]
- Althuwaini, H.H.; Alqattan, A.N. Techno-Economic Analysis of Solar Power Plants in Kuwait: Modelling the Performance of PV and CSP Systems. Int. J. Renew. Energy Res. 2021, 11, 2009–2024. [Google Scholar] [CrossRef] [Scilit]
- Baidas, M.W.; Almusailem, M.F.; Kamel, R.M.; Alanzi, S.S. Solar-Powered Cellular Base Stations in Kuwait: A Case Study. Energies 2021, 14, 7494. [Google Scholar] [CrossRef] [Scilit]
- NASA. Surface Meteorology and Solar Energy (SSE) Release 6.0 Data; NASA: Washington, DC, USA, 2023. Available online: https://power.larc.nasa.gov (accessed on 1 February 2024).
- Elmorshedy, M.F.; Elkadeem, M.R.; Kotb, K.M.; Taha, I.B.M.; Mazzeo, D. Optimal Design and Energy Management of an Isolated Fully Renewable Energy-Powered Desalination System Integrating Metaheuristic Optimization: A Case Study in Luxor, Egypt. Sustain. Energy Technol. Assess. 2021, 45, 101168. [Google Scholar] [CrossRef] [Scilit]
- Althuwaini, Y.E. Soiling Effect and Remedial Measures of Solar Photovoltaic System Performance in Kuwait. J. Power Energy Eng. 2023, 11, 29–45. [Google Scholar] [CrossRef]
- Figgis, B.; Bahaidarah, H.; Nofal, M.; Alami, A.H. Soiling of Photovoltaic Panels in the Gulf Cooperation Council Countries and Mitigation Strategies. Sol. Energy Mater. Sol. Cells 2021, 230, 111230. [Google Scholar] [CrossRef] [Scilit]
- Prasad, G.K.; Arumugam, G.K.; Gibson, C.; Mohammadi, M. Failure Analysis of Lead-Acid Batteries at Extreme Operating Temperatures. Battery Energy 2023, 2, e20230008. [Google Scholar] [CrossRef] [Scilit]
- Perez, J.M.; de Castro, M.C.T.; Rodriguez-Villanueva, M. Aging Retardation of Lead-Acid Batteries by Adjusting Charge Controller Threshold Values in Off-Grid Photovoltaic Systems. Appl. Artif. Intell. Energy Syst. 2024, 1–10. [Google Scholar] [CrossRef] [Scilit]

Disclaimer/Publisher’s Note: The statements, opinions and data contained in all publications are solely those of the individual author(s) and contributor(s) and not of MDPI and/or the editor(s). MDPI and/or the editor(s) disclaim responsibility for any injury to people or property resulting from any ideas, methods, instructions or products referred to in the content. |
© 2026 by the authors. Published by MDPI on behalf of the World Electric Vehicle Association. Licensee MDPI, Basel, Switzerland. This article is an open access article distributed under the terms and conditions of the Creative Commons Attribution (CC BY) license.