1. Introduction
In both developed and developing economies, battery electric vehicles (BEVs) are gaining importance in the transport sector. This trend is driven by efforts to reduce dependence on fossil fuel imports, improve urban air quality, and expand or strengthen countries’ positions in global automotive value chains [
1]. It is also undisputed that BEVs can play an important role in reducing the greenhouse gas (GHG) emissions caused by the transport sector. Such reductions are urgently needed, because the transport sector has not reduced its GHG emissions to the same extent as other sectors, such as the energy, the industry, and the building sector: whereas increasing contributions from renewable energy sources and lower-emitting practices have reduced GHG emissions in Germany’s energy sector by about 60%, in industry by 45%, and in the building sector by 52%, emissions from the country’s transport sector have decreased by only about 12% [
2].
For this reason, policymakers in many countries support the purchase and use of BEVs, and in 2022/23 the European Union even decided to ban conventional diesel and gasoline vehicles from new registrations in Europe by 2035 [
3]. This strict regulation, however, is currently being debated controversially and is likely to be weakened, as indicated in the European Commission’s Automotive Package proposal presented in mid-December 2025 [
4]. According to that proposal, only 90% of new vehicle registrations in 2035 would need to have zero tailpipe emissions, while other measures, such as low-carbon steel, biofuels, or e-fuels, could compensate for the remainder. This development reflects the debate on effective levers for reducing transport sector GHG emissions beyond the elimination of tailpipe emissions, as stipulated by the current European regulation [
5]. Such complementary strategies may be more technology-neutral and could help overcome economic or political limitations of existing approaches, as also discussed in the literature [
6].
Despite the overall benefits of BEVs in reducing GHG emissions across the vehicle lifecycle, it is important to keep in mind that BEVs initially cause higher GHG emissions during vehicle production, mainly because of the vehicle battery [
7,
8,
9,
10,
11,
12]. The end-of-life phase of both vehicle types, BEVs and conventional ICE vehicles, makes only a negligible contribution to total lifecycle emissions [
7,
8,
9,
10,
11,
12].
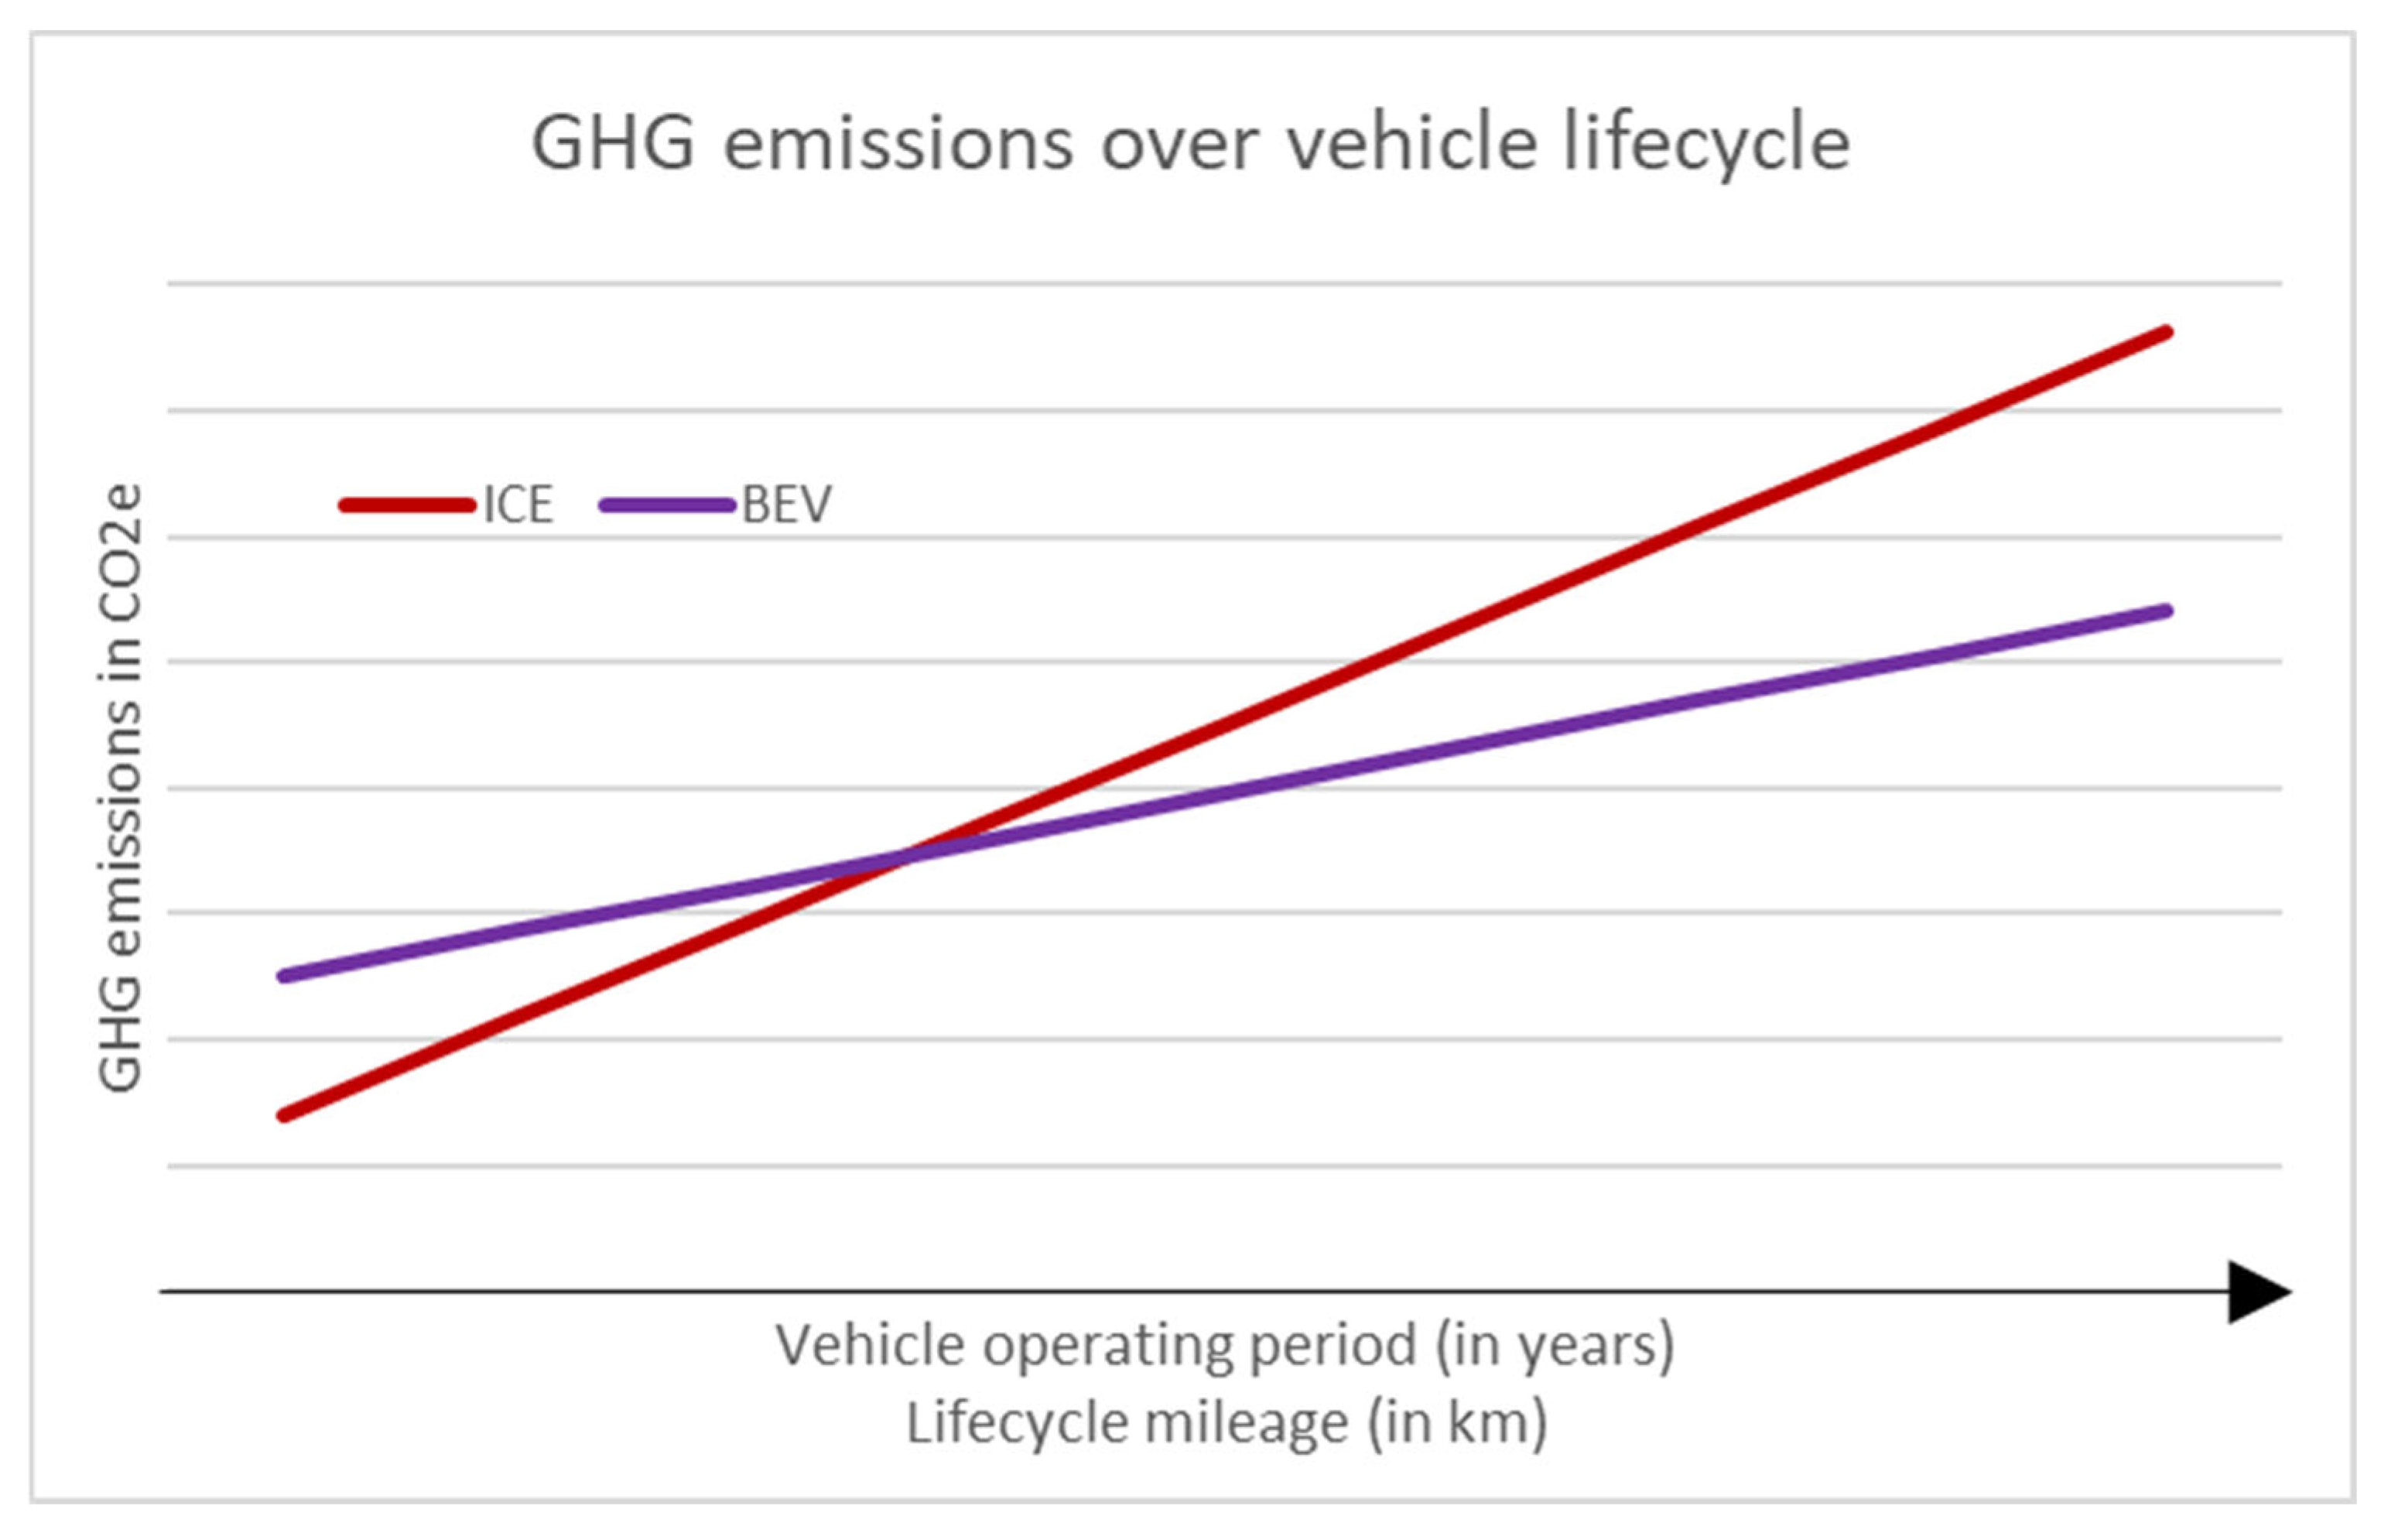
Figure 1 qualitatively illustrates the GHG emissions over the operating period and lifecycle mileage for both vehicle technologies.
Because of the initial GHG emission disadvantage of BEVs compared with conventional ICE vehicles (see
Figure 1), it is important to consider both the positive and negative emission effects of BEV and to assess the overall evolution of GHG emissions over time. This assessment needs to include the two relevant phases of the vehicle lifecycle, namely production and use, and should provide time-specific results for evaluating the effects of the transition from a purely ICE-based vehicle fleet to a BEV-dominated one.
Unfortunately, such time-resolved assessments of GHG emissions over time are very rare, like the application of such assessments to evaluate the effectiveness of different policies aiming for GHG reductions. Müller et al. suggested a methodological framework for considering developments and changes over time within lifecycle assessment (LCA) [
13]. They describe their approach as valuable compared with existing LCA practices, but their work focuses on methodological advancements in LCA. Although they demonstrate the approach for a BEV use case, they do not assess the dynamic transition of the entire vehicle fleet or discuss the effects of different policies on GHG emissions. Alishaq et al. [
14] assessed lifecycle impacts related to ICE vehicles and BEVs used in Qatar for multiple points in time until 2050. Because of the advantage of BEVs over ICE vehicles with respect to climate change, they conclude that a transition towards BEVs is advantageous, but they do not directly assess the transition process, GHG emissions during that period, or the potential impacts of different policies. Milovanoff et al. [
15] analyzed overall GHG emissions from vehicle use in the U.S. until 2050, with a focus on lightweight materials. They find that extensive use of aluminum as a lightweight material would decrease cumulative GHG emissions by 5.6%, and that delaying the implementation of these lightweight measures would sacrifice most of the potential GHG emission reduction. However, they do not assess the transition from conventional ICE vehicles towards a BEV-dominated passenger fleet or related policy measures. Zhu et al. [
16] assessed more than 1500 pathway options for U.S. light-duty transport and found that only a share of 3% meet the 2 °C target. They state that a complete shift to 100% BEVs by 2040 at the latest is necessary and emphasize the importance of electricity decarbonization. Their analysis, however, does not evaluate the effectiveness of specific policy measures currently discussed in Europe. Tang et al. [
17] published an analysis in 2023 on GHG emissions from vehicle manufacturing and use in relation to the European Union (EU) GHG target. They use material flow analysis to assess different BEV introduction scenarios with different ambition levels in Europe. They compare the resulting GHG emissions and find that early and strong introduction of BEVs helps reduce GHG emissions. However, because this assessment was conducted before the EU decided to ban new ICE vehicle registrations by 2035 and before the current discussion on weakening that regulation, it does not assess the implications of these specific policy decisions for GHG emissions. Tokito and Nakamoto assessed the optimal pathway for changing between vehicles of different powertrain technologies, including ICE vehicles, hybrid and plug-in hybrid vehicles, and BEVs, in order to minimize CO
2 emissions over the entire assessment period [
18]. They determine the ideal years for switching from one vehicle type to another in several countries, but they do not consider the effects of these vehicle changes on fleet composition or the associated dynamics on GHG emissions. Blat Belmonte et al. [
19] conducted a study in 2020 on the ideal powertrain technologies for achieving the lowest cumulative GHG emissions until 2050 and found a combination of BEV and plug-in hybrids using batteries and compressed natural gas to be the best solution. Their analysis focuses solely on selection of the best powertrain technology and does not assess the impacts of policy decisions. Ginster et al. [
20] conducted a comprehensive assessment using Monte Carlo simulation with more than ten parameters influencing the future vehicle fleet in Germany, Norway, and Poland. Their study illustrates the possible development of tailpipe and lifecycle emissions across a wide range of fleet development pathways and provides results on the distribution of these GHG emissions, as well as their compliance with the emission budget of the assessed countries. They profoundly assess the correlation between emission budget compliance and the most important influencing factors, including an ICE ban, BEV registration shares, or the introduction of e-fuels, among the results obtained in approximately 600,000 Monte Carlo simulation runs. However, they do not directly address the influence of these factors and the impact of related policy decisions.
Unlike the publications mentioned above, this study quantitively addresses specific policy decisions currently under consideration in the EU by determining their effects on the relevant lifecycle GHG emissions for each year individually and on cumulative emissions over the entire assessment period. The study therefore assesses and discusses the dynamics of the transition from an ICE-based vehicle fleet towards a BEV-dominated one. Since most GHG emissions from the transport sector originate from passenger vehicles [
21], this study focuses on that vehicle segment. Owing to the long operating life of passenger vehicles, the assessment covers the period until 2060. It further focuses on Germany as the market with the largest passenger vehicle fleet in Europe [
22], but it is intended to showcase the effects of regulations on all of Europe.
2. Materials and Methods
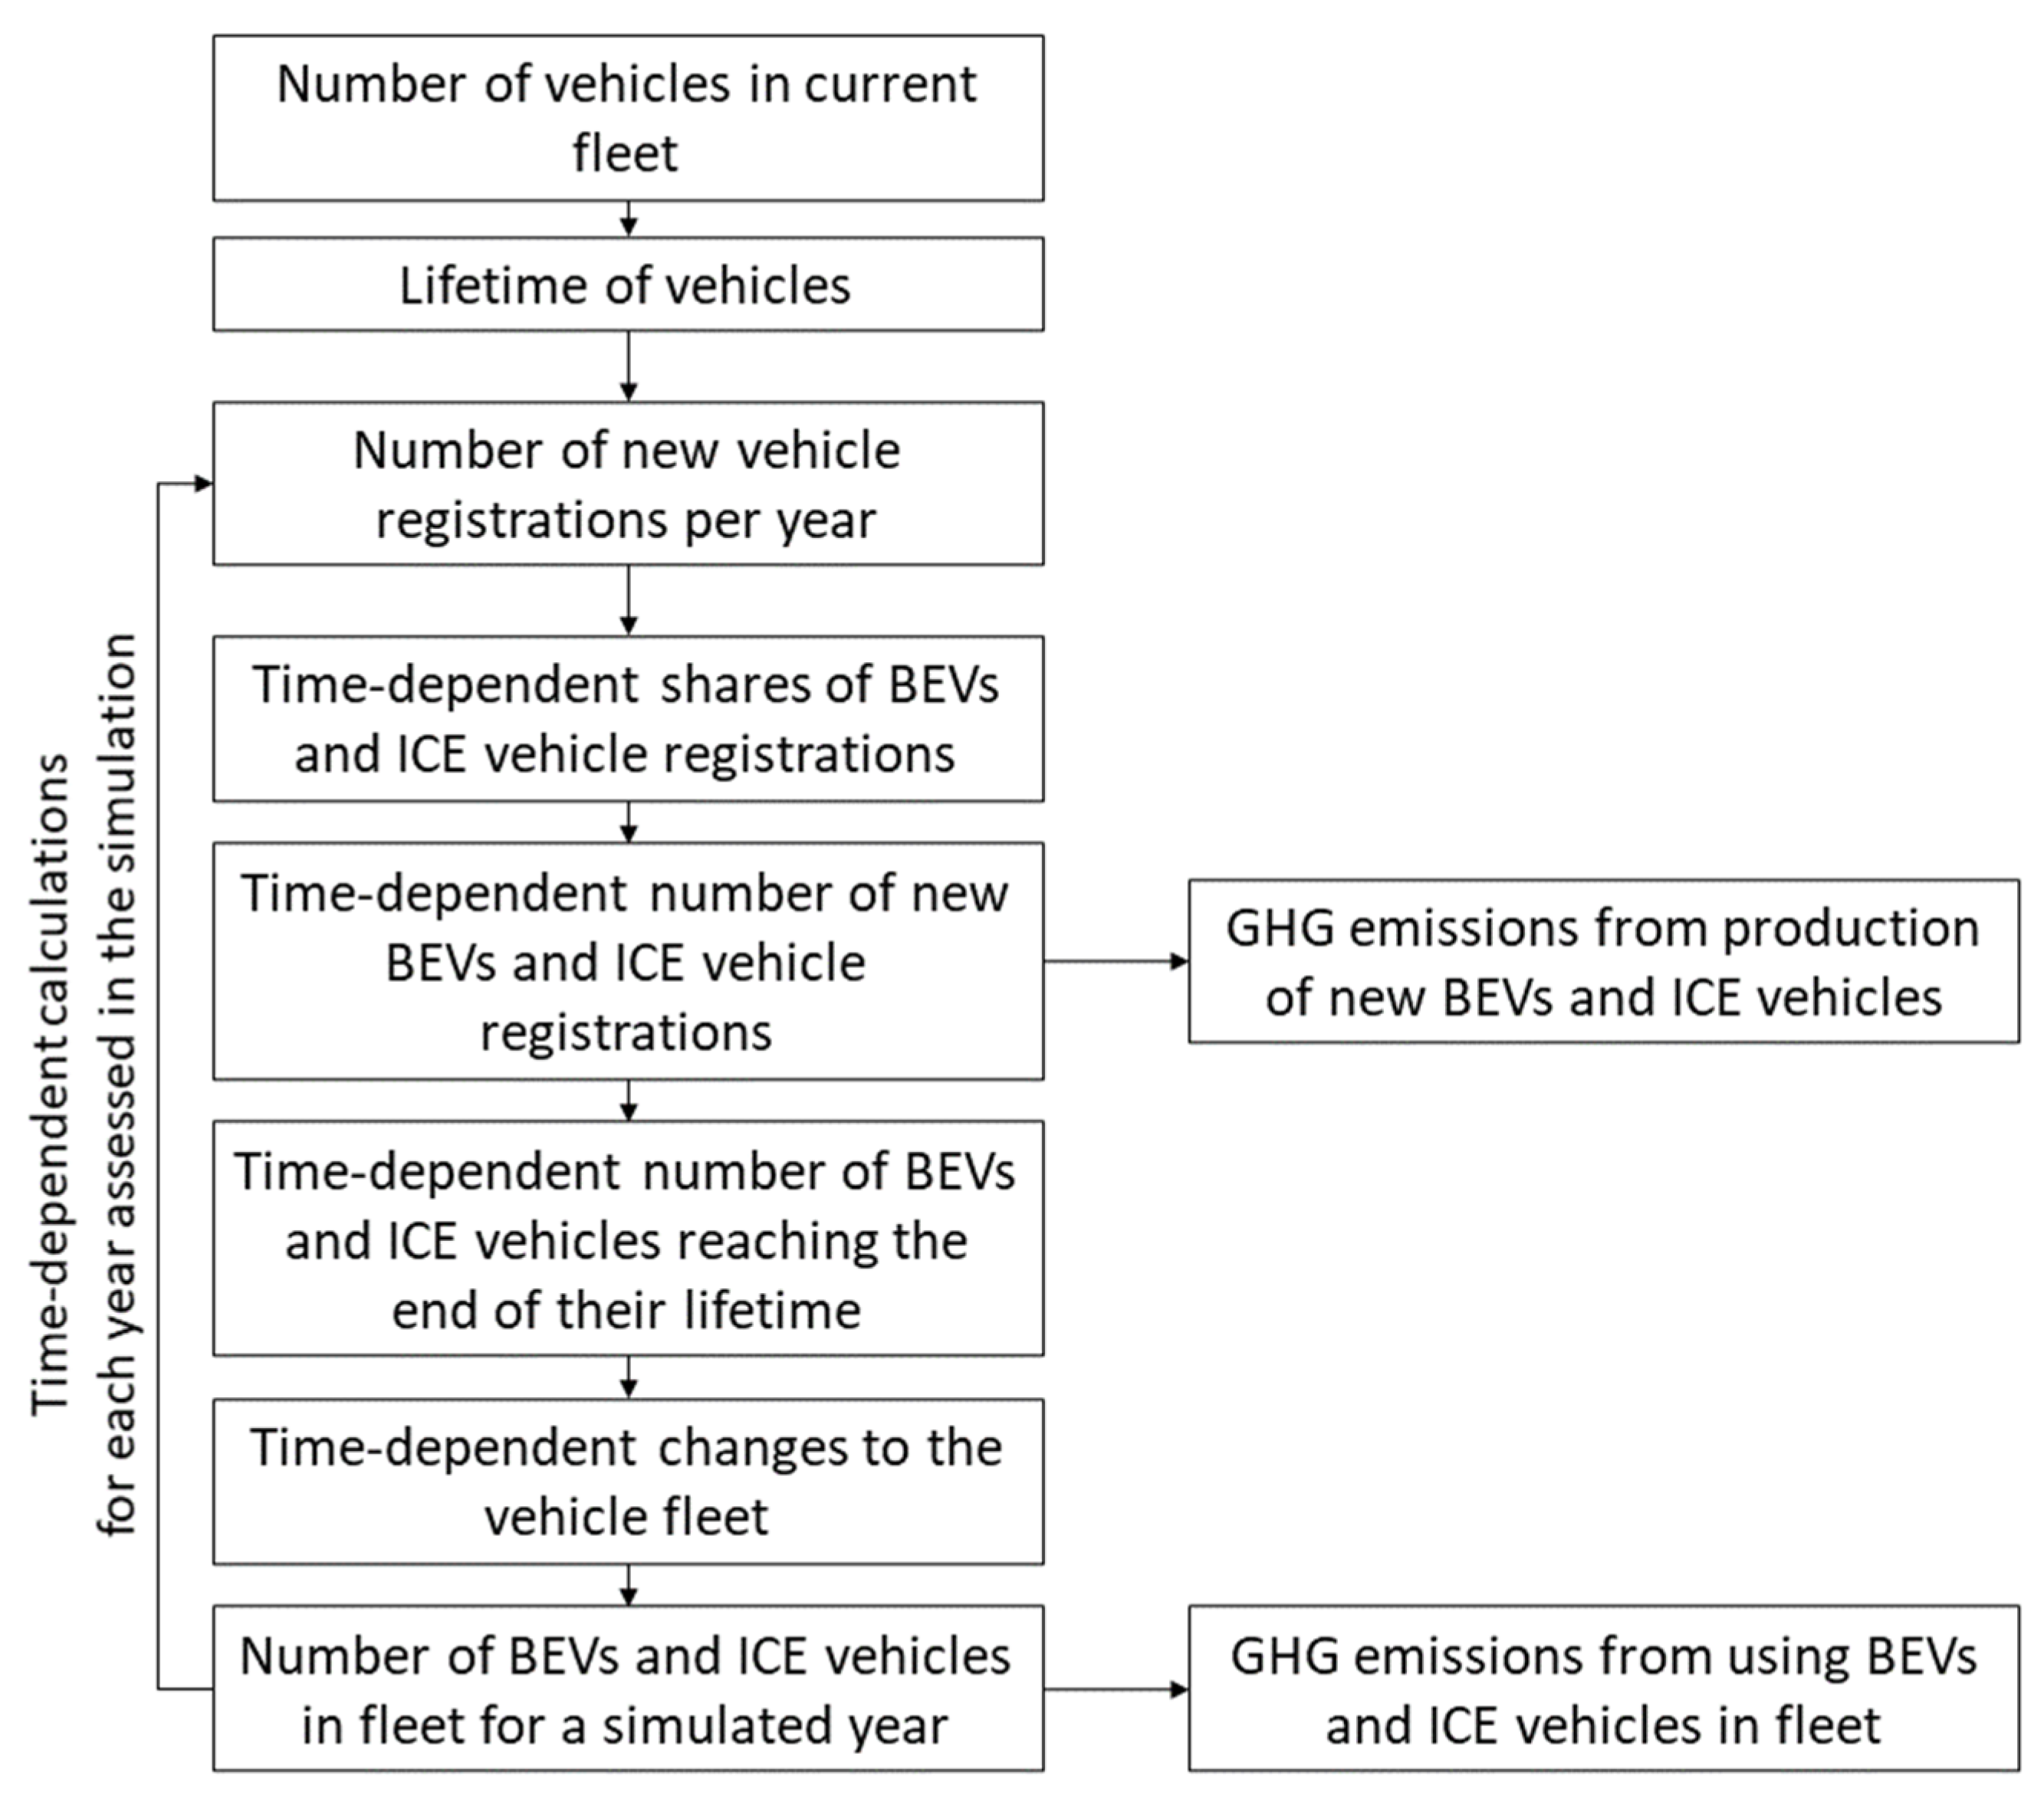
To assess the overall GHG emissions related to passenger vehicles, that is, the emissions caused by the production of new vehicles and by the use of existing vehicles within the evolving passenger vehicle fleet in Germany, a model with annual time steps was developed for the period from 2019 to 2060. The work flow of that model is illustrated in
Figure 2. Based on the current size of Germany’s passenger vehicle fleet and the average vehicle lifetime, the model determines the number of new vehicles that must be registered each year to maintain the overall fleet size. A growing trend towards BEV use is represented by a time-dependent BEV registration share, which determines the absolute numbers of new BEVs and ICE vehicles produced. The production of these new vehicles is the first source of GHG emissions considered in the assessment. As new vehicles enter the fleet, old vehicles reaching the end of their lifetime leave it; together, these effects determine the time-dependent fleet composition. The second source of emissions is vehicle use, which is calculated by combining annual mileage with electricity and fuel consumption for all vehicles in the fleet.
These calculations are repeated for each year of the assessment period to determine the resulting development of GHG emissions for each year. For the later evaluation, the total amount of GHG emissions caused over the entire simulation period up to 2060 is also assessed.
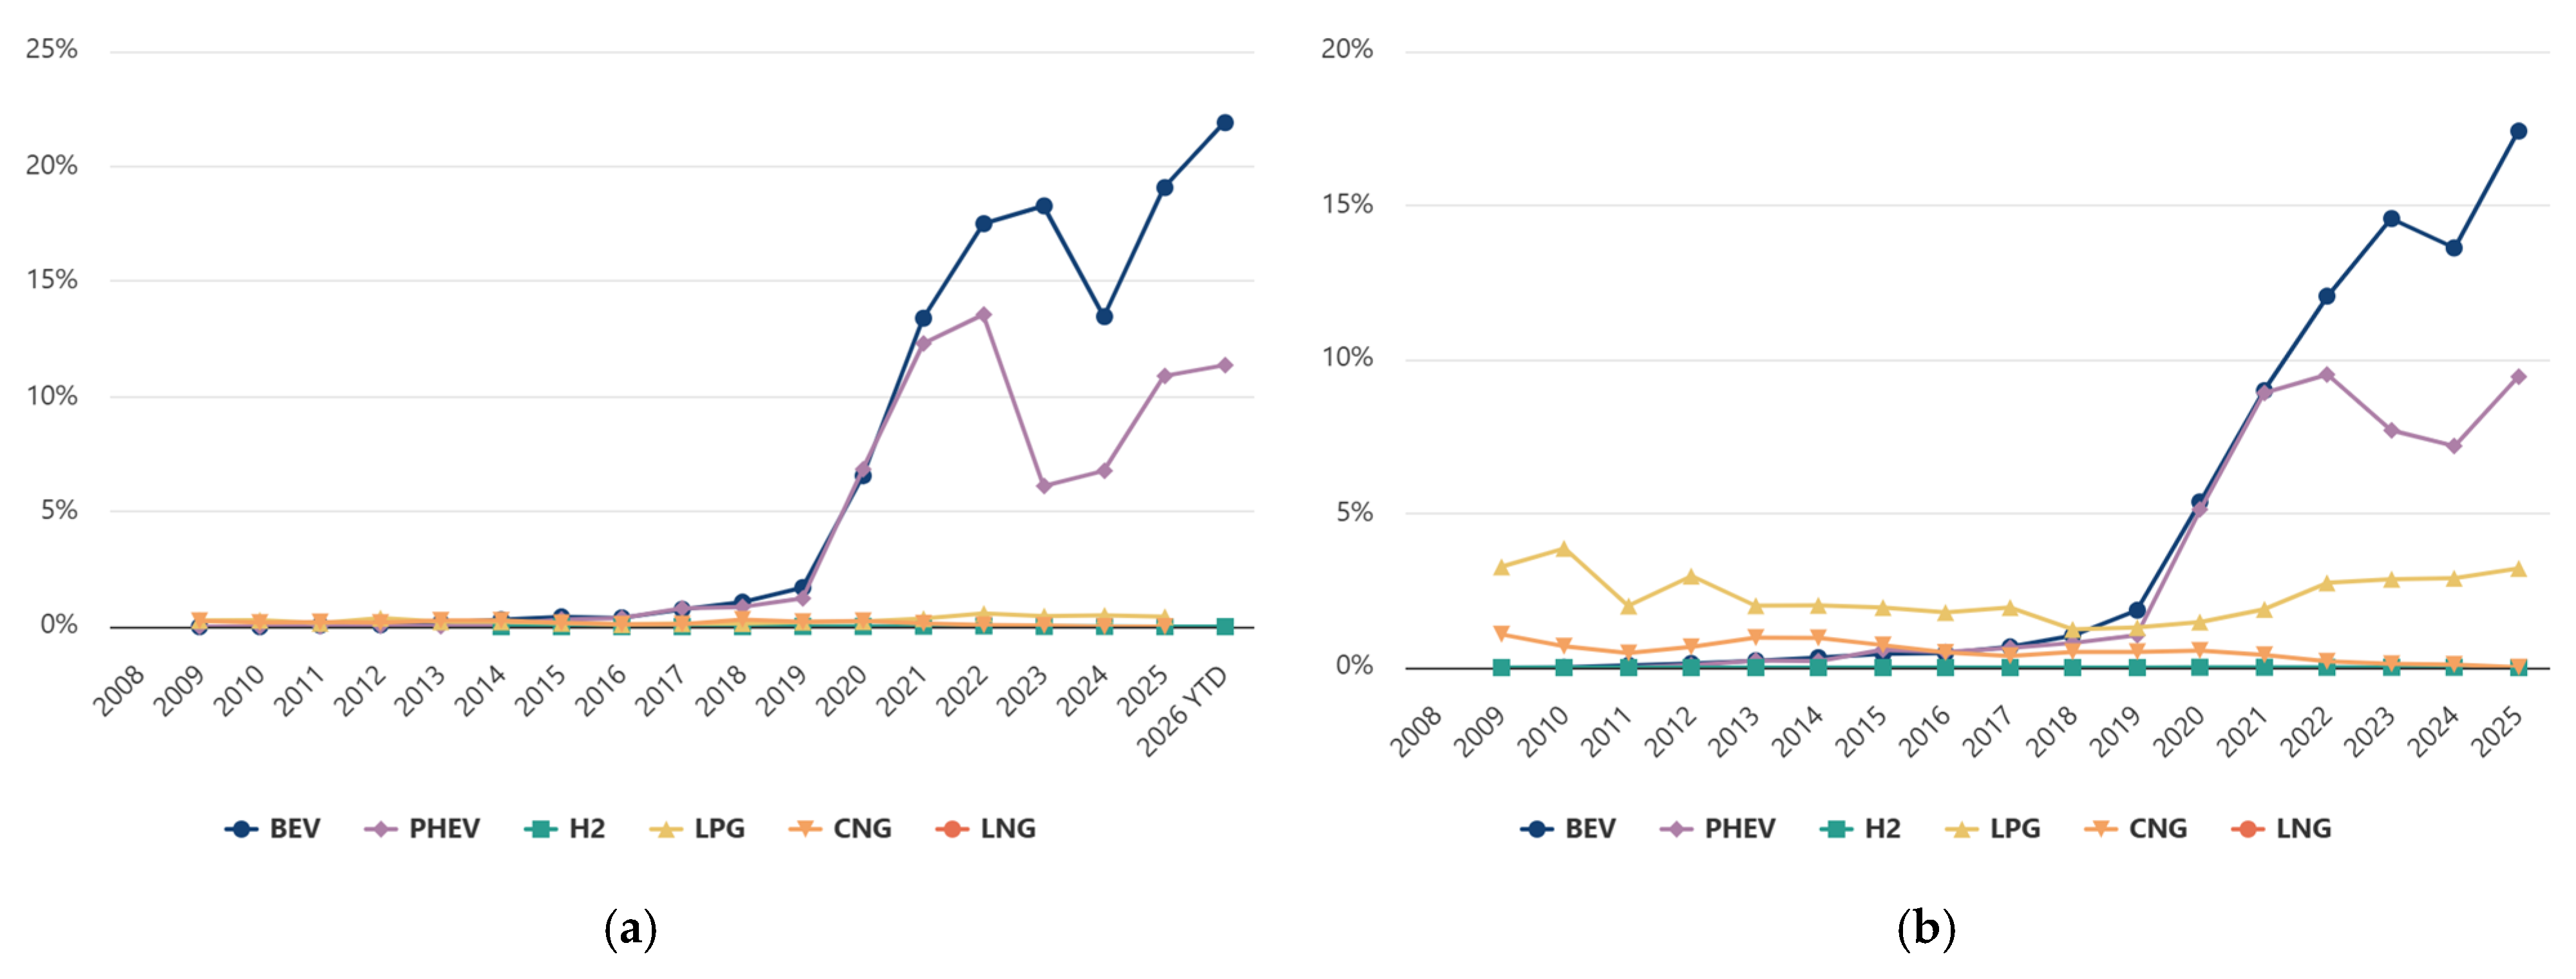
The simulation starts for the year 2019, because the market share of BEVs was still quite small in that year (
Figure 3), both in Germany and in the European Union as a whole, which provides a clearer view of the emission reduction effect caused through the introduction of BEVs. As
Figure 3 also illustrates, recent market shares of BEVs and plug-in hybrid vehicles (PHEVs) have been slightly higher in Germany than in the EU-27, but both remain of a similar order of magnitude.
The market shares for new BEV registrations in Germany for the years 2019 to 2025 used in this study are summarized in
Table 1. For the years beyond 2025, increasing BEV market shares are assumed according to four scenarios (
Table 2). The first assumes that the current ban on new ICE vehicle registrations by 2035 remains in place, bringing the BEV registration share to 100% in 2035 and subsequent years. The other three scenarios assume that the ICE ban will be abolished. Instead of full BEV deployment, these scenarios assume that the BEV share rises to 90%, 75%, and 50% in 2035 and then remains constant at that level for the rest of the assessment period. This is not intended to be a prediction of real future developments. Instead, these constant values are used to evaluate the potential effects of such developments on GHG emissions. Although such a constant BEV share is unrealistic, it is used here to isolate the effects of such a theoretical development.
A crucial aspect for the dynamic development of the vehicle fleet is the turnover of new vehicles entering the fleet and vehicles leaving it at their end of life. The total size of the passenger vehicle fleet in Germany is slightly above 49 million vehicles, with an average age of 10.6 years [
22].
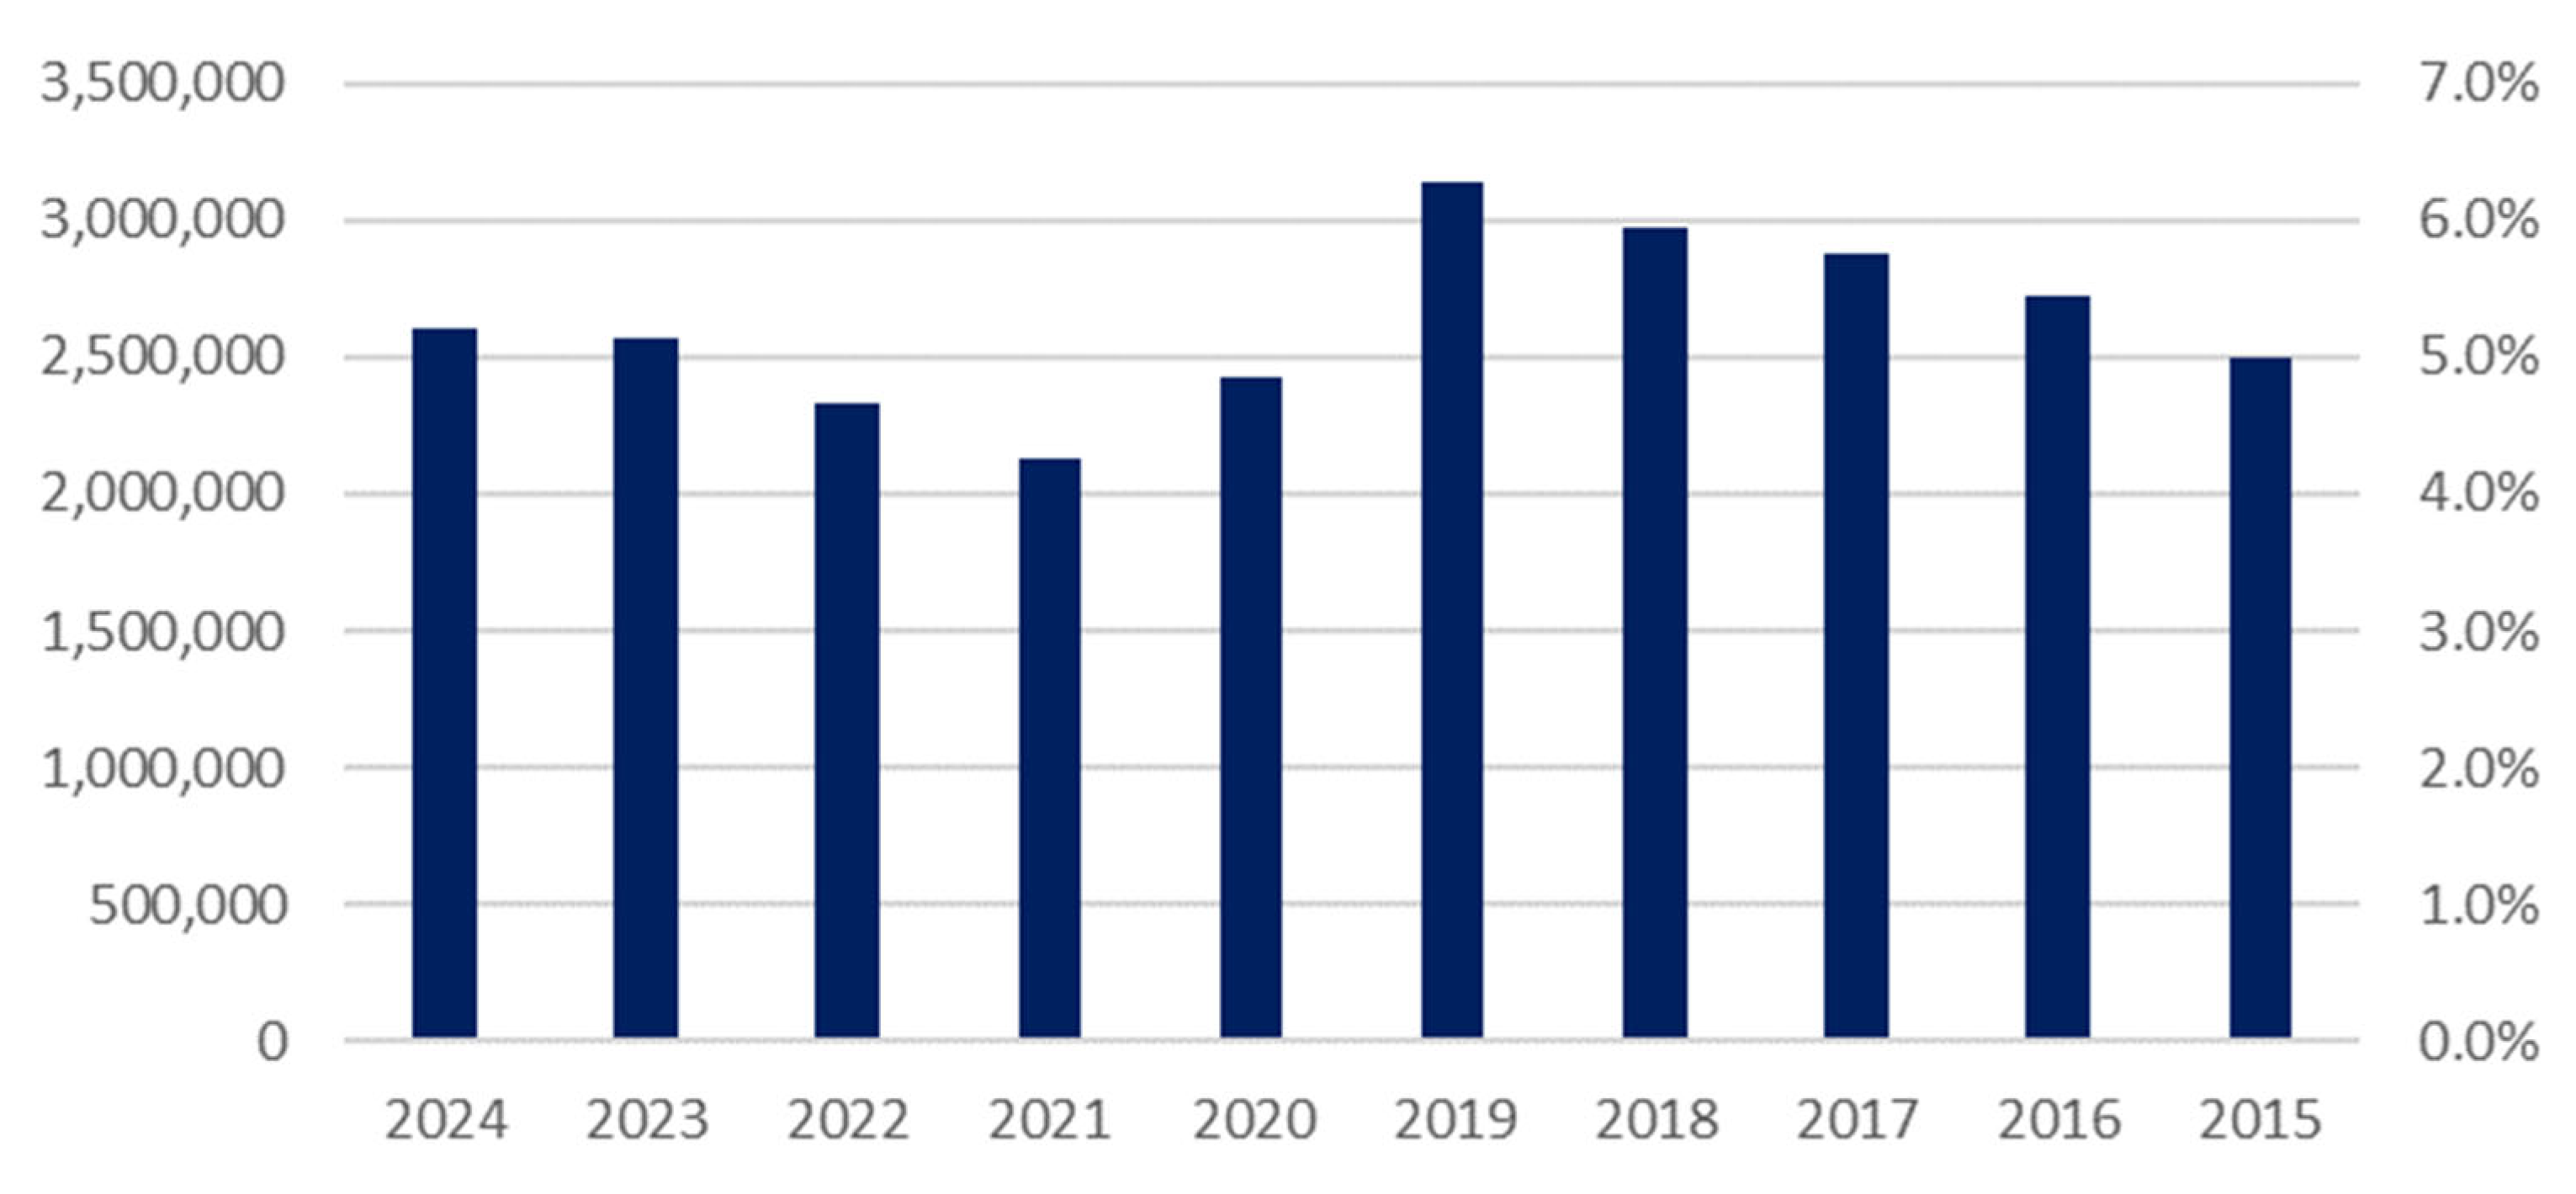
Figure 4 shows the number of new passenger vehicle registrations in Germany over the last 10 years. These figures correspond to annual new registrations of about 5% relative to the current passenger vehicle fleet.
It is important to note that the passenger vehicle fleet in Germany is relatively young compared with those in other countries. While the average age of a passenger vehicle in Germany is only 10.6 years, the average in the European Union is 12.7 years, meaning that other countries have substantially older passenger vehicle fleets [
22]. An important example is Spain, which has the fourth-largest passenger vehicle fleet in the EU, with an average age of 14.5 years. In fact, more than 60% of passenger vehicles in Spain are older than 10 years, whereas that share is below 50% in Germany [
22]. Since vehicle turnover is an important aspect for the results of this assessment, it should be kept in mind that focusing on Germany overestimates fleet turnover compared with the average European context. Because this is a very fundamental parameter of the analysis, it is assessed in more detail through a +/− 20% variation in the sensitivity analysis provided in
Section 3.1.
A turnover rate of 5% per year, as indicated by current fleet development in Germany (
Figure 4), implies that a vehicle reaches the end of its life after approximately 20 years of operation. Assuming a lifetime of 20 years is also consistent with the reported average age of passenger vehicles in Germany of just over 10 years. These assumptions determine the turnover dynamics within the vehicle fleet that are assessed in this study. They differ from the methodology used in the previous assessment presented at EVS38, in which a turnover rate of 10% per year was assumed [
24].
A simplification of this study is that diesel and gasoline vehicles are not differentiated; instead, they are assessed collectively as conventional ICE vehicles. Similarly, all other alternative powertrain technologies are neglected, because BEV is the most important one (
Figure 3). Since ICE vehicles represented more than 98% of the German fleet in 2019 and BEVs accounted for only 0.3% in that year [
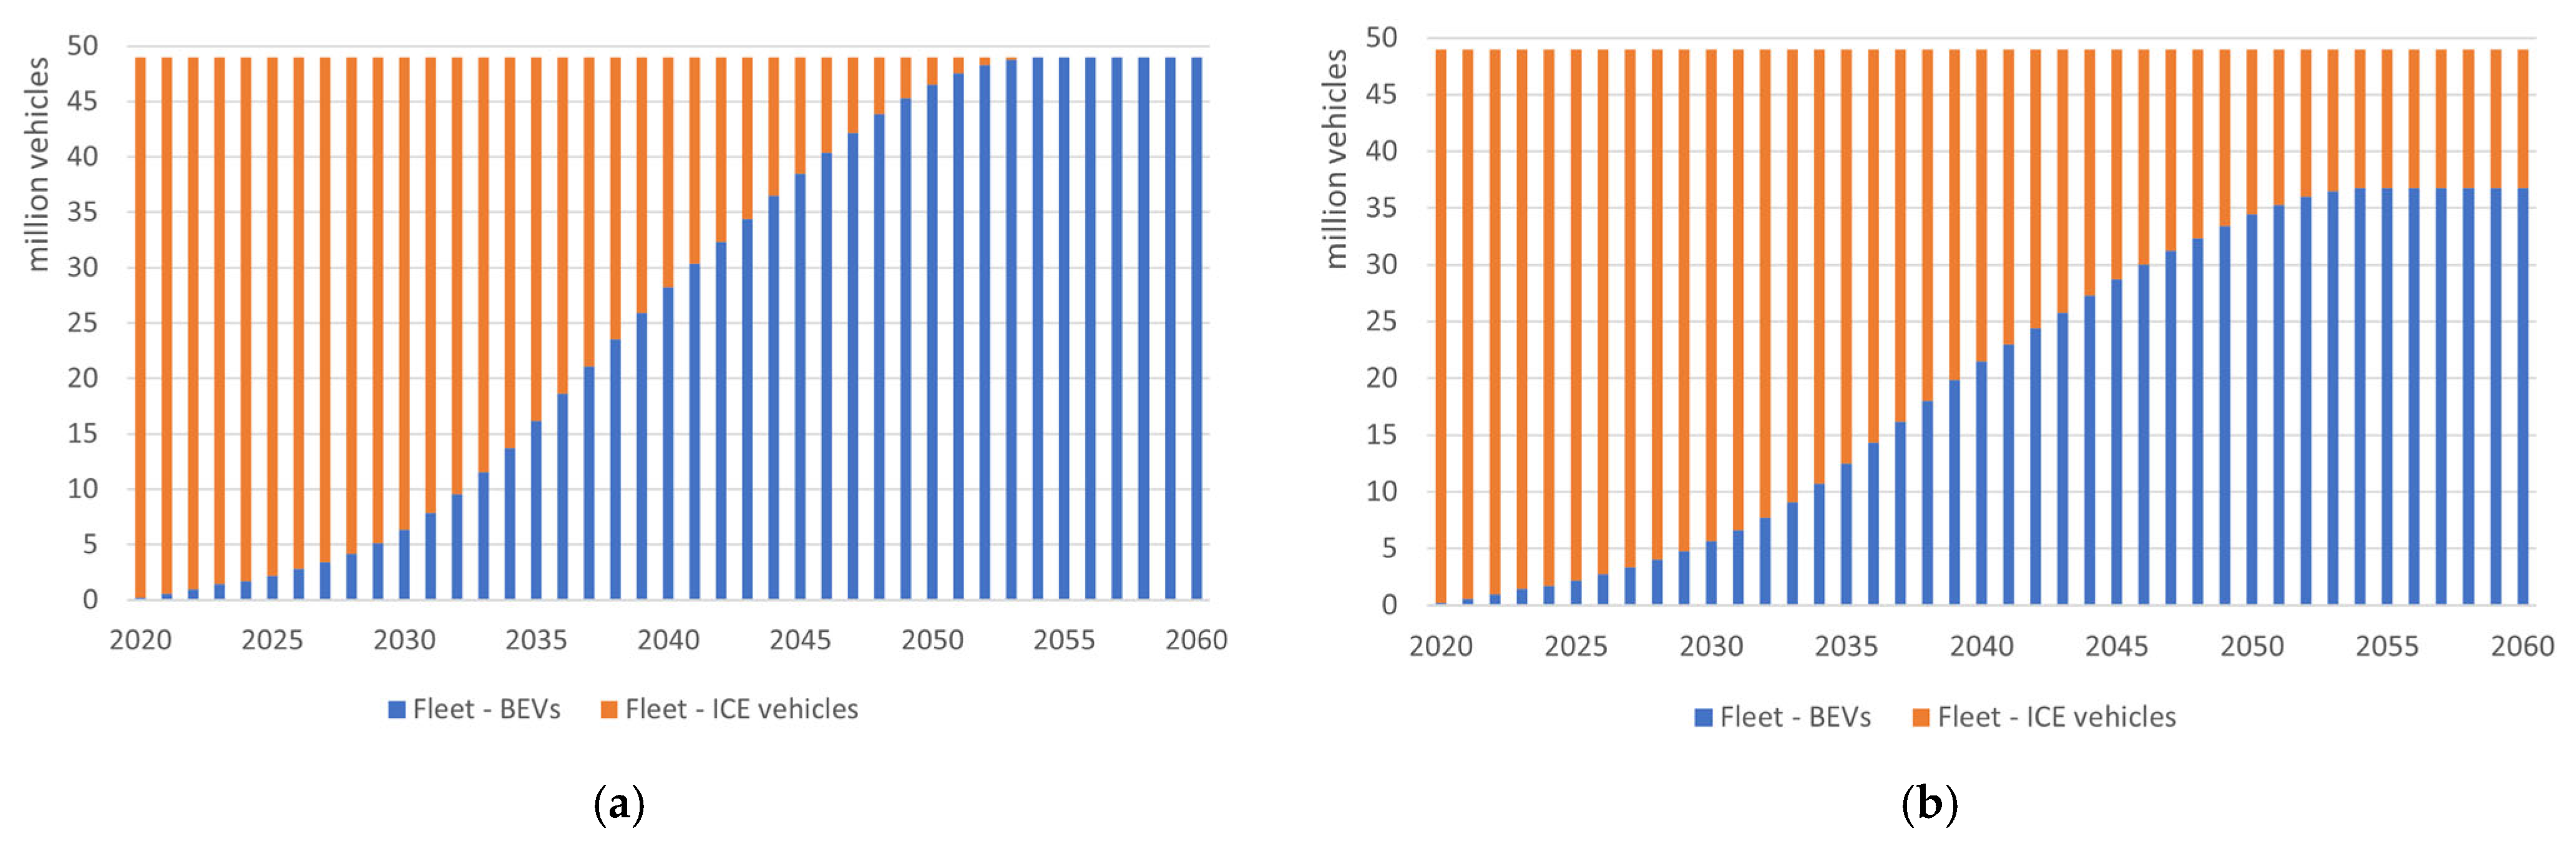
23], this assessment assumes that all passenger vehicles in the German fleet were ICE vehicles in 2019. The resulting shares of BEVs and ICE vehicles within Germany’s passenger vehicle fleet until 2060, based on the turnover dynamics described above, are shown in
Figure 5. The figures illustrate very clearly the substantial time lag between changes in new vehicle registrations and their effects on the vehicle fleet.
Another essential element of the assessment is the quantification of the GHG emissions caused by the production of BEVs and ICE vehicles. Such estimates naturally vary depending on vehicle type and production conditions and therefore differ across published sources. However, reported GHG emissions for ICE vehicle production are usually within the range of 6.0–8.8 t CO
2-equivalents (CO
2e) per vehicle [
7,
8,
9]. For this assessment, a value of 7.0 t CO
2e is used (
Table 3).
Regarding the GHG emissions resulting from BEV production, there is broad consensus that these are higher than the emissions from the production of ICE vehicles. This is mainly due to vehicle battery production, but the range of reported estimates is substantially wider than for the production emissions of ICE vehicles. Reasons for this variation include different assumptions about the capacities of the batteries installed in the vehicles, different battery cell chemistries and cathode compositions, variation in production volumes and the associated gains in battery production efficiency, different production locations and the environmental impact of local energy supply, and different time horizons assumed for battery production. The GHG emissions per kWh of battery capacity installed in a BEV are usually reported to lie within the range of 50–100 kg CO
2e/kWh, with outliers above this corridor—for example, for production in China with a more GHG-intensive energy supply today—and below it—for example, for future battery production using a high share of low-carbon electricity [
7,
8,
9,
10,
25,
26,
27,
28,
29,
30].
Equally important is the capacity of the battery installed in a BEV, which increased from about 47 kWh in 2019 to about 58 kWh in 2022 [
31]. This trend towards larger vehicle batteries is likely to continue, since limited range remains one of the main technological disadvantages compared with ICE vehicles. This study assumes that the growth in installed battery capacity will continue at the same pace as in recent years [
31] until 2030. Between 2030 and 2040, the growth rate is assumed to be half as large, after which the installed battery capacity in BEVs is assumed to remain constant. Additionally, this study uses the GHG emissions for current and future battery production in China reported in [
27], since China is currently by far the largest producer of vehicle batteries and has the largest manufacturing capacity for anode and cathode materials [
32]. The resulting estimates used in this assessment as baseline are summarized in
Table 3, which are linearly interpolated where necessary until 2040 and assumed to remain constant thereafter.
The effect of greener battery production, and thus of manufacturing the entire BEV with lower GHG emissions, is analyzed as a separate scenario in this study. Especially when battery production uses renewable electricity, the related GHG emissions can be reduced substantially [
30]. The publication by Green NCAP determines GHG emissions from battery production of about 20 kg CO
2e/kWh for the period between 2030 and 2050 [
27]. Even for the large battery capacity assumed in this study for new BEVs by 2040, this emission factor corresponds to only about 2 t CO
2e from battery production. For that reason, this study assumes GHG emissions of 9.0 t CO
2e for the production of an entire BEV in all years in the scenario with greener BEV production, compared with 7.0 t CO
2e for an ICE vehicle.
An essential parameter for modelling the GHG emissions from vehicle use is annual mileage. For more than 15 years, this parameter remained relatively constant for Germany at around 15,000 km per year until 2019, but it has recently decreased to below 13,000 km per year in 2022 [
33]. Average annual driving mileage is very similar in Germany and in other European countries [
22]. This study assumes that average annual mileage does not decrease further but remains constant throughout the assessment period. It also assumes the same value for BEVs and ICE vehicles, since the annual mileage of BEVs lies between that of petrol and diesel vehicles in European countries today [
22]. Because this is a strong assumption, a sensitivity analysis is conducted for this parameter (
Section 3.1). In this analysis, the annual mileage is varied by +/− 20% relative to the baseline assumption, reaching 15,600 km/a and 10,400 km/a by 2030.
The fuel and electricity consumption of ICE vehicles and BEVs, respectively, is assumed to remain constant throughout the assessment period. Although technological advances may reduce fuel and electricity consumption, increasing comfort and safety features—and, in the case of BEVs, increasing battery capacity and the associated additional weight—may offset potential efficiency gains. This trend has been observed in recent years for diesel vehicles [
34].
The study assumes an electricity consumption of 19.0 kWh/100 km for BEVs, which reflects the real-life electricity consumption reported by drivers [
35] of the most popular recent full-size BEVs in Germany, namely the Tesla Model 3, Tesla Model Y, and VW ID.3 [
36]. In many comparative assessments, the energy consumption of an ICE vehicle is 2.5 to 4 times higher than that of a BEV [
7,
8,
9,
10]. Based on the publications cited above, this study determines an average energy consumption ratio of 3.2, which yields a fuel consumption of 6.7 L/100 km corresponding to an electricity consumption of 19.0 kWh/100 km for BEVs.
The effects of potentially decreasing fuel and electricity consumption are also assessed in the sensitivity analysis in
Section 3.1. For this purpose, annual efficiency gains of 2% are assumed for newly registered vehicles, which appears slightly optimistic given the fuel consumption statistics of actual vehicle registrations [
37,
38]. Considering the vehicle lifetime, this reduction in the consumption of newly registered vehicles results in a consumption reduction of 0.1% per year for the entire vehicle fleet.
This study considers not only the GHG emissions from vehicle production and use, but also those from the entire supply chain for fuels and electricity. The sums of direct GHG emissions from combustion and indirect emissions from the supply of petrol and diesel are reported by the German Environment Agency as 336 gCO
2e/kWh and 342 gCO
2e/kWh, respectively [
39]. Using the heating values officially provided in the EU Renewable Energy Directive [
40], this corresponds to GHG emissions of 3.0 kg CO
2e/L for petrol and 3.4 kg CO
2e/L for diesel. Accordingly, the mean value of 3.2 kg CO
2e/L is used for the generic ICE vehicles in this assessment. A higher future biofuel or e-fuel share might decrease emissions related to ICE use, whereas increased production from unconventional sources would have the opposite effect. Since these trends may partly offset one another, and because emissions related to future fuel supply are also assumed to be relatively constant in other publications (e.g., until 2037 in [
15]), the baseline scenario in this study assumes that emissions from fuel supply and use remain constant over time.
However, the effects of Zero Emission Fuels (ZEFs) on overall GHG emissions are examined more closely in a scenario analysis. In this, the study assumes that 10% of the fuel consumed by the ICE fleet in 2030, that is, between 3.5 and 4 million liters per year, will be provided through ZEFs. This amount is large, given that the current biofuel share in the European Union is 7% [
41]. Nevertheless, introducing such an amount does not appear entirely unrealistic, considering that the quantity of biofuel dispensed in Germany increased by a similar magnitude between 2004 and 2007 [
42]. In this study, however, no gradual ramp-up is assumed for the introduction of ZEFs, in order to make the effect of this change in fuel supply clearly visible. In reality, the currently limited production capacities for ZEFs need to expand over a certain time period, leading to a gradual increase of ZEF market availability. Because the effect on reducing GHG emissions would be less visible, this assessment models a sharp market introduction in just one year. After 2030, the quantity of ZEFs introduced in 2030 remains constant for the rest of the assessment period. This means that the quantity of ZEF supplied does not increase further, but that—because fuel demand from the shrinking ICE fleet declines—the share of ZEF in the fuel mix increases. A constant level of ZEFs in the fuel supply is a rather conservative assumption that serves to demonstrate the effect induced solely by the ZEF supply initiated in 2030 and maintained thereafter.
The GHG emissions from power generation in Germany have declined significantly in the past [
43] and are expected to decrease further in the future. For the years up to 2024, official figures for the GHG emissions from electricity production, including supply chains, are available [
43] and are used in this assessment. In contrast, there are no established estimates for future GHG emissions from electricity production in Germany. This assessment therefore uses two scenarios. The first is more ambitious and is based on the estimates provided by Fritsche and Greß [
44] for the years 2030 and 2050, which are derived from the National Energy and Climate Plan (NECP) submitted by Germany in 2020. This NECP does not reflect later important decisions, especially Germany’s bringing forward of the target year for climate neutrality from 2050 to 2045. For this reason, the authors regard their estimates as conservative. They also provide estimates based on other studies that assume climate neutrality in 2045, resulting in lower values than those based on the NECP. This assessment uses those more optimistic estimates for 2060. Between the years listed, linear interpolation is used to model the development of GHG emissions from electricity production.
The second scenario in this study is more conservative. It assumes an annual decline in the GHG intensity of electricity in Germany of 2.4%, since this was the average decline between 2001 and 2024, according to official statistics [
43].
Table 4 summarizes all estimates used.
In line with similar assessments, GHG emissions from the end-of-life phase of both vehicle types are considered insignificant and are therefore neglected [
7,
8,
17].
3. Results
This section presents the results obtained from the model described above and from the scenarios assessed with it.
Section 3.1 presents the baseline results and the results for the alternative scenario assuming constantly declining fuel and electricity consumption of vehicles, as well as a sensitivity analysis of annual mileage and vehicle lifetime. In
Section 3.2, the focus is on how the results vary depending on whether the ICE ban by 2035 remains in place or is abolished, resulting in lower BEV registration rates. In
Section 3.3, scenarios with higher GHG emissions from electricity supply and lower GHG emissions from greener BEV production are assessed. Finally,
Section 3.4 addresses the potential introduction of Zero Emission Fuels (ZEFs), such as biofuels or e-fuels, and their effect on the overall GHG emissions caused by the passenger vehicle fleet.
3.1. Baseline Results Considering the ICE Ban by 2035, Effect of Lower Fuel and Electricity Consumption and Sensitivity Analysis
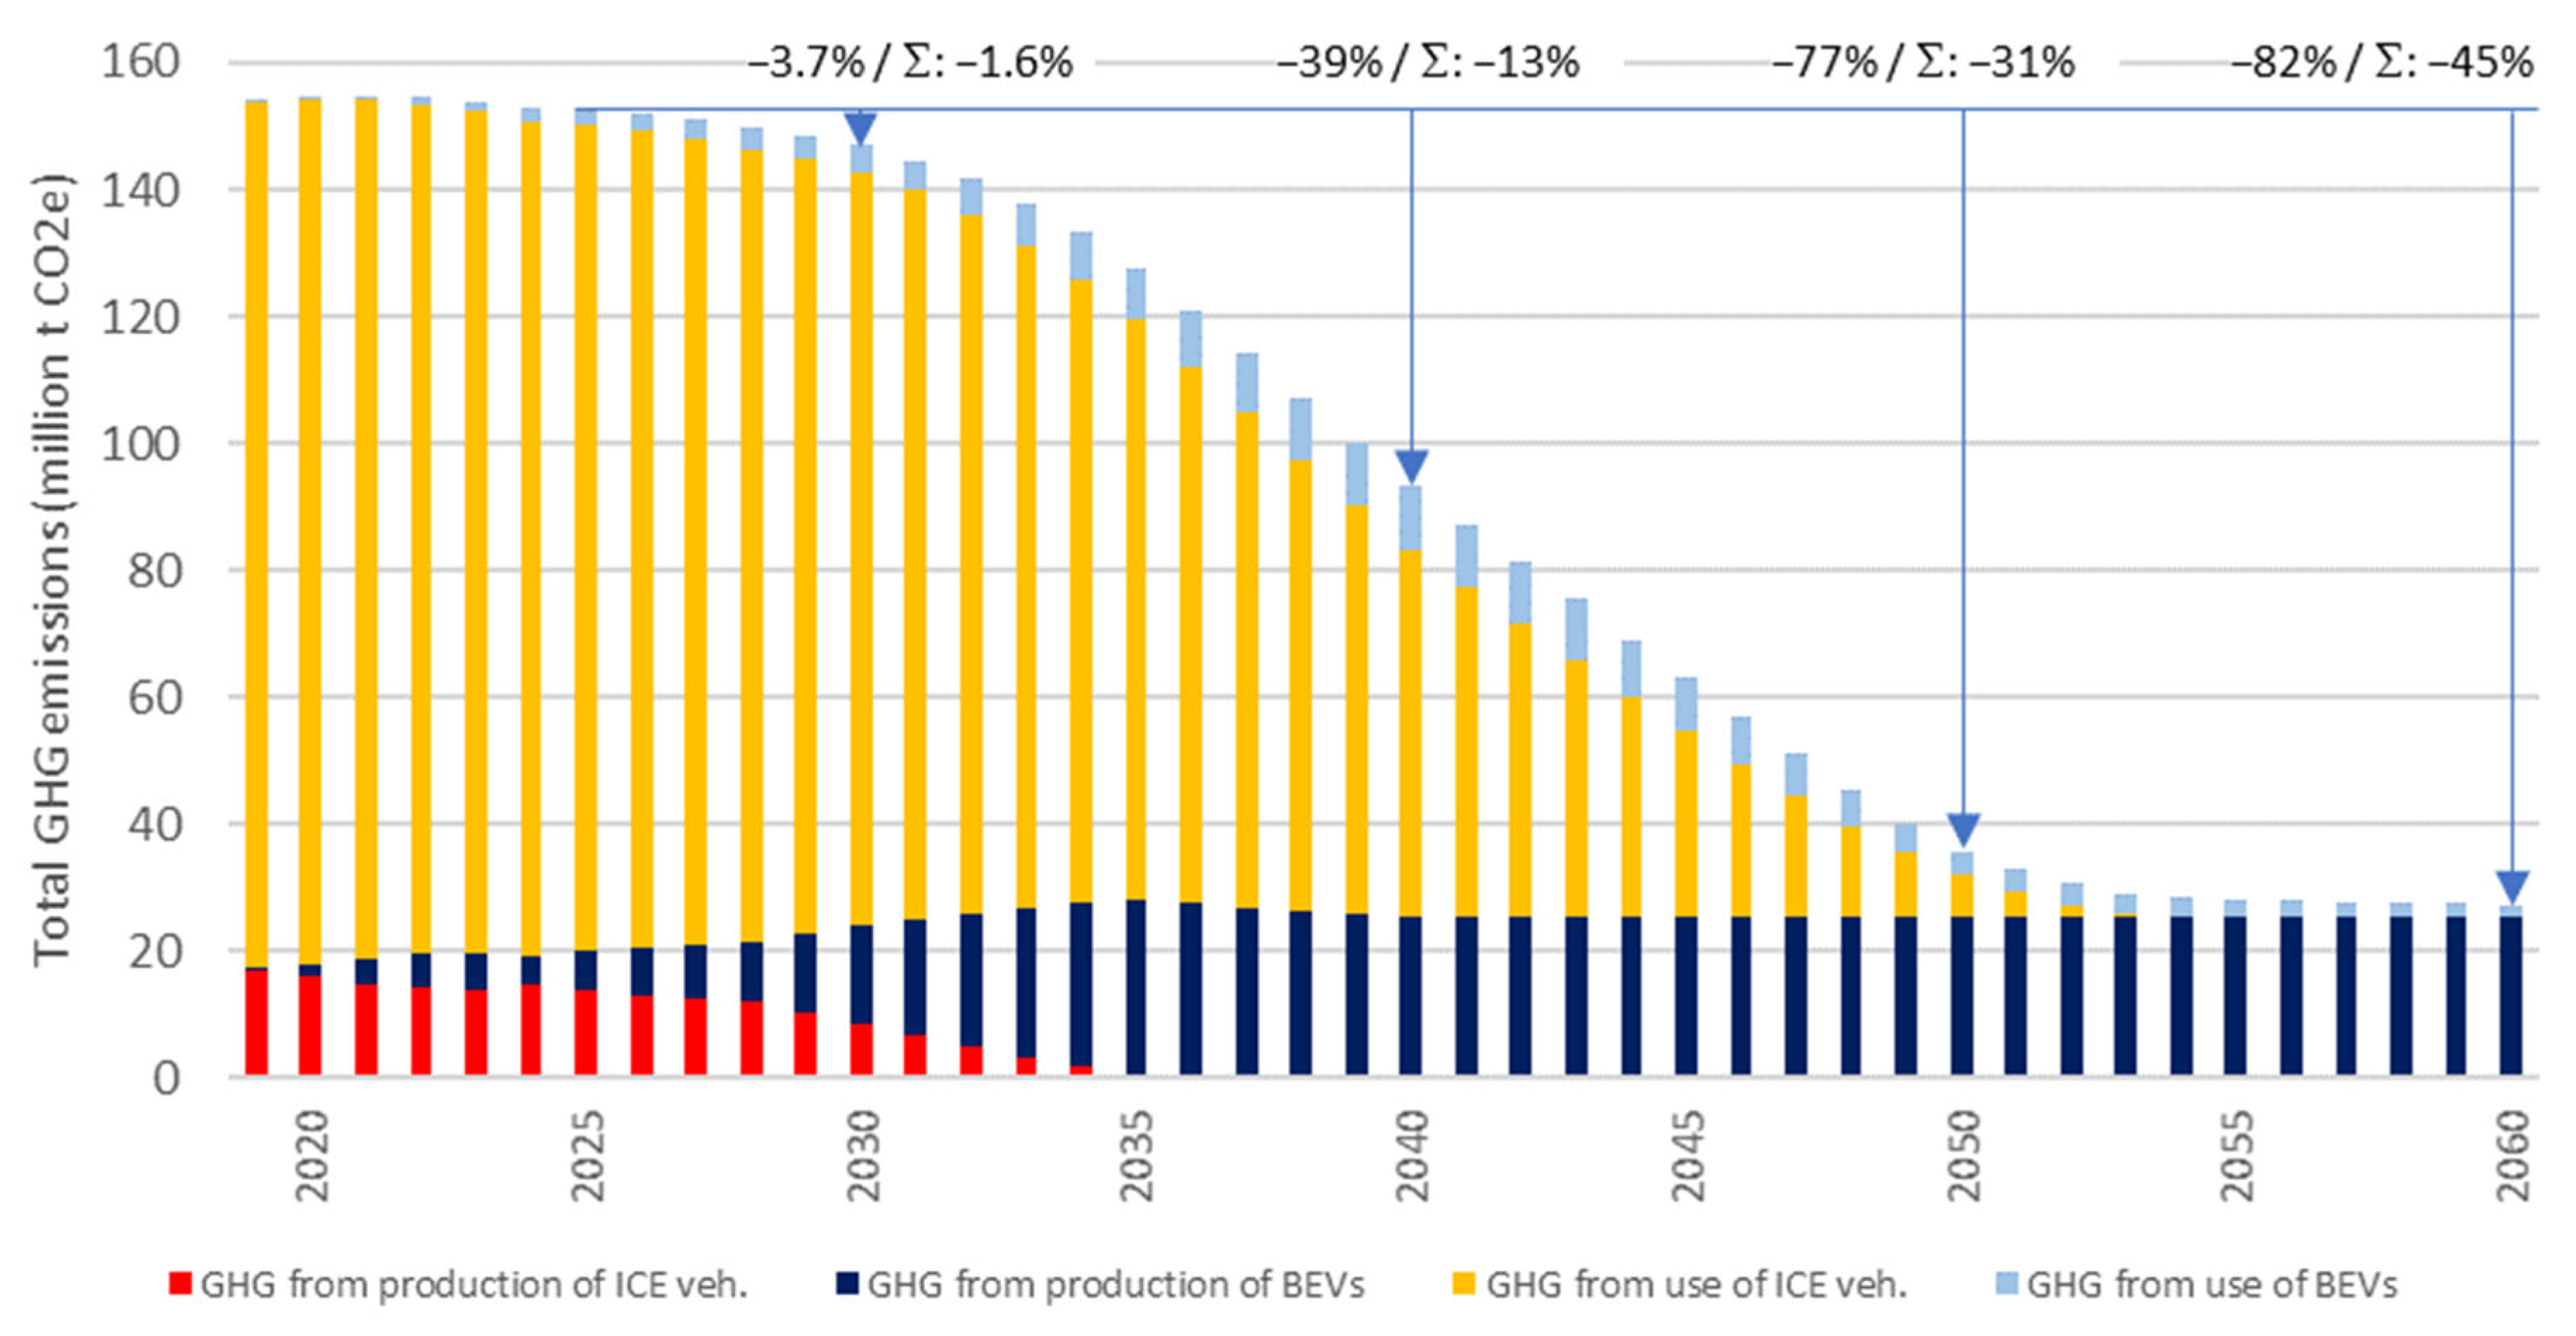
Figure 6 shows the results for total GHG emissions, that is, emissions from vehicle production and use, according to the baseline assumptions under a complete ban on new ICE vehicle registrations by 2035. Total GHG emissions decline from more than 150 million t CO
2 equivalents in 2019 to less than 30 million t CO
2e in 2060, which is more than 80% below the initial level. It is also evident that the GHG emissions from ICE vehicle production decline until they reach zero in 2035, when new ICE vehicles cannot be registered any more. In contrast, the GHG emissions caused by BEV production increase over this period, mainly because of the growing number of BEVs produced, and they reach a rather constant level by 2035.
At present, GHG emissions from the fuel consumption of ICE vehicles are the dominant component, contributing about 85% of total emissions. These emissions are about 130 million tCO
2e in the assessment results for 2025, of which about 78% [
39], and therefore approximately 100 million tCO
2e, are direct tailpipe emissions. These estimates align well with official direct and total emissions reported for passenger road transport in Germany [
45].
These emissions from ICE vehicle use decline over time during the ongoing transition from ICE vehicles to BEVs and disappear in 2054, when no ICE vehicles remain in the fleet, 20 years after the last new ICE registrations. GHG emissions from the electricity used by BEVs make only a minor contribution throughout the entire period assessed, although they rise slightly until 2040 and then decline because of progressively lower GHG emissions assumed for electricity production in Germany. The low relevance of electricity-related emissions reflects two factors: first, the lower energy consumption of BEVs compared with ICE vehicles because of their higher powertrain efficiency; and second, the potentially lower emissions from electricity production compared with the use of fuels in ICE vehicles. The latter causes about 340 gCO
2e/kWh, whereas electricity causes about 400 gCO
2e/kWh today and significantly less (see
Table 4) in the future. These differences illustrate the root cause of the substantial emission reductions achieved during the transition from an ICE-dominated to a BEV-dominated fleet.
The GHG emissions caused by vehicle production today are of minor importance, accounting for about 20 million tCO
2e in the simulation results, which is very similar to estimates reported in another publication [
46].
Notably, the overall reduction effect remains quite small until 2027. In fact, total emissions even increase slightly in the first years assessed, because the additional emissions from BEV production cannot yet be offset by lower emissions from the use of the still-limited number of BEVs in the fleet. By 2030, this results in only a modest decrease in total GHG emissions, which are 3.7% below the total emissions in 2025. Cumulative emissions, that is, the sum of the emissions from all years between 2025 and 2030, are just 1.6% lower than the theoretical cumulative emissions that would have occurred if annual GHG emissions had remained constant at the 2025 level over the same period.
The most significant decrease in total GHG emissions occurs between 2030 and 2050 and follows an almost linear trend. In 2040, overall emissions are 39% below those in 2025, and in 2050 they are 77% lower. Cumulative emissions show a reduction of 13% by 2040 compared with the theoretical total that would result if annual emissions remained constant between 2025 and 2040. By 2050, the reduction in cumulative emissions rises to 31%. The greatest reduction is, of course, achieved by 2060: the GHG emissions determined for that year are more than 80% below the emissions in 2025, and cumulative emissions are reduced by 45%.
As described in the previous chapter, this model was implemented using several simplifications. For assessing whether these simplifications have a relevant effect on the results, a sensitivity analysis was conducted.
Table 5 summarizes the results. The first variation assumes technological progress that reduces the fuel and electricity consumption of future BEVs and ICE vehicles. As described above, an annual improvement of 2% was assumed for newly registered vehicles, with corresponding effects on fuel and electricity consumption at fleet level. The results in
Table 5 indicate that this technological progress has only a minor effect on overall emissions compared with the baseline.
The second parameter investigated is the annual mileage, which is assumed to be constant at 13,000 km/a over the entire period assessed in the baseline scenario. Varying this by +/− 20% to 15,600 km/a and 10,400 km/a for the year 2030 and keeping it constant thereafter, with linear interpolation between 2025 and 2030, leads to significant changes in the results. If the simulated vehicles travel 20% farther each year, the GHG emissions in 2030 are 12% higher than those of 2025. Conversely, if annual mileage is 20% lower, the achievable GHG emission reduction increases markedly, bringing emissions in 2030 to a level 20% below that of 2025. In the long run, however, the effect continuously diminishes. As the future vehicle fleet contains a growing number of BEVs, and as electricity-related driving emissions become lower, the effect of changes in annual mileage disappears completely by 2060. Although this effect is significant for short-term emission development, a +/− 20% variation of the annual mileage changes the cumulative emissions until 2060 by only +/− 6 percentage points (
Table 5).
The third parameter investigated is the average lifetime of vehicles. This variation shows an interesting pattern: in the short term, a longer vehicle lifetime means that vehicles remain in the fleet for longer, delaying the turnover from ICE vehicles to BEVs. This reduces the relative emissions reductions compared with the baseline scenario for the years 2030, 2040, and 2050. In 2060, however, when the entire fleet consists of BEVs, a longer vehicle lifetime decreases the demand for new BEVs and therefore reduces production-related emissions. For the cumulative emissions until 2060, the effect of delayed vehicle turnover dominates, resulting in lower cumulative emission reductions when vehicle lifetime is longer. However, this effect is relatively small: varying the vehicle lifetime by 20% changes emission reductions by no more than 3 percentage points, usually (
Table 5).
3.2. Effect of Abolishing the ICE Ban by 2035
This section addresses how the results vary depending on whether the ICE ban by 2035 remains in place or is abolished, resulting in lower BEV registrations.
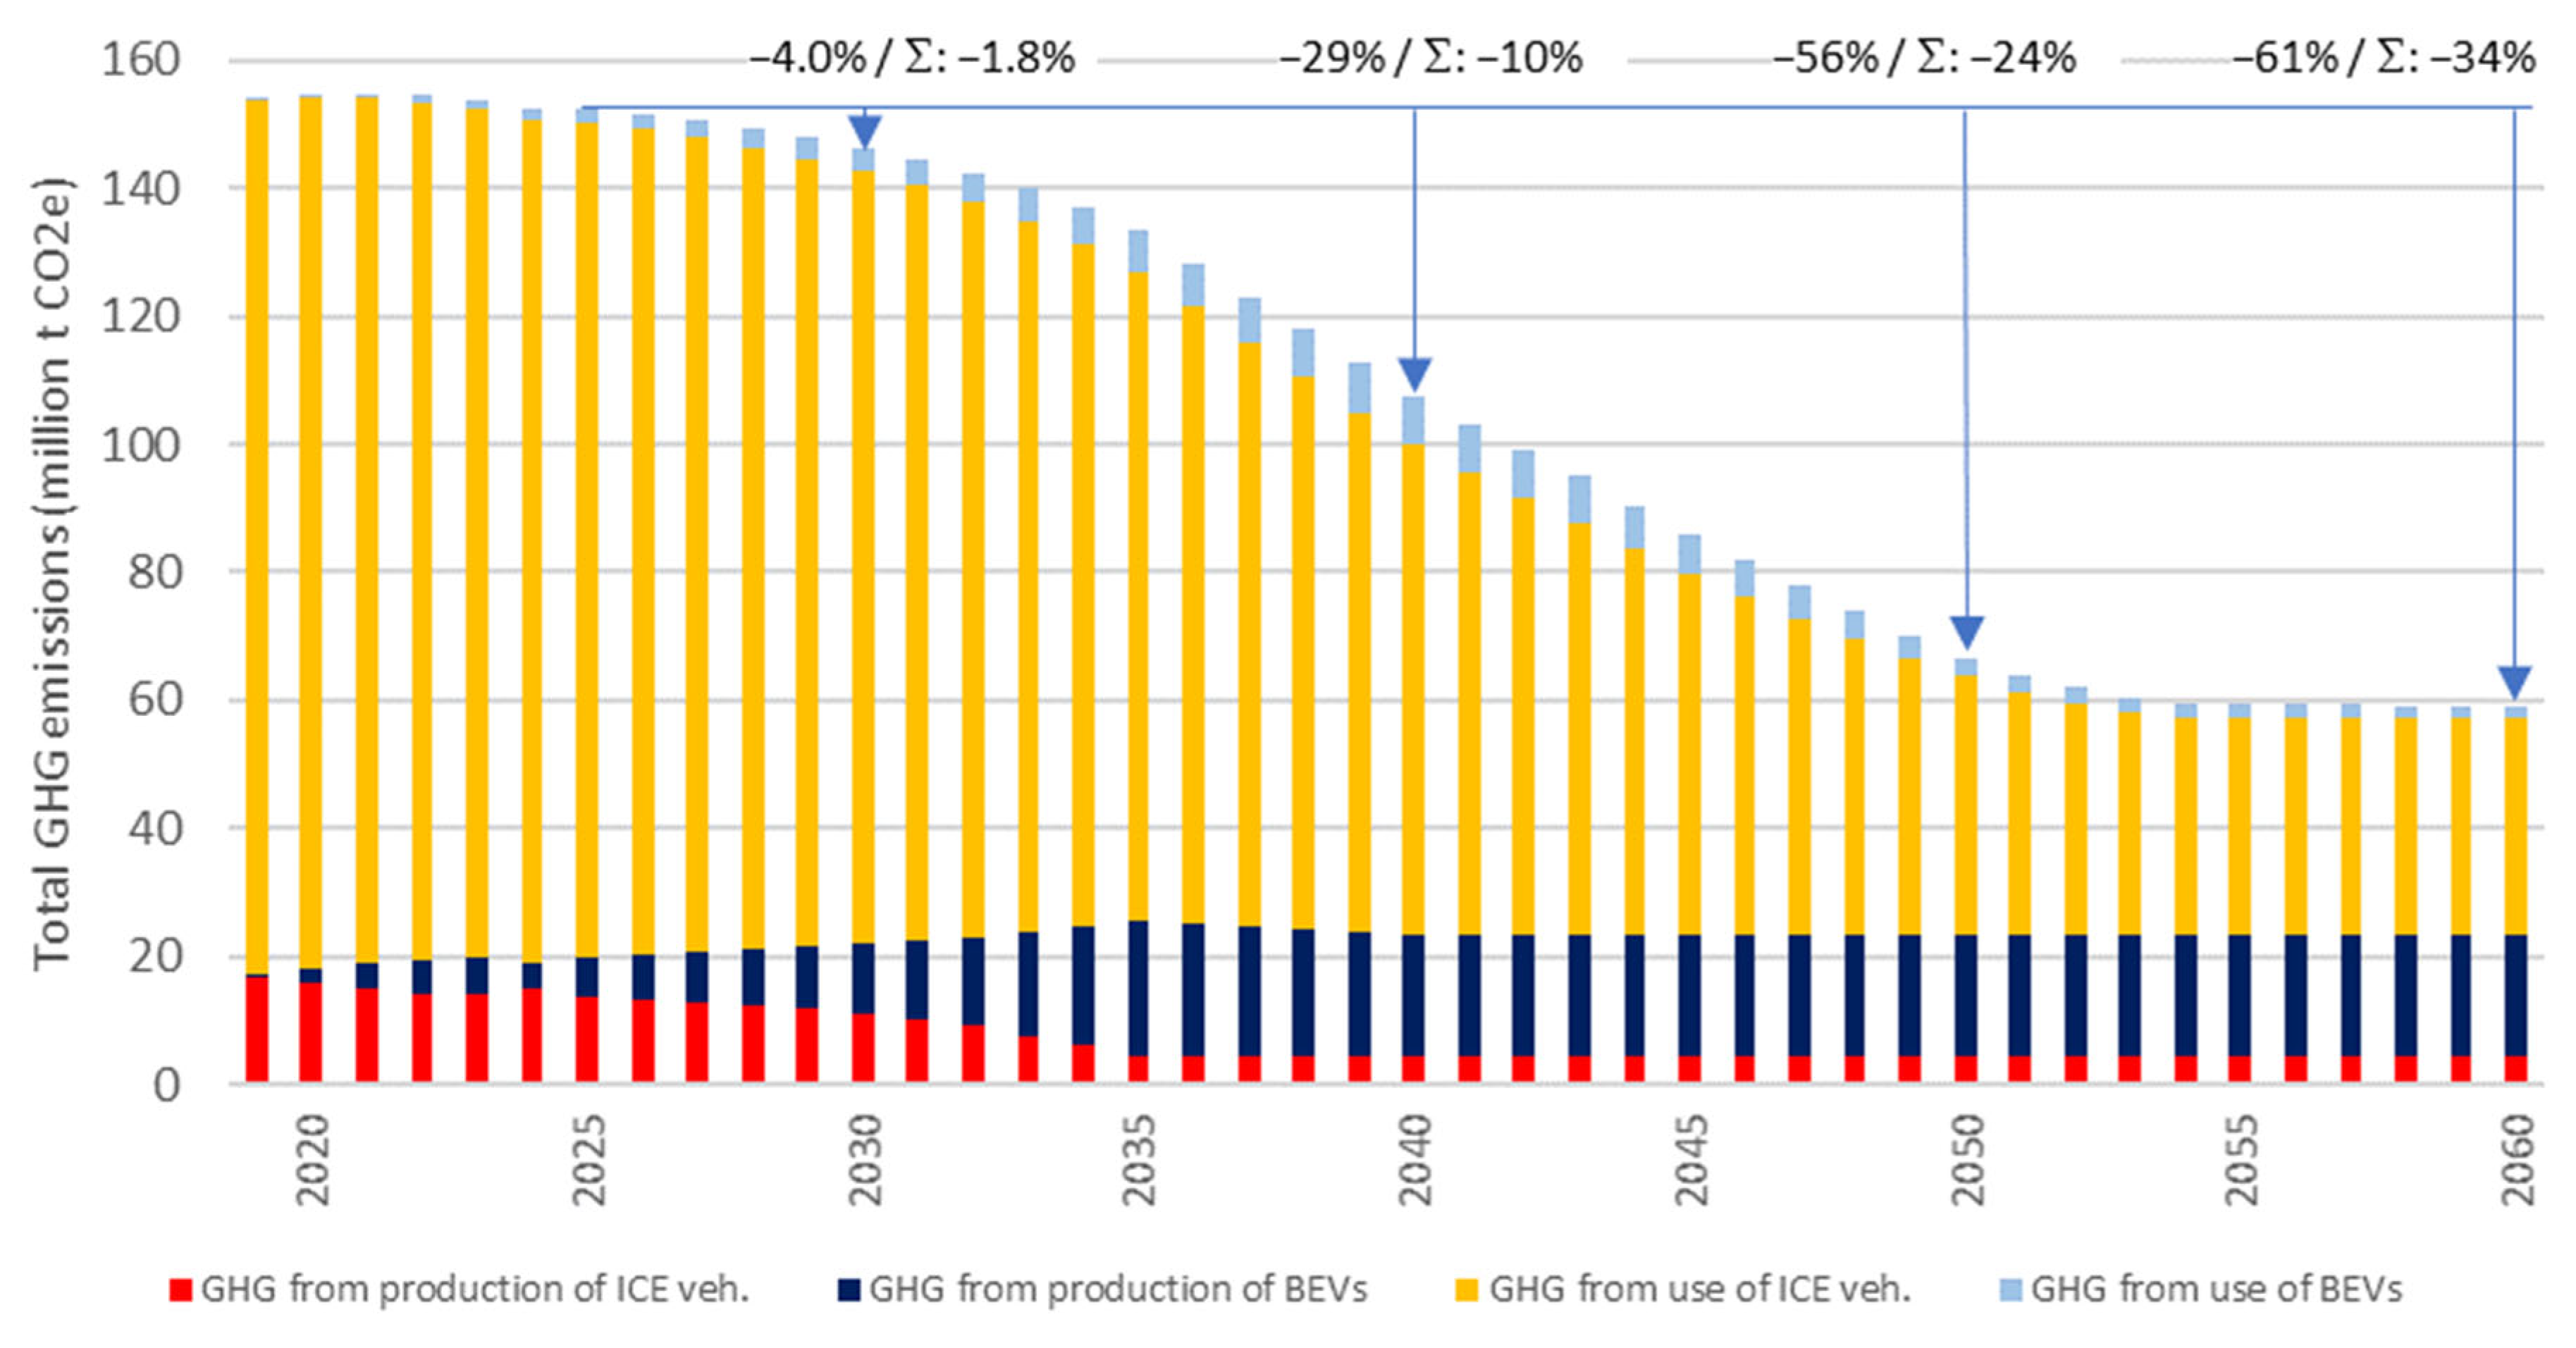
Figure 7 shows the results assuming that the ICE ban is abolished and that the BEV share among new vehicle registrations reaches 75% in 2035 and remains at that level thereafter. In this scenario, emissions from the use of ICE vehicles in the fleet remain the largest contributor throughout the entire assessment period. It is noteworthy that the emission reduction until 2030 is slightly larger when the ICE ban is abolished, both for relative emissions compared with 2025 and for cumulative emissions. Nevertheless, the reductions achieved by 2040, 2050, and 2060 without an ICE ban are substantially smaller than in the previous scenario with an ICE ban. Therefore, despite a small short-term disadvantage, the long-term benefit of a high BEV registration share for reducing GHG emissions is clear.
Table 6 compares the results of the two scenarios shown in
Figure 6 and
Figure 7 and also includes the additional scenarios with 90% and 50% BEV registration shares in 2035 and subsequent years.
It is evident that the greatest long-term GHG emission reductions are achieved in the scenario that retains the ICE ban by 2035. The lower the BEV registration shares, the smaller the achievable GHG reductions. With a BEV registration share of 50%, GHG emissions are reduced by about 40% in 2050 and 2060 compared with 2025, whereas the reduction is about 80% if the ICE ban remains in place. Cumulative emissions over the period from 2025 to 2060 are reduced by 23% for a 50% BEV registration share, compared with 45% in the ICE ban scenario.
3.3. Scenarios Involving GHG Emission Variations Based on Electricity Supply and Greener BEV Production
This section addresses the consequences of higher GHG emissions from future electricity supply in Germany and the effect of reduced GHG emissions from greener BEV production.
Table 7 presents the results of these variations for the scenario in which the ICE ban by 2035 is retained, and
Table 8 shows the results for the scenario without an ICE ban and with a BEV share of 75% by 2035.
Higher GHG emissions from electricity supply predictably lead to higher total GHG emissions. However, the achievable emission reductions remain substantial, still reaching a relative reduction of more than two thirds in 2060 compared with 2025. Cumulative emissions are also reduced considerably, by 37% until 2060, even when higher emissions from electricity production are assumed.
Even in the extreme scenario in which no improvement in the GHG emissions from electricity production in Germany is assumed and 2024 emission levels are applied unchanged until 2060, substantial overall emission reductions are still realized. By 2060, the relative emission reduction still amounts to 50%, and cumulative emissions could still be reduced by 28%, compared with a 45% reduction in the baseline scenario.
Greener BEV production leads to lower overall emissions and therefore increases the achievable emission reductions. The additional reduction is about 1–2 percentage points across all years, which is especially relevant for 2030 when the reductions in the baseline scenario are small. Nevertheless, the effect of greener BEV production appears to be of minor importance compared with the effects associated with electricity production.
For a BEV share of 75% in 2035 and subsequent years, higher emissions from electricity production also lead to higher total emissions (
Table 8). However, even under the extreme assumption that GHG emissions from electricity production remain at the 2024 level until 2060, considerable relative emission reductions of more than 30% are still achieved in 2050 and 2060, and cumulative emissions still decrease by 21% until 2060.
As expected, the benefits of greener BEV production are smaller for a 75% BEV share than for the scenario with an ICE ban. In fact, the improvement in both relative and cumulative emission reductions is only about 1 percentage point across all years assessed, for a BEV share of 75% in 2035 and subsequent years.
Based on these results, it can be concluded that the GHG intensity of electricity supply is an essential factor for total GHG emissions from the future transport sector. Still, the assessed overall emissions decline substantially, even under the worst-case assumption that the electricity mix does not improve at all between 2024 and 2060.
3.4. Scenarios Involving Introducing Additional Quantities of Zero Emission Fuels
This section presents results based on the assumption that additional Zero Emission Fuels (ZEFs), for example biofuels and e-fuels, are introduced in 2030 in an amount corresponding to 10% of the fuel consumed in that year. This available quantity is assumed to remain constant throughout the remainder of the assessment period.
Table 9 summarizes the results for the GHG emissions assuming the mentioned introduction of additional ZEFs in 2030 in the ICE ban scenario and in the scenario without an ICE ban assuming 75% BEV share and compares these to the baselines results without additional ZEFs.
In the ICE ban scenario, introducing 10% ZEFs leads to a substantial relative reduction in GHG emissions both in 2030, the year of introduction, and in 2040, when emissions are 47% below those in 2025. By 2050 and 2060, this reduction effect diminishes and eventually disappears, because fuel-consuming ICE vehicles are phased out and no longer remain in the fleet after 2054. For cumulative emissions, however, the introduction of ZEFs provides considerable improvement for all periods assessed, reaching a reduction of 50% by 2060 compared with 45% when no additional ZEFs are assumed.
In the scenario without an ICE ban and with a 75% BEV share in 2035 and subsequent years, the introduction of additional ZEFs in 2030 also leads to lower overall GHG emissions. As expected, the effect of introducing ZEFs is greater in this scenario, where a larger number of ICE vehicles remains in the fleet, than in the ICE ban scenario. This pattern applies to both the relative emission reductions, but also the cumulative emission reductions.
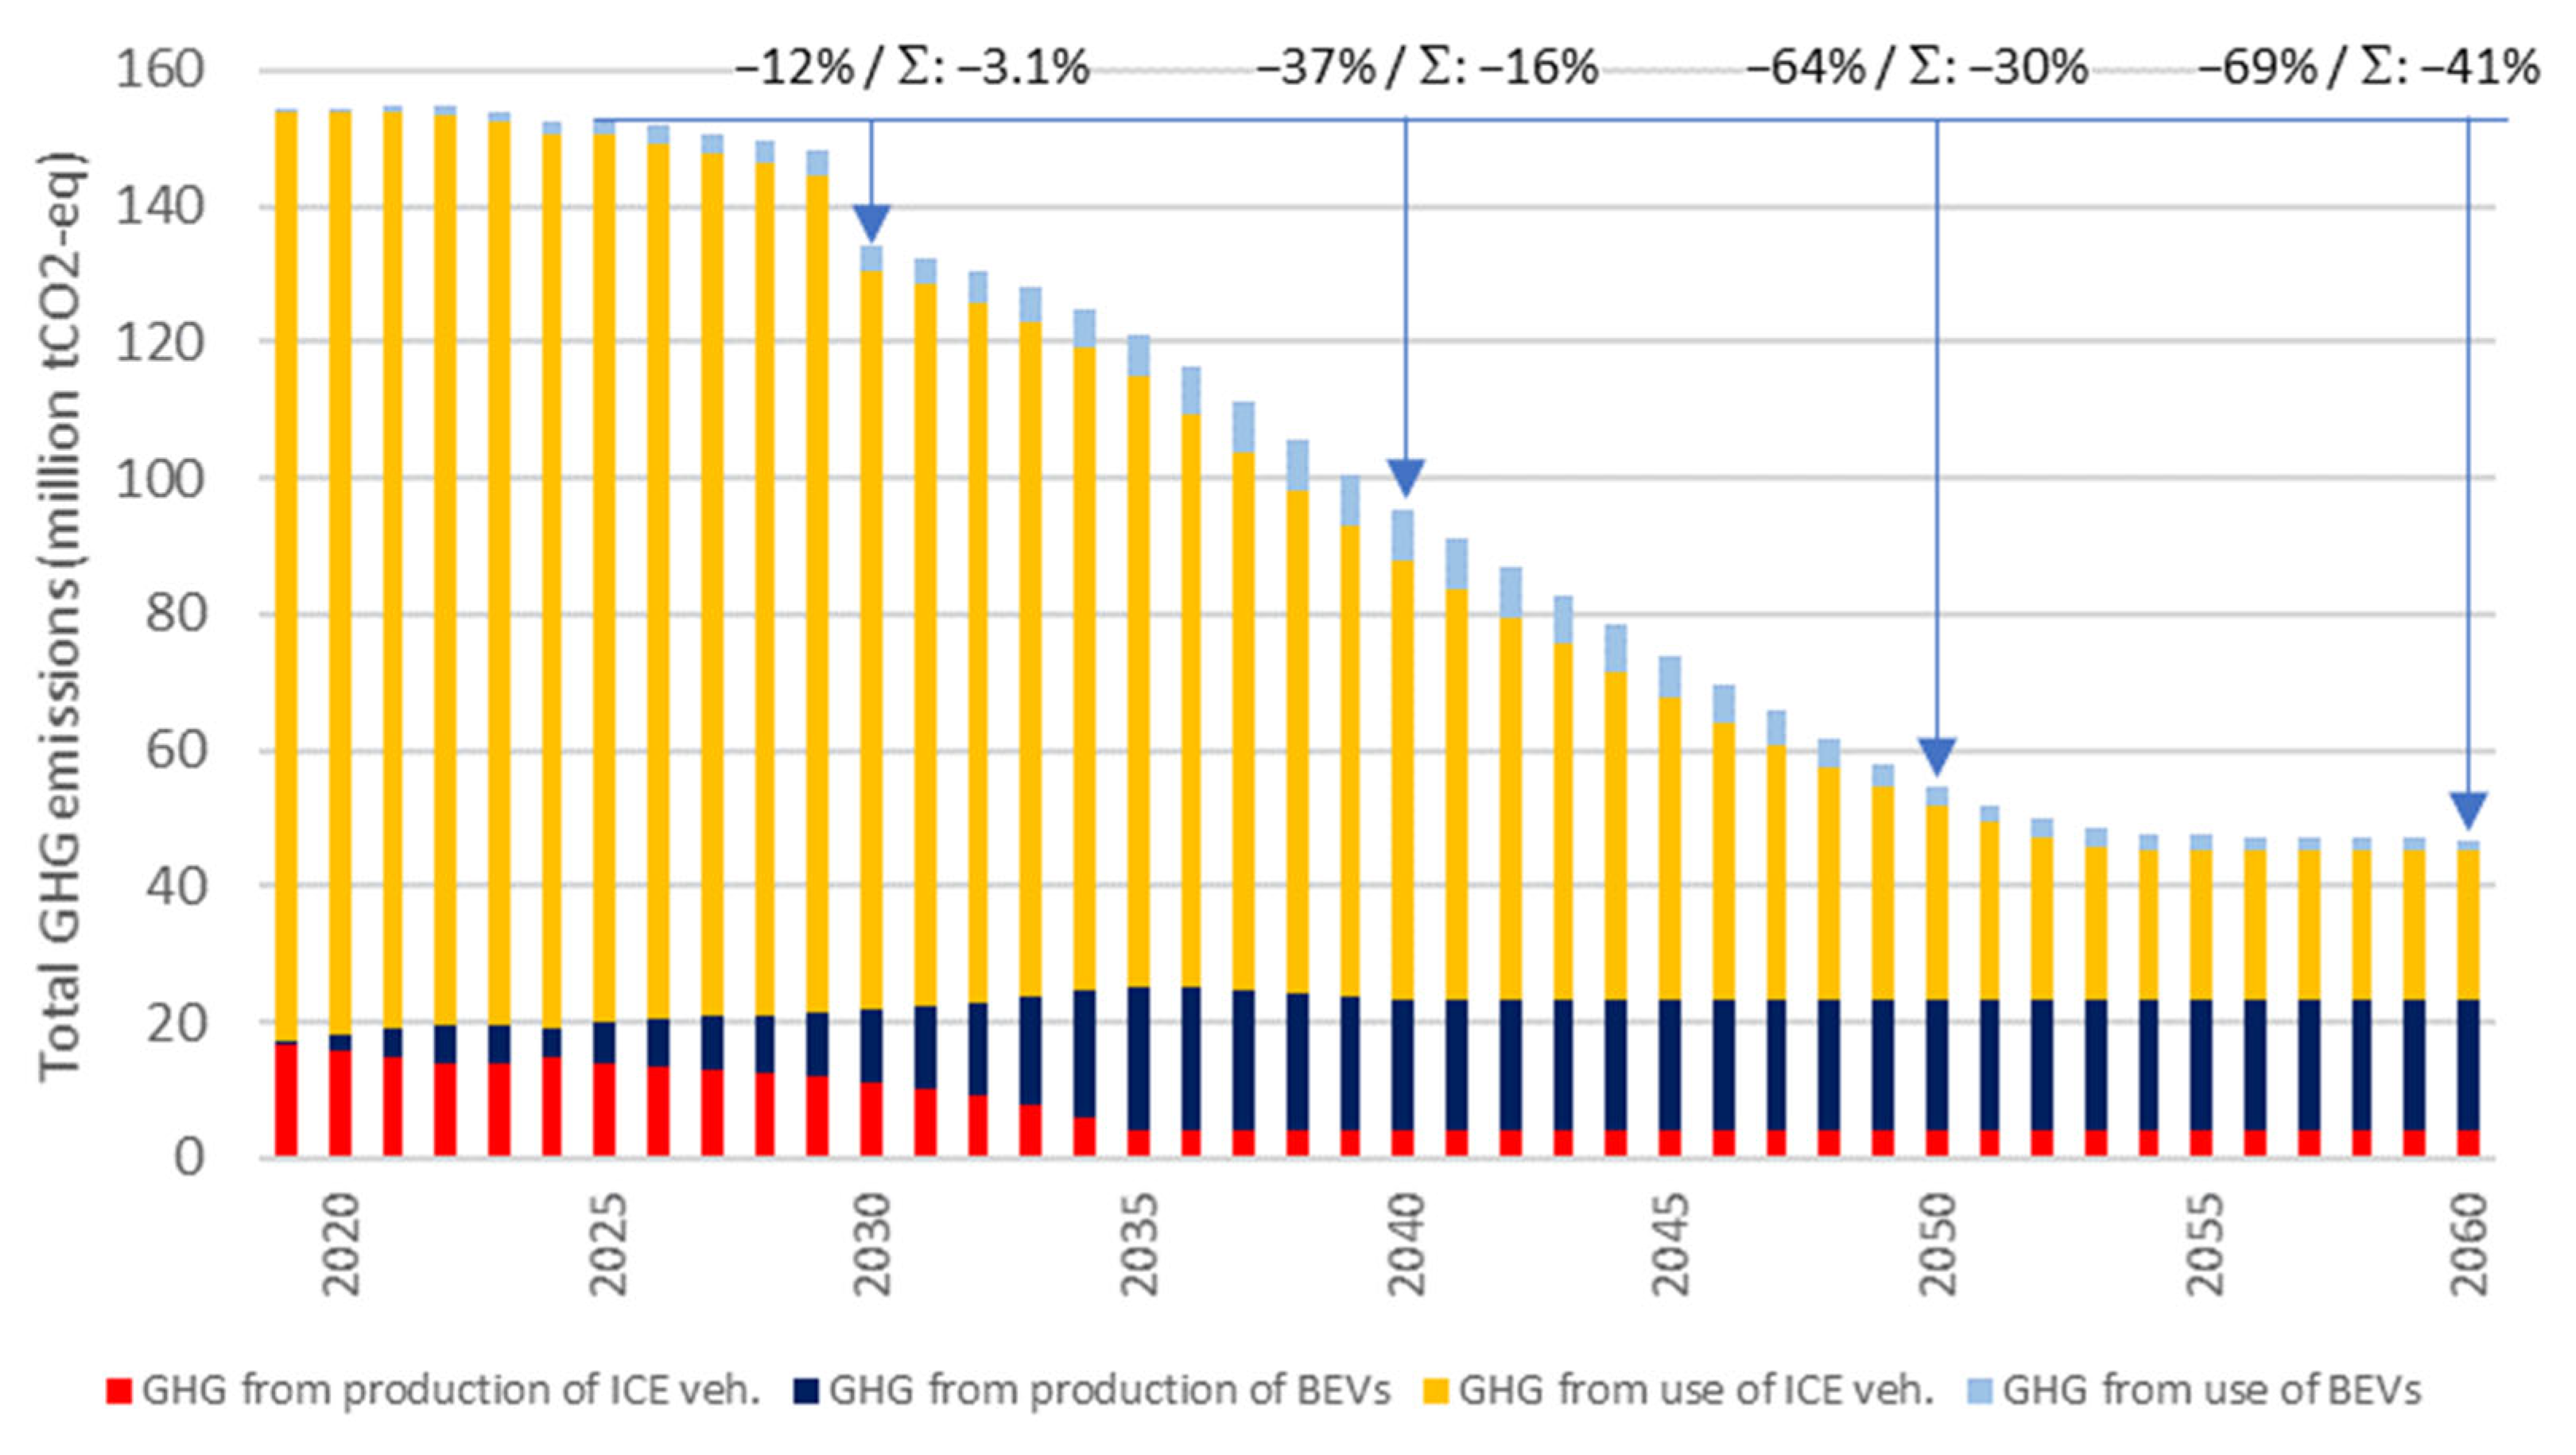
Figure 8 illustrates the GHG emissions for this scenario.
It is particularly interesting to compare the scenario with a 75% BEV share and the introduction of additional ZEFs with the ICE ban scenario without additional ZEF. Cumulative emission reductions until 2030 are small in both scenarios but are almost twice as high in the former than in the latter (3.1% vs. 1.6%). By 2040, cumulative emission reductions are considerably larger, and at 16% they are higher for the 75% BEV share and 10% additional ZEFs scenario than in the ICE ban scenario (13%). While cumulative reductions until 2050 are very similar in magnitude (30% vs. 31%), the cumulative emission reduction until 2060 is slightly smaller when ZEFs are introduced in the 75% BEV share scenario than in the ICE ban scenario without ZEFs (41% vs. 45%). Overall, this comparison of cumulative emission reductions at different points in time shows that the introduction of a 10% share of additional ZEFs compensates for most of the emission disadvantage caused by the lower number of BEVs in the 75% BEV share scenario.
In a scenario in which the BEV registration share reaches only 50% by 2035, ZEFs would need to be introduced at a substantially higher share of 25% by 2030 in order to achieve the same cumulative emissions until 2060 as in the 75% BEV share scenario with 10% additional ZEFs.
In the years beyond the assessment period, a 100% BEV fleet causes lower GHG emissions than a 75% BEV fleet with 10% ZEF share as the absolute GHG emissions amount for about 27 million tCO
2e in the first scenario (
Figure 6) versus about 47 million tCO
2e in the latter one (
Figure 8). To compensate for this disadvantage beyond 2060, higher ZEF quantities at around 25% of fuel demand in 2030 would have to be introduced and be available thereafter.
4. Discussion
This section discusses the results obtained and provides a critical evaluation of the assessment conducted in this study.
4.1. Discussion of Results
The results obtained are only valid for this simplified simulation and for the used set of parameters; they therefore do not allow for general statements. The results may differ, for example for other European countries, for different assumptions regarding technology trends or for different GHG emissions associated with vehicle production and use. Nevertheless, the results presented in the previous sections may provide several important insights relevant to policymakers, vehicle manufacturers, and end users.
The first insight concerns the fleet-turnover dynamics induced by changes in vehicle registrations. Because passenger vehicles remain in the fleet for a long time, with an average age of 10.6 years in Germany and 12.7 years in the European Union [
22], phasing out ICE vehicles from the fleet will take around 20 years or longer, even if new ICE vehicle registrations are completely banned by 2035. In that case, most achievable GHG emission reductions occur between 2030 and 2050. This considerable time lag between new vehicle registrations, changes in fleet composition, and the resulting GHG emissions is essential when evaluating the effects of different policy measures currently under discussion.
A very important result of the simulation is that abolishing the ban on new ICE vehicle registrations in Europe by 2035 generally leads to higher total GHG emissions. Only in the very near term, that is, until 2030, a lower BEV share leads to slightly lower GHG emissions. This is because the production of new BEVs causes higher GHG emissions than the production of new ICE vehicles. Until 2030, this disadvantage cannot yet be offset by the lower driving emissions of the still relatively small number of BEVs in the fleet. However, the advantage of a low BEV share before 2030 is very small compared with the emission reductions that can be achieved after 2030 through a higher BEV share and a larger number of BEVs in the fleet. For that reason, the positive effect of a high BEV share in the fleet is clear, despite small short-term disadvantages. In fact, even with a BEV share of 75% by 2035 and in subsequent years, fuel use by the remaining ICE vehicles in the fleet is the largest GHG contributor throughout the entire period until 2060 (
Figure 7). In summary, a higher BEV share is beneficial for reducing total GHG emissions. This effect is substantial when annual emissions in future years are compared with the current situation (e.g., an 82% reduction in 2060 compared with 2025). However, when cumulative emission reductions are calculated by taking into account all years from 2025 to 2060, the reduction amounts to 45%, which may be smaller than one might intuitively expect.
The second aspect investigated is the effect of GHG emissions associated with electricity supply in Germany. Naturally, higher emissions related to the electricity consumed by BEVs have a negative effect on total emissions. However, even under the worst-case assumption that GHG emissions from electricity production do not improve over time but remain at the 2024 level until 2060, total emissions are still reduced considerably: in this scenario, cumulative emissions are reduced by 28% in the ICE ban scenario, and by 21% in the scenario assuming a 75% BEV share by 2035. These reductions are, of course, smaller than the cumulative reduction in the baseline scenario and underline the importance of a low-carbon electricity supply for the positive emission effect of BEVs in the vehicle fleet. At the same time, however, the results demonstrate that the introduction of BEVs is an effective lever for decreasing transport sector GHG emissions even if, theoretically, electricity generation does not become cleaner in the future. Emissions related to electricity supply should therefore not be used as an excuse or reason to delay the introduction of BEVs. As mentioned above, fleet turnover takes considerable time, so no time should be lost in realizing this transition and securing the associated emission benefits. This finding applies not only to Germany, but also to most EU countries, given that GHG emissions from electricity supply in Germany are higher than the EU average and higher than in most EU member states [
47].
The analysis of greener BEV production revealed that this can contribute additional reductions in total GHG emissions. However, greener BEV production improves the assessed scenarios by only about 1–2 percentage points and thus has a relatively small effect in this study, in which the lifetime of all vehicles, BEVs and ICE vehicles alike, is assumed to be 20 years.
The final aspect investigated is the introduction of additional Zero Emission Fuels (ZEFs). Replacing 10% of the fuel consumed by the ICE fleet in 2030 with ZEFs leads to substantial GHG emission reductions, both in relative emissions compared with 2025 and in cumulative emissions over time. This improvement is especially pronounced in the near and medium term, as reflected in the results for 2030 and 2040. It is important to note that the emission reductions achieved by ZEFs materialize in both the ICE ban scenario and the scenario with a 75% BEV share. In the ICE ban scenario, the positive effect of ZEFs on relative emissions decreases over time and disappears as soon as the vehicle fleet no longer contains ICE vehicles. The benefit of emission reductions from using ICE vehicles before they are phased out persists in cumulative emissions. In contrast, in the scenario assuming no ICE ban, the fleet always contains a certain number of ICE vehicles, so the additional ZEFs continue to provide benefits throughout the entire period assessed in this study.
An interesting finding is that the cumulative emission reductions achieved with 10% ZEFs in the 75% BEVs scenario are quite similar in magnitude to those in the ICE ban scenario without ZEFs. This indicates that the increased emissions caused by a higher share of ICE vehicles in the fleet can be compensated for if the amount of supplied ZEFs is sufficient. In addition to the quantity supplied, the timing of ZEF introduction is also important: the earlier ZEFs are introduced, the greater the emission reductions they can provide.
Substituting 10% of fuel supply with additional ZEFs in 2030 is challenging, considering that the current biofuel share in Europe is at 7% [
41] and that the current availability of synfuels in Europe is marginal. Whether an increase in ZEF supply in this amount is realistic and economically viable is a matter of debate. Constraints for biofuel supply for passenger vehicles arise from the food-vs-fuel debate, the availability of suitable feedstocks, and competition with other hard-to-abate sectors, such as aviation [
48]. The production of synfuels suffers from high investment costs and large energy consumption, leading to high synfuel cost at present and in the foreseeable future [
49].
The greatest emission reductions would, of course, be achieved if high BEV shares were combined with the supply of additional ZEF quantities. For this reason, the issue should not be framed as either–or, but rather as a question of how both approaches can be pursued in an aligned manner and how the maximum amount of GHG emissions can be reduced in the future. If changes are made to one of these two elements, for example through adjustments to related regulations, the resulting effects on the other element must also be considered. If, for example, the ICE ban is weakened, this would need to be evaluated in light of the ramp-up and actual market availability of ZEF and their effects on both relative and cumulative GHG emission reductions. This could require corresponding adjustments to fuel-supply regulations such as the Renewable Energy Directive, for which no targets currently exist beyond 2030, most likely aiming first at a larger supply of biofuels and potentially later at a larger supply of e-fuels.
4.2. Critical Evaluation
The simulation conducted in this study is based on a model that includes several major simplifications of real-life conditions. For example, it considers only two powertrain technologies, namely BEVs and ICE vehicles, and does not differentiate between vehicle sizes or vehicle types. Hybrid powertrains may reduce future emissions from ICE vehicle use. Based on the sensitivity analysis in
Section 3.1, these improvements are expected to be relatively small. Plug-in hybrid vehicles, however, may provide an effective lever for GHG emission reductions, because they combine lower emissions from vehicle production due to smaller battery capacities with lower emissions from vehicle use, if a large share of the distance travelled is powered by electricity. The effect of plug-in hybrids should therefore be assessed in detail in future research.
While some aspects are considered to vary over time, such as battery size in BEVs, GHG emissions from battery production, and GHG emissions from electricity supply, other aspects are assumed to remain constant over time, such as GHG emissions from ICE vehicle production and GHG emissions from fuel supply. These assumptions do not perfectly represent real-life conditions, but the simplifications are considered acceptable because either the benefit of more detailed modelling is expected to be relatively small, as in the case of GHG emissions from ICE vehicle production, or because the effect of certain assumptions becomes clearer under simplified modelling, as in the case of introducing a 10% ZEF share in a single year without a ramp-up phase.
In addition, the scope of this study is limited, meaning that some potentially relevant aspects are not addressed. One of these aspects is the total number of vehicles in the fleet, which may change in the future, owing to shifts in mobility behavior, and could also affect annual mileage per vehicle. Such developments would lead to fundamental changes in the relative importance of GHG emissions from vehicle production and use. A lower total number of vehicles would be beneficial for reducing overall emissions. Similarly, using BEVs primarily for high-mileage applications, such as car sharing or taxi fleets, while reserving ICE vehicles for lower-mileage applications could further improve the results.
Another factor of major importance for the results presented here is vehicle lifetime. This study assumes a lifetime of 20 years for all vehicles, which is consistent with the average vehicle age of roughly 10 years in Germany. In reality, however, BEVs may have a shorter lifetime than ICE vehicles. Although vehicle batteries currently appear to last longer than many expected in the past, BEVs may still be less durable or less easily repairable than ICE vehicles; alternatively, because BEVs require less maintenance, they may last even longer than ICE vehicles. If the actual lifetime of BEVs is shorter than the 20 years assumed here, this would increase the relevance of BEV production and, consequently, the importance of greener BEV production. In this context, it is also important to mention future battery types, especially lithium-sulfur or sodium-based cell chemistries, which may cause lower GHG emissions than the current battery cells considered in this assessment.
An even more interesting extension would be to broaden the focus beyond GHG emissions alone. Future assessments should also evaluate the costs associated with the different scenarios and determine not only the most effective lever for GHG reduction, but also the most cost-effective one. This would considerably increase the value of the analysis for policymaking and could help identify the most beneficial societal options for reducing GHG emissions in the transport sector.
At the same time, real-life potentials and limitations, for example regarding the future availability of Zero Emission Fuels, should be considered. A realistic assessment of potential ZEF volumes and the timing of their supply, both for biofuels and for e-fuels, would also substantially increase the informative value of the analysis.