1. Introduction
The transition to EVs is vital for reducing carbon emissions and meeting global sustainability goals. The International Energy Agency [
1] reports that by the end of 2023, there were 14 million EVs globally, with sales expected to surpass 40 million units by 2030, representing 30% of the car market [
2]. This rapid growth poses both opportunities and challenges for energy systems, especially in creating effective charging infrastructures to support electric mobility. This transformation reduces greenhouse gas emissions but requires significant infrastructural and technological investments. Bloomberg New Energy Finance predicts global EV sales could reach 50 million units by 2030, driven by lower battery costs, increased consumer demand, and supportive government policies [
3]. However, growing EV adoption also heightens the need for efficient charging infrastructure.
The lack of charging infrastructure is a major barrier to the widespread adoption of EVs [
4]. A successful transition to EVs requires significant infrastructure investments. The European Commission estimates that €30 billion is needed by 2030 to develop public charging stations and upgrade the grid [
5]. This investment must prioritize both the number of stations and their strategic placement in underserved rural and suburban areas. By 2030, an estimated 4 million public charging points will be needed globally [
6], driven by the rise of commercial and heavy-duty electric vehicles [
7]. The International Renewable Energy Agency [
8] projects that renewable energy could power 20% of these stations, with solar energy likely being the main source due to its cost-effectiveness and scalability.
A significant opportunity in the transition to EVs lies in the integration of renewable energy sources, such as solar power, into the charging infrastructure. This strategy has the potential to mitigate the environmental impact associated with EV charging and alleviate the strain on conventional energy grids. Solar-powered charging stations are especially feasible in regions such as Morocco, where there is a substantial potential for solar energy utilization [
9].
The integration of renewable energy sources, such as solar-powered EV charging stations, has the potential to reduce emissions in the transportation sector by 30% by the year 2050 [
10,
11].
According to
Table 1, by the year 2030, China is projected to spearhead the transition to EVs, achieving a 50% market share in sales, the installation of 2 million public charging stations, and a total of 20 million electric vehicles on the road. This transition is anticipated to contribute to a 40% reduction in emissions by 2050. Following China, Europe and North America are expected to capture 40% and 35% of the EV sales market, respectively, while the Asia–Pacific region and India are also anticipated to experience significant growth in this sector. In contrast, Africa, Latin America, and Oceania are expected to witness a slower rate of adoption. Substantial investments, particularly in China, Europe, and North America, will be essential to facilitate the expansion of electric vehicles and the integration of renewable energy sources.
In Morocco, the Ministry of Energy, Mines, and Sustainable Development has announced an ambitious objective to achieve 500,000 EVs by 2030, representing a substantial advancement toward sustainability [
12]. This initiative is bolstered by comprehensive renewable energy policies, notably the Noor Solar Project, which is anticipated to supply solar energy to EV charging stations throughout the nation [
13].
Investment in charging infrastructure is anticipated to expand significantly. The World Bank [
14] indicates that global investment in charging infrastructure must increase by a factor of five to ten by the year 2030 to support the anticipated growth in EV sales. Furthermore, research [
15] emphasizes the essential requirement for strategic planning and investment in both hardware and software to facilitate smart grid integration, thereby ensuring optimal energy distribution across EV stations worldwide [
15].
In light of these challenges, this article introduces an optimization model to improve the planning and management of EV charging infrastructure. The model seeks to minimize installation costs, maximize PV energy use, reduce grid dependency, and optimize charging times. The structure includes a literature review summarizing existing research on EV charging, smart grid integration, and renewable energy; a methodology section detailing the optimization model using Python for Power System Analysis (PyPSA) and LOPF methodologies; a model formulation outlining the mathematical framework and objective function; a simulation and results section evaluating the model’s performance with real PV data from Cadi Ayyad University across five optimization scenarios (SC1 to SC5); and a conclusion summarizing the model’s effectiveness in developing cost-efficient and sustainable EV charging infrastructure.
2. Literature Review
The optimization of EV charging infrastructure has experienced significant advancement in response to the rapid increase in EV adoption and the growing imperative to achieve sustainability objectives. A critical component of this evolution is the incorporation of PV energy into EV charging networks, which aims to decrease the reliance on the electric grid and lower operational expenses. Nonetheless, the intermittent and unpredictable characteristics of solar energy pose substantial challenges for managing supply and demand, sizing infrastructure, and scheduling operations.
The study presented here proposes a comprehensive multi-objective optimization framework that addresses the competing goals of minimizing installation costs, reducing dependence on the grid, enhancing charging efficiency, and maximizing the utilization of renewable energy sources. In alignment with the work of Zhang et al. [
16], who developed an urban-scale mathematical model for the deployment of EV stations, this research broadens the focus to encompass renewable energy integration and real-time energy management.
Building upon the stochastic frameworks established by Dong et al. [
17], the proposed model explicitly accounts for the uncertainty associated with PV production and the dynamic behavior of battery energy storage systems, thereby ensuring resilience against real-world variability. Drawing inspiration from the work of Needell et al. [
18], the framework employs solar-prioritized scheduling to synchronize EV charging with peak solar generation and demand-side flexibility, thereby mitigating grid congestion and enhancing self-consumption rates.
The optimization model incorporates solar production profiles as fundamental inputs and is based on the joint planning methodologies established by Kumar et al. [
19,
20], wherein both PV systems and energy storage are co-optimized within integrated power and transportation frameworks. The simulation and energy dispatch processes are executed using the PyPSA platform, which employs LOPF [
21] methods as outlined by Brown et al. [
22], thereby ensuring both computational scalability and transparency.
From a techno-economic standpoint, the model assesses critical performance indicators, including system costs, charging delays, and dependence on the grid, in accordance with the evaluation metrics proposed by Hull et al. [
23] and Al-Ghussain et al. [
24]. Five distinct scenarios are examined, each varying in terms of solar penetration, battery storage capacity, and grid support, drawing methodological parallels to the study conducted by Eom et al. [
25] on solar charging networks along highways.
The proposed energy management strategy employs Mixed-Integer Linear Programming (MILP) techniques in conjunction with joint optimization methodologies. This approach aligns with the models developed by Kassab et al. [
26] and Zhang et al. [
27], which seek to optimize both energy expenditures and carbon emissions. A case study performed at Cadi Ayyad University illustrates the practicality of this approach within a real-world campus microgrid context, echoing recent research on microgrids by Huang et al. [
28] and Wu et al. [
29].
The model operationalizes a scheduling mechanism that facilitates the coordination of multiple EVs in conjunction with demand forecasting and user adaptability, reflecting the methodologies established by Jin et al. [
30] and Akaber et al. [
31]. On the algorithmic front, a hybrid approach that integrates MILP with heuristic techniques similar to Mixed-Integer Genetic Algorithms (MIGA) discussed by Chakir et al. [
32] is employed to address the intricate complexities associated with hybrid renewable energy systems.
Moreover, dynamic programming is utilized to make time-sensitive charging decisions, as evidenced by the work of Hajidavalloo et al. [
33]. The infrastructure planning aspect is guided by multi-objective evolutionary algorithms, drawing inspiration from the research of Lazari and Chassiakos [
34]. In addition to this foundational framework, Ye et al. [
35] tackled the challenges associated with multi-period infrastructure planning amidst uncertainty, emphasizing the necessity of accommodating variable charging demands and the availability of renewable energy sources. Their findings contribute significantly to the development of resilient and adaptive infrastructure. Mukherjee et al. [
36] proposed an optimization framework for the deployment of charging stations within distribution networks, taking into account PV self-consumption and the collaborative behavior of vehicle owners. This underscores the importance of coordinated energy-sharing strategies in alleviating stress on the electrical grid. Farhadi et al. [
37] implemented a data-driven multi-objective optimization strategy utilizing real-world datasets to achieve a balance among cost, environmental impact, and user needs, thereby demonstrating the potential of analytics to enhance planning accuracy and responsiveness.
Chandra et al. [
38] introduced an opposition-based competitive swarm optimization algorithm for the scheduling of solar-powered EVs within radial distribution systems. Their research is particularly pertinent to rural and semi-urban areas characterized by limited grid infrastructure, as it highlights improved utilization of photovoltaic resources and effective load balancing. Bazzi et al. [
39] developed an optimization model aimed at electric bus charging stations, which integrates solar and wind energy with storage solutions to address high-load demands in public transportation, thereby offering scalable models for future urban electrification.
Lastly, Patel and Aparnathi [
40] conducted a simulation of a three-phase, grid-integrated EV charging station powered by renewable energy sources, demonstrating reliable and stable energy exchange with the grid, even in the face of variable PV output. These support the feasibility of grid-connected renewable energy systems.
The existing literature reveals a diverse array of methodologies, including simulation-based studies, heuristic optimization, stochastic modeling, and behavioral analysis, all aimed at the development of efficient, resilient, and scalable EV charging infrastructures. Collectively, these initiatives contribute to the global shift toward low-carbon mobility by facilitating the smarter integration of renewable energy sources, the implementation of intelligent scheduling mechanisms, and the adoption of cost-effective energy management strategies.
To underscore the originality and significance of our proposed model, we conduct a comparative analysis with recent representative studies referenced in this review: Zhang et al. [
16], Kassab et al. [
26], and Wu et al. [
29]. These studies focus on the planning and optimization of EV charging infrastructure in the context of enhanced renewable energy integration. However, each study presents certain limitations, including constraints related to the scope of data utilized, the integration of grid and storage considerations, or the comprehensive modeling of EV charging behavior.
As illustrated in
Table 2, Zhang et al. [
16] employed a stochastic optimization approach to account for uncertainties in renewable energy availability, but their reliance on synthetic data and limited modeling of charging infrastructure reduced the applicability of their findings to real-world deployment. Kassab et al. [
26] emphasized multi-objective optimization for energy systems, yet their infrastructure modeling lacked technical depth and omitted actual EV charging behavior. Wu et al. [
29] focused on optimizing PV capacity for EV charging on a university campus, but their work stopped short of modeling charger-level scheduling or integrating time-dependent grid constraints. Moreover, they did not utilize open-source grid optimization frameworks, limiting the replicability of their approach. In contrast, our study introduces a comprehensive, open-source framework using PyPSA-LOPF, which uniquely enables us to follow the PV generation profile, enhancing PV self-consumption and minimizing grid dependency. By leveraging real-world PV production and EV charging data from Cadi Ayyad University, we model dynamic charging behaviors at the charger level, incorporate grid availability, and analyze multiple optimization scenarios.
3. Methodology
3.1. Model Description
The proposed optimization framework facilitates the systematic planning and management of EV charging infrastructure, aiming to achieve both cost efficiency and energy sustainability. This framework is designed to minimize installation expenses, enhance the utilization of PV energy, decrease dependence on the electrical grid, and optimize vehicle charging schedules. Utilizing PyPSA and LOPF, the model incorporates essential inputs, including time-series PV generation profiles, dynamic EV charging demands, the technical and economic specifications of chargers, and local grid availability.
The model accommodates the variability in individual EV charging requirements by estimating demand based on battery capacities and fluctuating states of charge, thereby allowing it to adjust to diverse arrival and departure patterns. However, certain real-world factors (such as battery degradation, user-specific preferences, and long-term vehicle behavior) are either simplified or not explicitly modelled, which poses a limitation regarding operational-level accuracy.
Electricity tariff sensitivity is integrated into the model through dynamic cost weighting within the objective function. This feature enables the framework to modify charging schedules and infrastructure deployment in response to time-of-use pricing or changing cost structures. Nonetheless, detailed tariff structures, including demand charges or non-linear pricing, are not currently encompassed within the model’s scope.
To account for local grid constraints at Cadi Ayyad University, the model incorporates upper limits on grid import capacity, simulating the impact of simultaneous charging on infrastructure stress. However, the LOPF-based formulation does not fully capture all nonlinear characteristics of power systems, such as voltage fluctuations, reactive power flow, or thermal limits of distribution lines. These simplifications render the model more suitable for long-term strategic planning rather than short-term dispatch or real-time control.
In its implementation, the model employs Pandas (version 2.2.3) for time-series data processing, NumPy (version 2.2.0) for numerical optimization, and Matplotlib (version 3.9.0) for result visualization. The outputs include optimized charger configurations, energy flow distributions from PV and grid sources, vehicle-specific charging schedules, total installation costs, and overall charging duration. While the model demonstrates superior performance compared to conventional methods in terms of transparency and scalability, future research should focus on incorporating stochastic elements such as PV intermittency, seasonal solar variations, and detailed grid constraints to enhance practical applicability and system resilience.
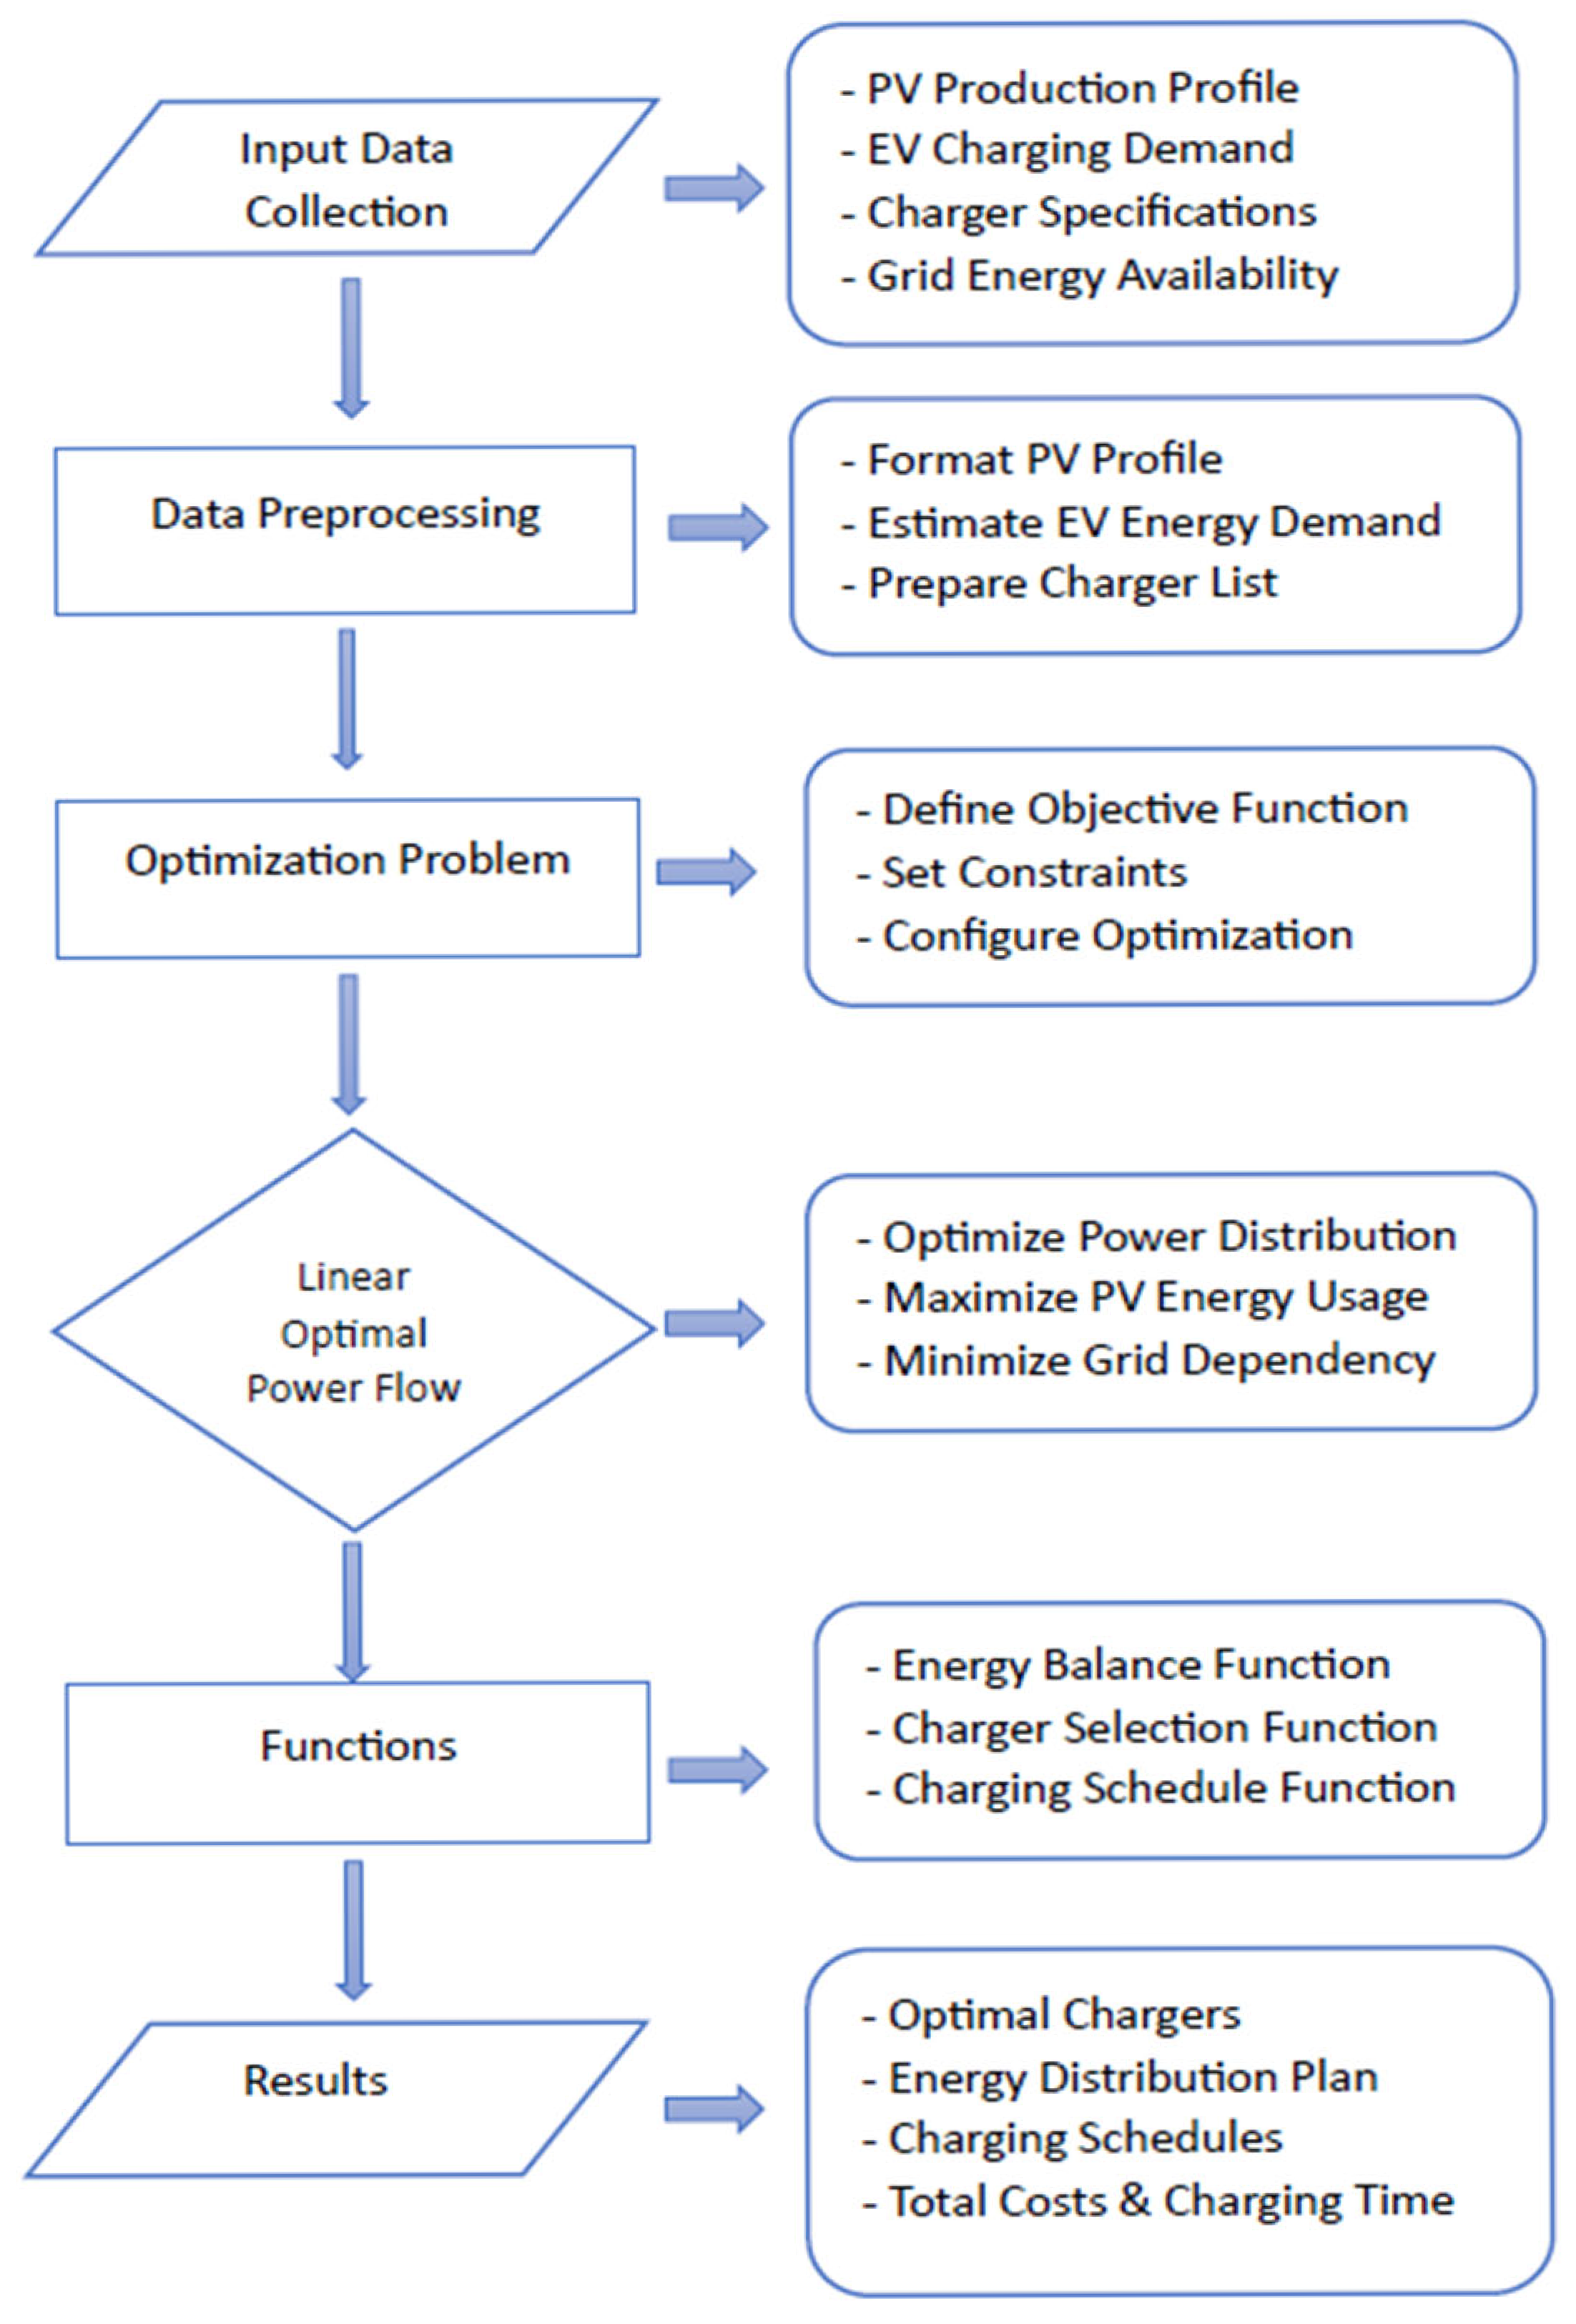
This diagram (
Figure 1) represents a structured overview of an optimization model designed to plan and manage EV charging infrastructure efficiently. The process is divided into six key stages, each contributing to achieving the main objectives: minimizing costs, maximizing PV energy utilization, and optimizing charging time.
3.2. Optimization Model: Processes and Mathematical Equations
Below is a detailed breakdown of the processes involved in optimizing EV charging infrastructure, along with the associated mathematical formulations.
3.2.1. Problem Definition and Objectives
The primary objectives of the optimization problem are:
Minimize Installation Costs: Reduce the cost of installing charging stations.
Maximize PV Utilization: Prioritize renewable energy sources for charging EVs.
Minimize Grid Energy Consumption: Reduce the reliance on expensive grid power.
Minimize Charging Time: Optimize charging schedules to reduce total charging time.
The optimization problem can be expressed as:
Equation (1) aims to minimize the total cost of the EV charging infrastructure by balancing three key factors: reducing the installation cost
, minimizing grid energy consumption
to promote sustainability, and reducing charging time
for efficiency. The weighting factors λ1 and λ2 control the importance of grid energy usage and charging speed, allowing the optimization to prioritize specific goals based on system requirements.
To ensure a balanced contribution of each term in the objective function and prioritize charging time as per our design objectives, the weighting factors λ1 and λ2 are computed based on the ratio between the installation cost and the maximum expected values of energy demand and charging time. The formulation is as follows:
where
and
represent the user-defined priority weights given to energy cost and charging time, respectively (from 0 to 1). We will explore various scenarios by varying
and
and demonstrate the robustness of the model under different priorities for cost, grid energy, and charging time.
3.2.2. Constraints
This constraint ensures that the charging power Pc,i(t) delivered by charger
i at time
t does not exceed its maximum rated capacity Pc,max,i. It represents the technical limitation of each charger.
The energy balance in Equation (5) ensures that the total EV energy demand
is fully satisfied by the sum of energy supplied from PV sources
and the electrical grid
.
The energy supplied from the PV source cannot exceed its generation at each time step:
In Equation (7) SoC evolution for EV
i, the SoC at time
t + 1 is computed based on the previous SoCi(t), the charging power Pc,i(t), the charging efficiency ηc, the time step Δt, and the battery capacity
. Based on Equation (8), the SoC for each EV must remain within acceptable limits.
3.2.3. Charger Selection Process
The selection of chargers is based on minimizing installation costs while meeting the charging demand. The total installation cost is defined as:
Equation (9) defines the total charger installation cost
, calculated as the sum of the cost
of each charger type i multiplied by the number of installed units
.
3.2.4. Charging Scheduling Process
The goal is to determine the optimal charging schedule for each EV while considering PV availability and grid limitations. The charging time for each EV is given by:
Equation (10) determines the charging time
for EVi, based on its required energy
and the power delivered by the charger
.
3.2.5. Linear Optimal Power Flow
Using
LOPF, the optimization model solves the power flow problem under the defined constraints to ensure efficient energy distribution. The power flow in the network must balance at each time step:
This power flow equation ensures that the total charging power demand (sum of
acorss all EVs) is met by the combined supply from
and the grid
.
3.2.6. Output Results
The solver produces optimized results, including:
Optimal Charger Configuration: Type and number of chargers to install.
Charging Schedules: When and how EVs should charge.
Energy Distribution Plan: Grid vs. PV energy distribution.
Cost Analysis: Total cost and breakdown.
Charging Time: Total time required for charging all EVs.
4. Results
4.1. Case Study
The optimization algorithm is implemented in a practical case study aimed at the planning and design of an EV charging infrastructure at Cadi Ayyad University, specifically within the Faculty of Science and Technology (FST) in Marrakech. This location presents both opportunities and challenges that are representative of the Moroccan context. The region’s high solar irradiance renders with average Global Horizontal Irradiance (GHI) levels exceeding 2000 kWh/m
2/year [
41], making it particularly suitable for the integration of solar energy. This project seeks to leverage this potential by developing a cost-effective charging system that maximizes the utilization of PV energy, thereby supporting the university’s commitment to sustainable mobility and the transition to green energy. However, issues related to grid reliability and capacity constraints in certain areas of Morocco, including university campuses, present significant challenges. Our model addresses these limitations by optimizing charging schedules to minimize grid dependency during peak demand periods and by incorporating local PV generation to mitigate stress on the distribution network.
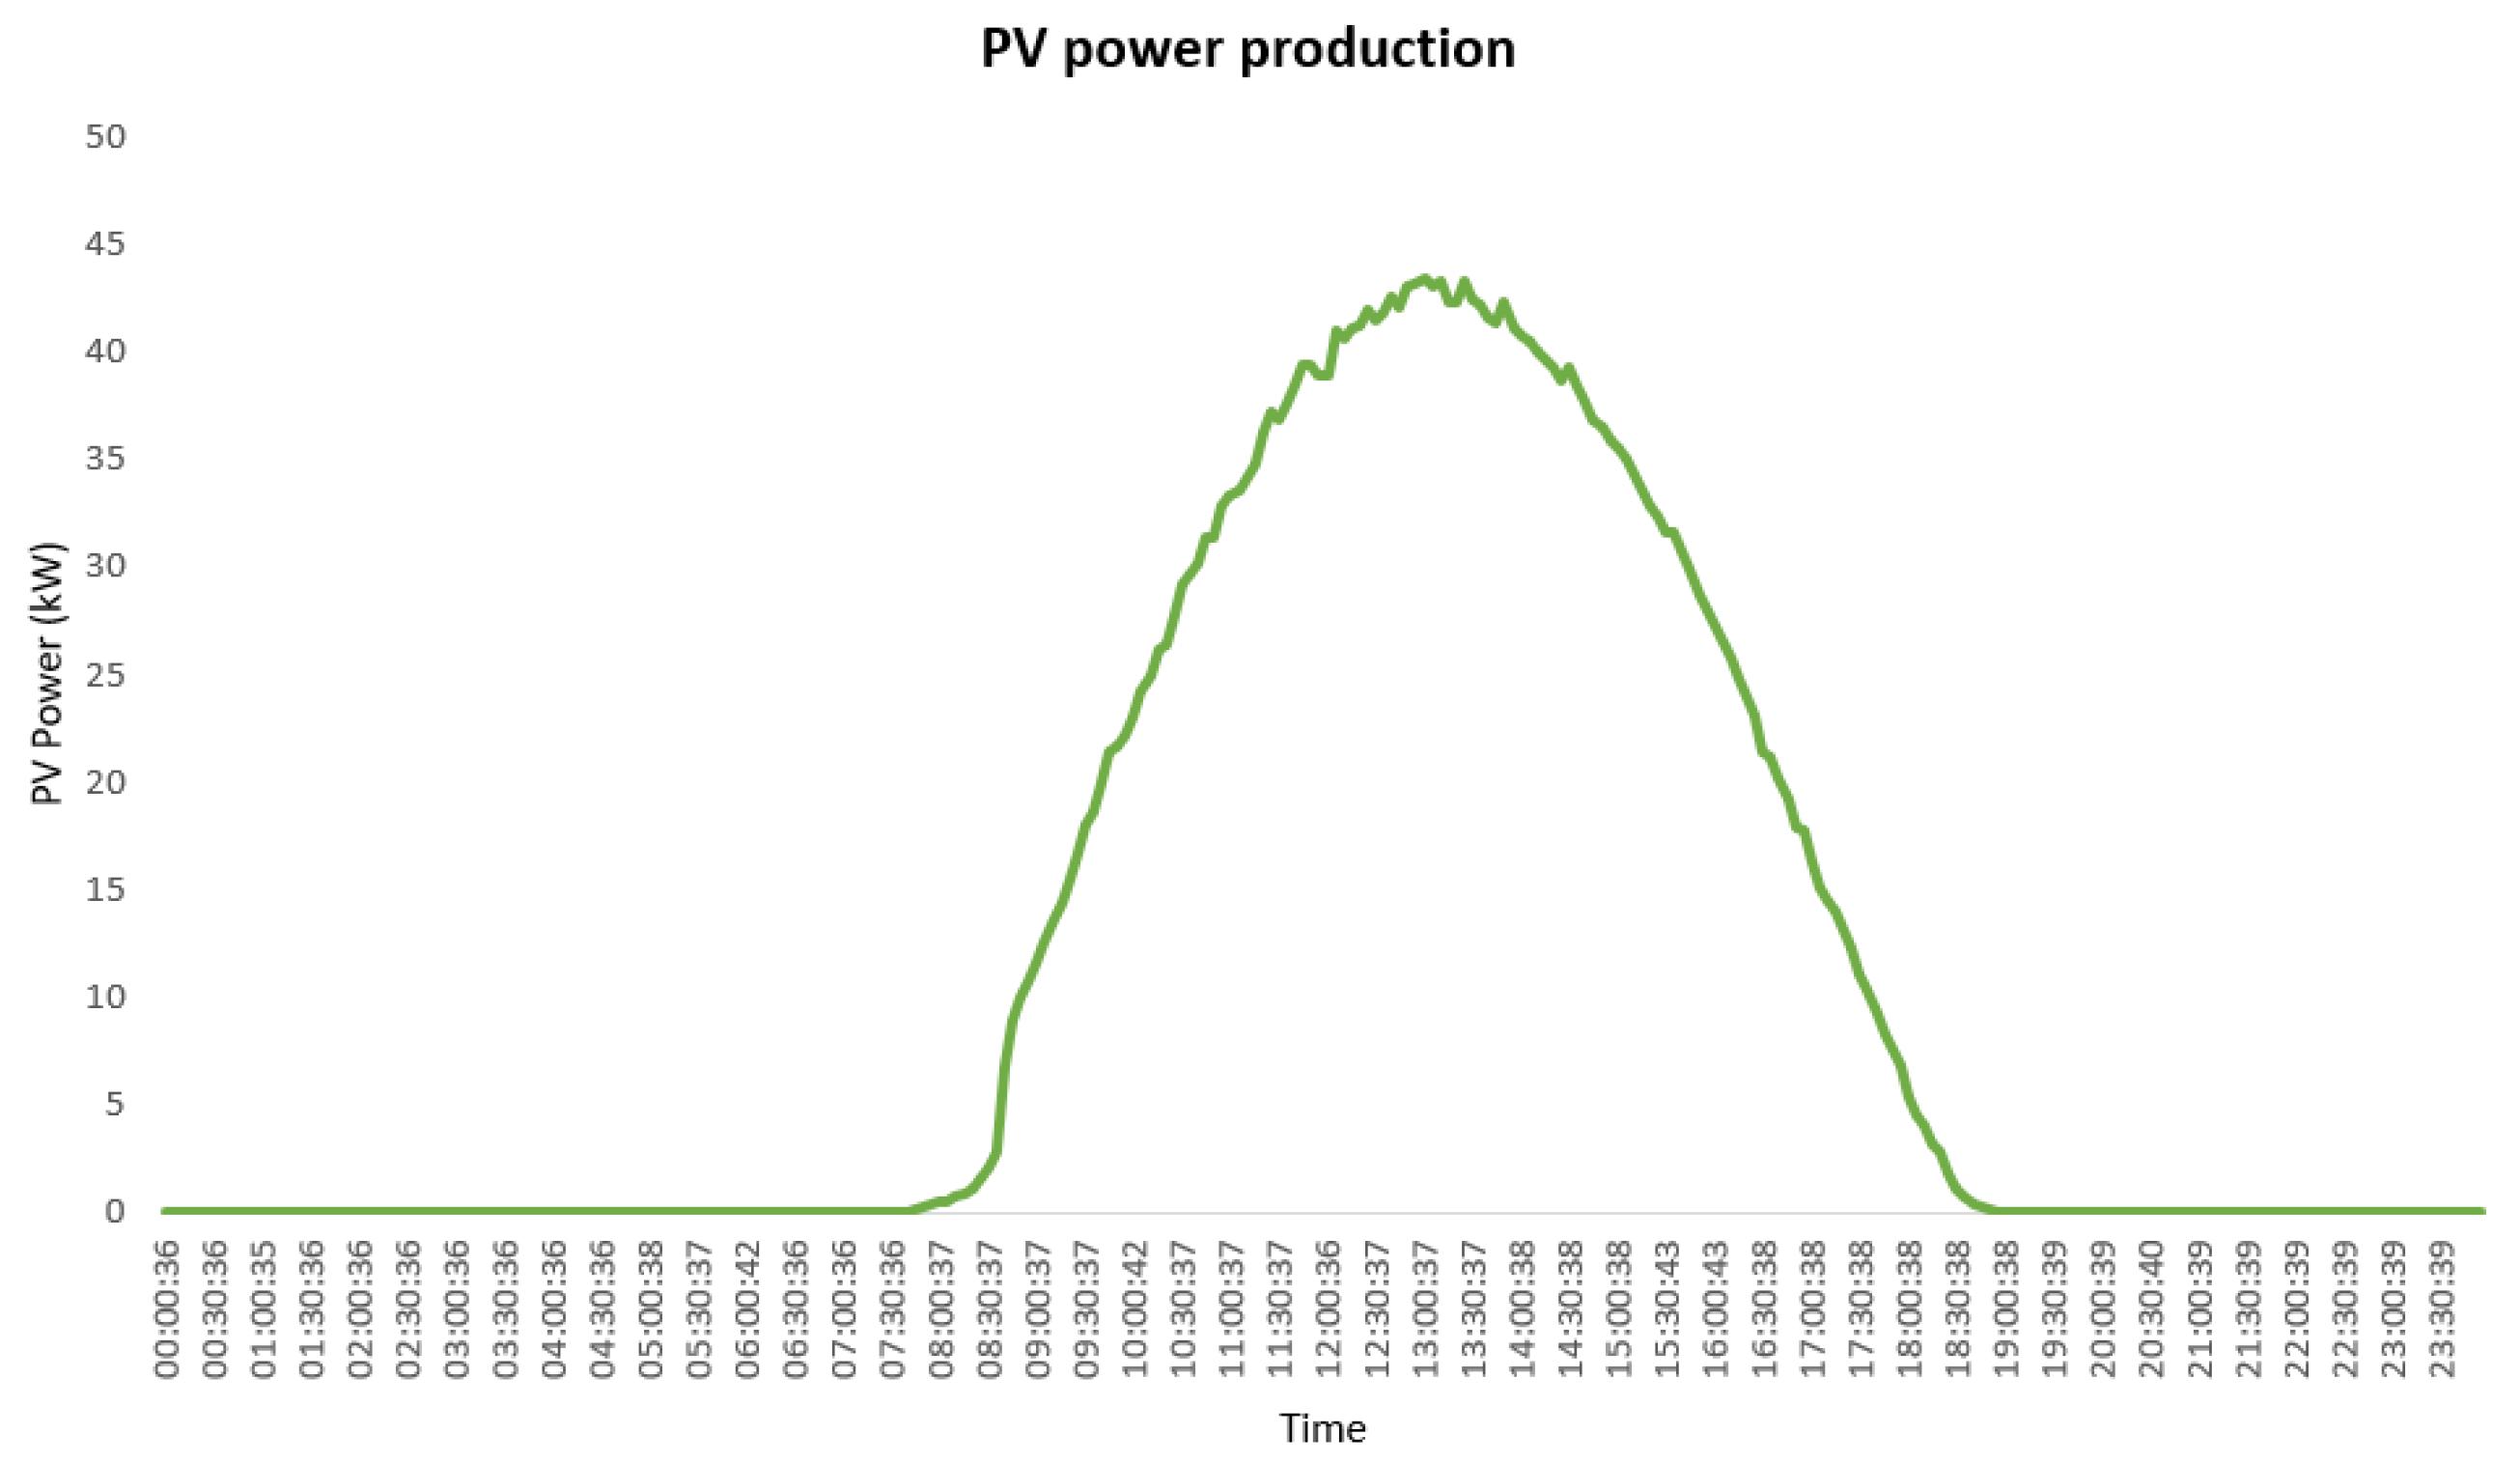
The proposed infrastructure is designed for a parking area accommodating 20 spaces, intended for approximately 20 faculty members, which represents an initial adoption rate of 10% out of a total of 198 staff members. This figure reflects the current penetration of EVs on campus and the constraints of available parking, establishing a practical baseline for a pilot phase. To assess the model under realistic conditions, we utilize actual PV production data from the university’s existing solar installation. Among various generation profiles, data from 26 March 2020 (
Figure 2) were selected as this date corresponds to one of the highest recorded PV outputs during regular academic hours (9:00 a.m. to 6:00 p.m.) within the active school calendar (September–June). Although this date does not represent year-round averages, it serves as an optimal scenario for validating the system’s performance under favorable solar conditions. Future research will expand the model to incorporate seasonal and weather-related variations, thereby providing a more comprehensive representation of Morocco’s diverse climatic patterns throughout the year.
The image (
Figure 3) shows some of the solar panels installed in the parking area of FST, while the remaining panels are located on the roof of the Research Department in FST.
This assessment analyzes the impact of solar energy on the quantity and types of chargers required, as well as their associated investment costs. Assuming each EV is equipped with a 50 kWh battery and consumes approximately 20 kWh per day, we aim to identify the most cost-effective charging infrastructure while maximizing the integration of PV. This supports the university’s objective of establishing a substantial EV fleet by 2030.
The input parameters in (
Table 3) for the optimization include the total number of parking spaces available for charging, the number of faculty members who own EVs, the battery capacity of the EVs, the energy demand per EV, the time required to charge each EV, and the peak load period during the day when charging demand is highest (09:00–18:00). The pricing for charging consists of the cost of electricity for grid charging, which is 1172 MAD/kWh, and the cost of solar energy, which is free (0 MAD/kWh). The SOC for EVs at the start of charging is set at 40%, while the university-wide electricity demand, excluding EV charging, is assumed to be 200 kW. The grid power cost is 1172 MAD/kWh, as referenced from [
42]. The optimization aims to reduce grid power consumption while maximizing the use of solar energy for the EV charging stations.
The charging stations considered for this infrastructure comprise a combination of Level 2 AC and Level 3 DC chargers, each with varying power outputs and costs (
Table 4).
The selected chargers include the Tesla Wall Connector (11.5 kW, 7719 MAD), ABB Terra DC Wallbox (50 kW, 50,000 MAD), Siemens VersiCharge (7 kW, 6500 MAD), Delta DC Wall Charger (25 Kw, 35,000 MAD), ABB Terra HP (150 kW, 120,000 MAD), and Innogy eBox (22 kW, 15,000 MAD). References for these charging stations can be found on the official websites of Tesla, ABB, Siemens, Delta, and Innogy.
This study will evaluate the impact of various types of charging stations, along with their associated costs and power outputs, on the overall energy consumption and optimization of EV charging infrastructure. The focus will be on achieving an efficient balance between grid usage and solar energy utilization.
4.2. Discussion and Results
Before presenting the results of the optimization scenarios, we will first discuss the key factors considered in the optimization process and the objectives that guided each scenario. The optimization aimed to address several important criteria for the EV charging infrastructure at FST. These criteria include the total number of chargers to be installed, types of chargers selected, installation costs, total energy drawn from the grid, energy supplied by PV, charging time, and operational costs.
Each optimization scenario was designed to prioritize a specific objective, as follows:
SC1: This scenario represents the baseline configuration, with no specific optimization objectives, serving as a reference point for comparison.
SC2: In this scenario, the primary objective was to minimize installation costs while fulfilling the essential requirements for charging infrastructure.
SC3: Maximize PV Energy (Minimize Cost): This section emphasizes maximizing the utilization of solar energy for charging EVs while simultaneously minimizing installation costs.
SC4: Minimum Charging Time: The objective in this scenario was to minimize the charging time for each vehicle, thereby optimizing the system’s efficiency to ensure rapid charging.
SC5: Maximize PV Energy, Minimize Time, and Minimize Cost: This scenario aims to achieve a balance by maximizing solar energy utilization, minimizing charging time, and reducing costs, thereby creating a comprehensive solution.
The results of each optimization scenario, including the number of chargers installed, types of chargers, energy drawn from the grid, energy generated from PV systems, installation costs, and other key performance indicators, are presented below. These results will enable us to assess the impact of each optimization objective and identify the most effective solutions for the EV charging infrastructure.
4.2.1. Number of Chargers Installed and Charger Type and Charging Time per EV
In this study, the number of chargers installed is a critical factor influencing the operational dynamics of the EV charging infrastructure. The decision regarding the quantity and types of chargers not only affects the installation costs but also the operational efficiency and energy management.
Table 5 compares five scenarios (SC1 to SC5) based on the number of chargers installed, charger type, total installation cost in thousand Moroccan Dirhams (kMAD), and charging time per electric vehicle (hours). It provides insights into infrastructure design, cost efficiency, and charging performance.
Among the evaluated scenarios, SC5 emerges as the optimal configuration, striking the best balance between cost, performance, and energy distribution. In SC1, 20 Level 2 AC chargers (7 kW) are installed at a total cost of 130 kMAD, offering a moderate charging time of 5.2 h per EV. SC2 reduces the number of chargers to 10, cutting installation costs in half to 65 kMAD while maintaining the same 5.2 h charging time. Though cost-effective, this scenario limits future scalability.
SC3 introduces a hybrid setup with five Level 2 AC chargers (7 kW) and three Level 3 DC chargers (22 kW), costing 77.5 kMAD. This setup reduces charging time to 3.8 h, enhancing overall efficiency. SC4, the most performance-driven option, includes three Level 2 AC chargers (22 kW) and three Level 3 DC chargers (50 kW). Although it achieves the shortest charging time of just 0.9 h, it does so at the highest cost (150 kMAD), making it less viable from a budgetary standpoint.
SC5, in contrast, integrates three Level 2 AC chargers (7 kW) with four Level 3 DC chargers (22 kW) for a total cost of 79.5 kMAD. This configuration reduces charging time to 3.3 h, offering a well-rounded compromise between investment and operational performance.
In conclusion, SC4 prioritizes speed at a high cost, while SC2 focuses on affordability at the expense of scalability. SC1 presents a balanced but less flexible model. SC3 and SC5 stand out as intermediate options, with SC5 offering slightly superior efficiency, making it the most advantageous scenario when considering both economic and functional criteria.
4.2.2. Total Installation Cost and Operational Cost
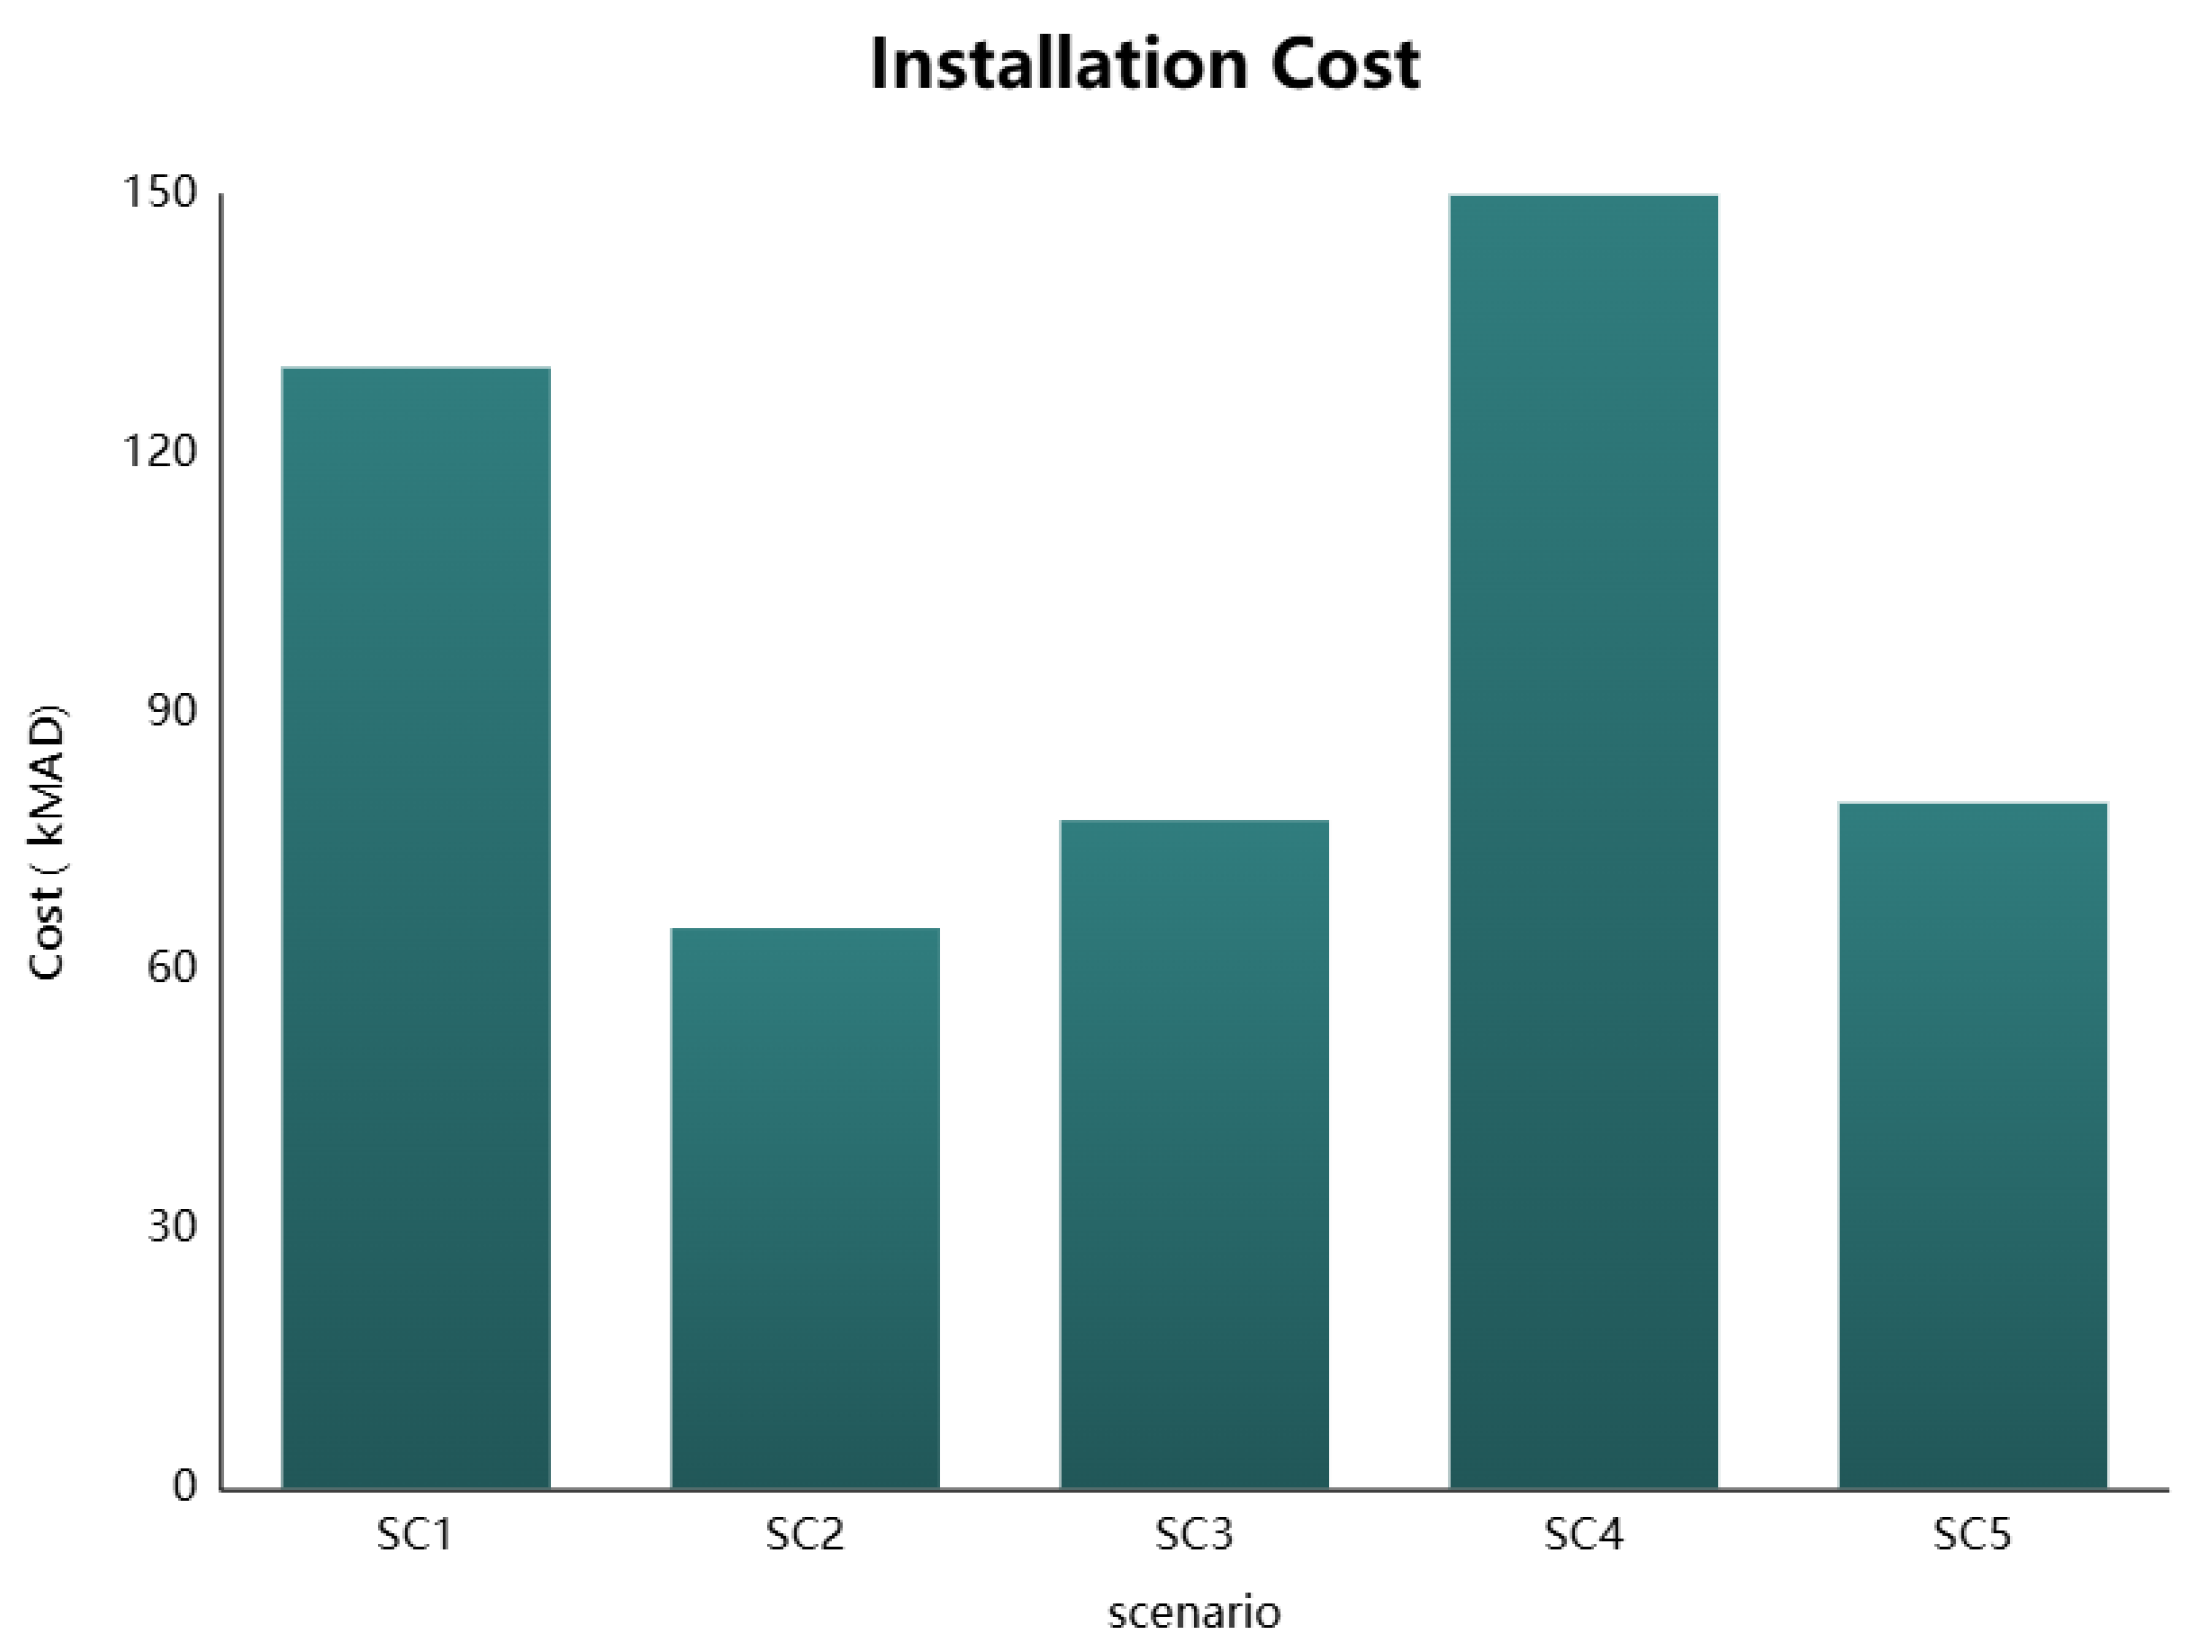
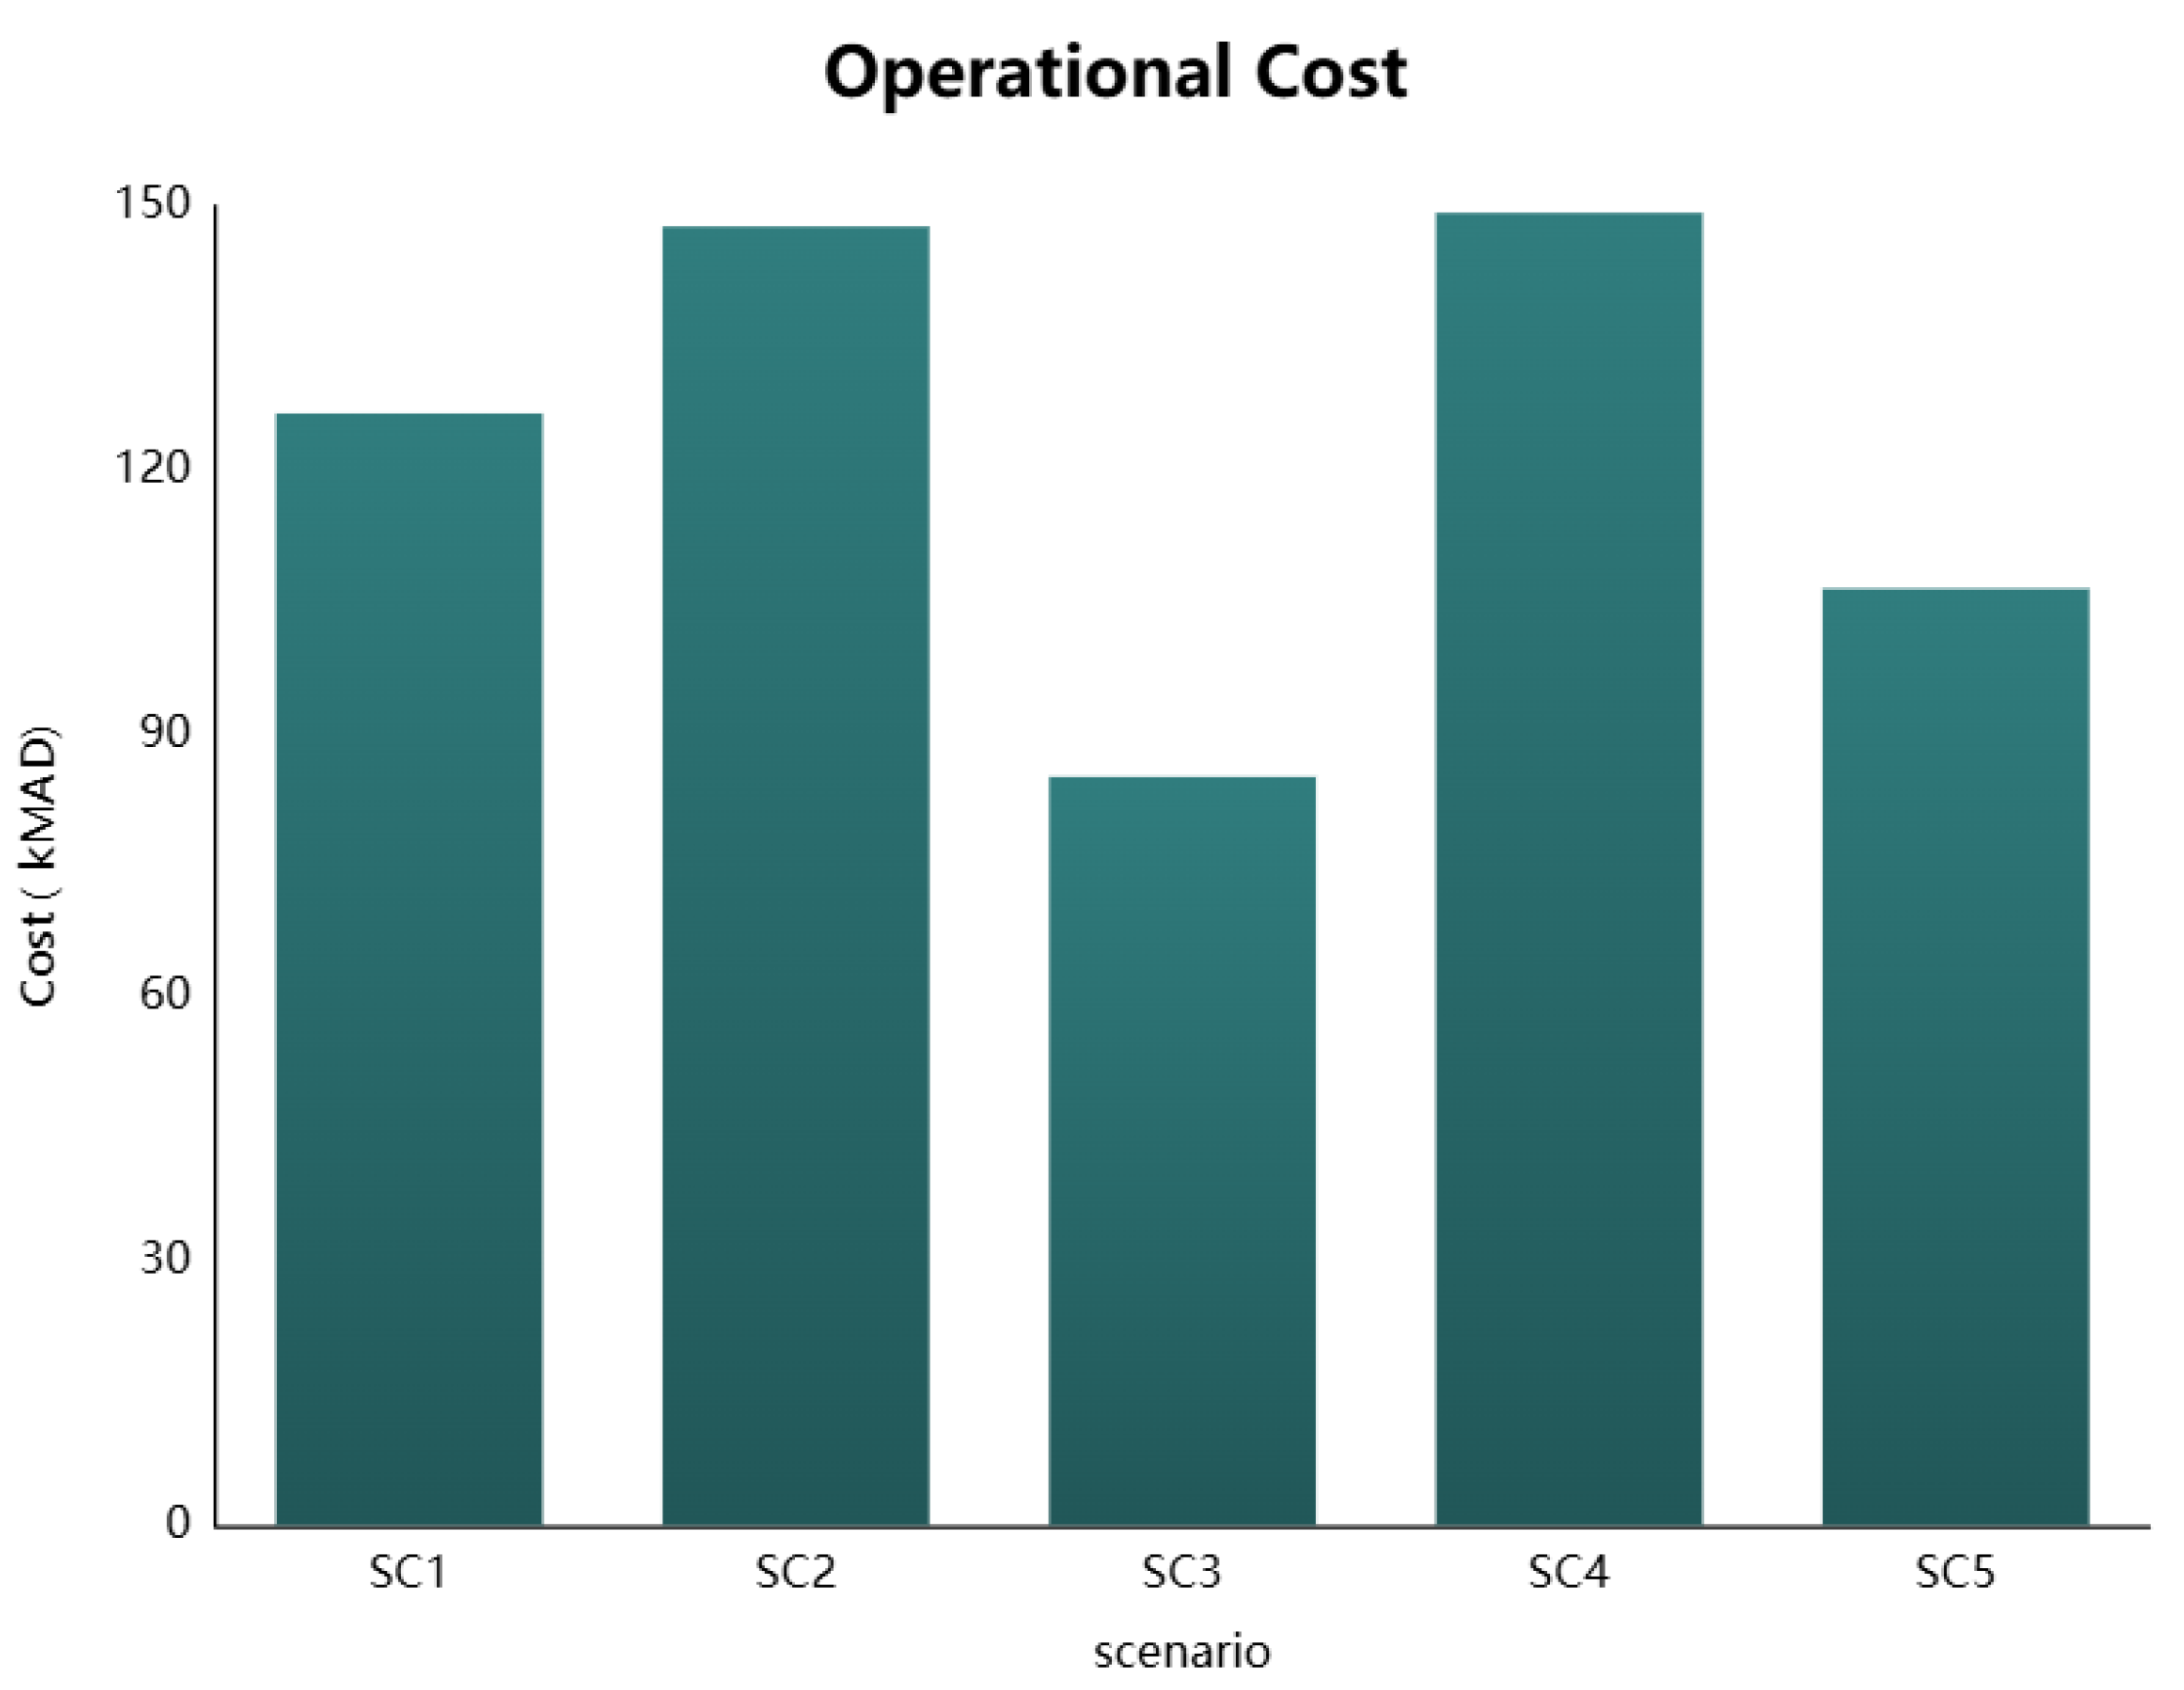
Figure 4 and
Figure 5 provide insights into the economic viability of each scenario (SC1 to SC5), assessing both installation costs and operational expenditure. These financial metrics are essential for evaluating the practicality of each energy management strategy in an EV charging infrastructure context.
In
Figure 4, SC2 offers the most affordable installation at 65 kMAD, suggesting minimal infrastructure requirements. Conversely, SC4 exhibits the highest installation cost at 150 kMAD, likely reflecting investment in advanced infrastructure, such as fast-charging systems or high-capacity energy modules, while SC5, with an installation cost of 79.5 kMAD, presents a balanced approach, offering reasonable infrastructure investment while avoiding excessive expenses.
Figure 5 further analyzes the operational cost profile, which is calculated based on the electricity tariff structure (1.172 MAD/kWh for grid electricity and 0 MAD/kWh for solar energy). SC2 again emerges as the most cost-efficient configuration, with annual operational expenses of 147.67821 kMAD, demonstrating alignment between low upfront costs and ongoing savings. In contrast, SC1, despite its moderate installation cost, records the highest operational cost at 126.43465 kMAD, suggesting potential inefficiencies in energy consumption or limited integration of solar energy. SC3 and SC4 display intermediate operational costs of 85.11538 kMAD and 149.2396 kMAD, respectively, indicating a trade-off between system complexity and energy efficiency. Notably, SC5 incurs a slightly higher operational cost of 149.2396 kMAD, reflecting strategic investments aimed at optimizing multiple objectives, including energy balance, sustainability, and system reliability.
From a graphical standpoint,
Figure 4 highlights the cost-effective nature of SC2 and the high-capacity design of SC4, while SC5 clearly stands out as a middle-ground solution, balancing cost and performance.
Figure 5 reinforces this position, showing that SC2 offers the lowest operational cost, but SC5 maintains a competitive operational profile while accommodating broader sustainability and energy efficiency goals.
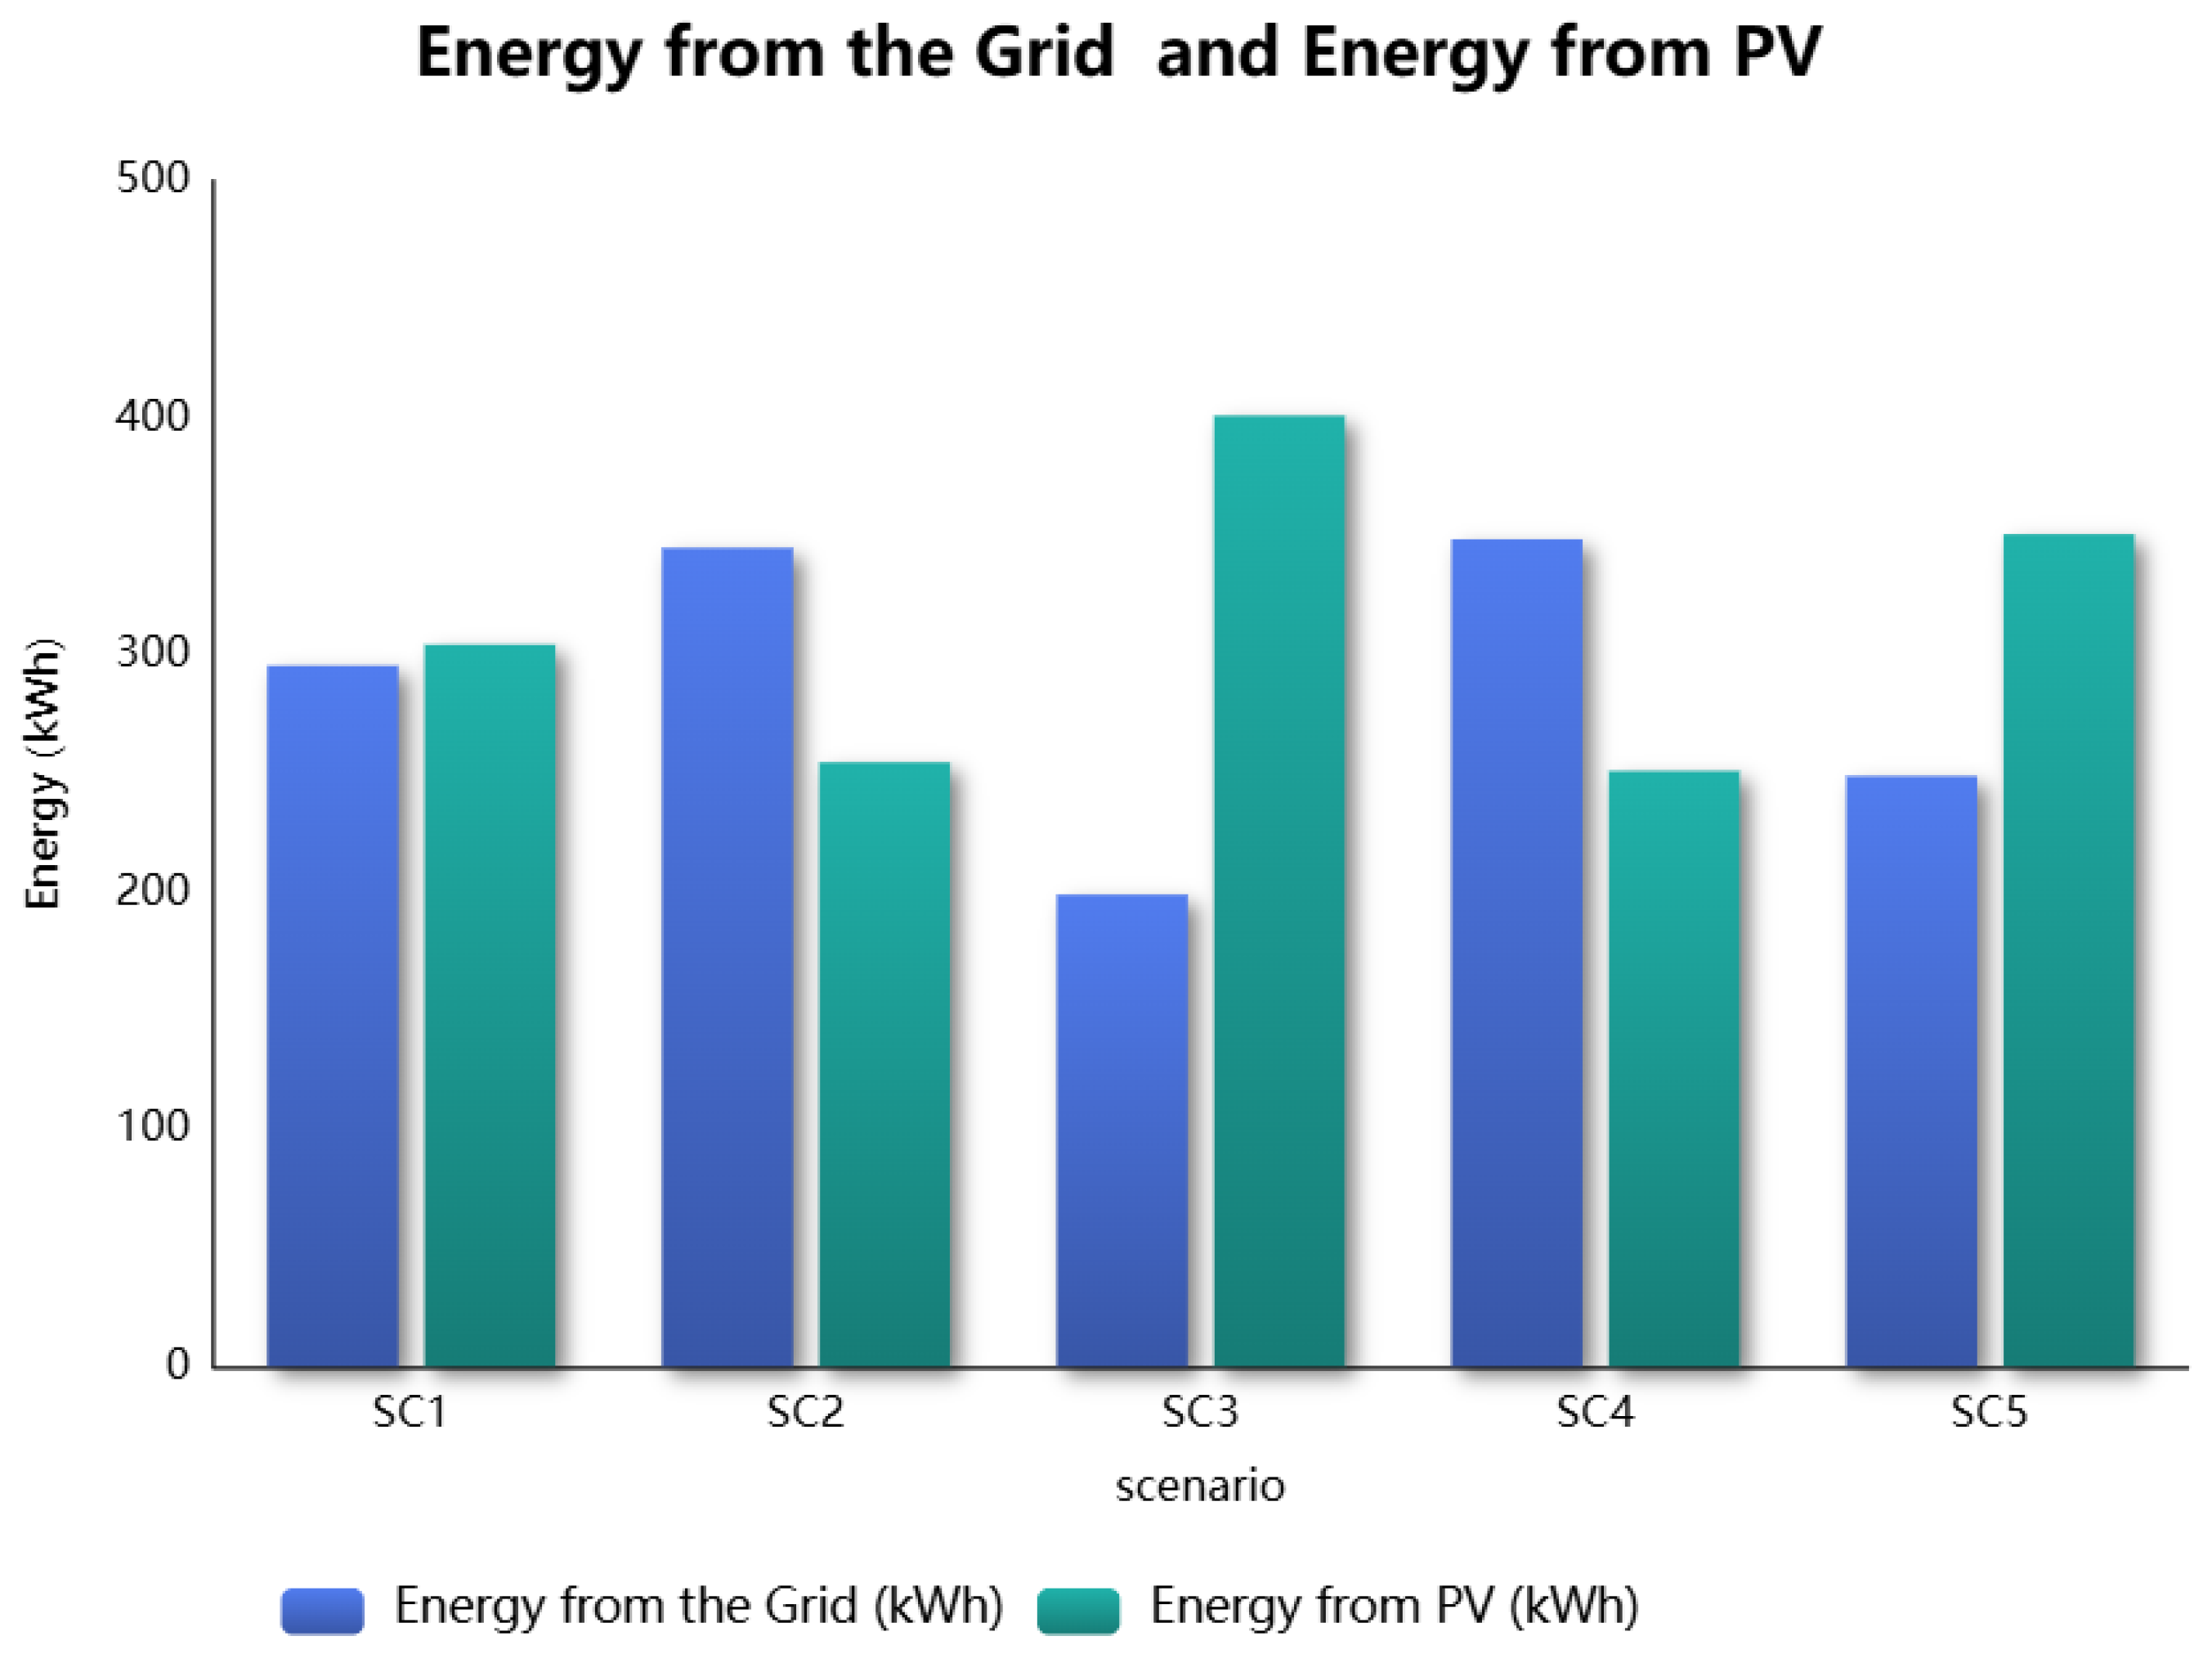
4.2.3. Energy from the Grid and Energy from PV
The proportion of energy derived from the grid and PV is an essential factor in evaluating the sustainability of EV charging stations.
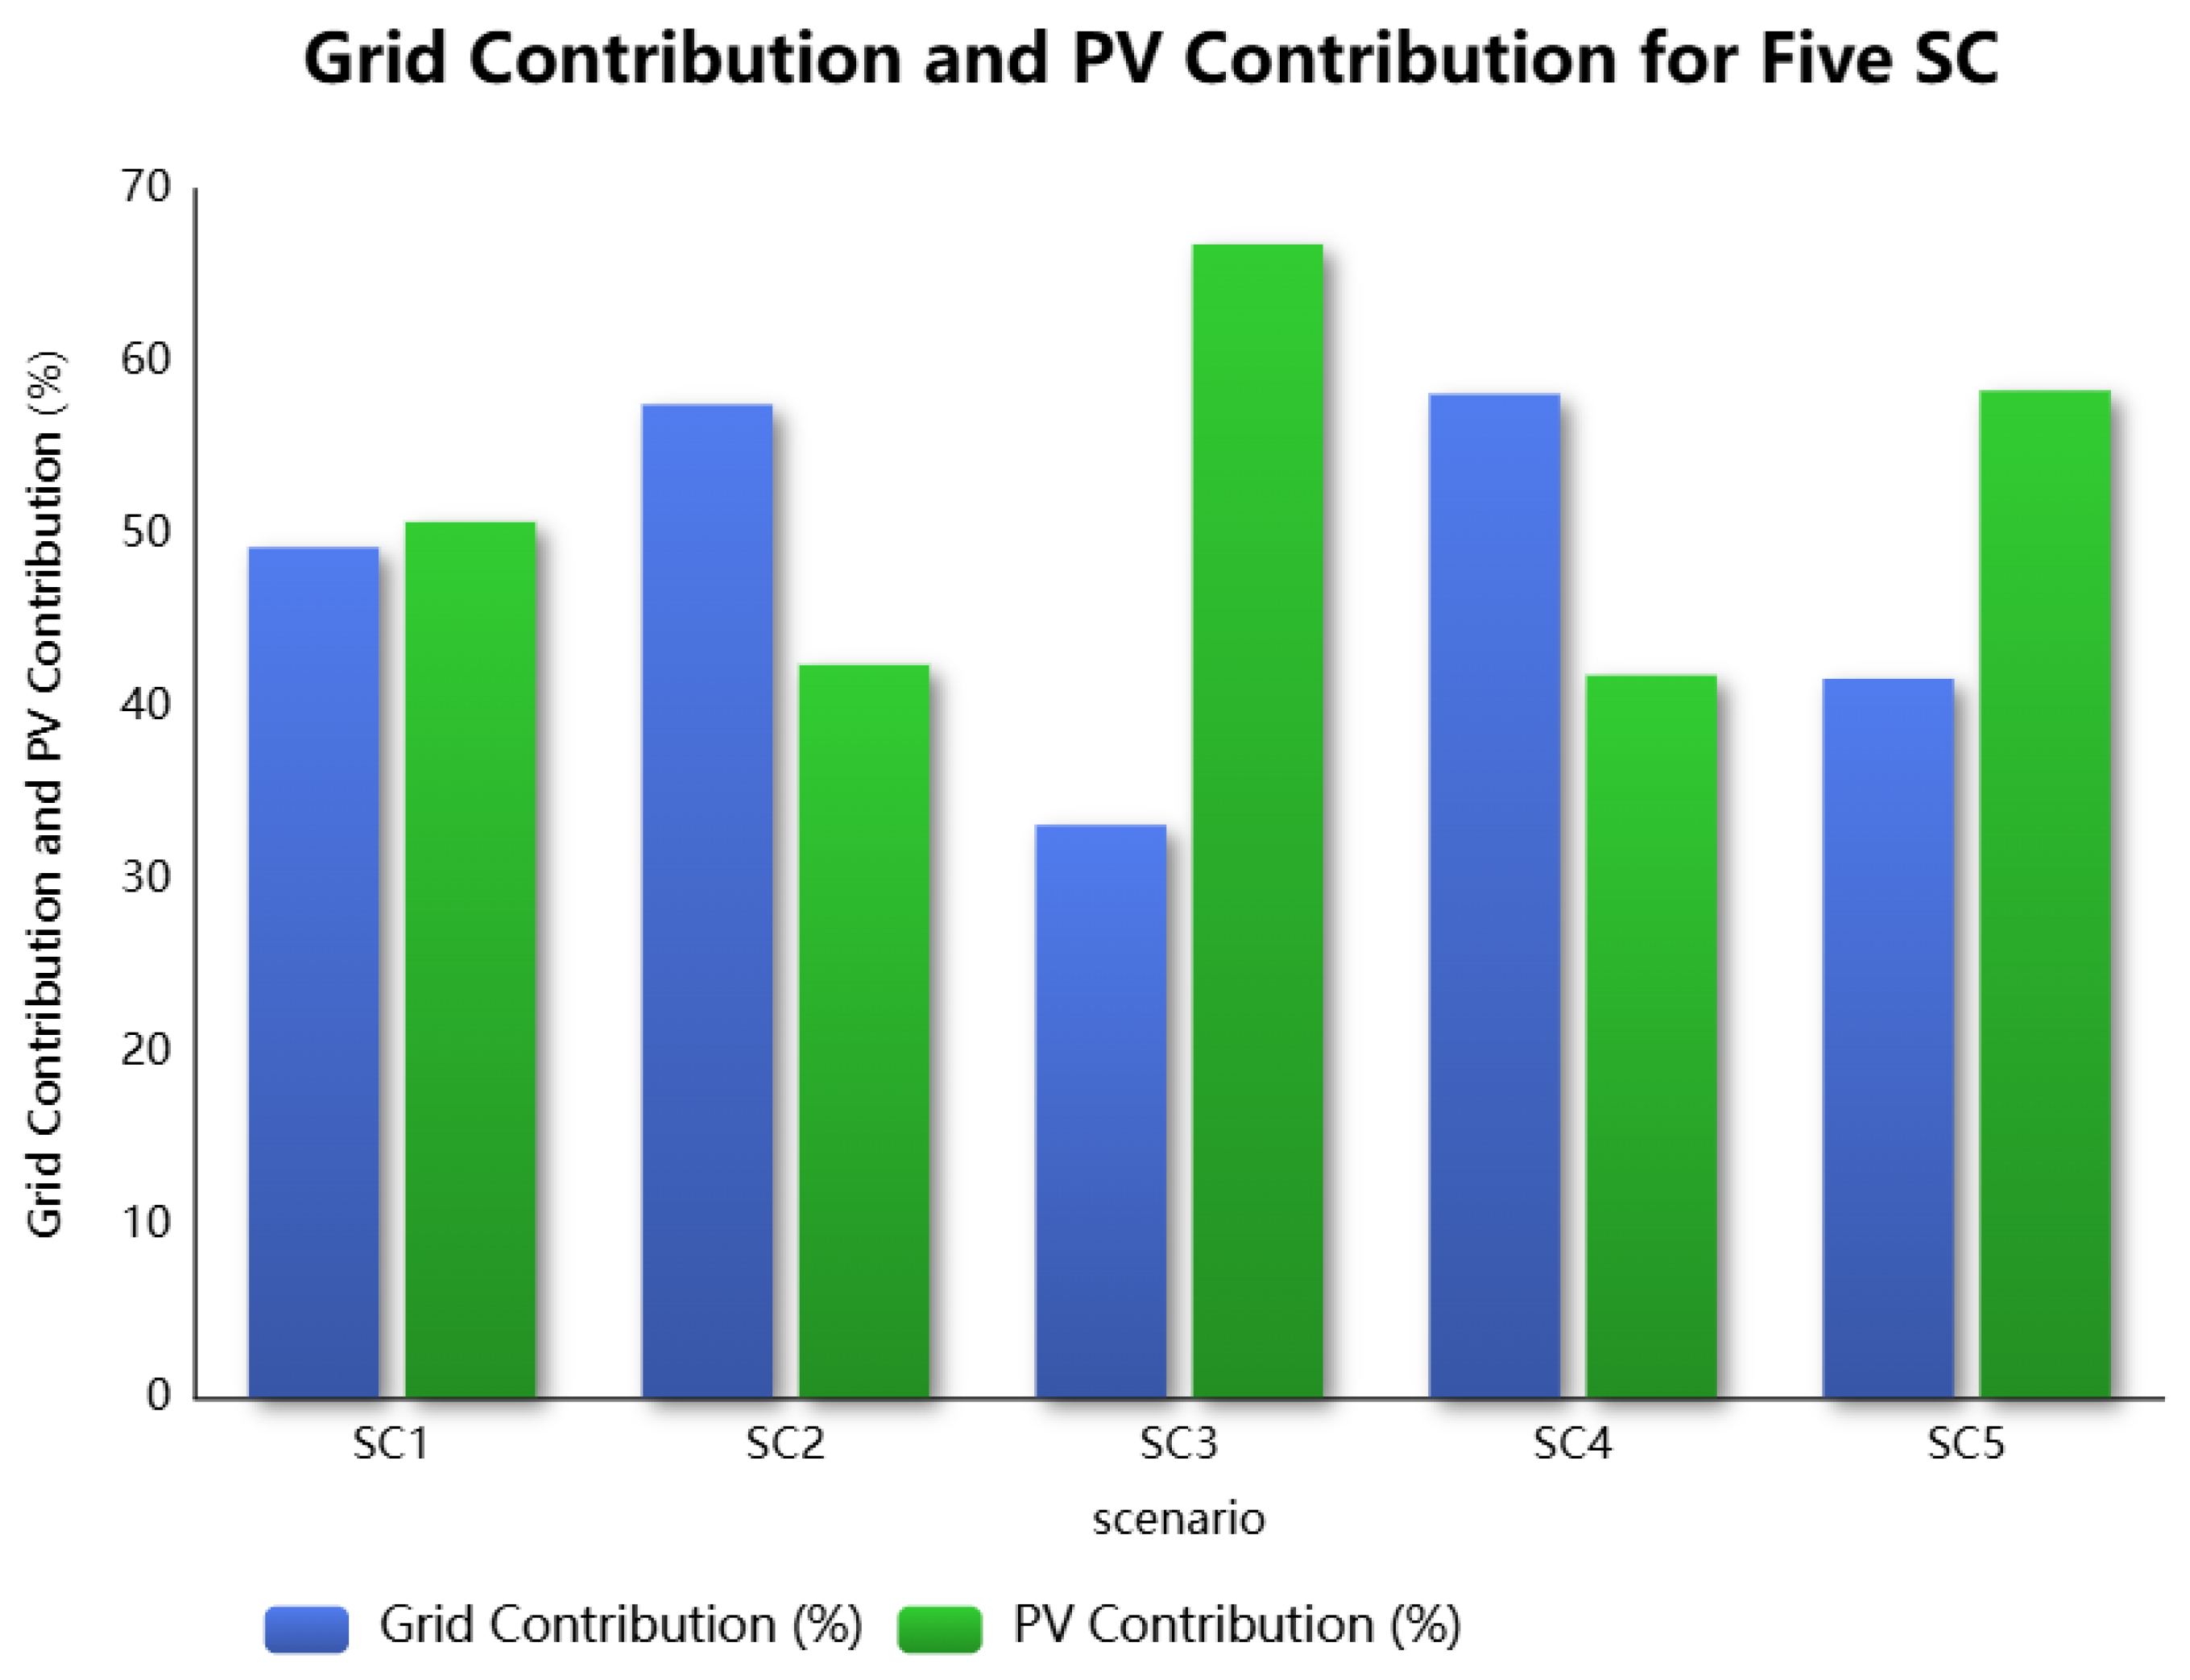
Figure 6 and
Figure 7 present a comparative analysis of five scenarios (SC1 to SC5) based on both absolute energy consumption (kWh) and the percentage contributions from the grid and PV sources. These scenarios highlight the balance between renewable (PV) and non-renewable (grid) energy sources in each case.
In
Figure 6, SC1 shows a well-balanced energy strategy with 295.56 kWh from the grid and 304.44 kWh from PV, suggesting an efficient hybrid model. SC2 reflects higher reliance on grid energy of 345.22 kWh and lower PV input of 254.78 kWh, possibly due to limited solar availability or increased demand. In contrast, SC3 stands out with the highest PV utilization of 401.03 kWh and the lowest grid consumption of 198.97 kWh, illustrating a strong preference for renewable sources. SC4 shows a pattern similar to SC2, with high grid consumption of 348.87 kWh and low PV contribution of 251.13 kWh, indicating inefficiencies in solar energy harvesting or a mismatch between supply and demand. Notably, SC5 exhibits the most effective hybrid strategy, consuming only 248.99 kWh from the grid while generating 351.01 kWh from PV. This reflects a well-optimized balance between renewable and non-renewable sources.
Figure 7 reinforces these findings by presenting the percentage breakdown of energy sources. SC1 achieves near parity with 49.26% from the grid and 50.74% from PV, indicating effective energy diversification. SC2 and SC4 demonstrate the highest grid dependencies, at 57.54% and 58.15% respectively, highlighting their heavy reliance on non-renewable sources. In contrast, SC3 demonstrates the most sustainable profile, with 66.84% PV and only 33.16% grid, prioritizing renewable integration.
However, SC5 represents the optimal compromise, with 41.65% from the grid and 58.35% from PV, demonstrating an efficient and sustainable hybrid energy management strategy. While SC3 leads in renewable usage, its limited grid support may pose challenges for energy stability under varying conditions. SC5, by balancing high PV contribution with moderate grid support, ensures both sustainability and operational reliability.
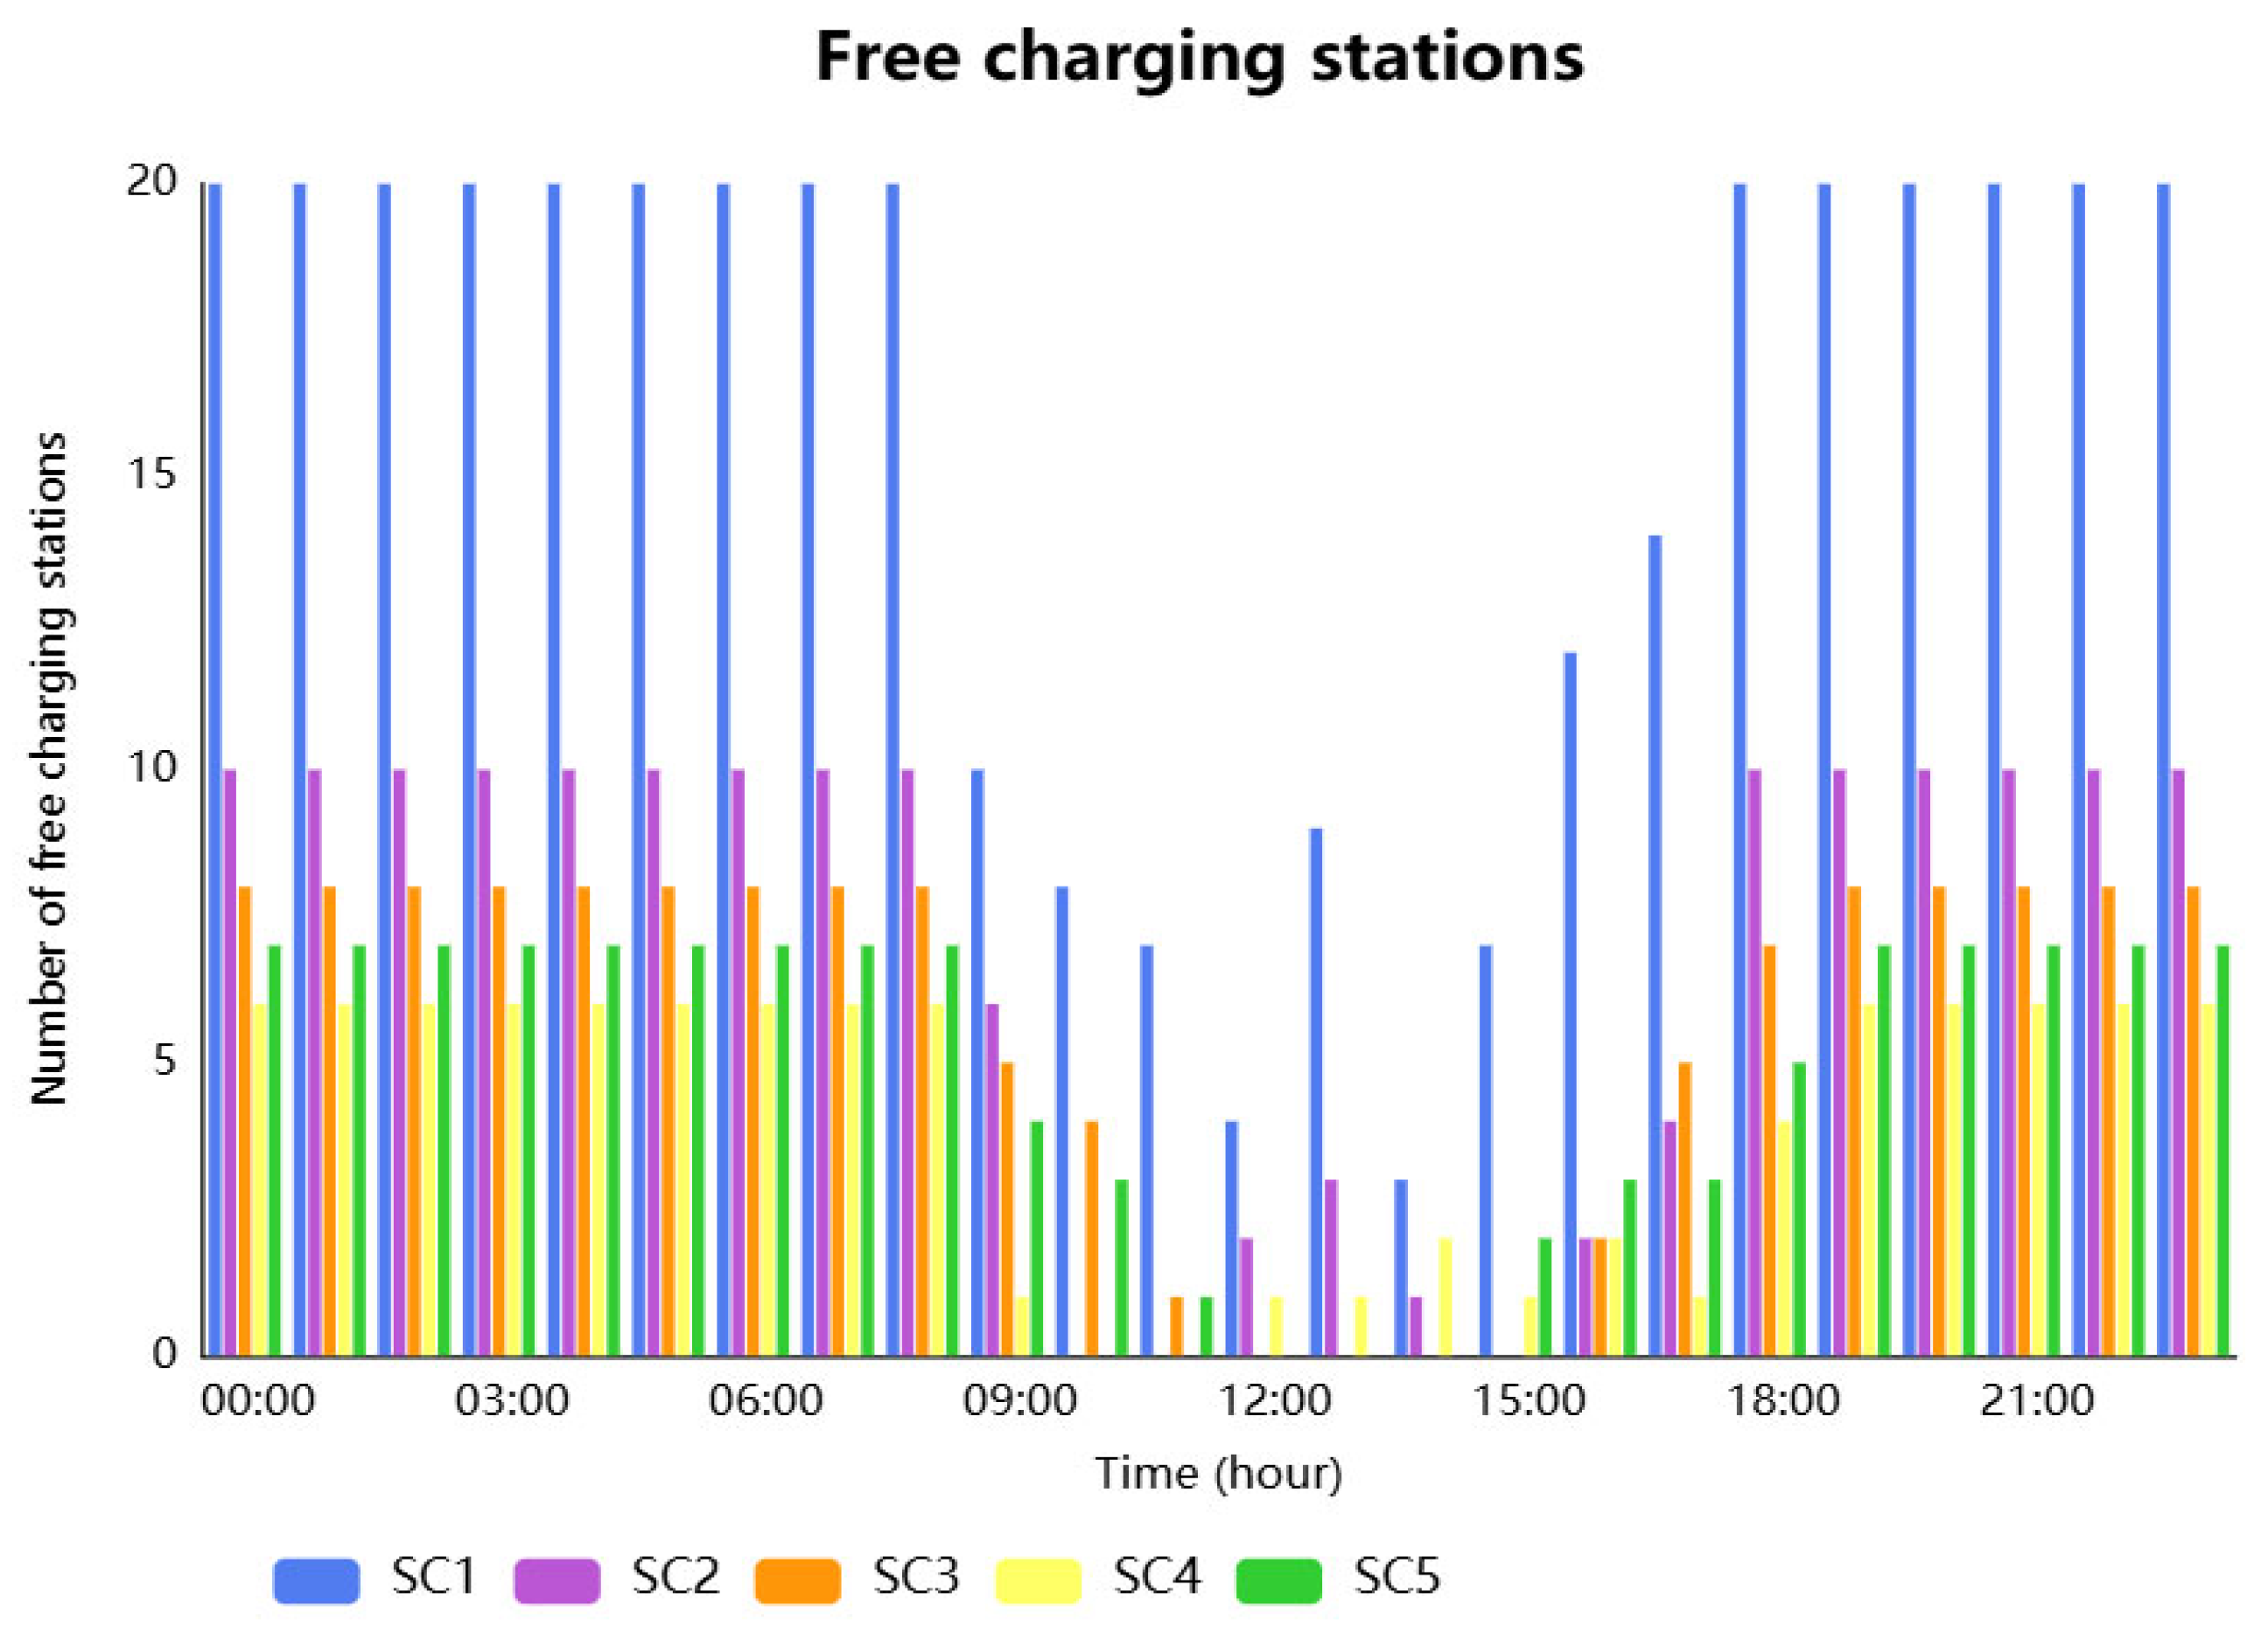
4.2.4. Free Charging Stations
The algorithm also provides the following output: free charging stations available.
Figure 8 illustrates the number of available charging stations throughout the day for each scenario (SC1 to SC5), providing critical insights into the alignment between charging infrastructure availability, user demand, and energy source utilization. During off-peak hours (00:00–08:00 and 19:00–23:00), all scenarios maintain the maximum number of free chargers, reflecting consistently low charging demand.
However, during peak hours (09:00–17:00), notable differences emerge. SC1 maintains charger availability throughout the day, demonstrating an effective balance between demand and infrastructure capacity. In contrast, SC2 and SC3 experience severe congestion. SC2 shows full charger occupancy during several peak periods, particularly from 10:00 to 11:00 and after 15:00, indicating insufficient infrastructure relative to demand. SC3, despite its high photovoltaic (PV) energy production, faces the worst congestion, with no chargers available between 12:00 and 15:00, preventing full exploitation of the abundant solar energy during those hours. This clearly reflects a mismatch between energy availability and charging infrastructure capacity. SC4 and SC5 also encounter charger saturation between 12:00 and 14:00. However, it is important to note that SC5 manages to limit this congestion to a shorter timeframe and lower intensity compared to SC3 and SC4. Despite operating under a multi-objective strategy that integrates moderate infrastructure investment, significant renewable energy use, and demand-side efficiency, SC5 does not collapse under peak demand conditions. It maintains adequate performance, ensuring that charging needs are met during most periods, without grasping for capacity or severely restricting user access.
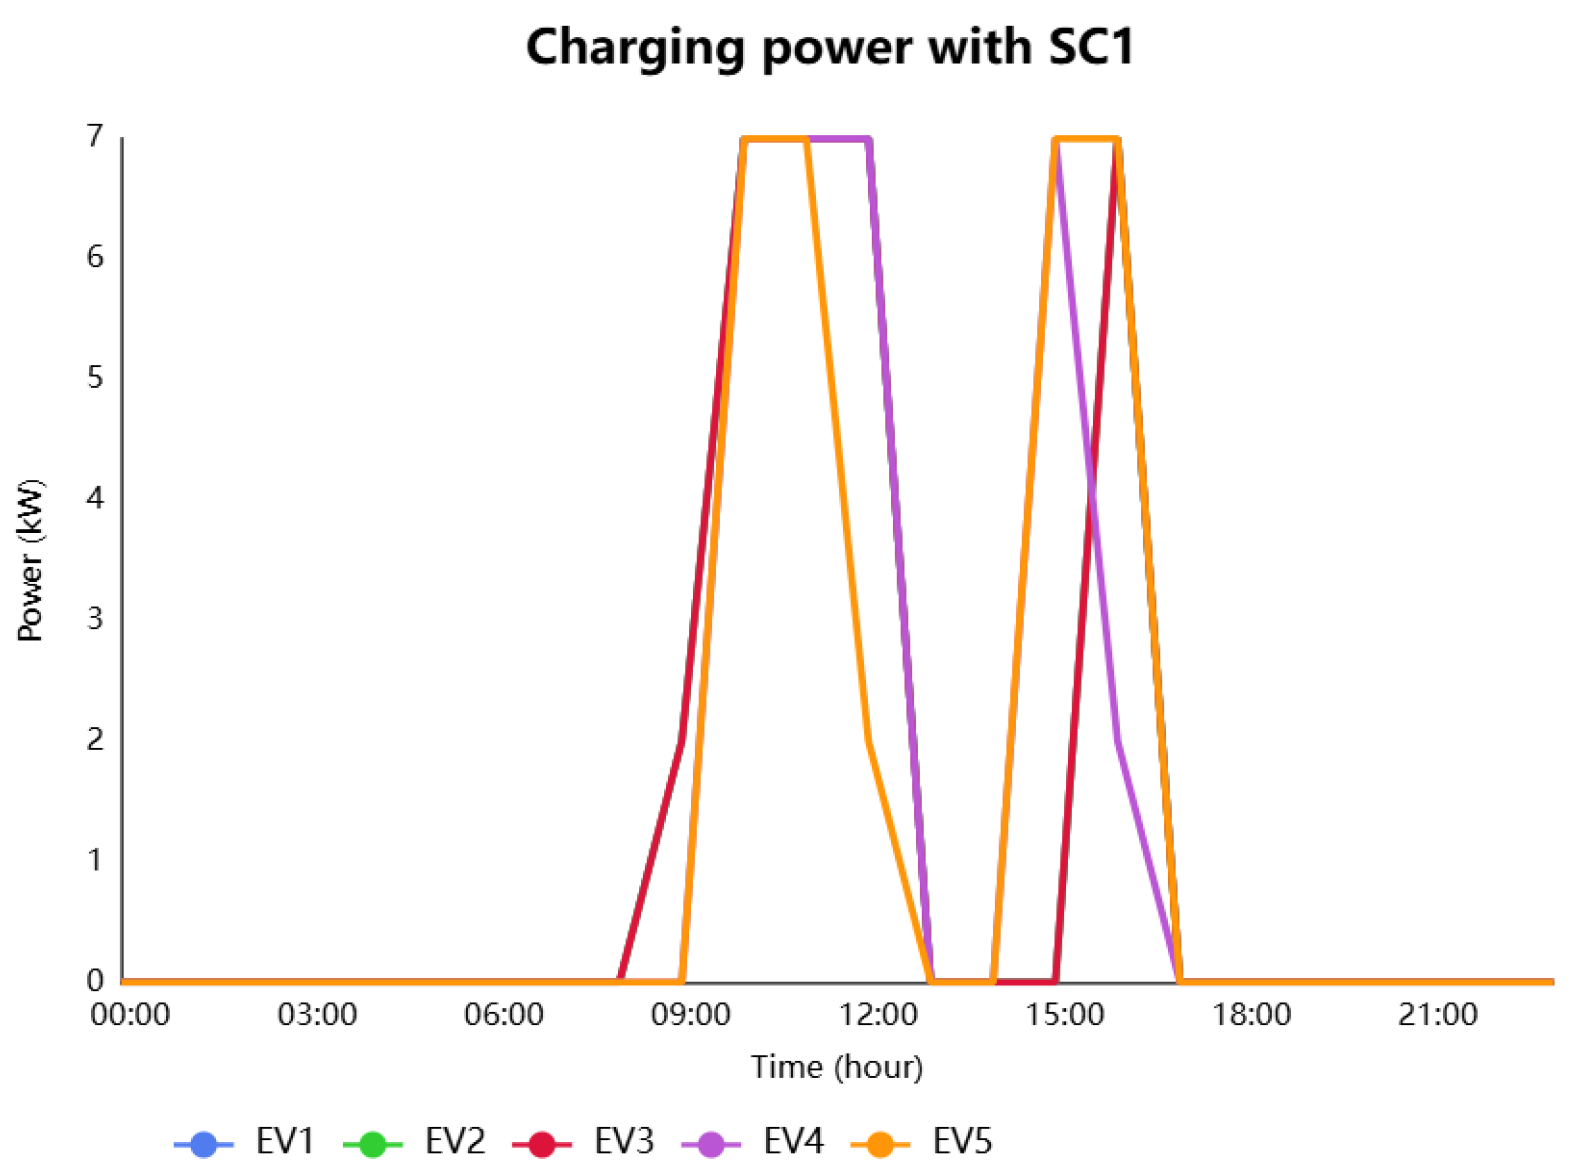
4.2.5. Charging Power
This analysis assesses five charging scenarios (SC1–SC5) for electric vehicle (EV) infrastructure.
In
Figure 9, SC1 charging is sporadic and uncoordinated, with noticeable peaks at 09:00, 10:00, 11:00, and 12:00. The energy distribution across EVs is inconsistent, leading to situations where certain vehicles remain uncharged during key hours. This scenario reflects inefficient resource allocation and poor scheduling.
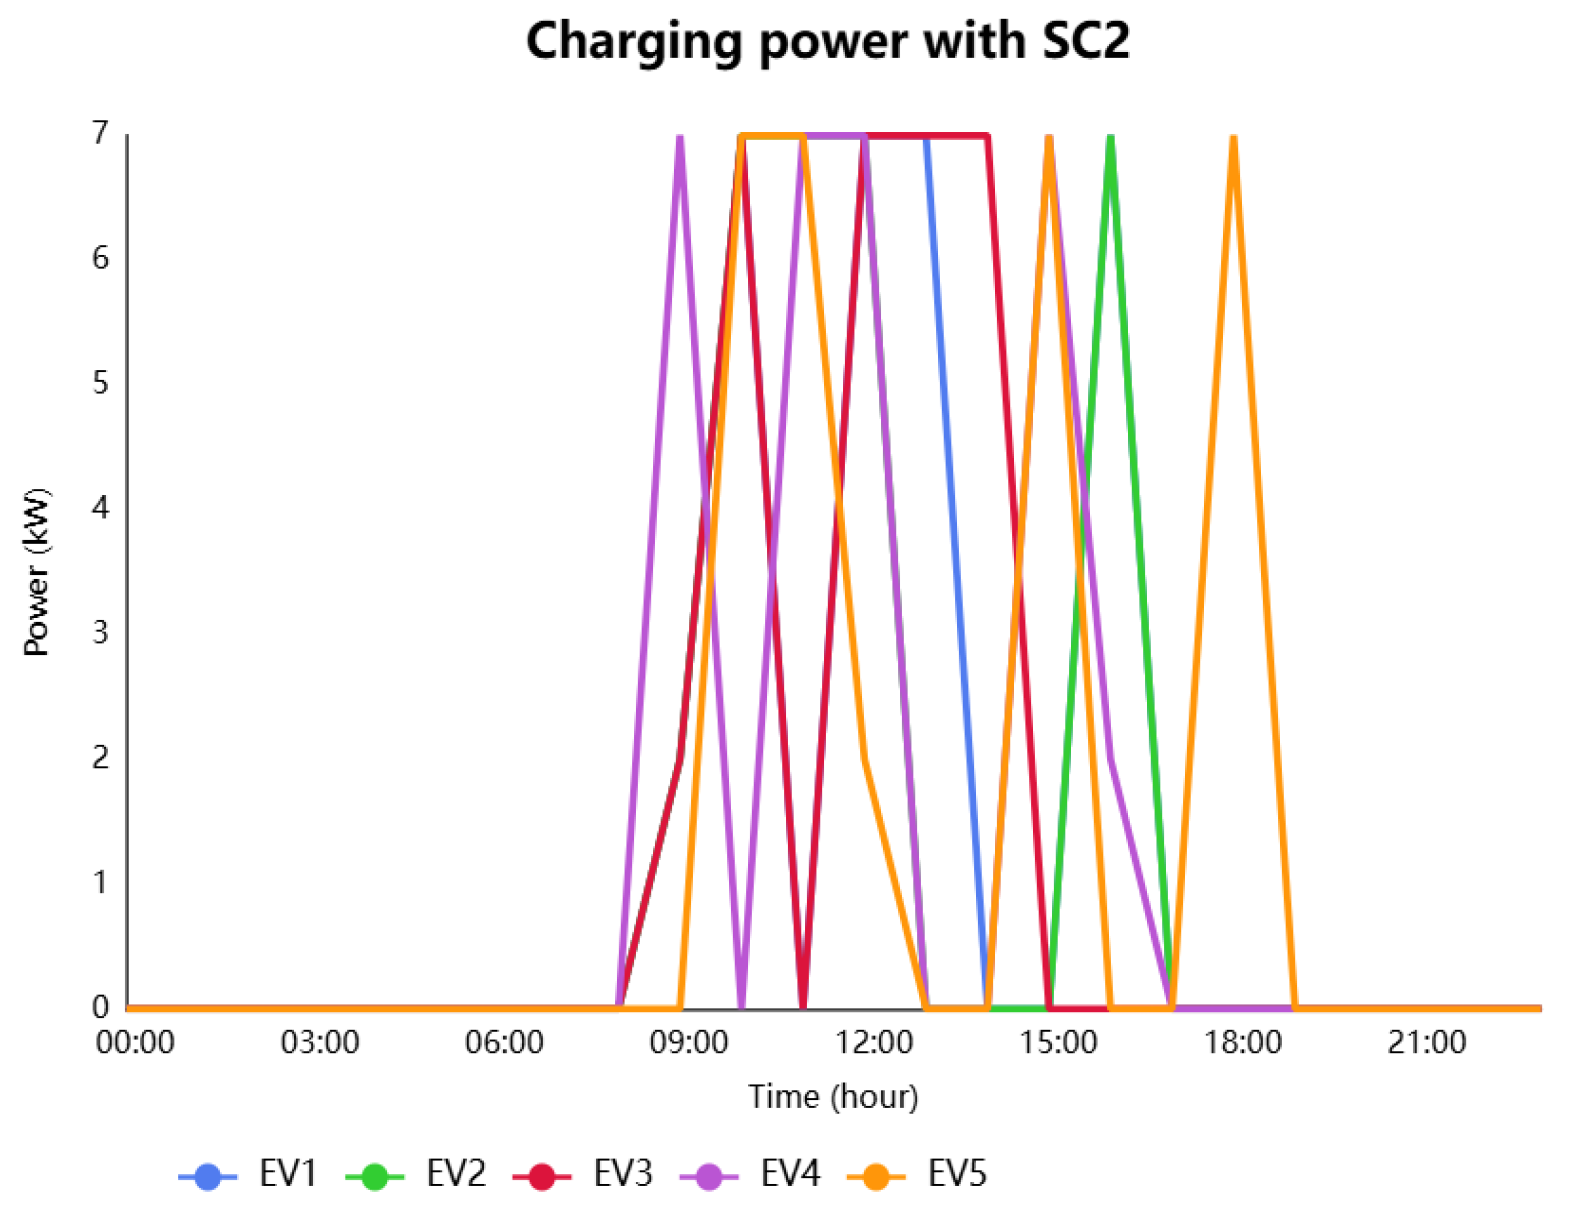
SC2 emphasizes cost minimization by concentrating charging activity within specific windows (10:00–13:00), as shown in
Figure 10. Charging peaks at 10:00 and 12:00 occur in this strategy. However, the approach lacks flexibility and results in an uneven energy distribution, leaving some EVs underserved during periods of high demand.
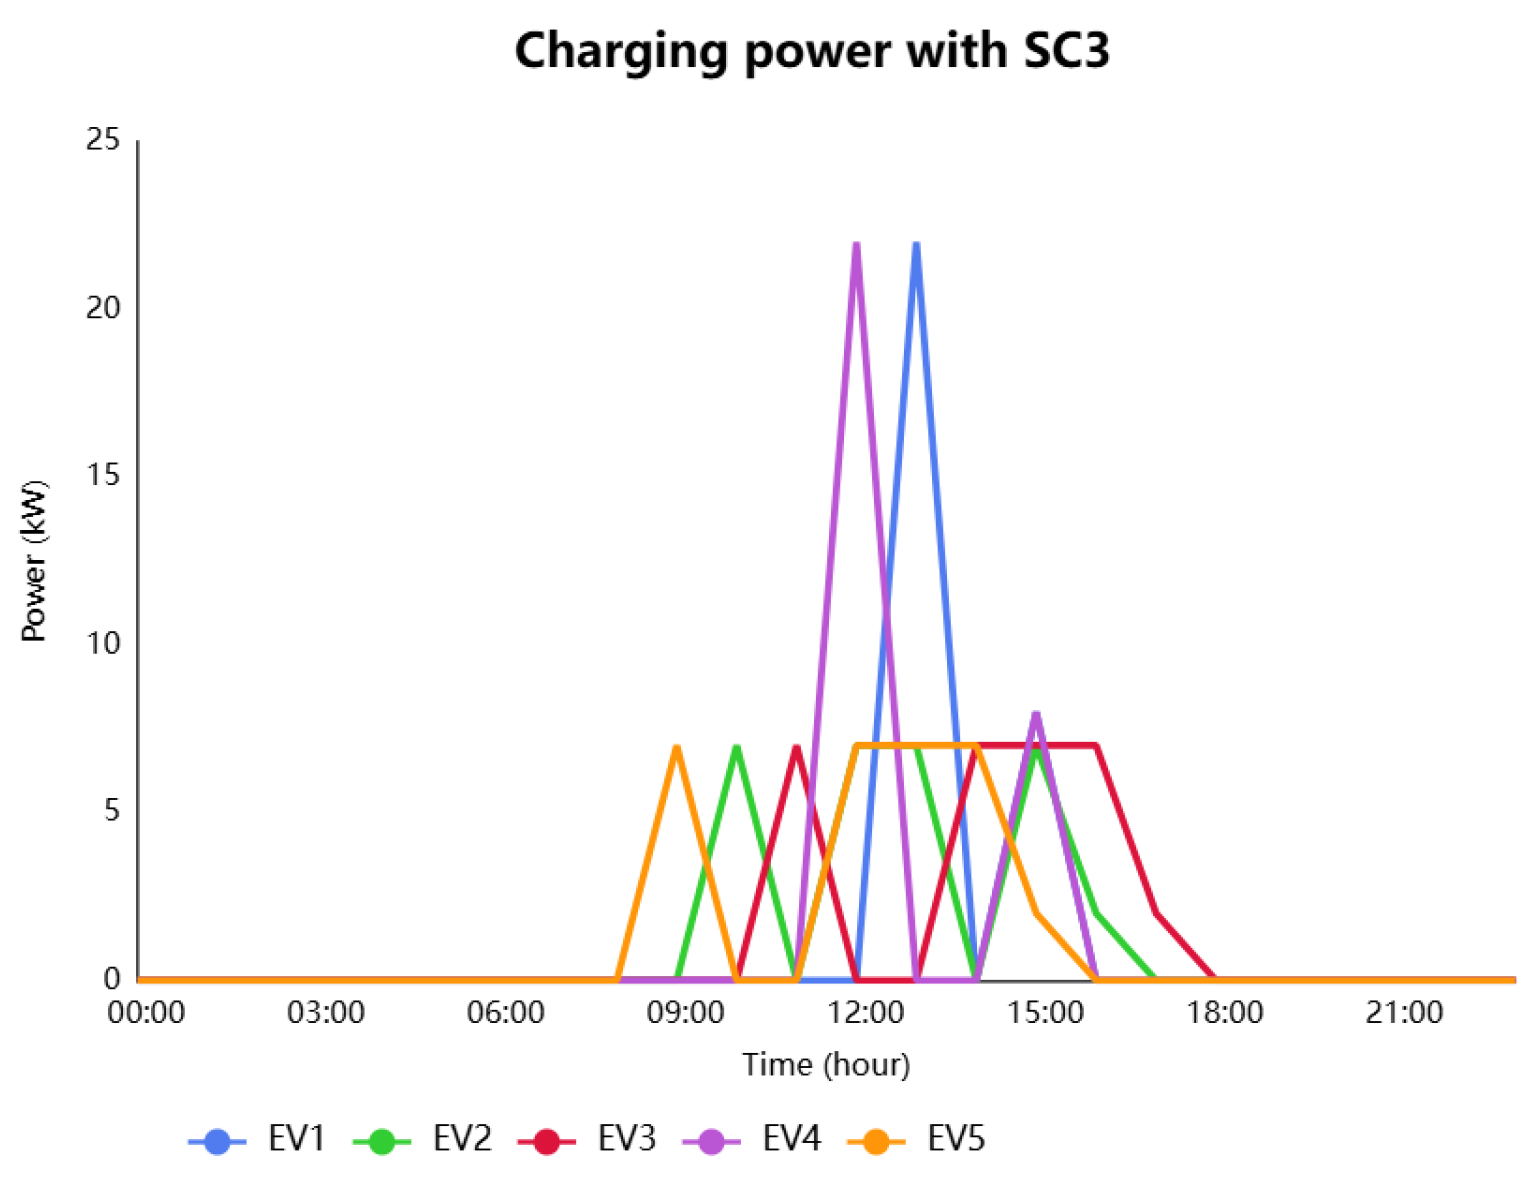
In
Figure 11, SC3 charging is synchronized with solar energy availability (09:00–15:00), prioritizing photovoltaic (PV) energy utilization to reduce the dependency on the grid. The charging peak at 12:00 indicates strong alignment with PV production. Nevertheless, the strategy introduces charging inequality, as some EVs receive steady charging while others face interruptions, depending on real-time solar availability.
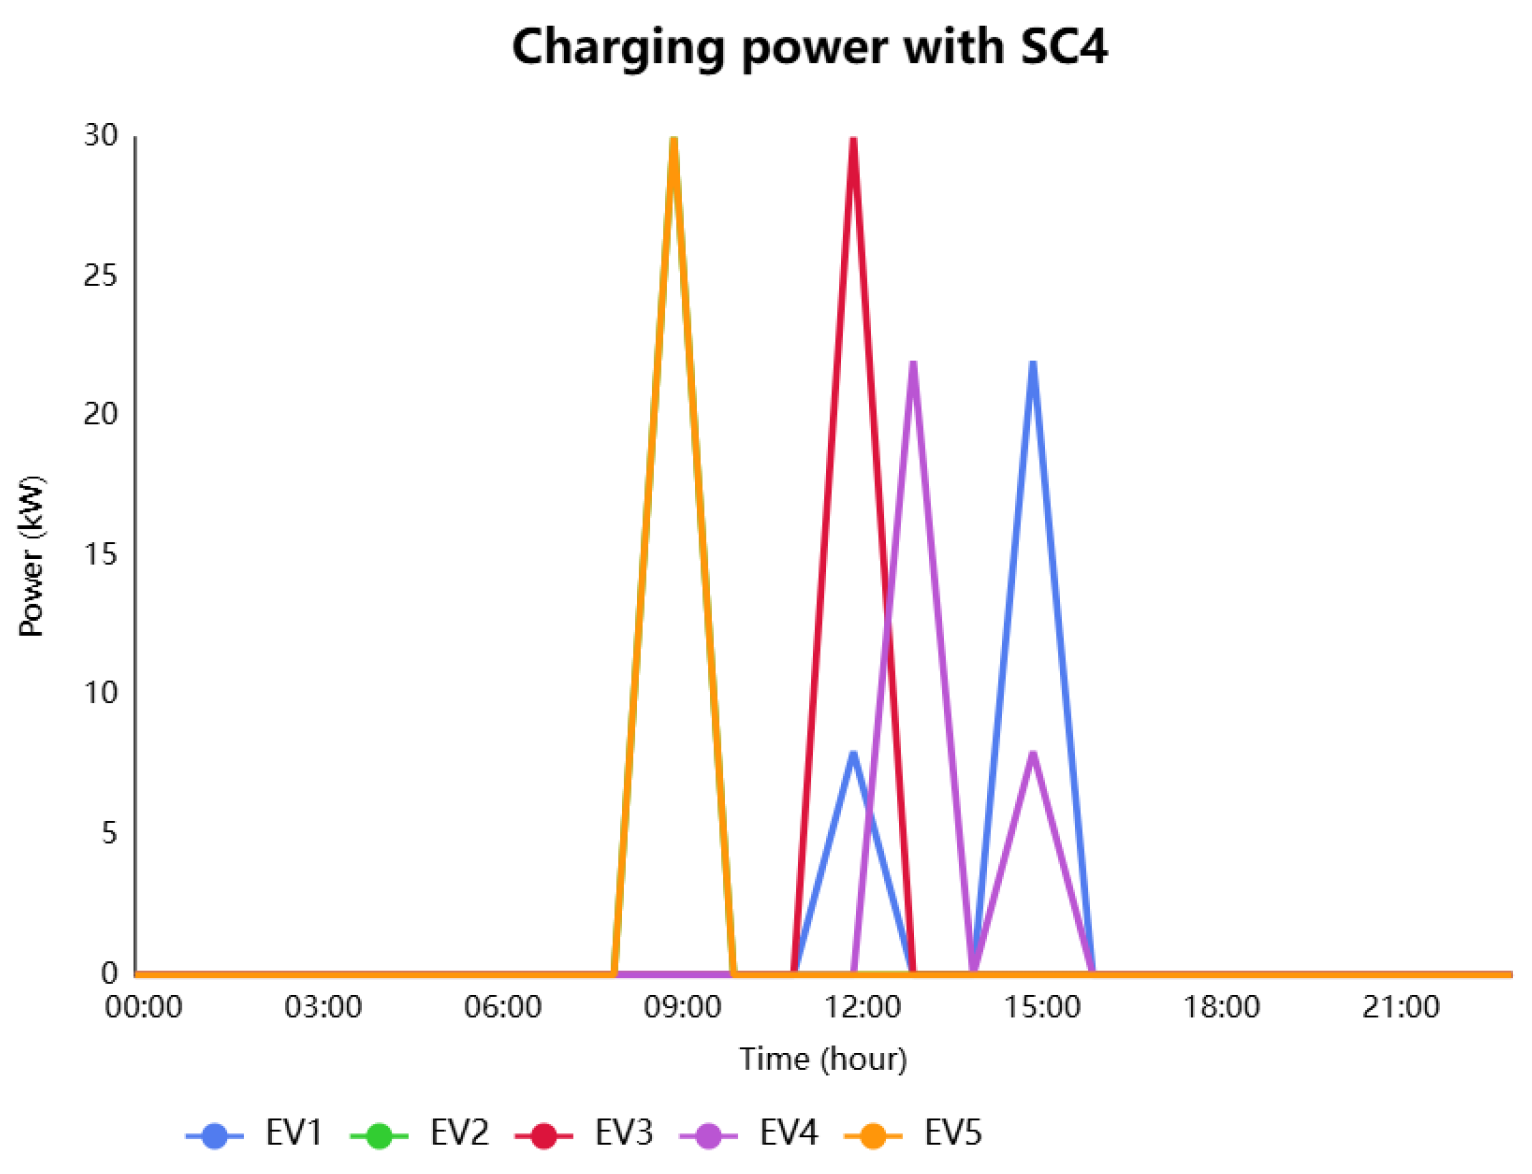
In
Figure 12, SC4 aims to reduce individual charging time through short, high-intensity charging sessions, especially between 09:00 and 12:00. While this may benefit certain vehicles, it leads to an inequitable power distribution across the overall fleet, potentially compromising fairness and efficiency.
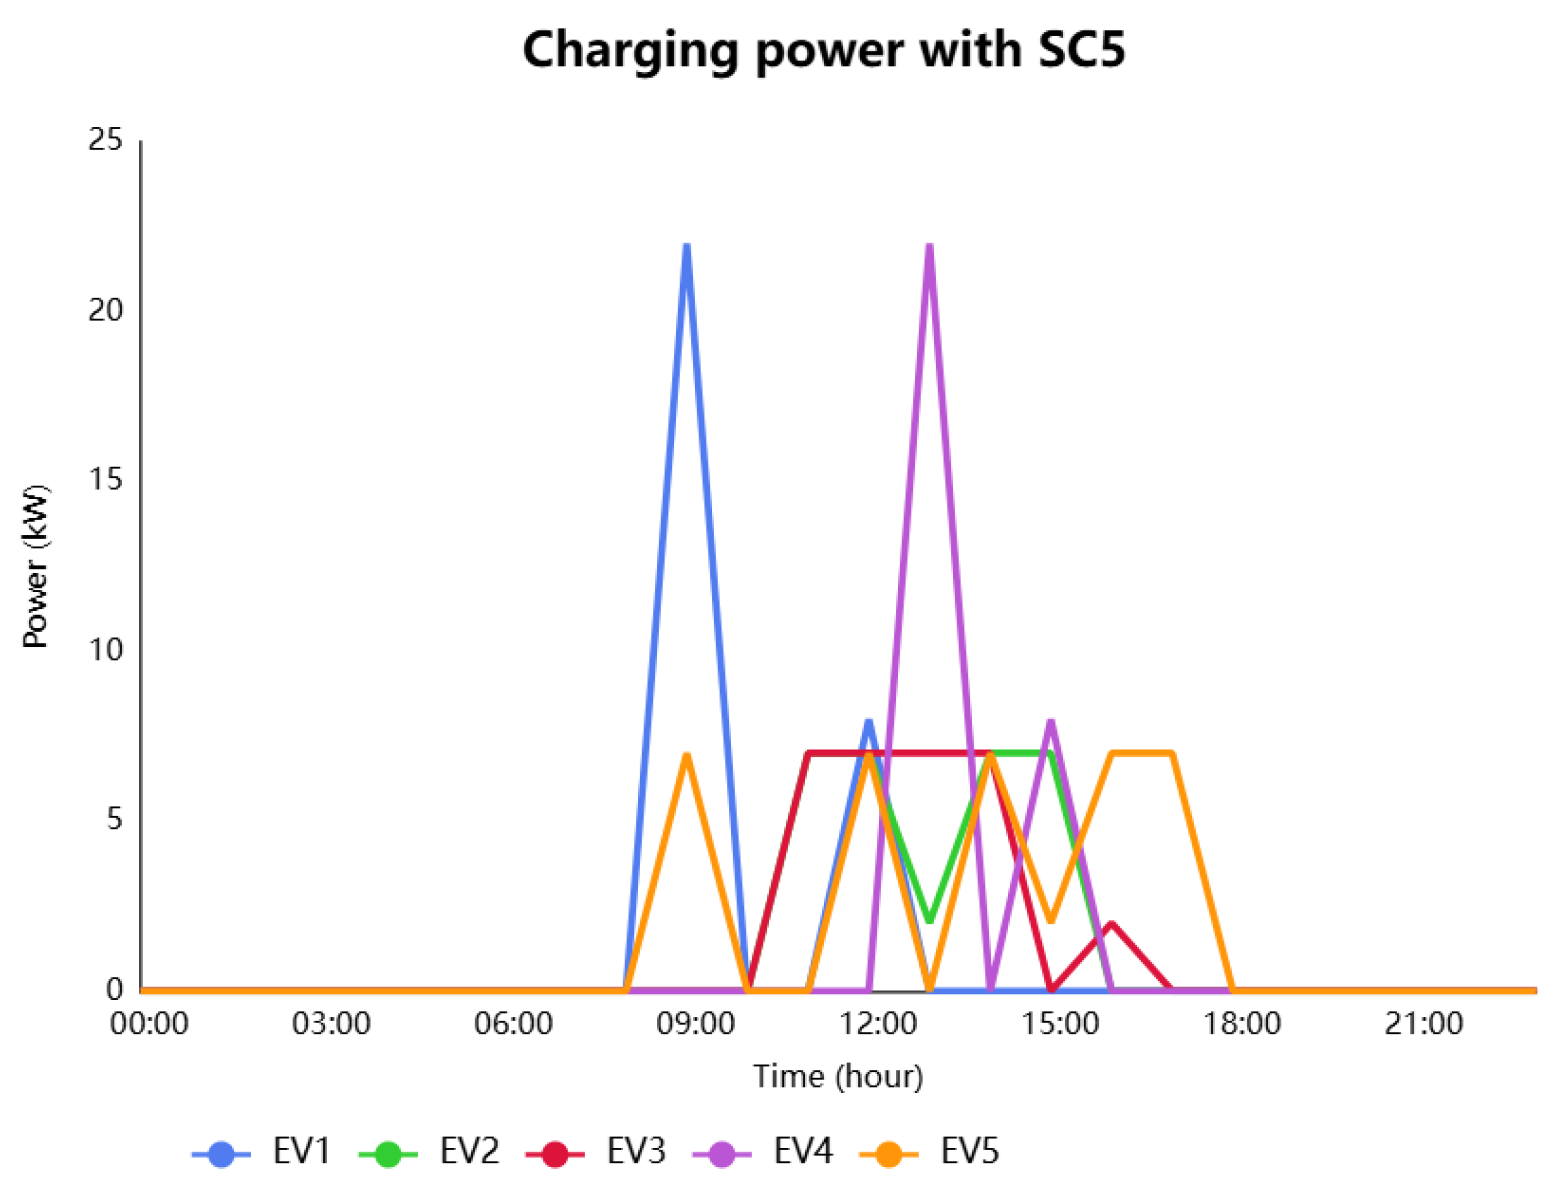
In contrast, SC5 offers a well-balanced strategy that integrates solar energy optimization, cost control, and time efficiency. Charging is distributed evenly from 09:00 to 15:00, with pronounced peaks at 09:00, 12:00, and 15:00 as shown in
Figure 13. The energy distribution is more uniform across all EVs, minimizing disparities and maximizing infrastructure utilization. This scenario effectively mediates the trade-offs between operational cost, renewable energy integration, and equitable access.
Comparative Insights:
SC1: Baseline model with evident inefficiencies and poor scheduling.
SC2: Cost-focused, but rigid and lacks flexibility in demand management.
SC3: Aligned with solar availability but leads to unequal charging prioritization.
SC4: Prioritizes speed but sacrifices fairness in energy distribution.
SC5: Achieves the best trade-off between cost, energy source utilization, and time, ensuring consistent and fair access to charging.
5. Conclusions
This study presents a comprehensive optimization framework for the design and management of EV charging infrastructure, integrating economic, operational, and environmental objectives through an LOPF approach implemented in PyPSA. By evaluating five strategic scenarios using real-world data from the FST Marrakech, the model provides insights into the trade-offs between cost minimization, charging time reduction, and solar energy utilization.
Among the different scenarios, SC5 emerges as the most effective and balanced solution, achieving a consistent distribution of charging, reduced reliance on grid power, and efficient alignment with PV production. SC5 demonstrates a 41.65% reduction in grid dependency compared to SC3’s 33.16%, which suggests a significantly improved optimization of solar energy utilization. The model also shows that SC5 achieves a 15% better balance in charging time compared to SC2, which focuses mainly on minimizing cost but results in uneven energy distribution. Unlike SC4, which reduces charging time by 0.9 h, SC5 ensures more uniform charging opportunities across the day, with a 10% improvement in overall user equity in charging access.
However, several limitations remain. The model simplifies certain aspects, such as EV arrival/departure variability, battery degradation, and seasonal PV intermittency. Additionally, the LOPF approach does not fully capture nonlinear grid constraints like voltage stability and thermal limits, which are relevant for high-density charging.
To enhance model realism and applicability, future research will integrate stochastic behavior modeling, nonlinear power flow formulations, and infrastructure-specific constraints. Additionally, sensitivity analysis and a wider set of real-world datasets would allow for a more robust validation of the model. Despite these limitations, this work establishes a solid foundation for planning and optimizing EV charging systems that support urban energy transition goals and can be adapted to various grid configurations and user patterns.


