
Design and Analysis of a Solar-Powered Electric Vehicle Charging Station for Indian Cities

 ,
,  and
and 
Abstract
:1. Introduction
- To size an efficient, resilient, and sustainable off-grid solar PV system suitable for EV charging stations in India.
- To analyze & compare its yearly and seasonal performance for six Indian cities. The operational parameters include the number of cars charged, the monthly variation in energy generation, PR, the decrease in CO2 emissions, and the investment cost per km.
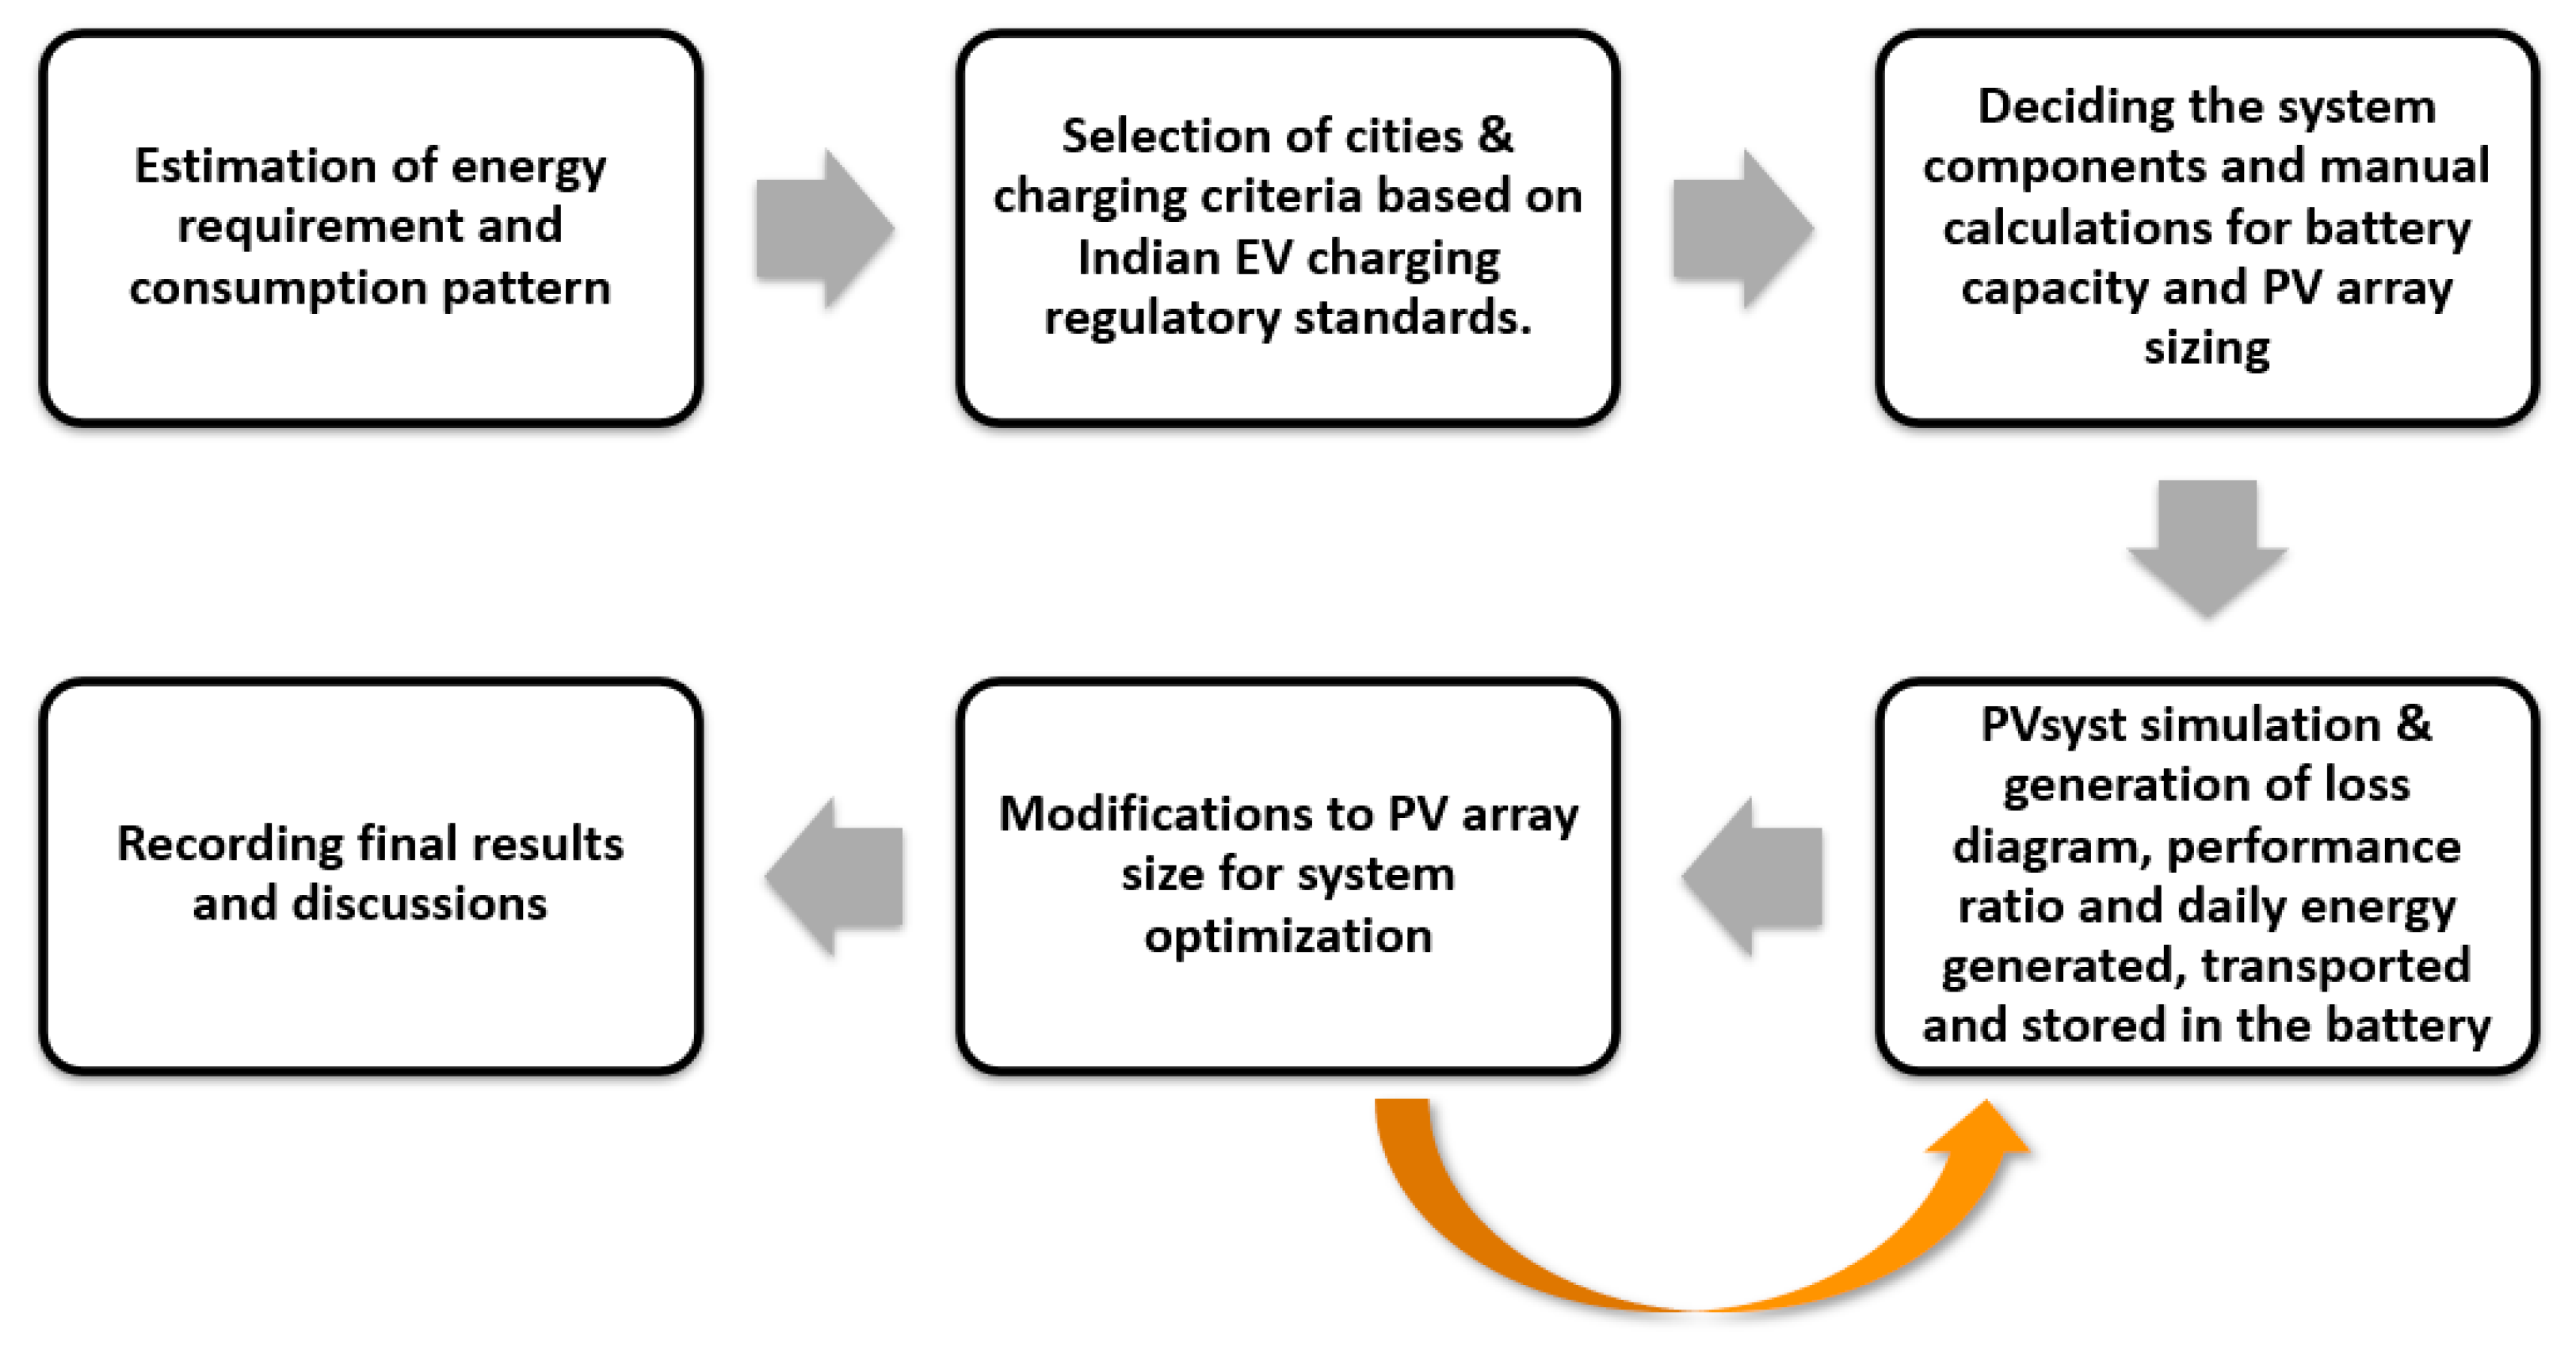
2. Method
2.1. Standards
2.2. Selection of Cities and Climate Analysis
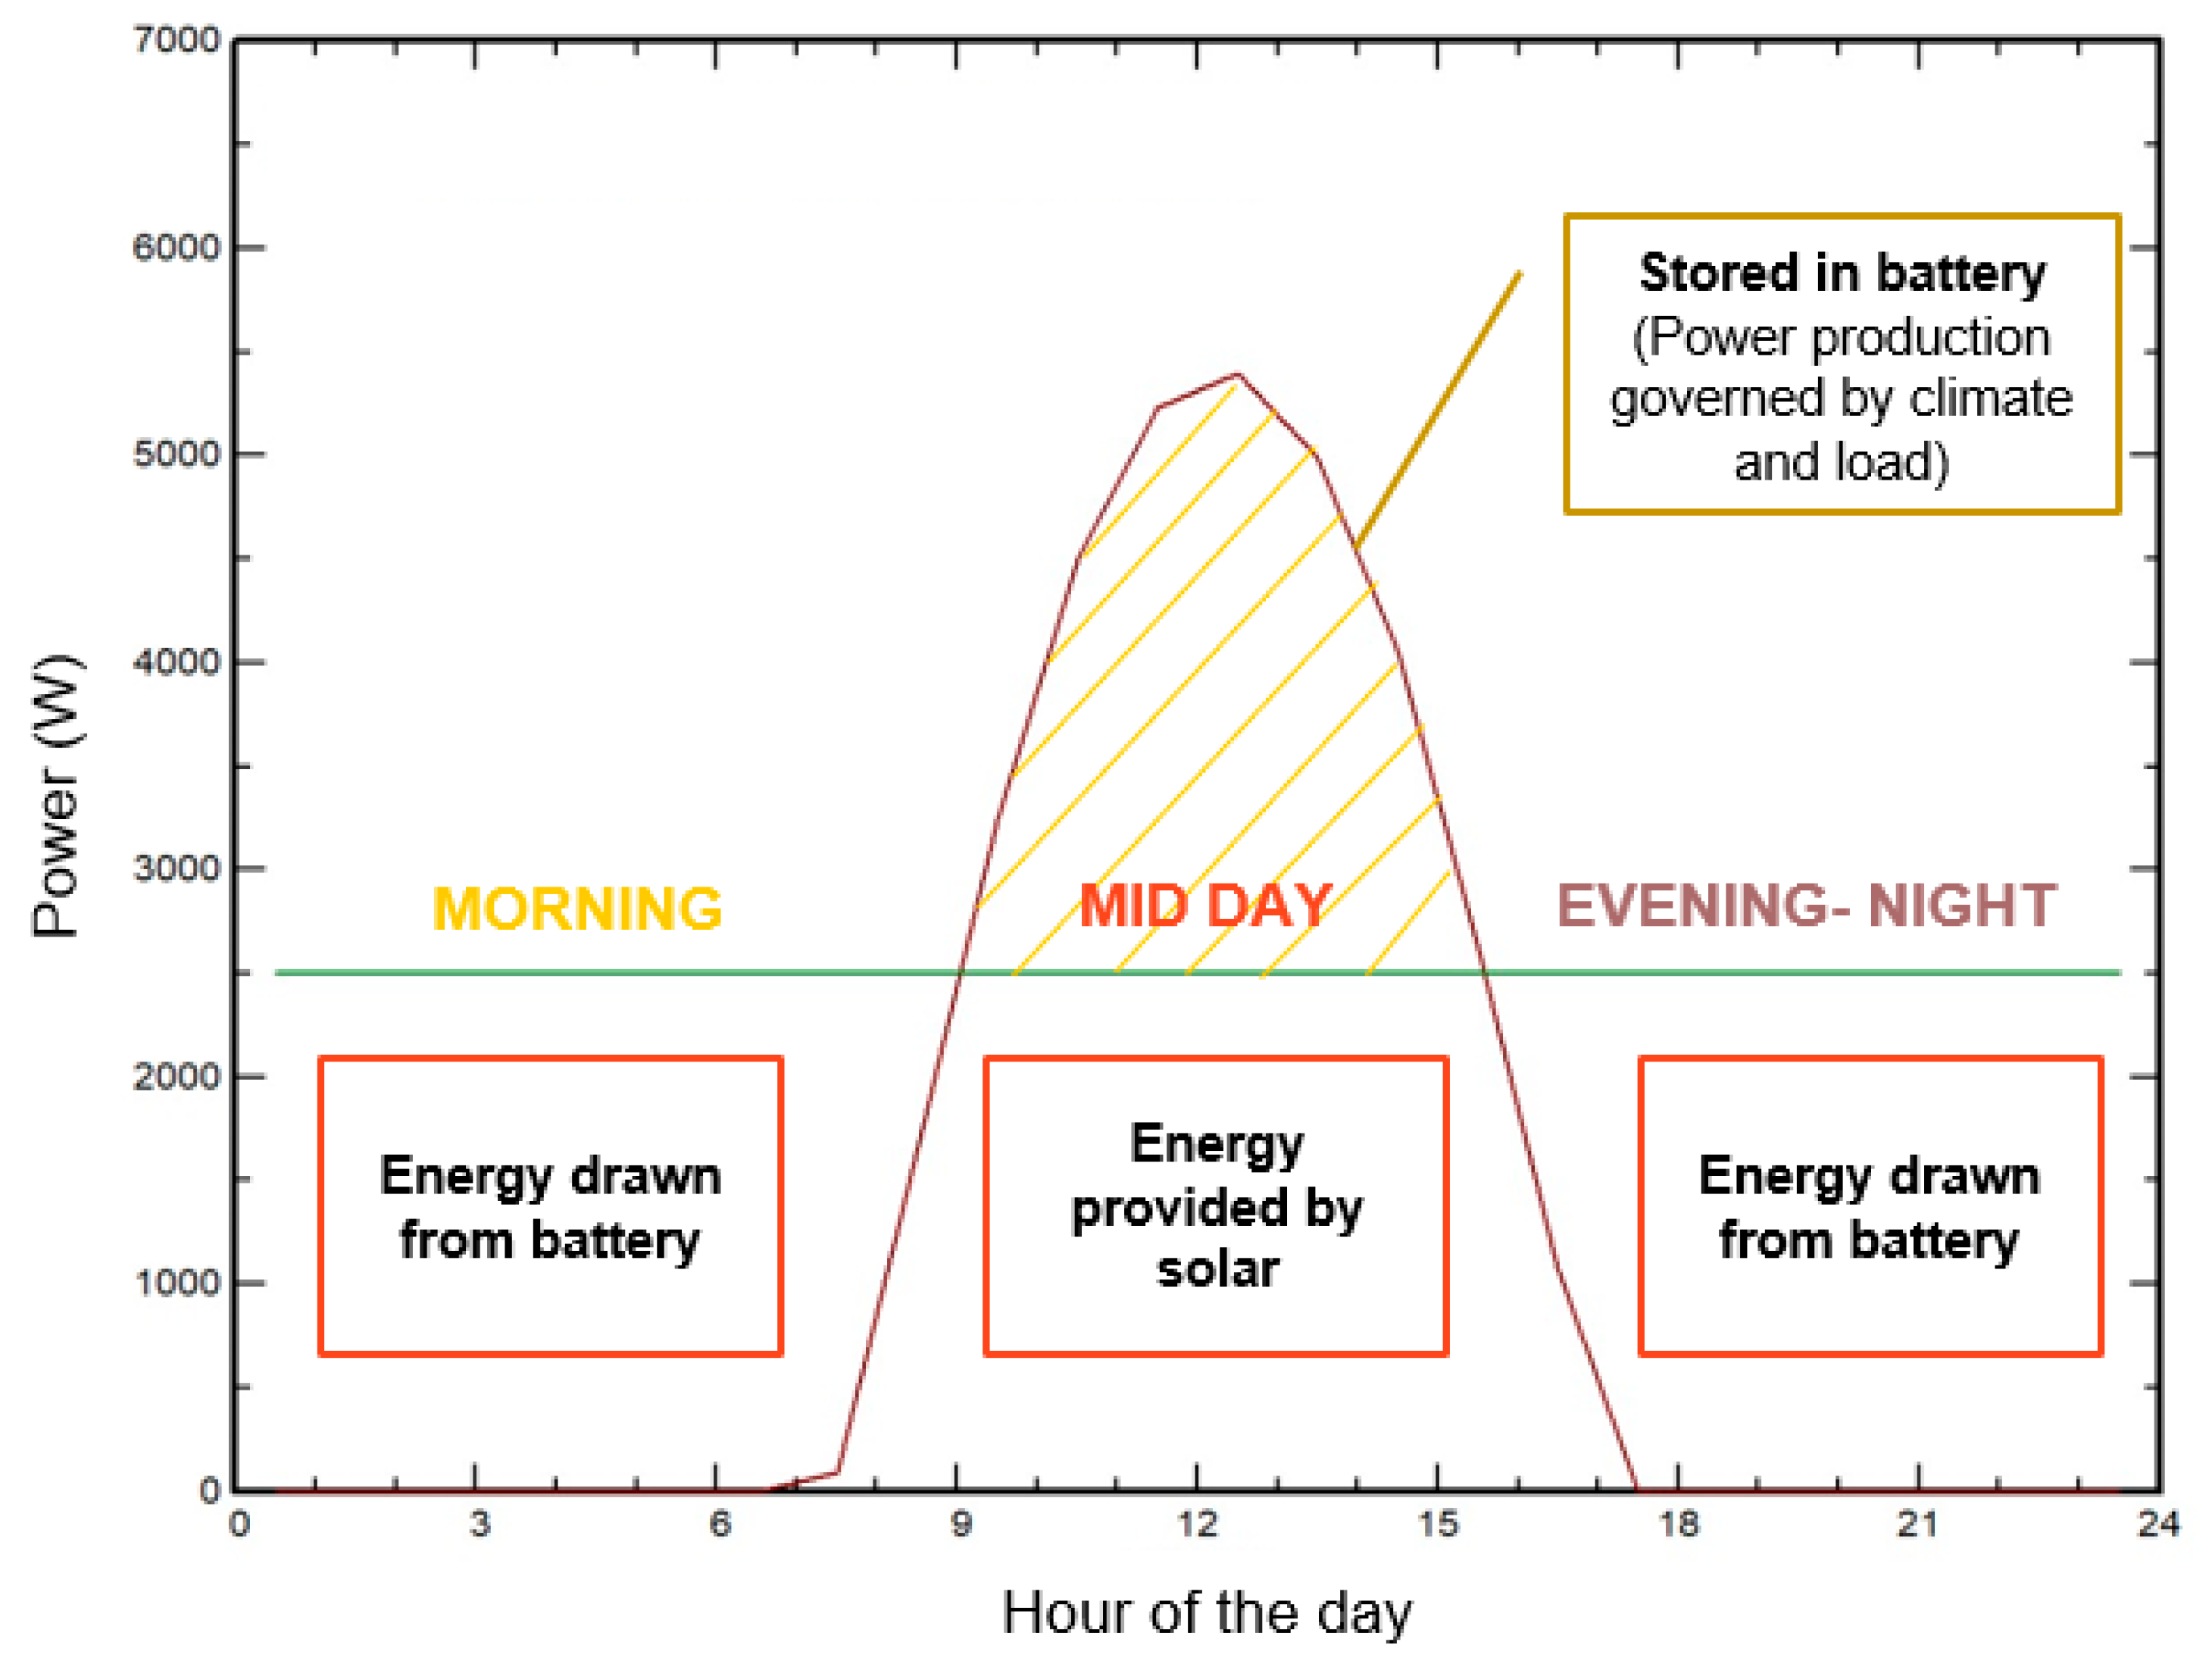
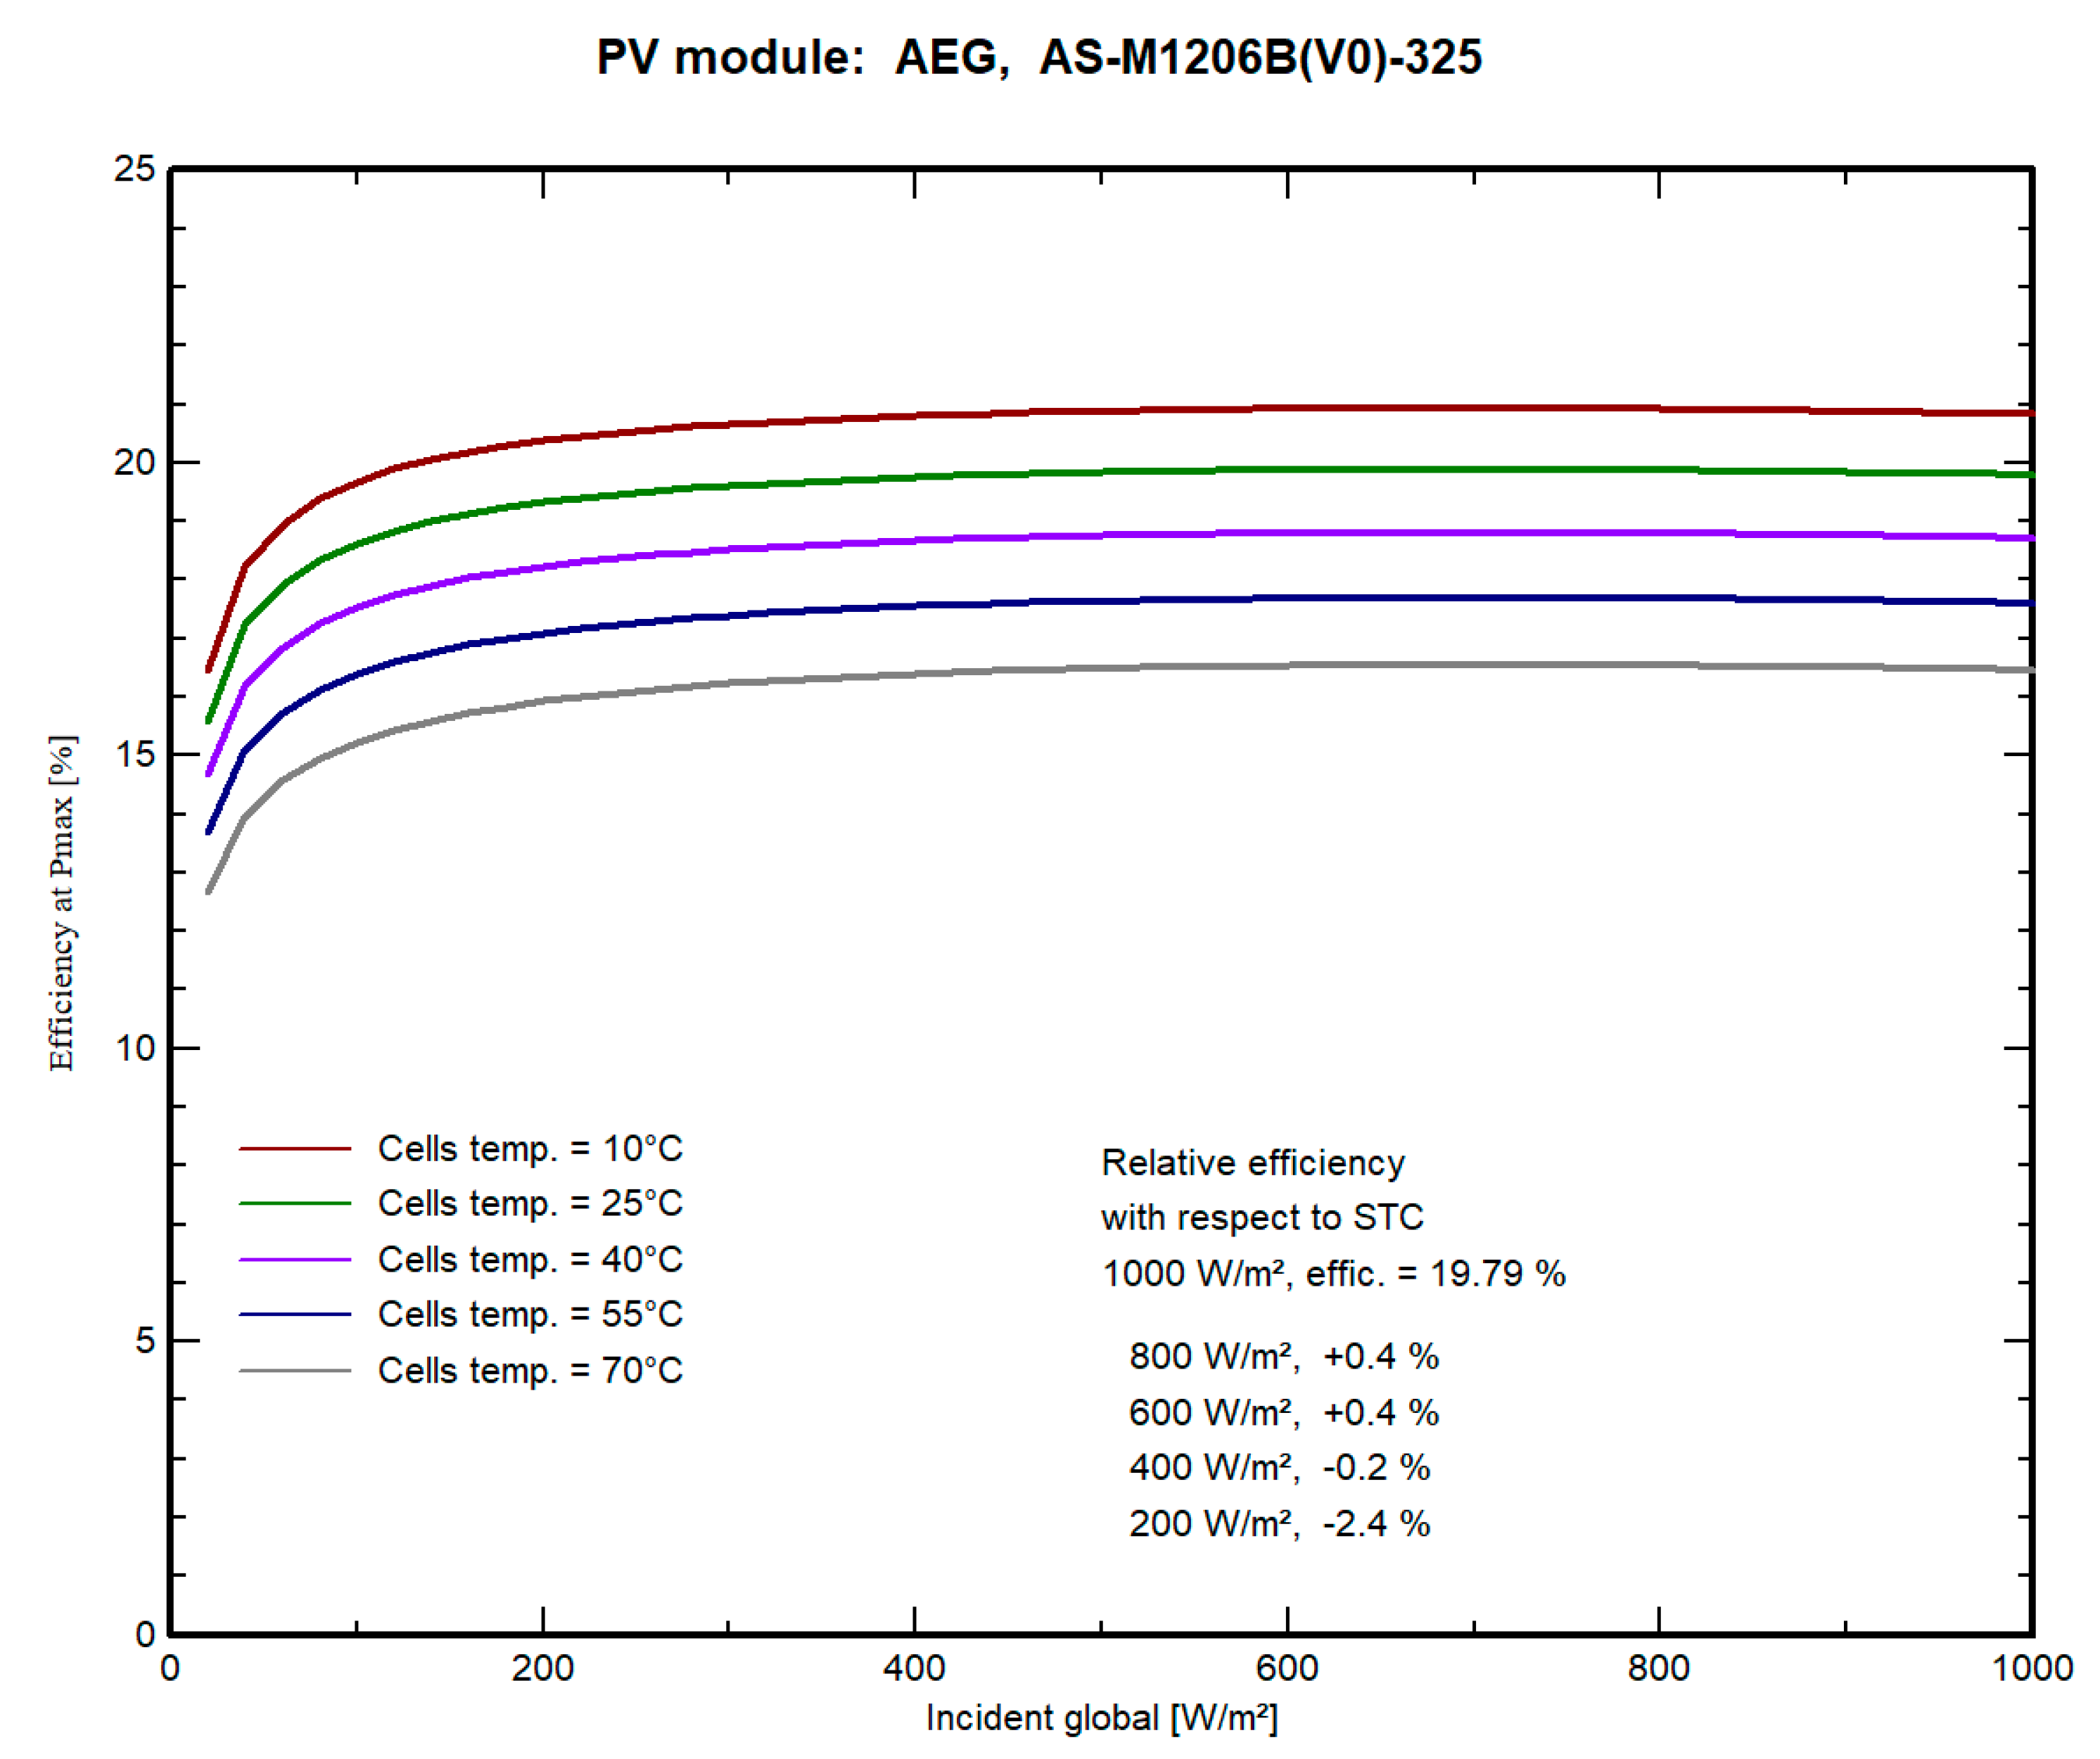
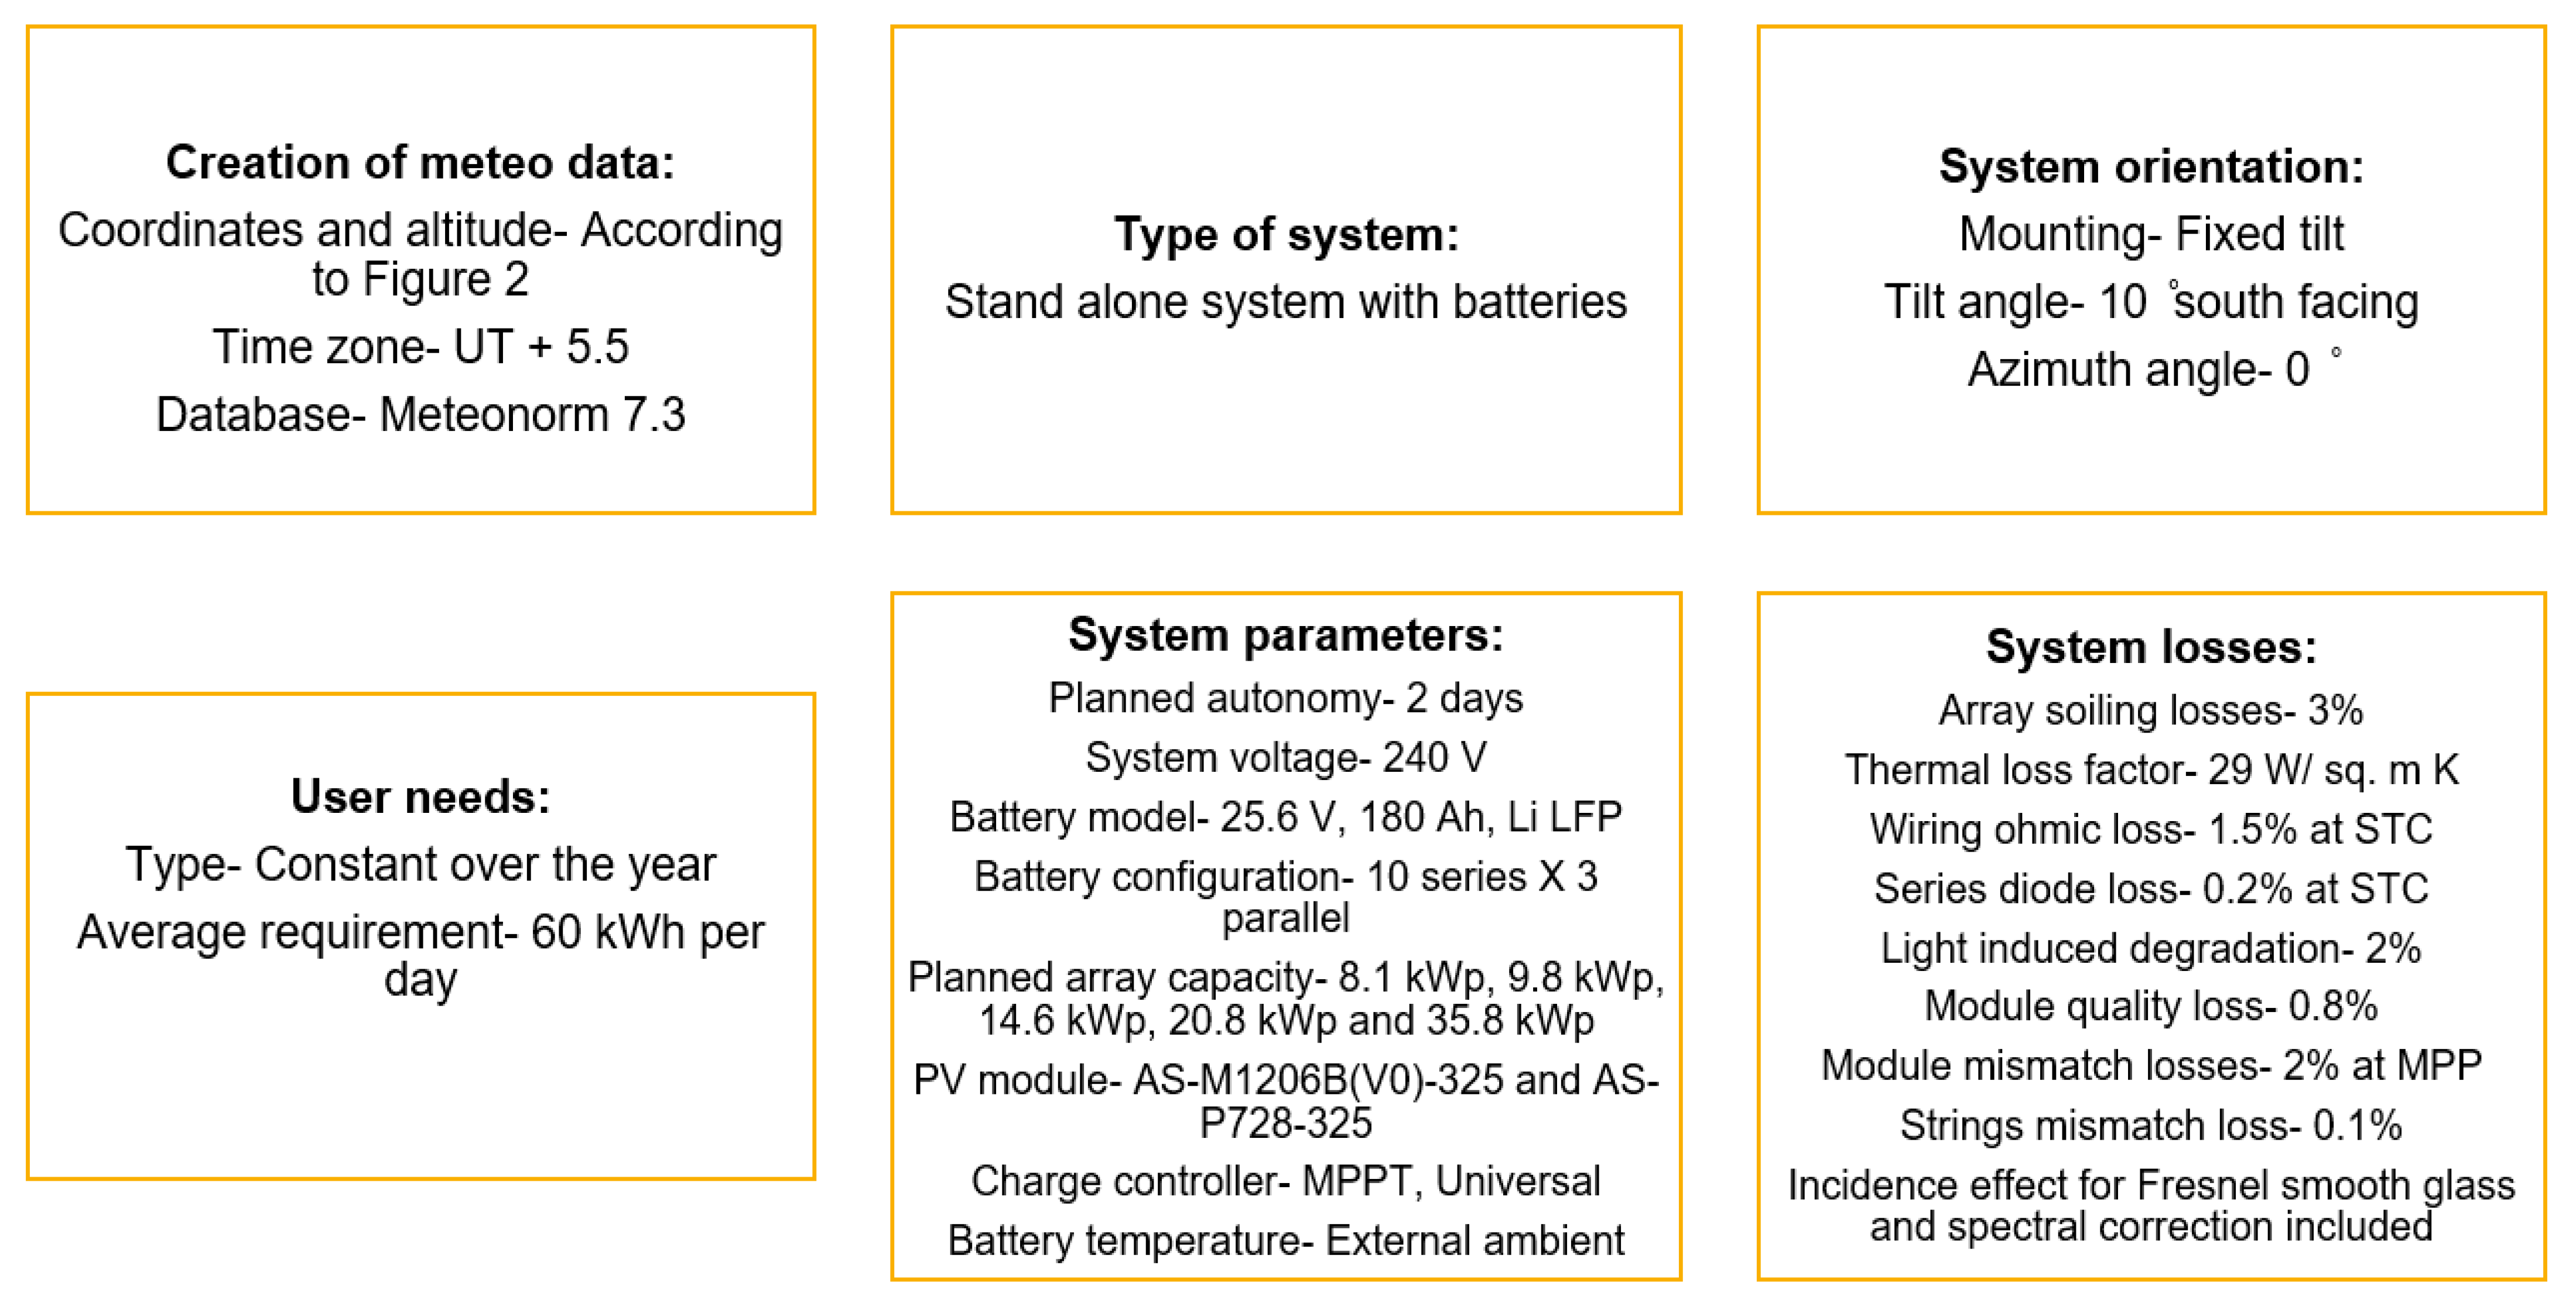
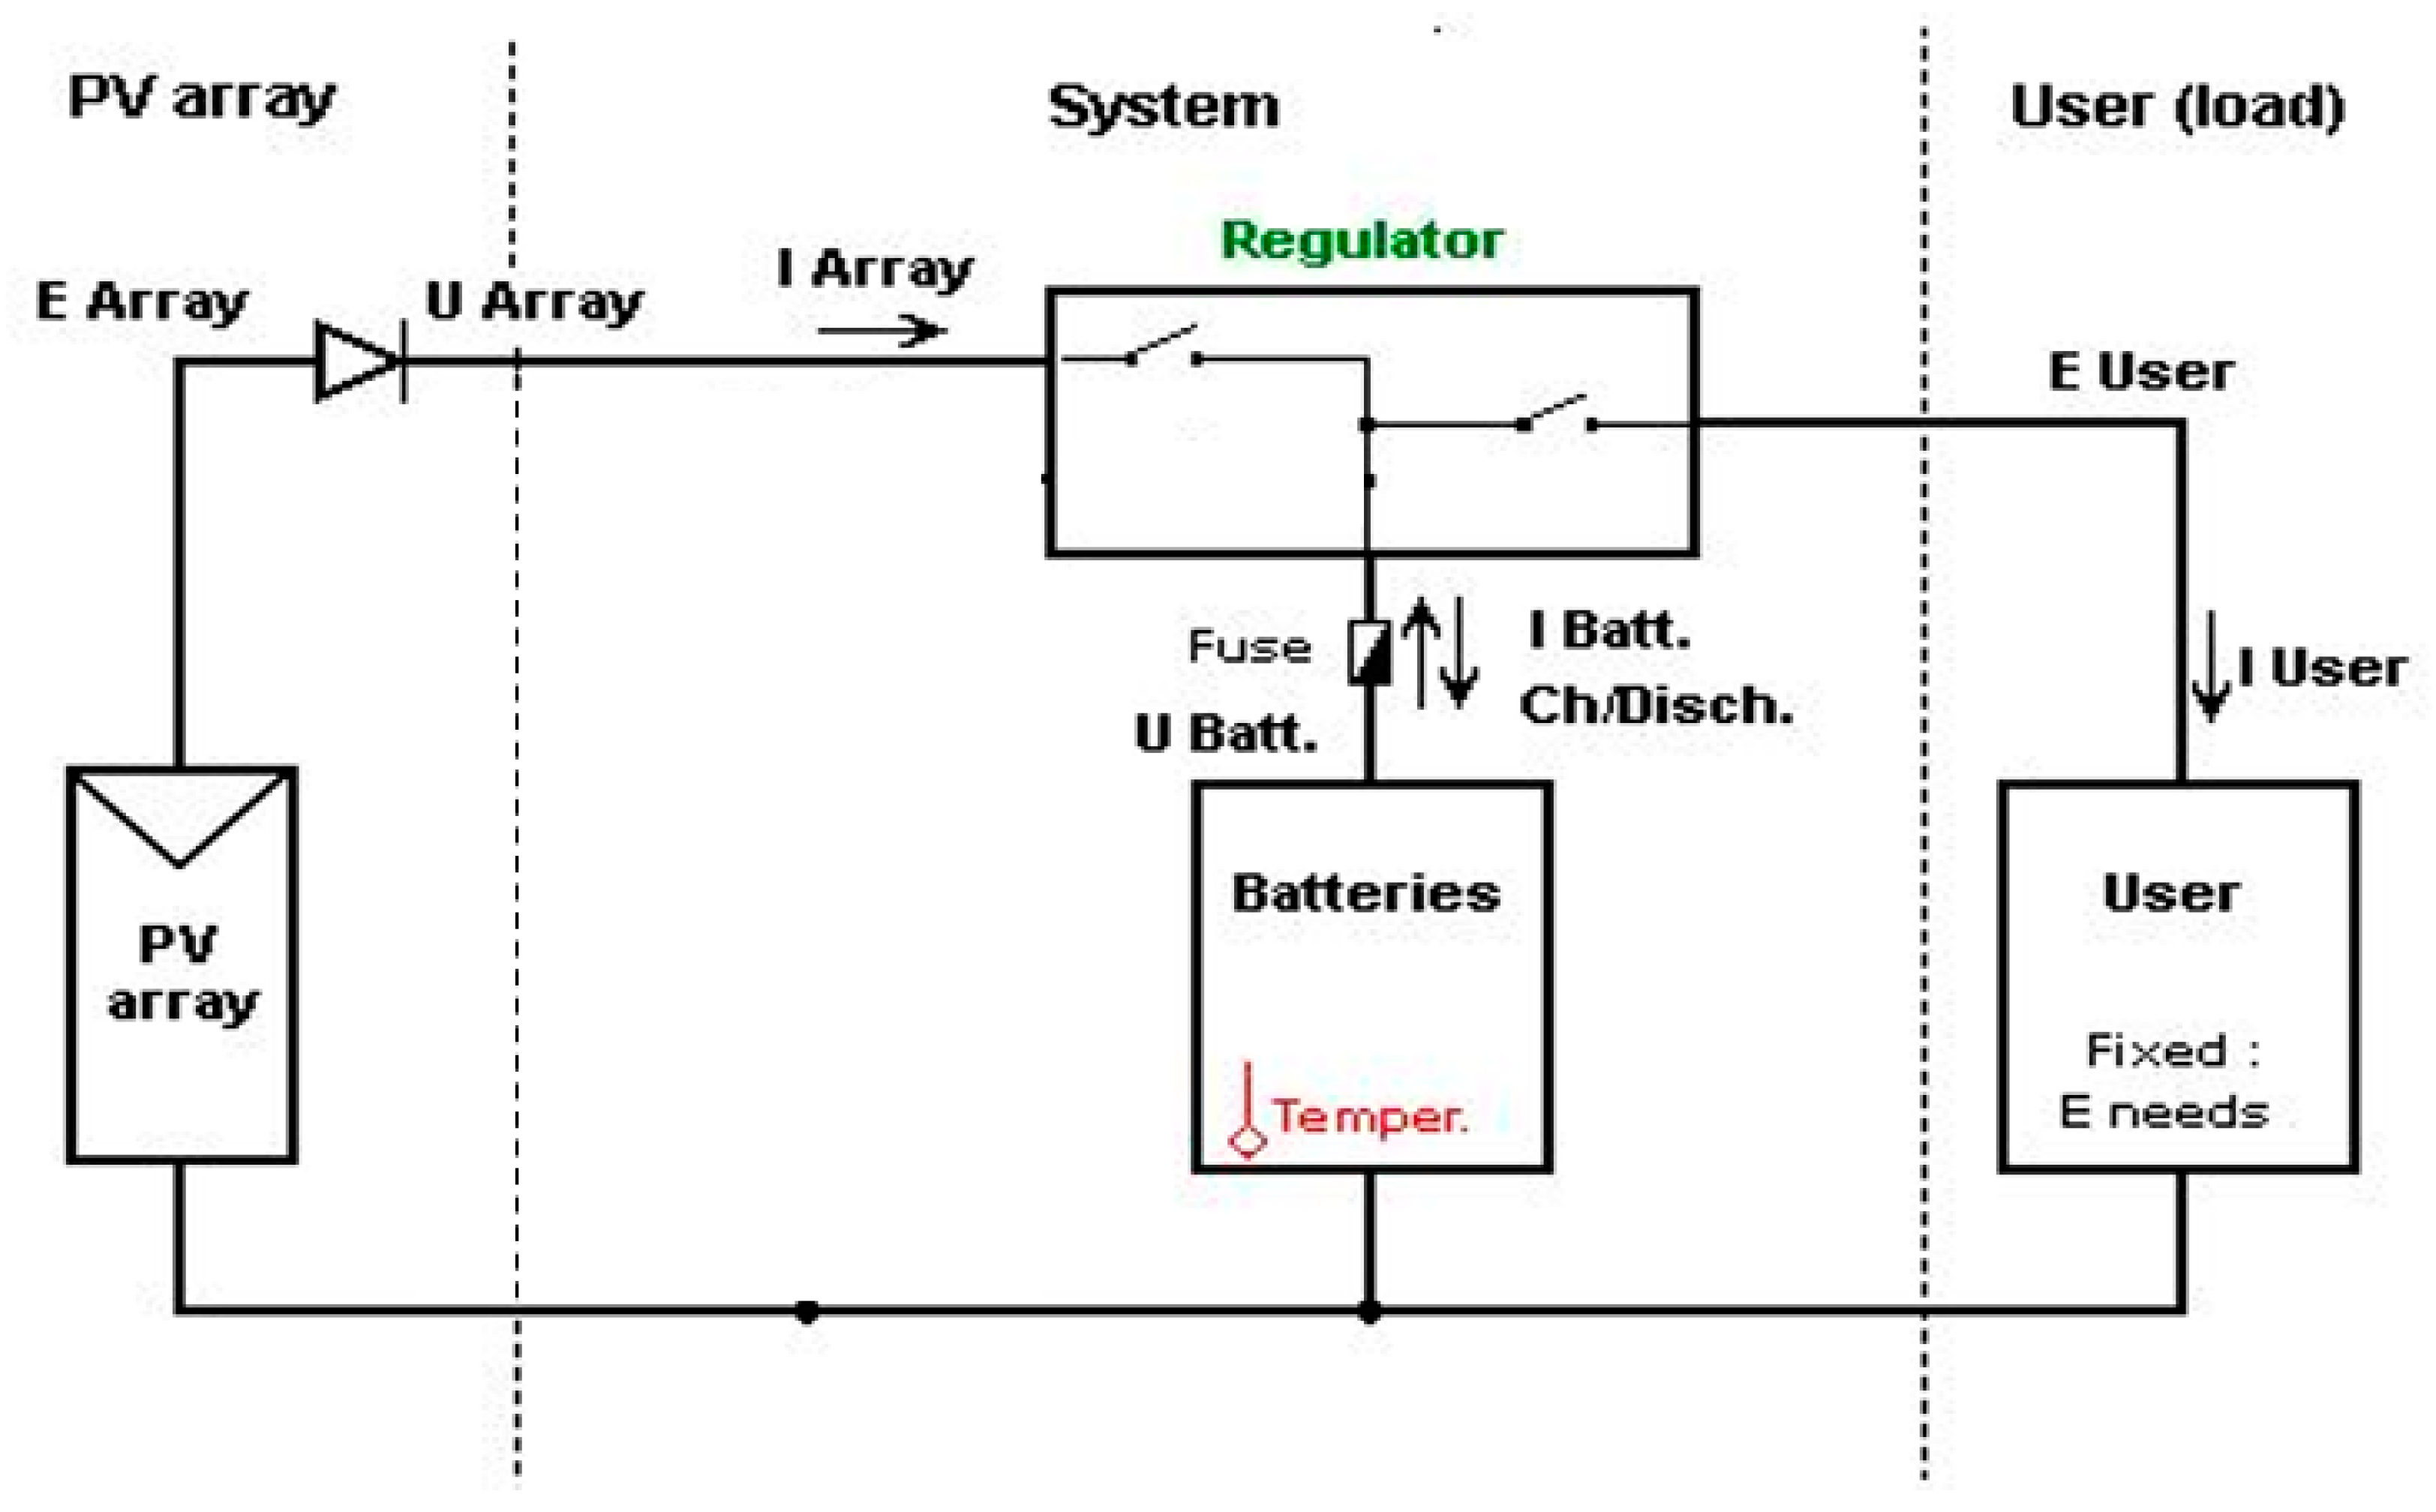
2.3. PV Sizing
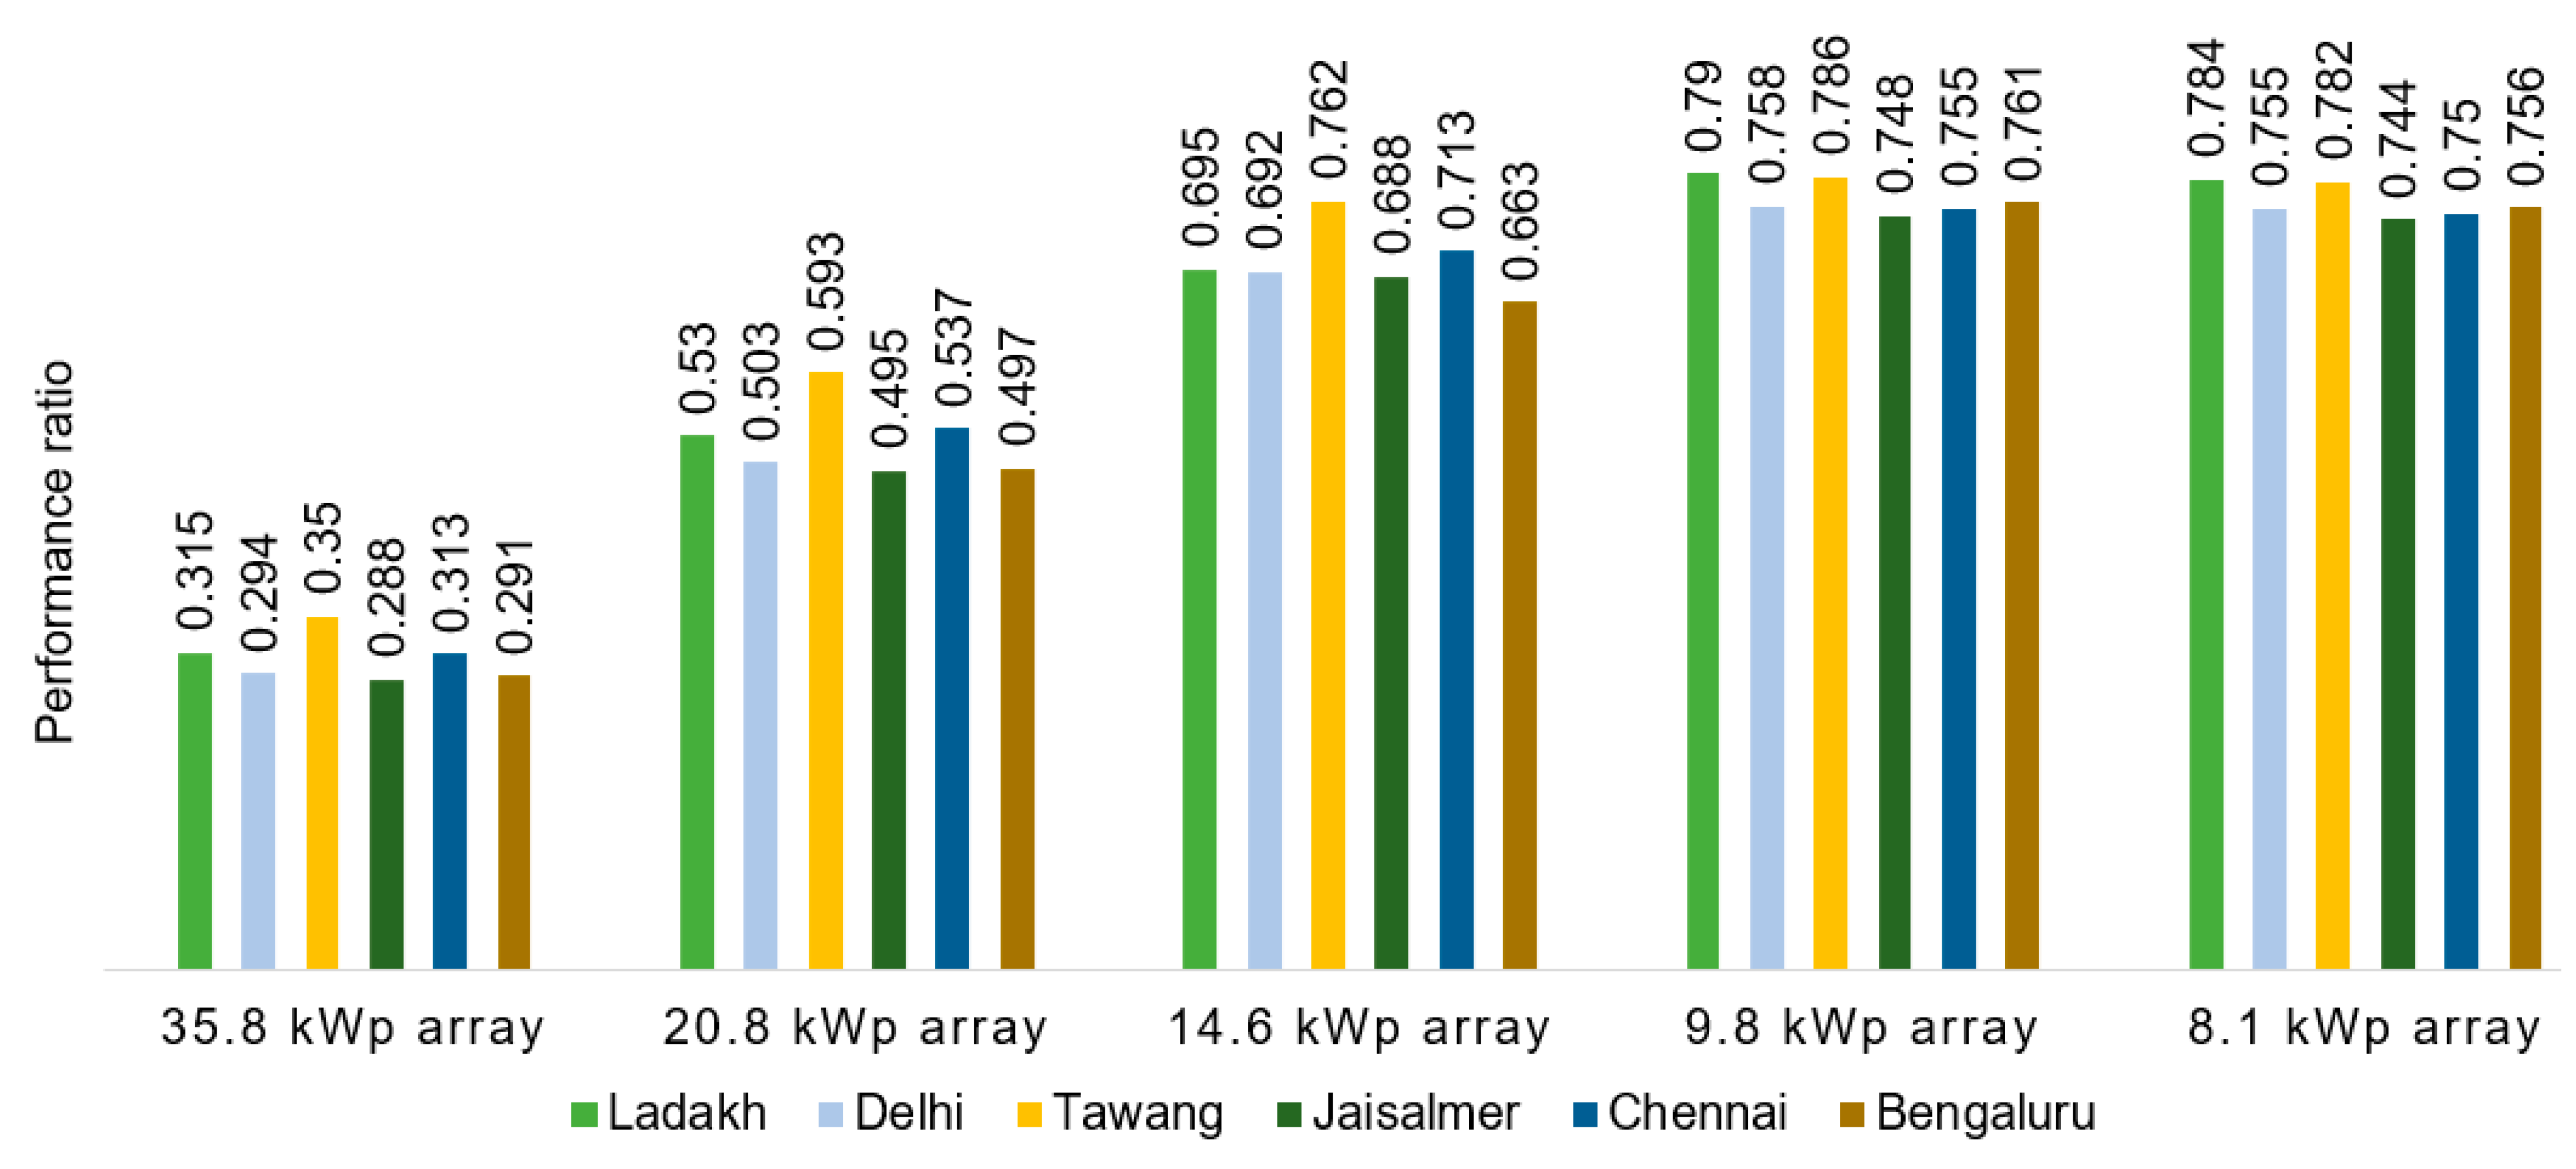
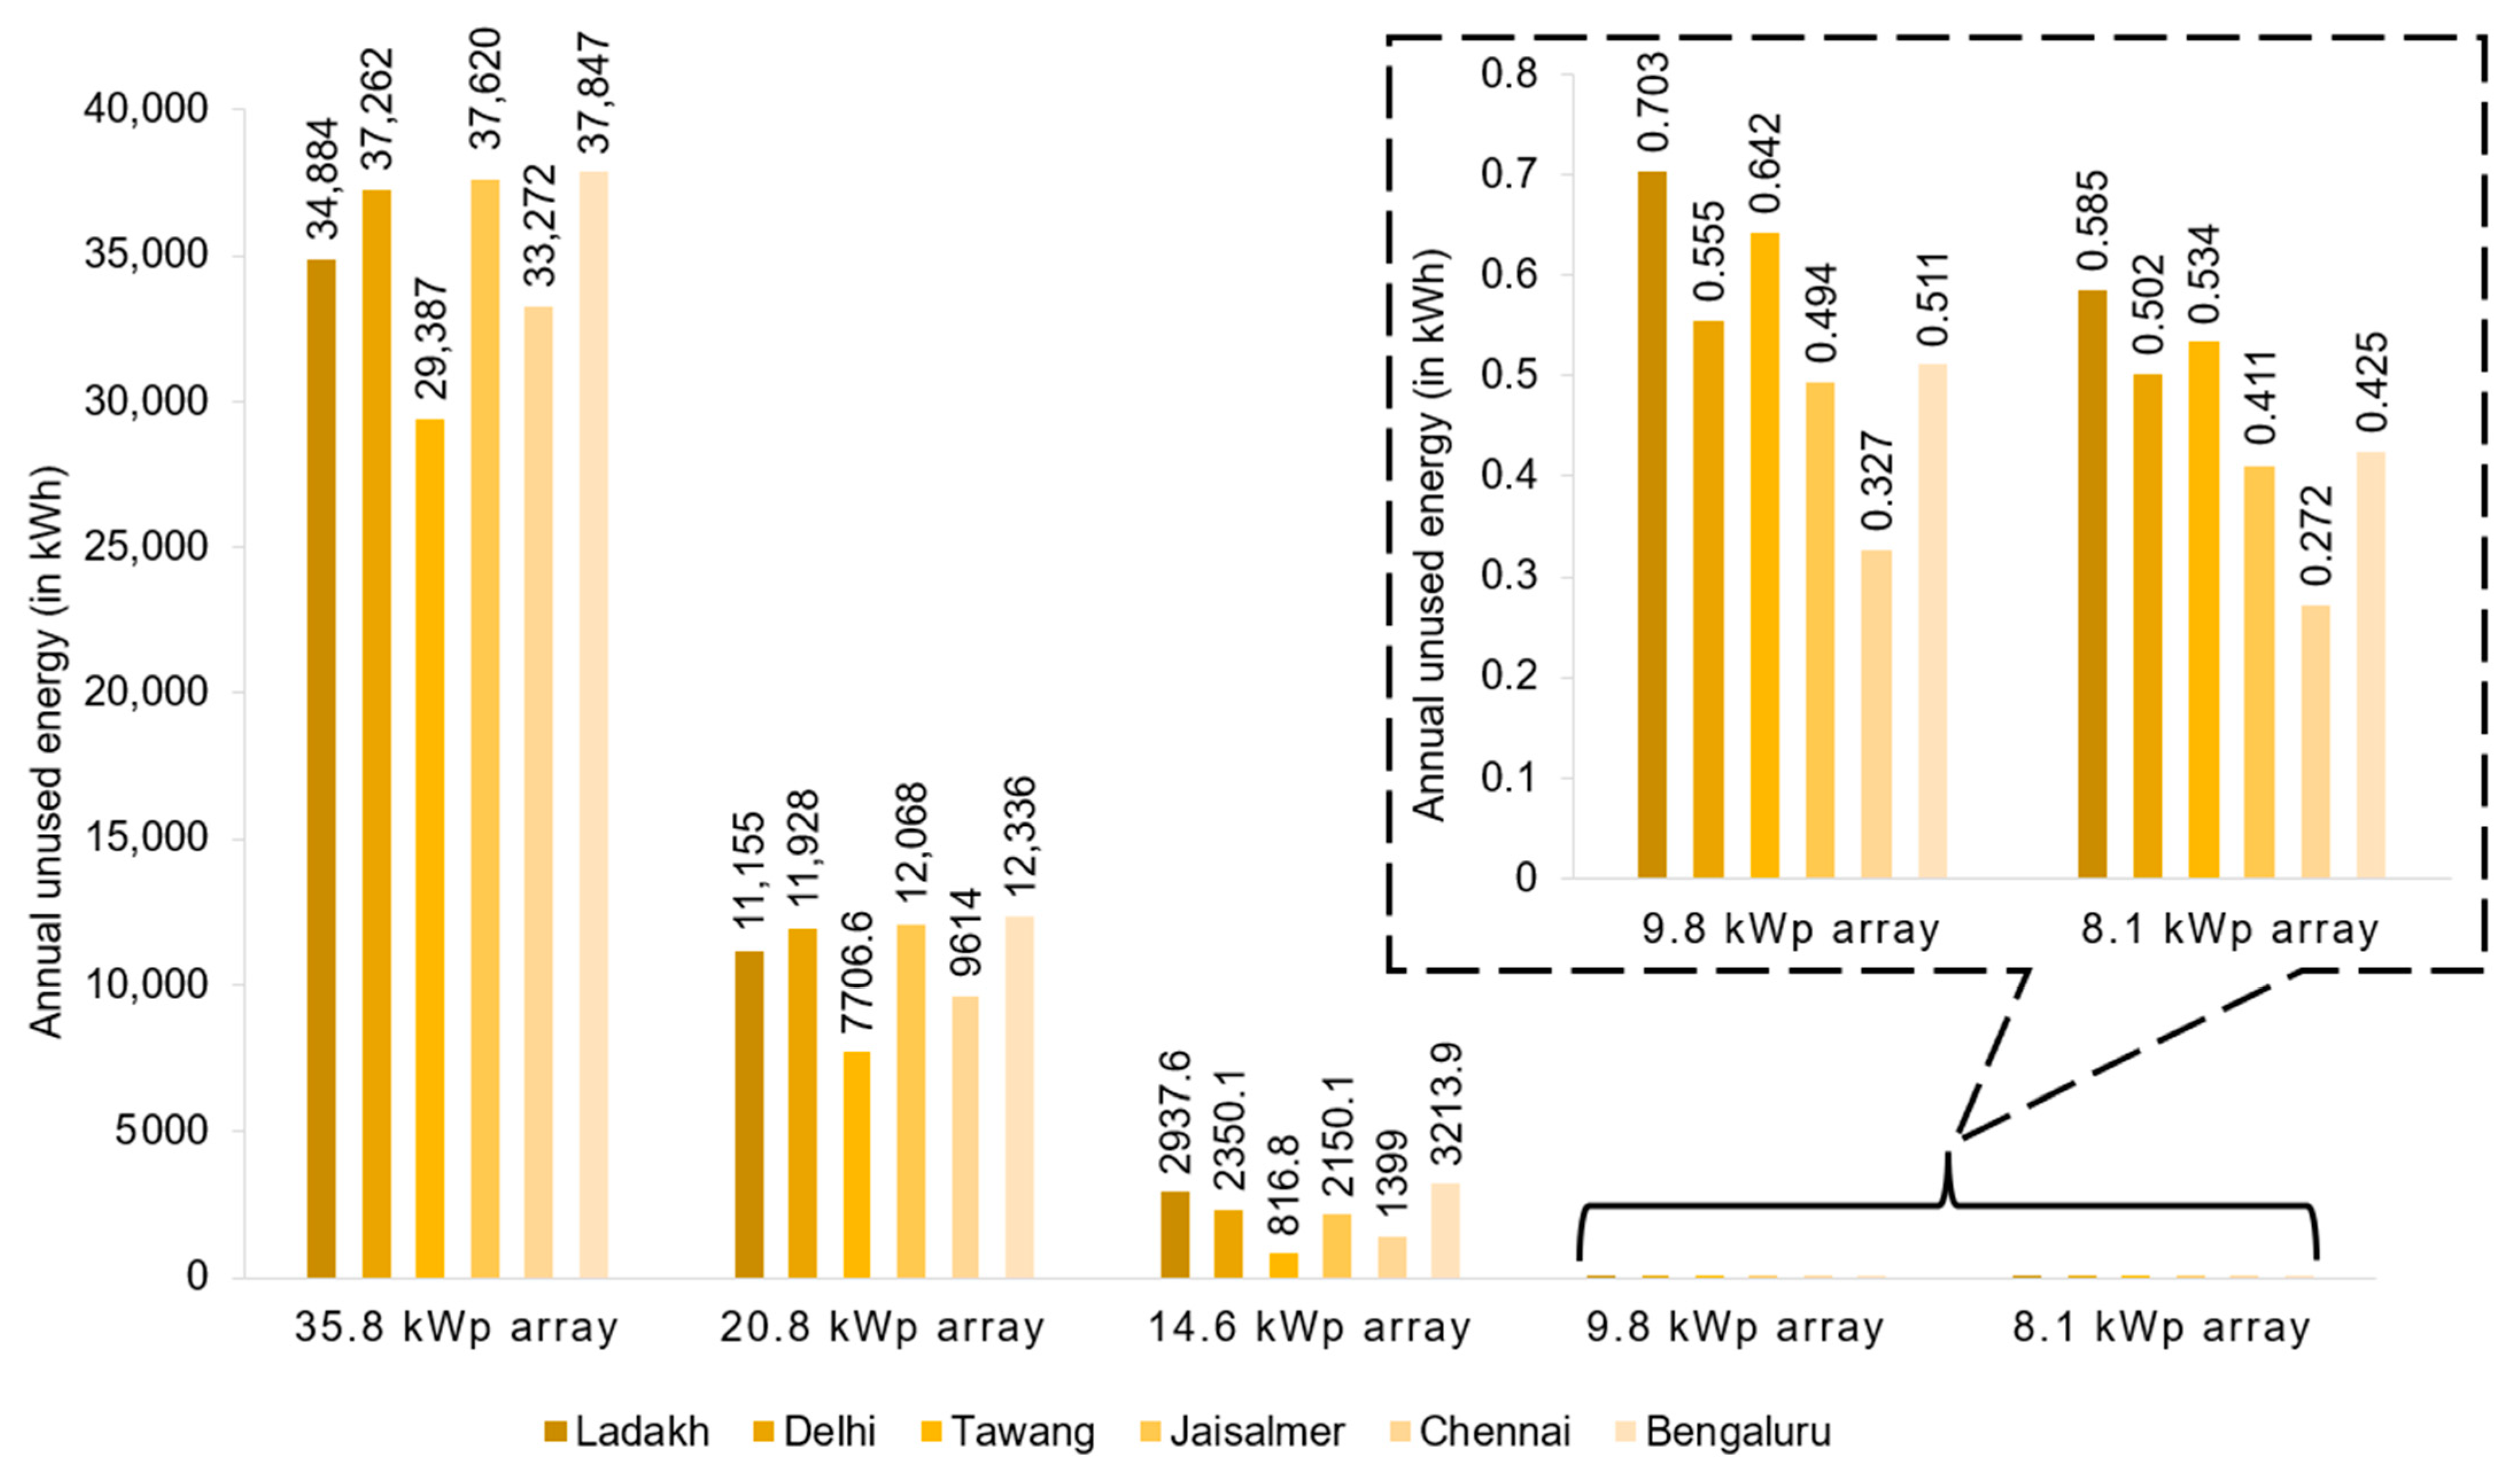
3. Results
4. Discussion
5. Conclusions and Future Scope of Work
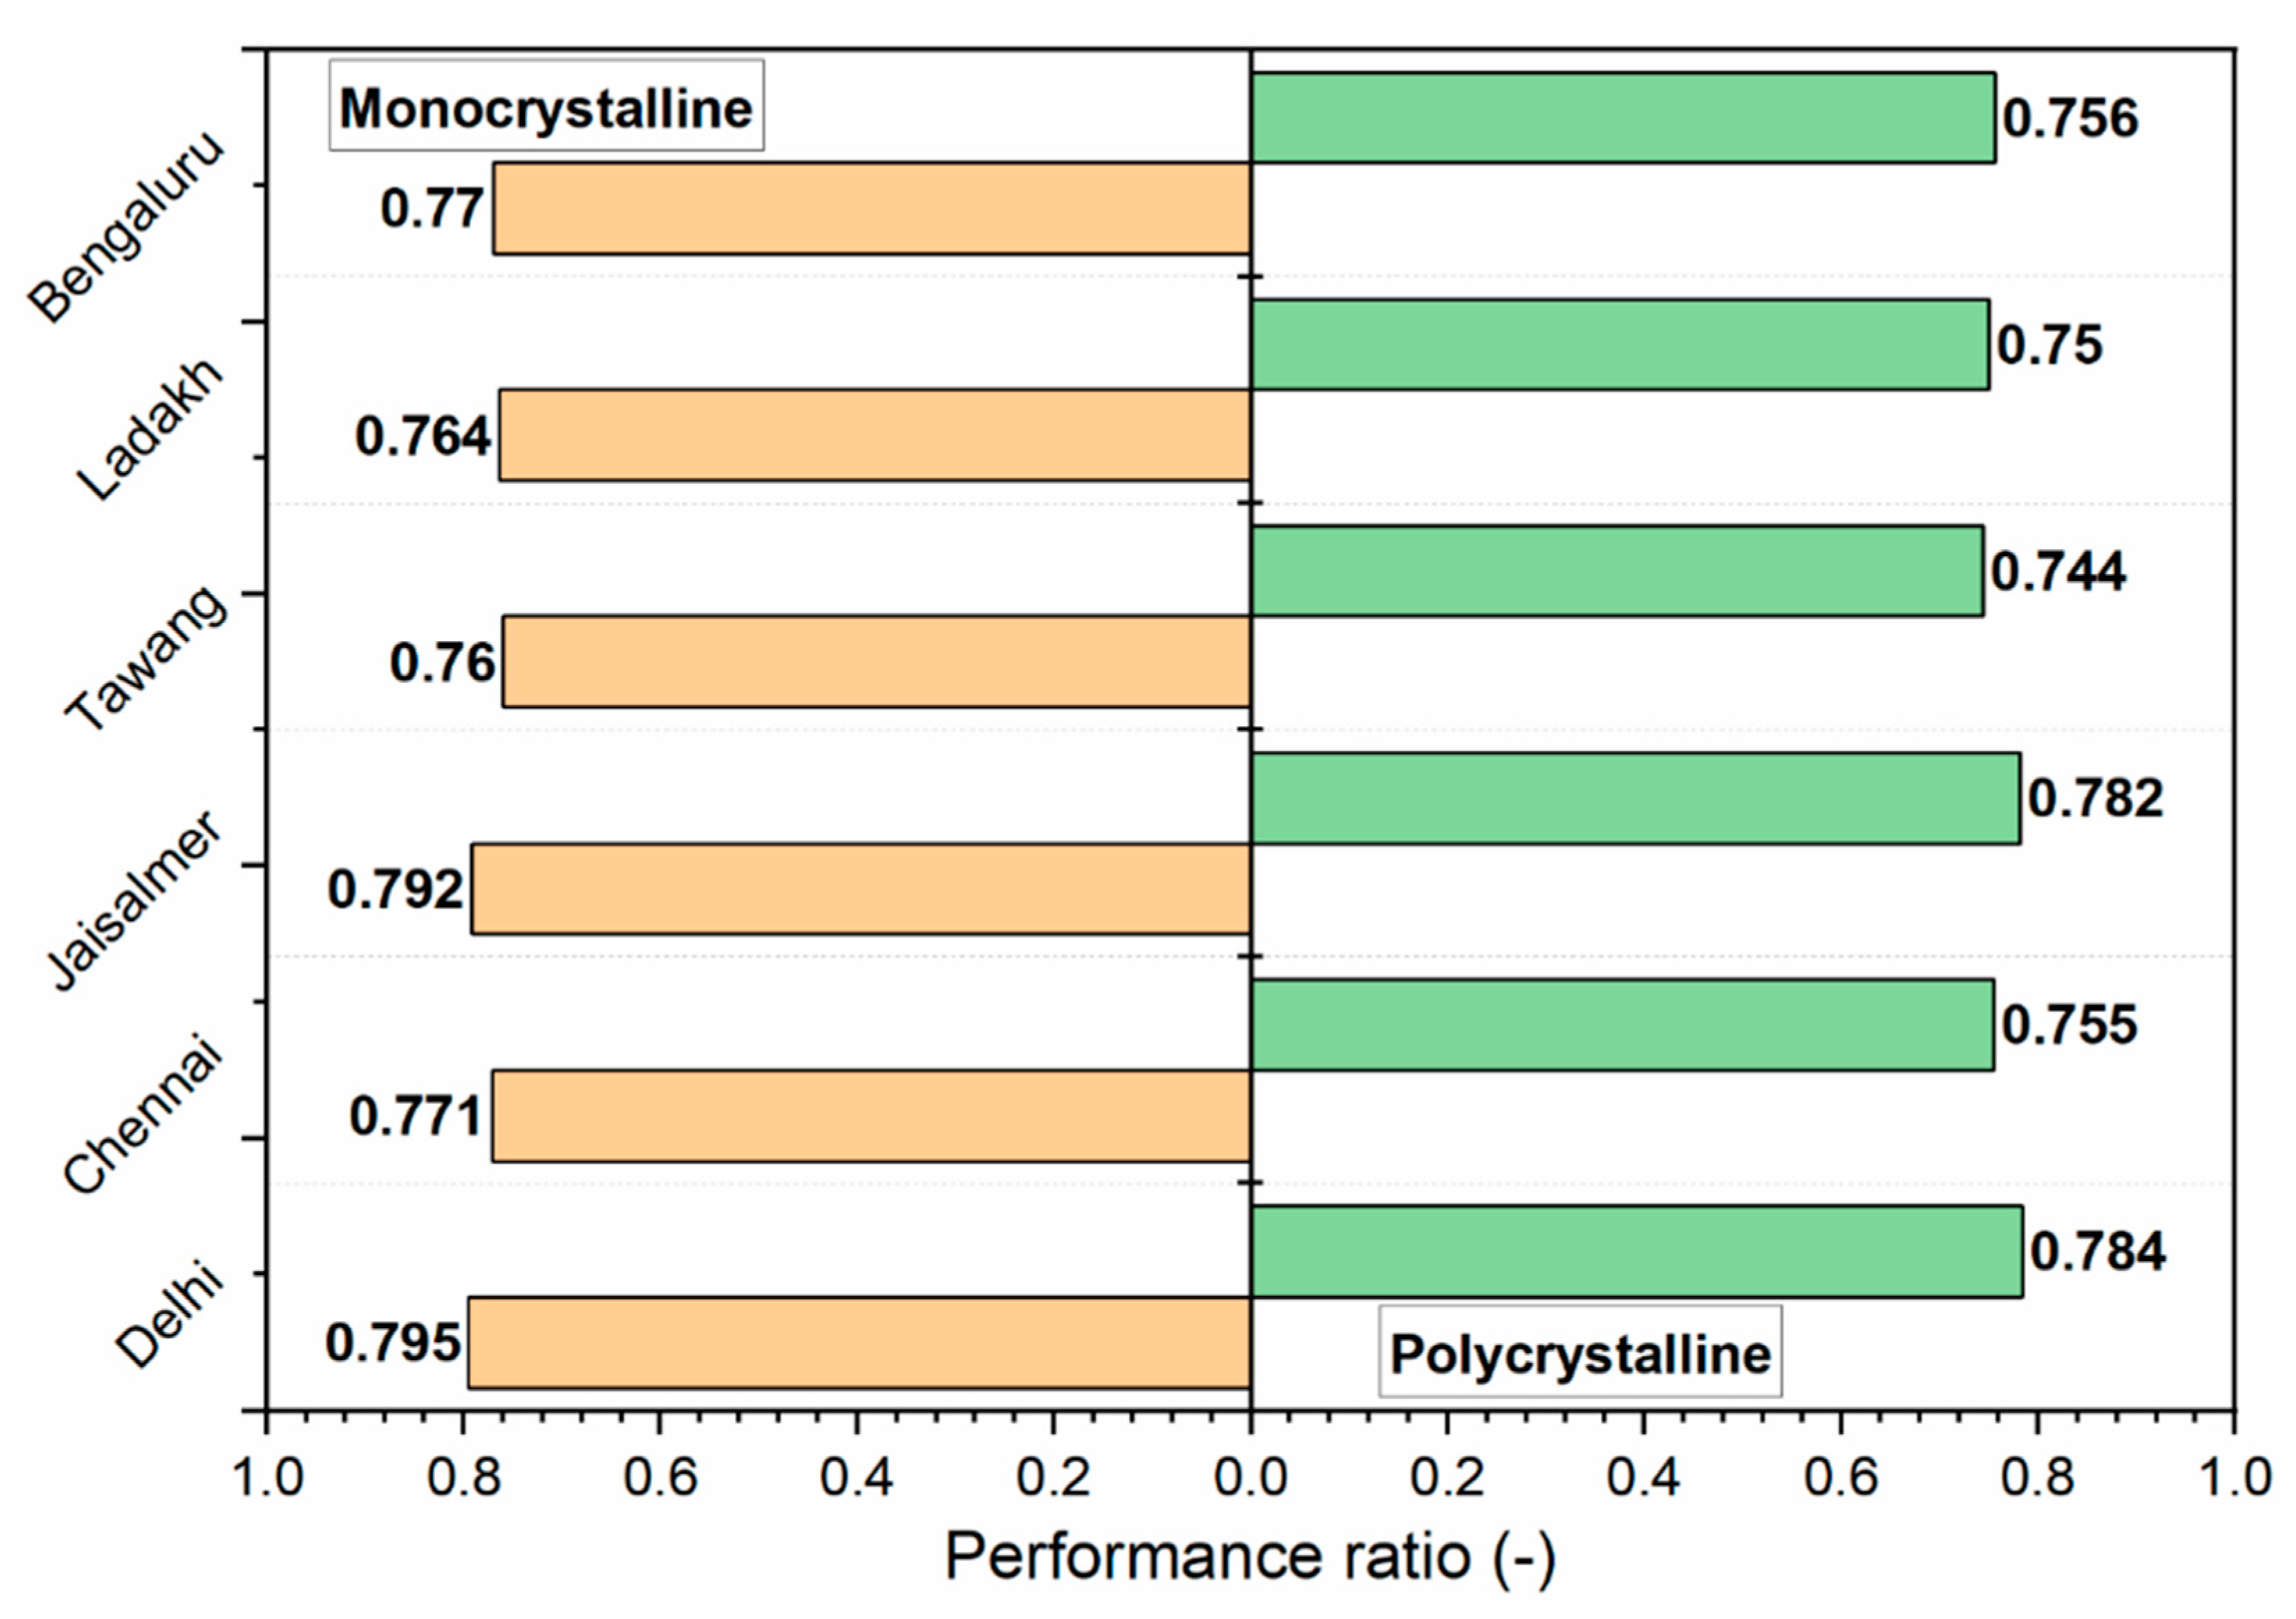
- Out of all the array sizes selected, the 8.1 kWp solar PV system with two days of battery autonomy (129.6 kWh battery capacity) has the fewest unused energy losses and a good PR in all six of the cities: Delhi, Chennai, Jaisalmer, Tawang, Ladakh, and Bengaluru.
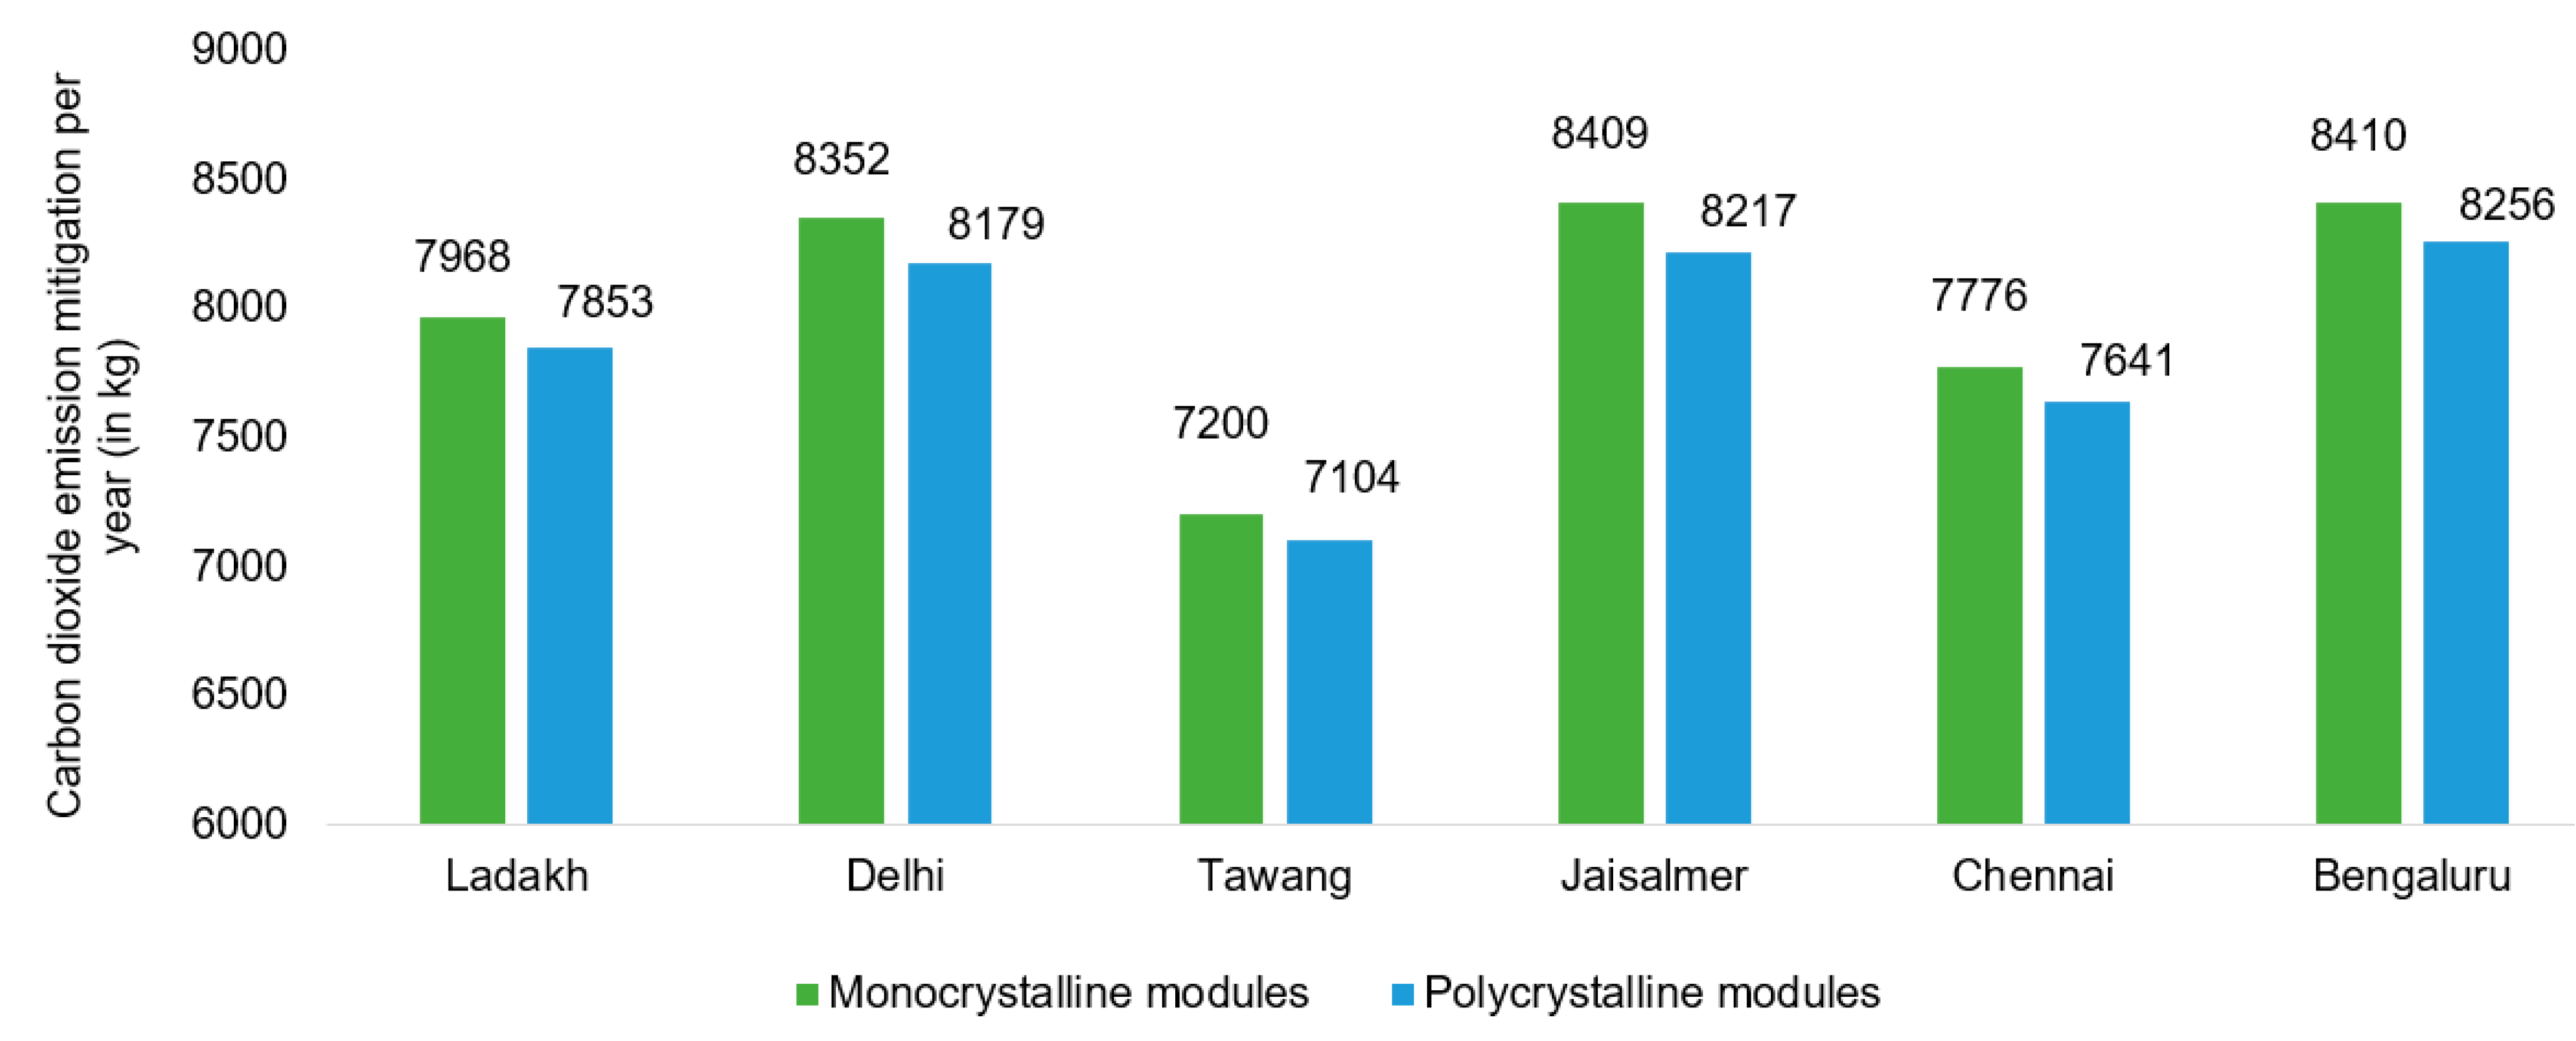
- An annual average of 12,428.8 kWh of energy can be generated from this system, which is sufficient to charge 414 vehicles with a battery capacity of 30 kWh. This would help in decreasing CO2 emissions by around 7950 kg per year.
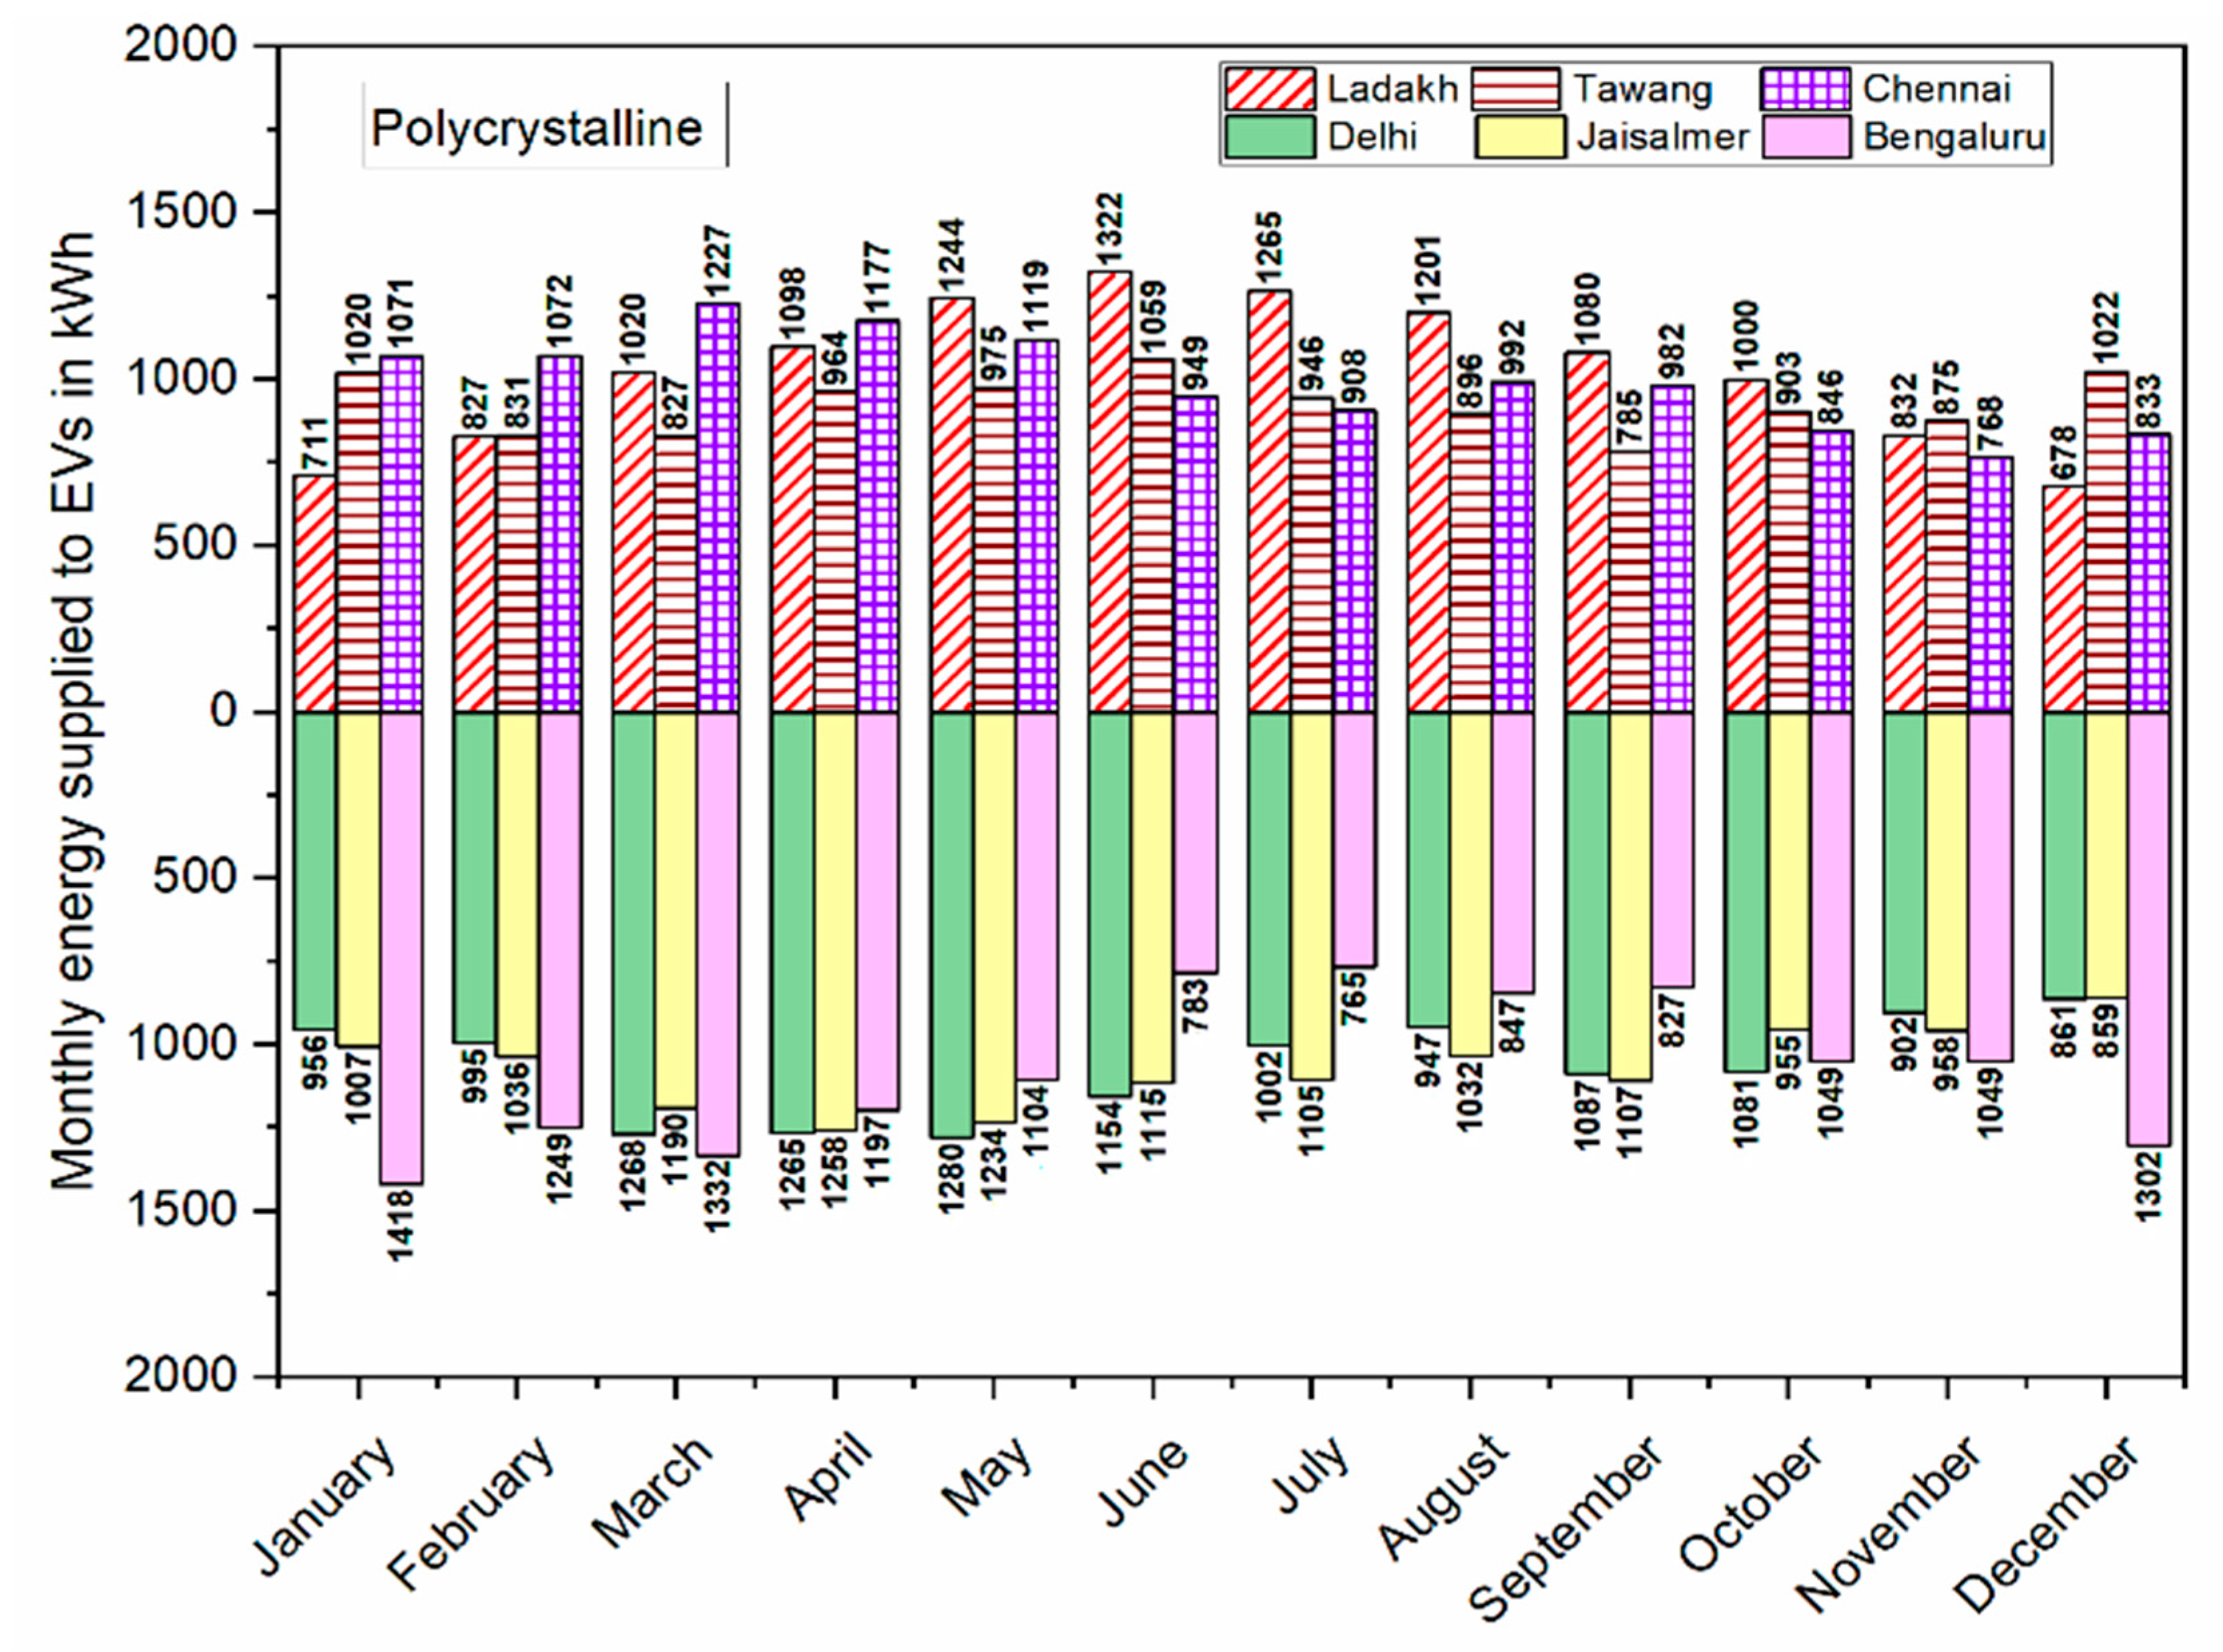
- For cities near the Tropic of Cancer, namely, Delhi, Tawang, Jaisalmer, and Ladakh, maximum energy is produced from May–July, and for cities near the Equator, namely, Bengaluru and Chennai, more energy is produced during November–January and February–April, respectively. Out of all of the cities, the maximum energy supplied in a month is 1444 kWh in Bengaluru in January, and the minimum is 685 kWh in Ladakh in December.
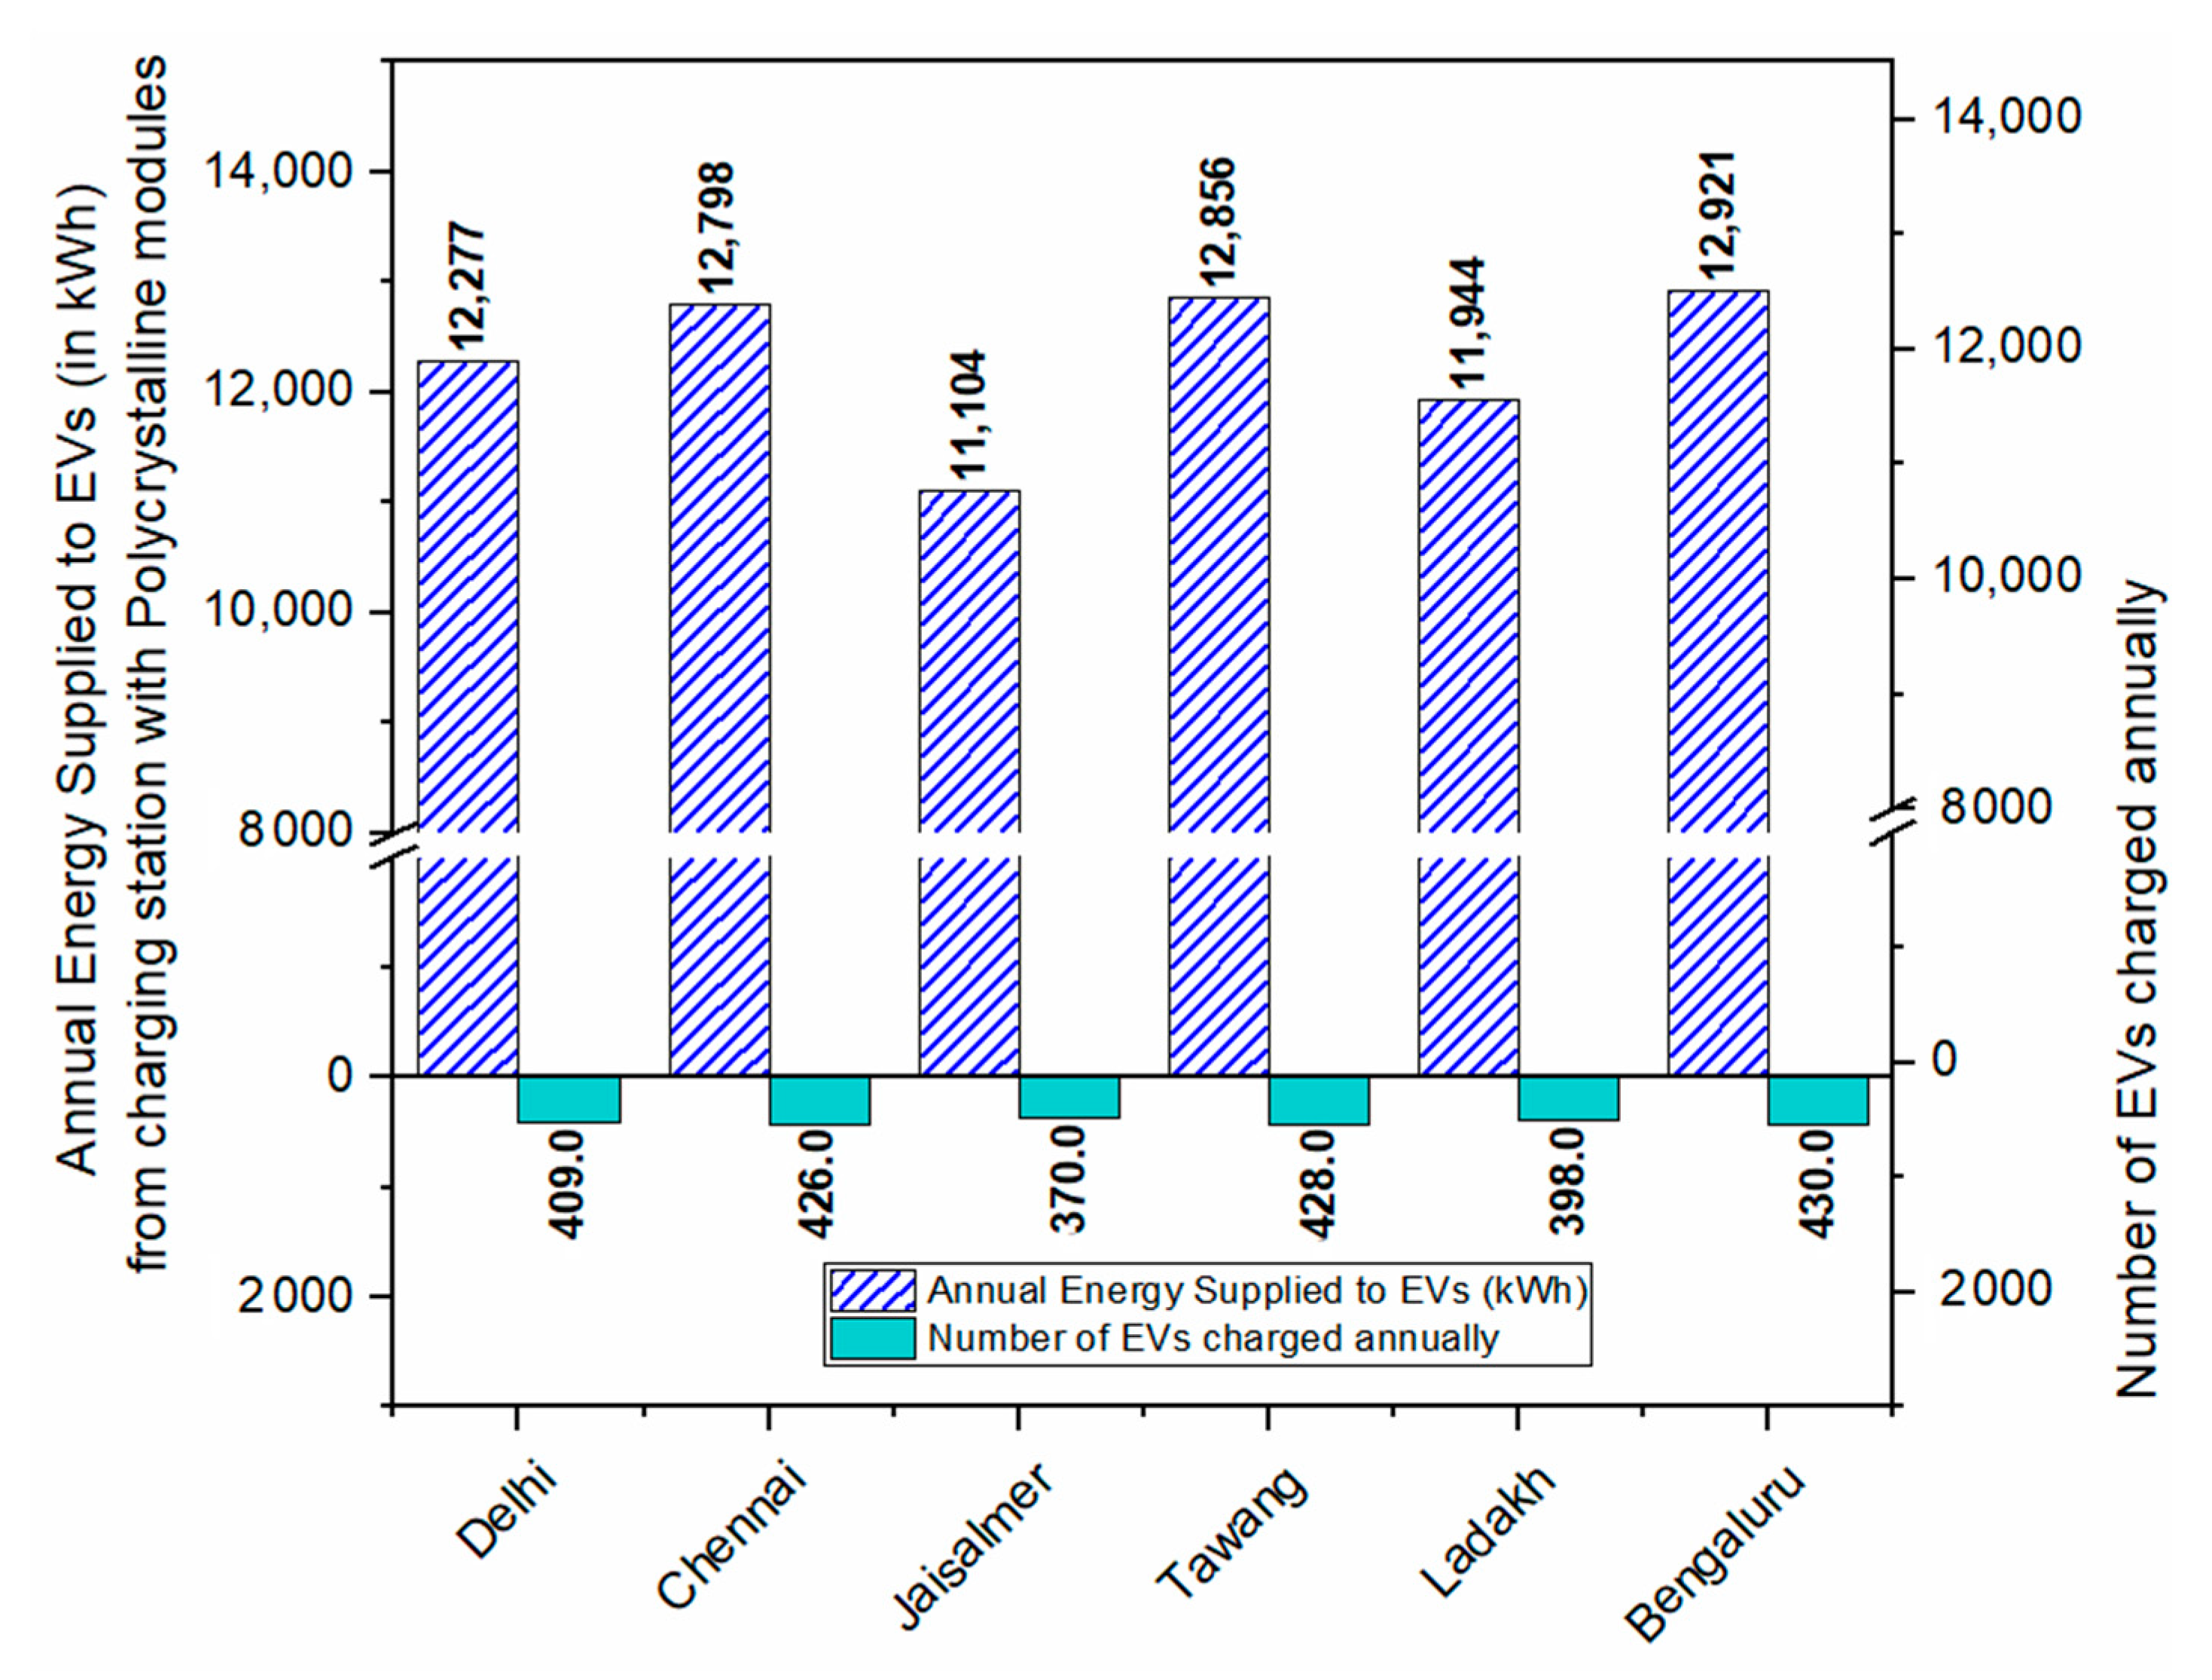
- According to the annual energy supplied by the charging station, the maximum number of cars can be charged in Bengaluru and the minimum number of cars can be charged in Tawang.
- The investment cost per km over 20 years of system life for the 8.1 kWp array with two days autonomy is INR 4.05 if monocrystalline panels are used and INR 4.09 if polycrystalline panels are used. Therefore, the least possible investment cost per km for a gasoline station is INR 5, and it can go up to INR 7.
- Despite having the same rated wattage, the monocrystalline panels have a better performance than the polycrystalline panels in terms of the energy supplied to EVs, CO2 mitigation, and the investment cost per km.
- Compared to grid-tied EV charging stations, this station design does require 16 times more space. Still, its resilience and sustainability make it a good option for frontier regions such as Ladakh and Tawang, where grid availability is sparse.
- The current trend is to shift towards swappable batteries, and such a station can also be designed. Furthermore, chargers that are capable of charging different types of vehicles can also be used, and the system can be integrated with other forms of renewable energy, depending on the location.
Author Contributions
Funding
Conflicts of Interest
References
- Lahiri-Dutt, K. The Diverse Worlds of Coal in India: Energising the Nation, Energising Livelihoods. Energy Policy 2016, 99, 203–213. [Google Scholar] [CrossRef]
- Press Trust of India. Electric Vehicle Market in India Expected to Hit 63 Lakh Units per Annum Mark by 2027: IESA. Available online: https://yourstory.com/2020/12/electric-vehicle-market-india-expected-hit-63lakh-iesa/amp (accessed on 8 July 2021).
- Suzuki, K.; Kobayashi, Y.; Murai, K.; Ikezoe, K. Impact of EV Charging on Power System with High Penetration of EVs: Simulation and Quantitative Analysis Based on Real World Usage Data. In SAE Technical Paper Series; SAE International: Warrendale, PA, USA, 2020. [Google Scholar]
- Kostopoulos, E.D.; Spyropoulos, G.C.; Kaldellis, J.K. Real-World Study for the Optimal Charging of Electric Vehicles. Energy Rep. 2020, 6, 418–426. [Google Scholar] [CrossRef]
- Brenna, M.; Foiadelli, F.; Leone, C.; Longo, M. Electric Vehicles Charging Technology Review and Optimal Size Estimation. J. Electr. Eng. Technol. 2020, 15, 2539–2552. [Google Scholar] [CrossRef]
- Sharma, A.; Kapoor, A.; Chakrabarti, S. Impact of Plug-in Electric Vehicles on Power Distribution System of Major Cities of India: A Case Study. Available online: https://home.iitk.ac.in/~ansharma/EV_Report_V1.pdf (accessed on 9 July 2021).
- Chandra Mouli, G.R.; Van Duijsen, P.; Grazian, F.; Jamodkar, A.; Bauer, P.; Isabella, O. Sustainable E-Bike Charging Station That Enables AC, DC and Wireless Charging from Solar Energy. Energies 2020, 13, 3549. [Google Scholar] [CrossRef]
- Atmaja, T.D. Energy Storage System Using Battery and Ultracapacitor on Mobile Charging Station for Electric Vehicle. Energy Procedia 2015, 68, 429–437. [Google Scholar] [CrossRef] [Green Version]
- Altaleb, H.; Rajnai, Z. Electric Vehicle Charging Infrastructure and Charging Technologies. Haditechnika 2020, 54, 8–12. [Google Scholar] [CrossRef]
- Krishnan, G.; Mohammed Afsal, M.; Soby, E. College of Engineering Trivandrum. Smart Grid Implementation in India with HVDC Transmission and MicroGrids. Int. J. Eng. Res. Technol. 2017, 6, 383–388. [Google Scholar] [CrossRef]
- Khan, M.S.A.W.; Ahmad, F.; Ahmad, A.; Alam, M.S. Feasibility Analysis of Electric Vehicle Charging Infrastructure Deployment in India. India Smart Grid Forum Week 2017, 487, 123–129. [Google Scholar]
- Al Wahedi, A.; Bicer, Y. Development of an Off-Grid Electrical Vehicle Charging Station Hybridized with Renewables Including Battery Cooling System and Multiple Energy Storage Units. Energy Rep. 2020, 6, 2006–2021. [Google Scholar] [CrossRef]
- De Simone, D.; Piegari, L. Integration of Stationary Batteries for Fast Charge EV Charging Stations. Energies 2019, 12, 4638. [Google Scholar] [CrossRef] [Green Version]
- Di Benedetto, M.; Ortenzi, F.; Lidozzi, A.; Solero, L. Design and Implementation of Reduced Grid Impact Charging Station for Public Transportation Applications. World Electric. Veh. J. 2021, 12, 28. [Google Scholar] [CrossRef]
- Badea, G.; Felseghi, R.-A.; Varlam, M.; Filote, C.; Culcer, M.; Iliescu, M.; Răboacă, M. Design and Simulation of Romanian Solar Energy Charging Station for Electric Vehicles. Energies 2018, 12, 74. [Google Scholar] [CrossRef] [Green Version]
- Tze Wood, C. Design of Electric Vehicle Charging Station in Macau. J. Asian Electric. Veh. 2011, 9, 1453–1458. [Google Scholar]
- Mouli, G.C.; Bauer, P.; Zeman, M. System design for a solar powered electric vehicle charging station for workplaces. Appl. Energy 2016, 168, 434–443. [Google Scholar] [CrossRef] [Green Version]
- Goldin, E.; Erickson, L.; Natarajan, B.; Brase, G.; Pahwa, A. Solar Powered Charge Stations for Electric Vehicles. Environ. Prog. Sustain. Energy 2013, 33, 1298–1308. [Google Scholar] [CrossRef] [Green Version]
- Kongjeen, Y.; Yenchamchalit, K.; Bhumkittipich, K. Optimal Sizing and Placement of Solar Powered Charging Station under EV Loads Penetration Using Artificial Bee Colony Technique. In Proceedings of the 2018 International Power Electronics Conference (IPEC-Niigata 2018 -ECCE Asia), Niigata, Japan, 20–24 May 2018. [Google Scholar]
- Mohamed, K.; Wolde, H.K.; Alarefi, S.M.S. Optimal Space Utilisation for Solar Powered EV Charging Station. In Proceedings of the 2020 6th IEEE International Energy Conference (ENERGYCon), Gammarth, Tunisia, 28 September–1 October 2020. [Google Scholar]
- Zhao, H.; Burke, A. An Intelligent Solar Powered Battery Buffered EV Charging Station with Solar Electricity Forecasting and EV Charging Load Projection Functions. In Proceedings of the 2014 IEEE International Electric Vehicle Conference (IEVC), Florence, Italy, 17–19 December 2014. [Google Scholar]
- Martin. Sustainable Development Goals Kick off with Start of New Year. Available online: https://www.un.org/sustainabledevelopment/blog/2015/12/sustainable-development-goals-kick-off-with-start-of-new-year/ (accessed on 9 July 2021).
- Ghosh, A. Possibilities and Challenges for the Inclusion of the Electric Vehicle (EV) to Reduce the Carbon Footprint in the Transport Sector: A Review. Energies 2020, 13, 2602. [Google Scholar] [CrossRef]
- Ayob, A.; Mohd Faizal Wan Mahmood, W.; Mohamed, A.; Zamri Che Wanik, M.; Mohd Siam, M.; Sulaiman, S.; Hanifah Azit, A.; Azrin Mohamed Ali, M. Review on Electric Vehicle, Battery Charger, Charging Station and Standards. Res. J. Appl. Sci. Eng. Technol. 2014, 7, 364–373. [Google Scholar] [CrossRef]
- Singh, B.B.; Sharma, R.N.; Gill, J.P.S.; Aulakh, R.S.; Bangah, S. Climate Change, Zoonoses and India: -EN- -FR- Le Changement Climatique et Les Zoonoses En Inde -ES- Cambio Climático y Zoonosis En La India. Rev. Sci. Tech. 2011, 30, 779–788. [Google Scholar] [CrossRef] [PubMed]
- Solar Resource Maps and GIS Data for 200+ Countries. Available online: https://solargis.com/maps-and-gis-data/download/india (accessed on 8 July 2021).
- Available online: https://weatherspark.com/ (accessed on 8 July 2021).
- Pawar, N.; Nema, P. Optimum Sizing of PV Solar Based Standalone Energy System. In Proceedings of the 2020 International Conference on Inventive Computation Technologies (ICICT), Coimbatore, India, 26–28 February 2020. [Google Scholar]
- Kumar, R.; Rajoria, C.S.; Sharma, A.; Suhag, S. Design and Simulation of Standalone Solar PV System Using PVsyst Software: A Case Study. Mater. Today 2020, 46, 5322–5328. [Google Scholar] [CrossRef]
- Yadav, P.; Kumar, N.; Chandel, S.S. Simulation and Performance Analysis of a 1kWp Photovoltaic System Using PVsyst. In Proceedings of the 2015 International Conference on Computation of Power, Energy, Information and Communication (ICCPEIC), Melmaruvathur, India, 22–23 April 2015. [Google Scholar]
- Tata Nexon EV—The Electric Compact SUV in India Powered by Ziptron. Available online: https://nexonev.tatamotors.com/?id=home (accessed on 9 July 2021).


| Charging Type | Level 1 | Level 2 | Direct Current (DC) Fast |
|---|---|---|---|
| Charging time (h) | 20 to 22 | 6 to 8 | 0.2 to 0.5 |
| Charger location | On-board (1 phase) | On-board (1 or 3 phase) | Off-board (3 phase) |
| Voltage supply (V) | 120 | 240 | 208 to 600 |
| Power level (kW) | 1.3 to 1.9 | up to 19.2 | 50 to 150 |
| Travel range | 2–5 miles/h of charging | 10–20 miles/h of charging | 60–80 miles in <30 min |
| Primary Use | Residential charging | Residential and public charging | Public charging |
| Charger Type | Charger Connector | Rated Output Voltage (V) | No. of Connector Guns | Charging Vehicle Type (W-Wheeler) |
|---|---|---|---|---|
| Fast | Combined charging system (CCS) (Min 50 kW) | 200–750 or higher | 1 | 4W |
| Charge de move (CHAdeMO) (Min 50 kW) | 200–500 or higher | 1 | 4W | |
| Type-2 alternating current (AC) (Min 22 kW) | 380–415 | 1 | 4W, 3W, 2W | |
| Slow/moderate | BHARAT DC-001 (15 kW) | 48 | 1 | 4W, 3W, 2W |
| BHARAT DC-001 (15 kW) | 72 or higher | 1 | 4W | |
| BHARAT AC-001 (10 kW) | 230 | 3 of 3.3 kW each | 4W, 3W, 2W |
| City | Maximum Ambient Temperature (°C) | Minimum Ambient Temperature (°C) | Month with Maximum. Global Radiation (kWh/m2) | Month with Maximum Linke Turbidity Factor | Annual Average Number of Full Sun Hours (kWh/kWp) |
|---|---|---|---|---|---|
| Ladakh | 15 | −14 | June: 215 | April: 2.751 | 5.2 |
| Delhi | 44 | 5 | May: 220 | April–August, October–November: 7.0 | 4.0 |
| Tawang | 24 | −3 | June: 170 | April: 4.59 | 3.6 |
| Jaisalmer | 43 | 8 | May: 220 | April–August: 7 | 4.6 |
| Chennai | 40 | 20 | March: 197 | May: 6.594 | 4.4 |
| Bengaluru | 37 | 13 | March: 210 | May: 5.395 | 4.2 |
| Battery Parameters | |
|---|---|
| Technology | Lithium ion |
| Nominal Voltage (V) | 25.6 |
| Capacity at C10 in Ampere hour (Ah) | 180 |
| DoD | 95% |
| Life at 95% DoD (years) | 5 |
| System Technical Specifications | |||||
|---|---|---|---|---|---|
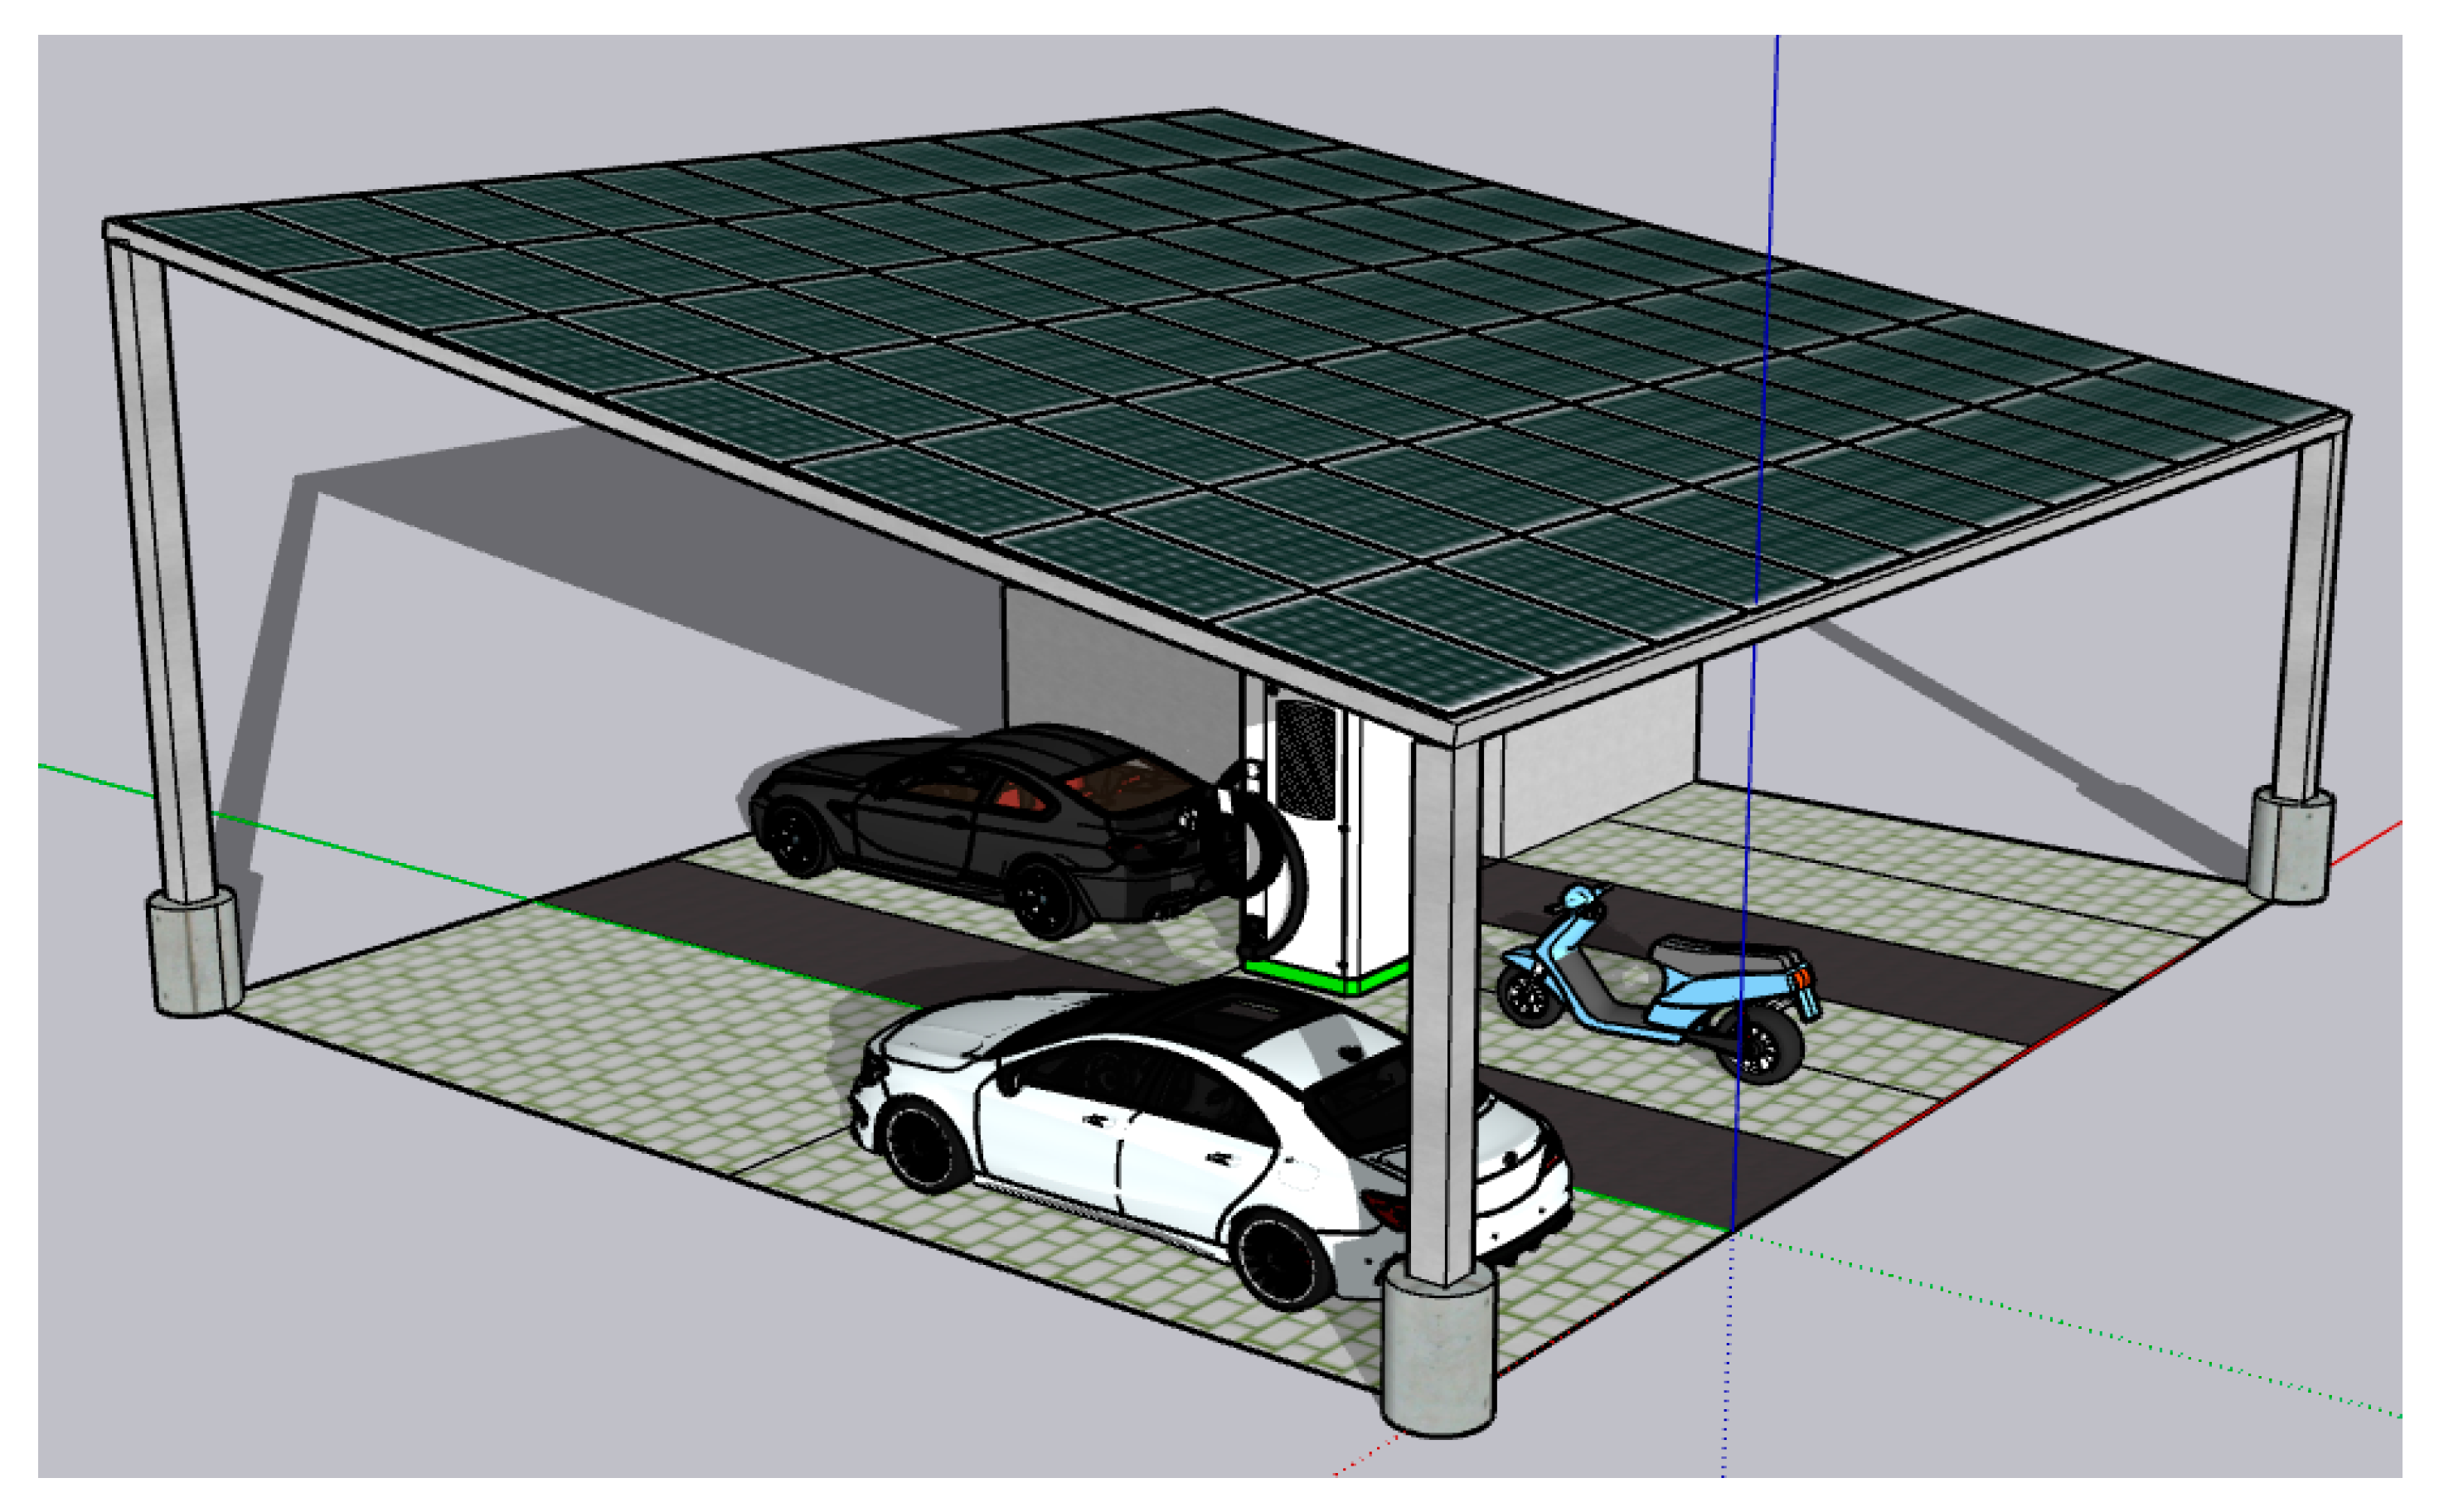
| Station Structure | PV Array | Orientation | |||
| Structure | Carport | Total capacity | 8.1 kWp | Tilt | 10 degrees |
| Area | 80 m2 | Module wattage | 325 Wp | Azimuth | 0 degrees for simulation (south facing) |
| Battery Bank | Charging Conditions | Load Profile | |||
| Autonomy | 2 days | Category | Level-2 DC charging | Daily load | 60 kWh |
| Technology | Lithium ion | Charger | BHARAT DC-001 | Hourly load | 2.5 kW per hour |
| DoD | 95% | System voltage | 240 V DC | Profile | Constant |
| Life | 5 years | ||||
| Capacity | 540 Ah/129.6 kWh | ||||
| System Type | Investment Cost over 20 Years (INR) (Assuming No Inflation & Depreciation) | Total Distance in 20 Years in km (Considering Tawang’s Data) | Investment Cost Per Unit Distance (INR/km) |
|---|---|---|---|
| 8.1 kWp (monocrystalline array) | 6,022,050 | 1,485,660 | 4.05 |
| 8.1 kWp (polycrystalline array) | 5,997,675 | 1,465,728 | 4.09 |
| Gasoline stations | 7,428,300 (Gasoline cost) | 1,485,660 | 5 (can go up to 7 if station cost is included) |
| City | November–January | February–April | May–June | July–October |
|---|---|---|---|---|
| Ladakh | Low ambient temperature Shorter days High atmospheric turbidity Sun path near horizon Dense cloud cover | Low solar radiation Less atmospheric turbidity Low ambient temperature Moderate-dense cloud cover | Low ambient temperature Less atmospheric turbidity High solar radiation Longer days Sun path near the zenith Sparse cloud cover | Low ambient temperature Less atmospheric turbidity Sparse cloud cover |
| Delhi | Low ambient temperature Low solar radiation High atmospheric turbidity Shorter days Sun path near horizon | Low atmospheric turbidity Higher solar radiation | High solar radiation High ambient temperature Longer days Sun path near the zenith | Decrease in ambient temperature Moderate-high atmospheric turbidity Dense cloud cover |
| Tawang | Low ambient temperature Low solar radiation Shorter days Sun path towards the horizon Sparse cloud cover | Increase in solar radiation Ambient temperature near STC limit Sparse cloud cover | High solar radiation Longer days Ambient temperature close to STC limit Sun path near the zenith Moderate cloud cover | Low solar radiation Ambient temperature close to STC limit Dense cloud cover |
| Jaisalmer | Low ambient temperature Shorter days Sun path near the horizon Sparse cloud cover | Less atmospheric turbidity High ambient temperature Sparse cloud cover | High solar radiation Less atmospheric turbidity High ambient temperature Longer days Sun path near the zenith Sparse cloud cover | Less-moderate atmospheric turbidity Slight decrease in ambient temperature Sparse-moderate cloud cover |
| Chennai | High atmospheric turbidity Ambient temperature slightly above STC limit Sun path in southern sky close to zenith Dense cloud cover Shorter days | Moderate-dense cloud cover High solar radiation High atmospheric turbidity | Dense cloud cover High solar radiation Sun path in the northern sky close to the zenith High ambient temperature | Dense cloud cover High atmospheric turbidity Moderate-high ambient temperature |
| Bengaluru | Moderate atmospheric turbidity Shorter days Partially cloudy sky Temperatures below the STC limit Sun path in the southern sky close to the zenith | High ambient temperatures Sun path vertical to the PV plane Dense cloud cover | Moderate ambient temperature Sun path in northern sky close to the zenith Longer days Dense cloud cover | Slight decrease in ambient temperature Sun path in southern sky close to the zenith Dense cloud cover |
Publisher’s Note: MDPI stays neutral with regard to jurisdictional claims in published maps and institutional affiliations. |
© 2021 by the authors. Licensee MDPI, Basel, Switzerland. This article is an open access article distributed under the terms and conditions of the Creative Commons Attribution (CC BY) license (https://creativecommons.org/licenses/by/4.0/).
Share and Cite
Singh, A.; Shaha, S.S.; G, N.P.; Sekhar, Y.R.; Saboor, S.; Ghosh, A. Design and Analysis of a Solar-Powered Electric Vehicle Charging Station for Indian Cities. World Electr. Veh. J. 2021, 12, 132. https://doi.org/10.3390/wevj12030132
Singh A, Shaha SS, G NP, Sekhar YR, Saboor S, Ghosh A. Design and Analysis of a Solar-Powered Electric Vehicle Charging Station for Indian Cities. World Electric Vehicle Journal. 2021; 12(3):132. https://doi.org/10.3390/wevj12030132
Chicago/Turabian StyleSingh, Aanya, Shubham Sanjay Shaha, Nikhil P G, Yendaluru Raja Sekhar, Shaik Saboor, and Aritra Ghosh. 2021. "Design and Analysis of a Solar-Powered Electric Vehicle Charging Station for Indian Cities" World Electric Vehicle Journal 12, no. 3: 132. https://doi.org/10.3390/wevj12030132
APA StyleSingh, A., Shaha, S. S., G, N. P., Sekhar, Y. R., Saboor, S., & Ghosh, A. (2021). Design and Analysis of a Solar-Powered Electric Vehicle Charging Station for Indian Cities. World Electric Vehicle Journal, 12(3), 132. https://doi.org/10.3390/wevj12030132