3. Case Study Introduction, Survey Outcome and Methodology
To validate our hypothesis in
Section 1, it was necessary to underpin the investigation by generating valid data using a robust method of measuring the anxiety levels experienced by two archetypal EV drivers [
48]—one experienced in EV driving for more than a year and one completely inexperienced in EV driving. We illustrate the complete trip and driver profile in
Section 1.3,
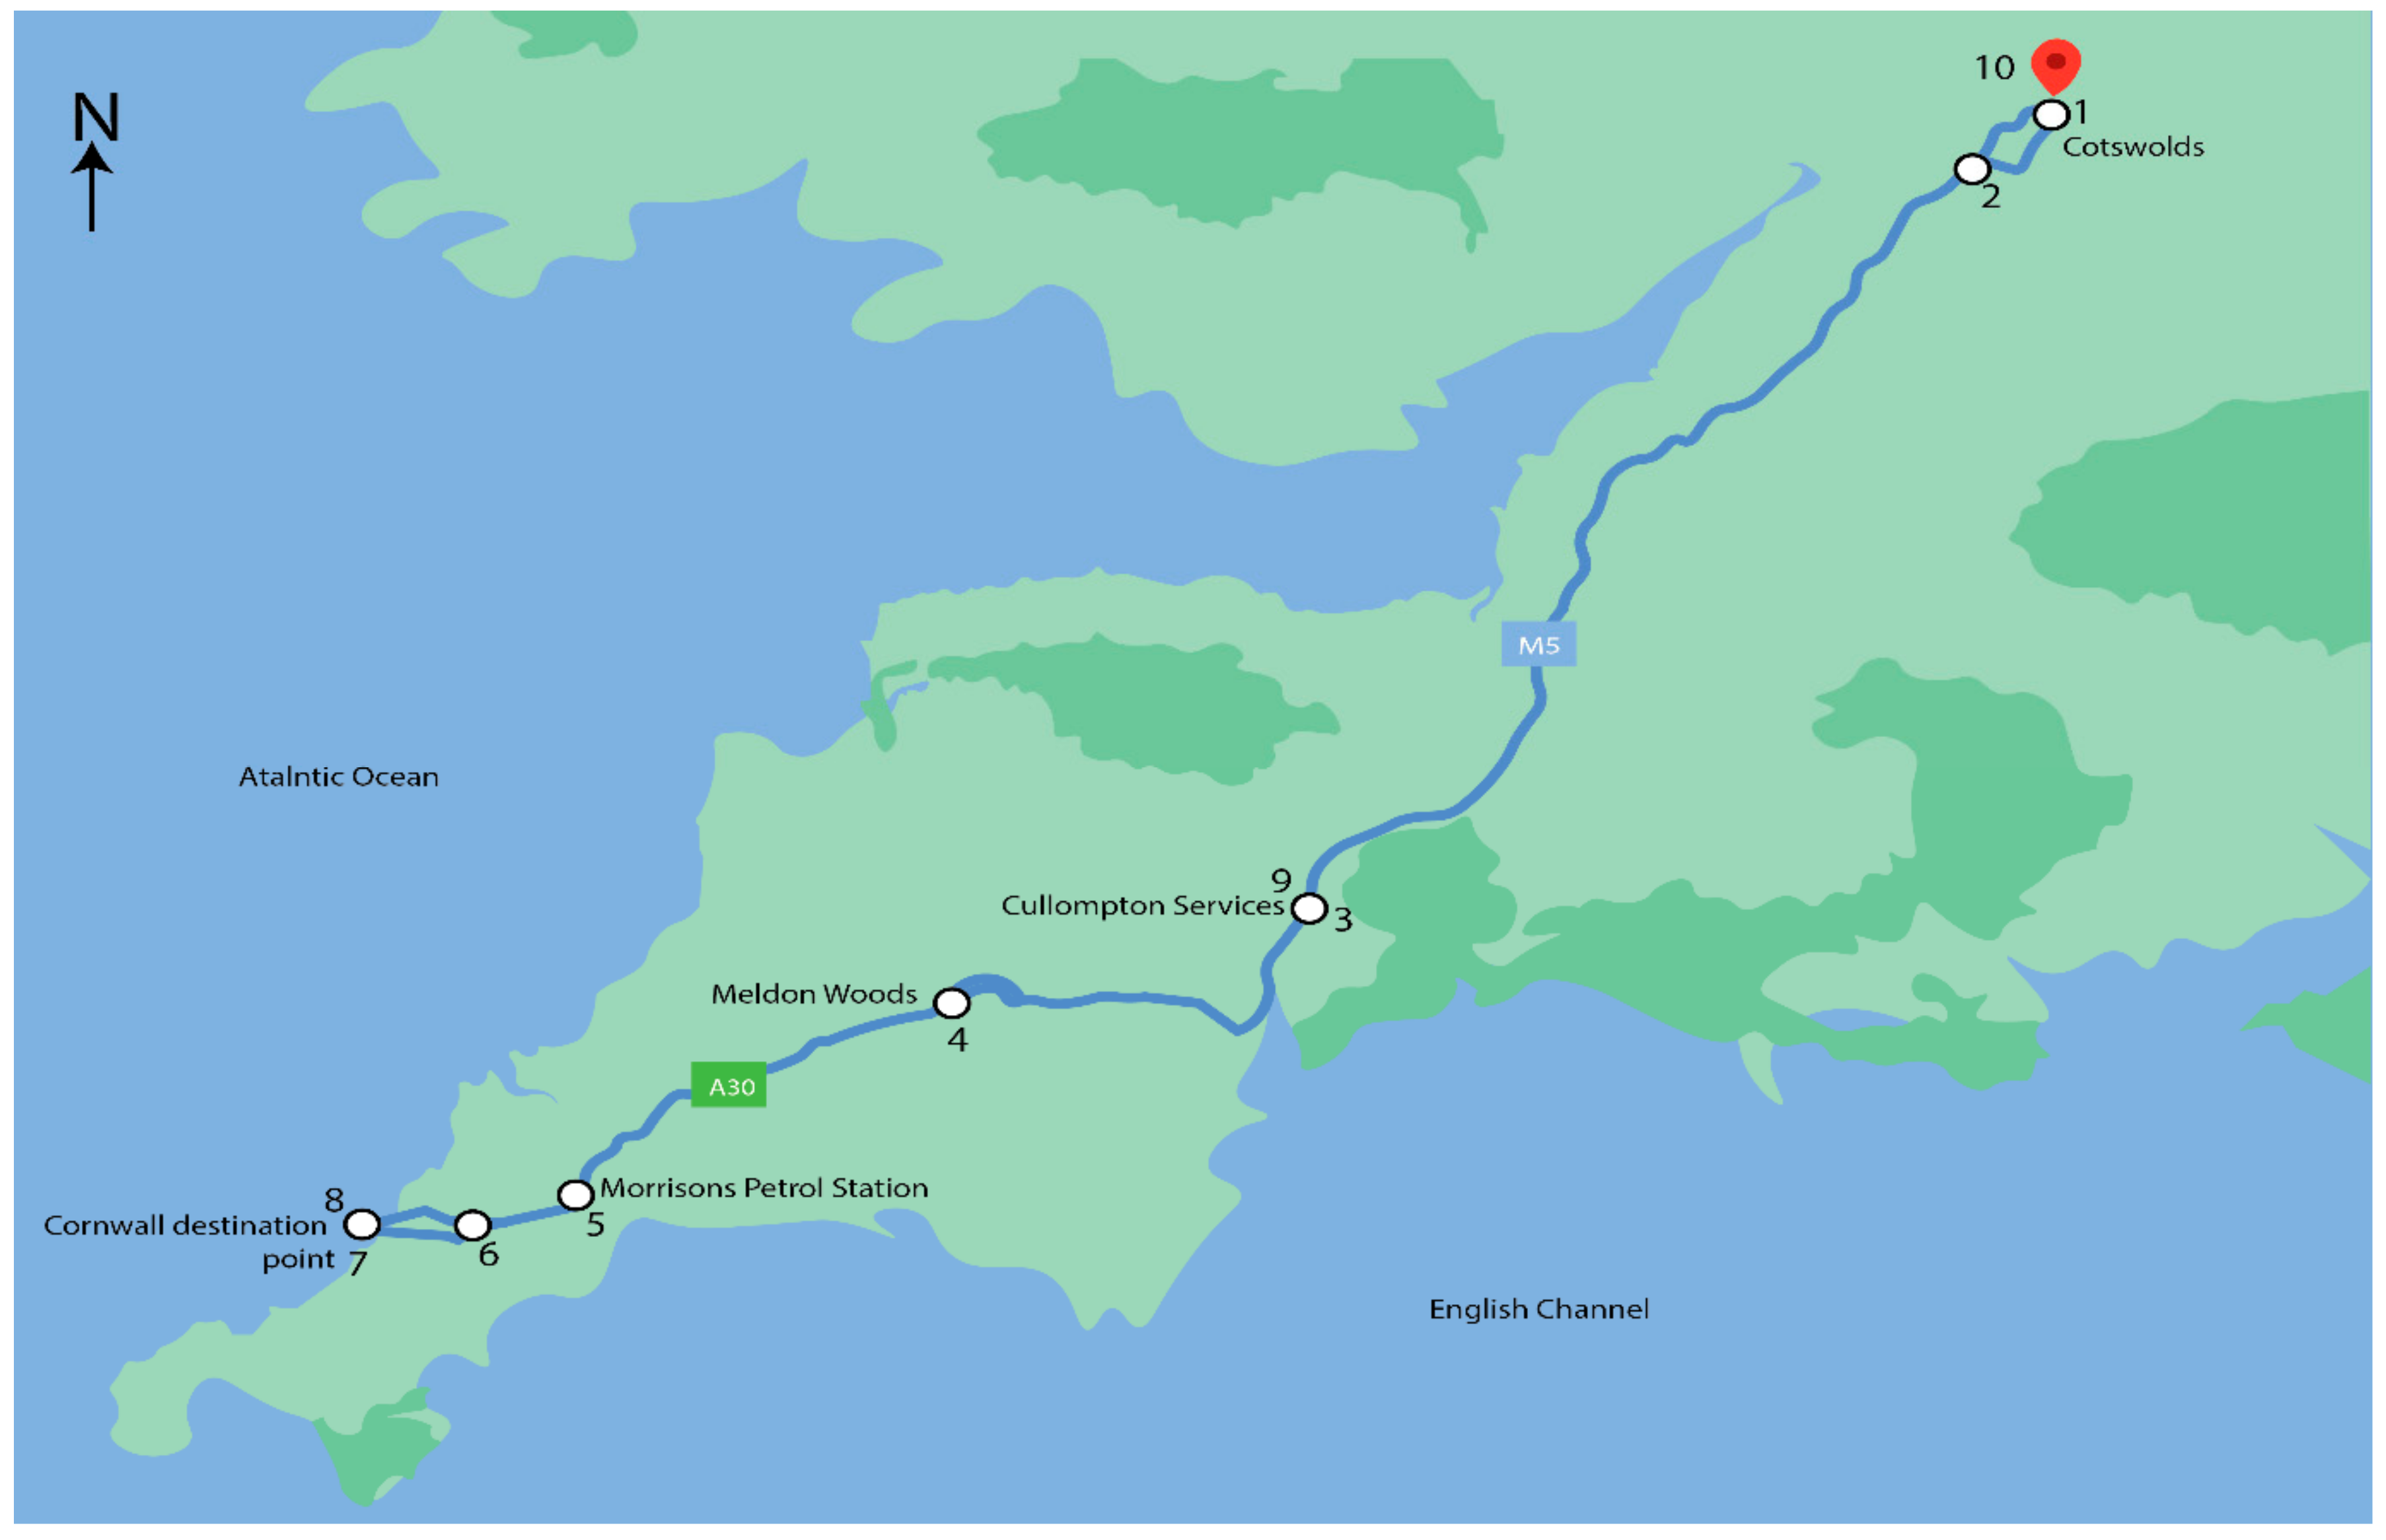
Table 1. We first benchmarked each investigation using two separate routes shown in
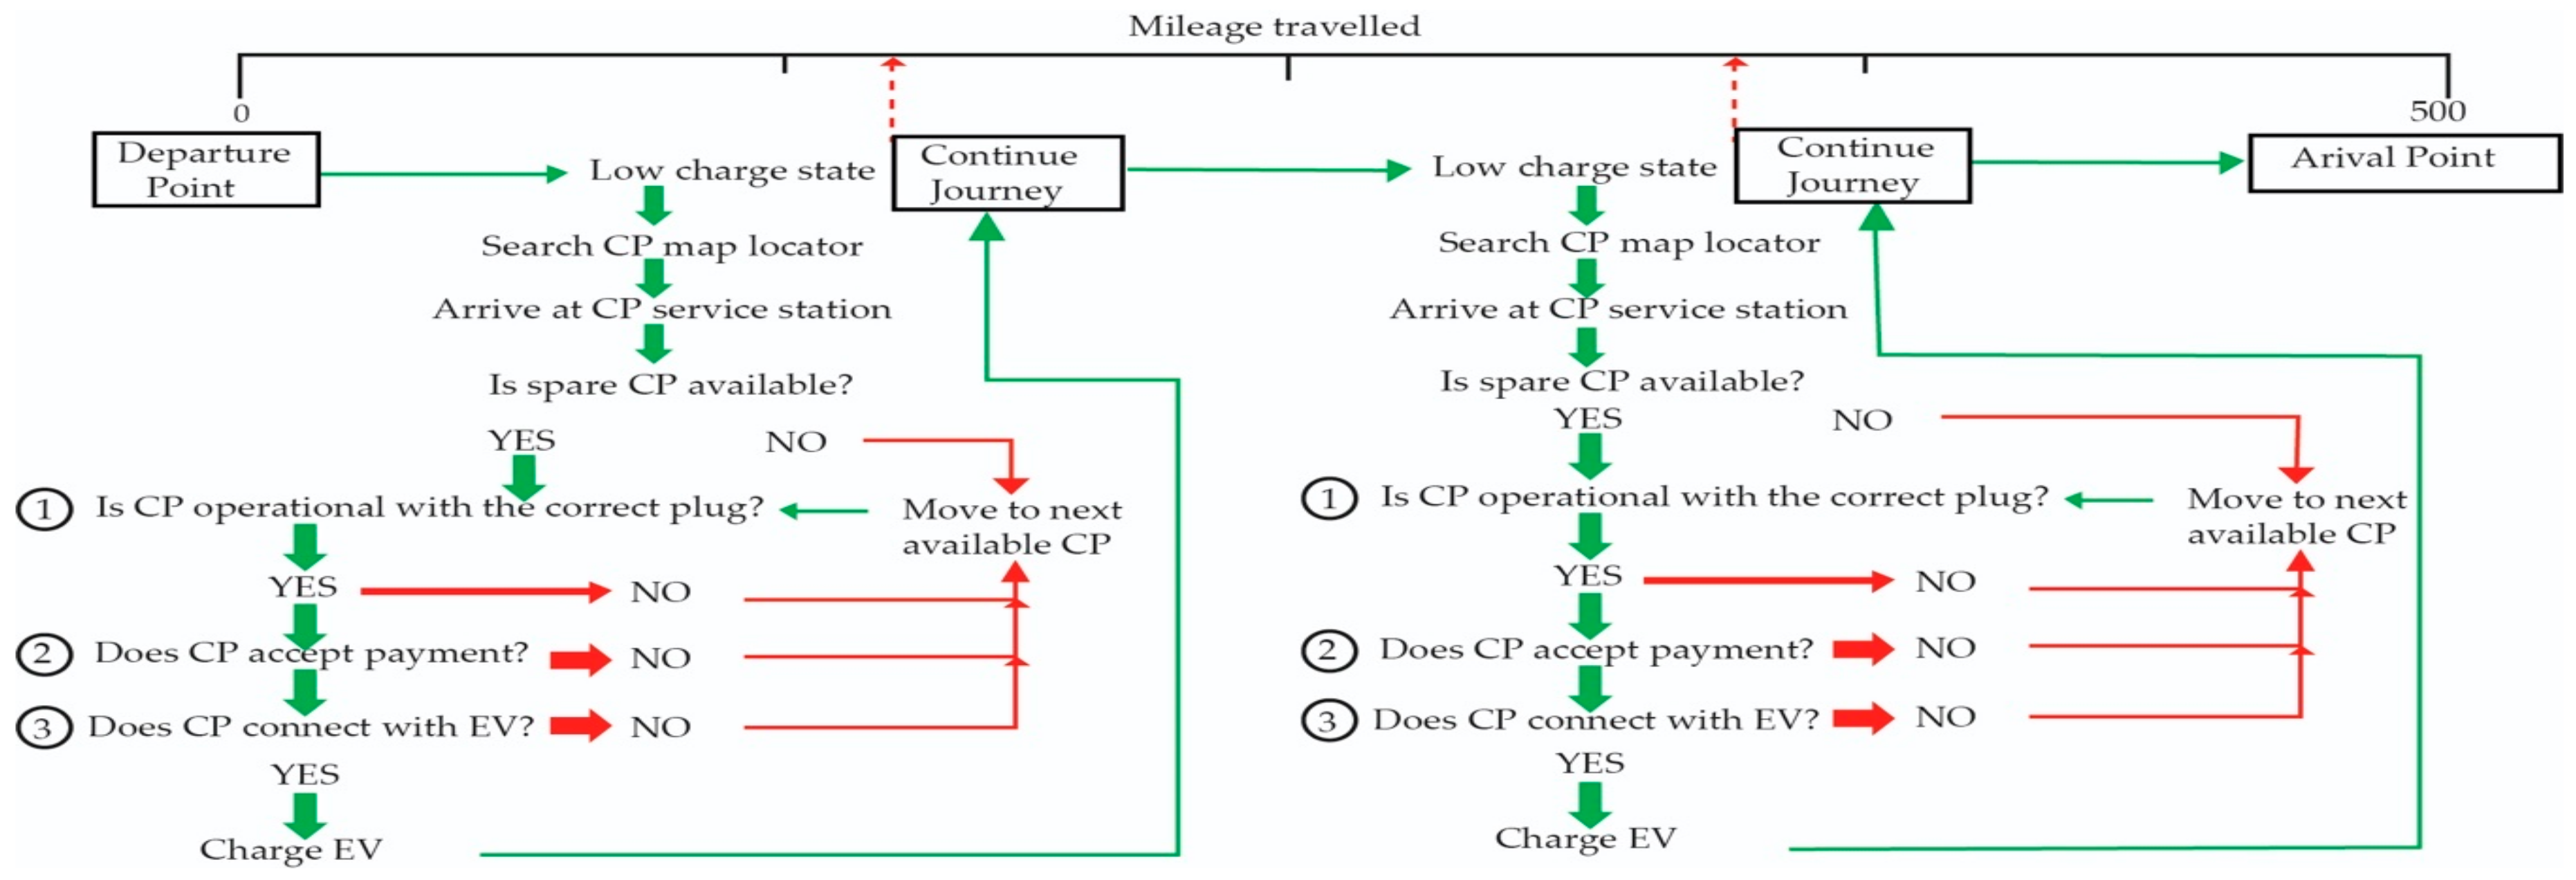
Figure 3 and
Figure 4 by employing a novice EV driver. This methodology created a map of novice EV driver situational anxiety markers, and these pinch points were subsequently used for anxiety measurements in each successive case study. Full details of why these points resulted in high anxiety levels are detailed in
Appendix A. There were more marker points on the outward journeys due to several forced stops to recharge, due to either faulty chargers, inability to pay by card or charge point closed, detailed in
Appendix A. On the return journeys, each driver learned which charging stations were operative with a card payment facility, thus negating the same number of stops and subsequently raised anxiety levels.
At the start point, finish point, and each intermediate stop, the driver’s heart rate was monitored by an Apple smartwatch worn by each driver throughout every trip. The watch measured real-time BPM heart rate beats per minute (BPM) and stored on a cloud-based server, updated each minute. We chose the FDA approved heart rate monitor Apple Series 4 smartwatch with an integrated heart monitor app. The Apple Watch Series 4 employs two light sensors to track the user’s heart rate using photoplethysmography (PPG) in blood in peripheral circulation [
49]. PPG is deemed medical grade and accurately measures heart rate in normal sinus rhythm with a 96% efficacy rate by employing a simple optical process that detects changes in volumetric variations or pulses in blood [
50]. Although not a clinical precision instrument, it was deemed appropriate for each of the five case studies. Furthermore, the literature has recently confirmed Apple Watch accuracy [
51], supporting its efficacy for consumer use.
The effectiveness of using heart rate measurements as an indicator to monitor anxiety has been recognised in a recent paper by Khanade and Sasangohar [
52]. This is considered a vital method to observe the state of anxiety, PTSD, and other related disorders. Thus, key journey points in each case study (one to four) were ranked by anxiety levels using the measured driver’s heart rate for each significant journey point using data from the driver’s smartwatch heart rate monitor. Case studies five to seven further reinforced our investigation by conducting an alternative route for ICE and EV journeys compared with stage one case studies. As a benchmark, we measured each driver’s resting heart rate the previous day. Both were within the same age range stating that the maximum healthy BPM should be 160 BPM [
53]. In the first three case studies, driver one’s resting BPM rate measured 65, and driver two’s resting rate measured 61. In case studies four and five, the driver’s resting heart rate measured 63 BPM.
We then converted the heart rate data into anxiety levels ranked from 1 to 10, with resting heart rate ranked as 1 in the range of 60–65 BPM up to and including rank 10, which represented 160 BPM or above (
Table 2). All rest stops consisted of either water or decaffeinated tea or coffee to prevent caffeine from artificially increasing the heart rate of both drivers. In addition to caffeine [
54], in new research by Chapman et al. [
45], it was found that sugar or fructose-sweetened drinks can similarly affect heart rate and blood pressure. Hence, the drivers consumed only sugar-free beverages, caffeine-free drinks, or sugar-free snacks during the investigation.
CASE STUDY 1. Route 1.
Round trip from the Cotswolds to Cornwall and back—UK
Vehicle: 2-L diesel compact SUV ICE
Experienced ICE driver
Round trip 430 miles.
Payment method: Apple Pay via iPhone 12 Pro Max
Time to destination: 3 h 42 min. Average speed 58 mph.
Return trip back to the start point: 3 h 55 min. Average speed 55.2 mph.
Date: 17 April 2021.
The first case study plotted a direct round trip. It is replicated in case study two to four to compare the 430-mile journey using a modern diesel-powered ICE SUV with an EV. The ICE vehicle used in case study one and five has an official maximum range of 480 miles per full tank. Despite the ability to complete this round trip without refuelling, the convenience of driving the ICE test vehicle is that it is possible to use almost any service station to refuel. Additionally, drivers can make a simple payment transaction with a contactless smartphone at the pump or payment kiosk.
The researchers used two iPhone® 12 Pro Max smartphones with fully functioning Apple Pay contactless apps set up for these studies. The motive for adopting this payment method is that it is widely accepted at most retail outlets, with more than a quarter of a million UK stores and service stations receiving this form of payment. All drivers were bound by UK, COVID 19 pandemic cashless payment rules and guidelines during this investigation. Additionally, most retail premises took only contactless payments at the time of this investigation, accepting either contactless credit and debit cards, Apple Pay, Samsung Pay, or Google Pay. Neither driver nor passenger took cash or card with them for case study one, two or three. The driver’s heart rate was monitored and uploaded live to an Apple cloud-based server throughout the journey. Correlating anxiety levels were retrospectively accessed to match all key points driven by the EV trips’ events.
The researchers acquired a 2-L diesel medium-sized SUV for case studies one and five. This is a typical long-distance family class vehicle, with a World Harmonised Light Vehicle Test Procedure (WLTP) of 45 mpg consumption, equating to 480 miles on a full fuel tank.
The plotted route was predominantly based on motorways and dual carriageways using ZapMap
® EV rapid charging data [
55]. The route was entered into the in-car satellite navigation from point A in the Cotswolds to point B in Cornwall UK—215 miles. The investigators were confident that the ICE 2 Litre SUV would make the round trip on a single tank of fuel. However, to mitigate any refuelling or payment problems along the route, the drivers erred on the side of caution, deciding that it would be prudent to fill up mid-way on the return leg of the journey to cover any unforeseen en route complications.
The researchers departed the Cotswolds at 07:00 on Saturday, 17 April 2021. The ambient temperature was 12 °C. Two adults were travelling without luggage. The critical points of the journey were recorded using the driver’s heart rate data, and corresponding anxiety levels were entered in the table below in
Table 3.
CASE STUDY 2. Route 1.
Round trip from the Cotswolds to Cornwall and back—UK
Vehicle: VW iD3 pure electric hatchback
Novice EV Driver
Round trip 430 miles.
Payment method: Apple Pay via iPhone 12 Pro Max
Time to destination: 4 hrs 49 min. Average speed: 45 mph (including stops).
Return trip back to the start point: 3 hrs 57 min. Average speed of 54 mph.
Date: 24 April 2021.
The second case study determined whether it was possible to travel a round trip of 430 miles in a modern EV in the same manner and with the same ease as driving conventional petrol or diesel cars (case study one). Again, two iPhone 12 Pro Max smartphones were used for payment on this trip, with fully functioning Apple Pay contactless apps already set up and established for regular use in the UK. Rapid charging locations were selected based on each location’s claim that contactless payment is available in guest mode. Neither driver nor passenger took cash or card with them for this study. A VW iD3 was acquired for this case study since it is a new EV model in the small hatchback family class, and the WLTP range is stated at 264 miles on a full charge.
The drivers plotted an identical route to case study one. The route was predominantly motorway and dual carriageway based on ZapMap
® EV rapid charging data [
55] and entered with a start and finish coordinate using the in-car satellite navigation system from point A in the Cotswolds to point B in Cornwall, a total distance of 215 miles. The investigators were reasonably confident that the VW iD3 would narrowly reach the destination point on a single charge if charging or payment problems were encountered along the route. However, it was still deemed prudent to top-up at the halfway point to cover any unforeseen eventualities that may lie ahead.
The researchers departed the Cotswolds at 16:00 on Saturday, 24 April 2021. The ambient temperature was 15 °C. Two adults were travelling, plus two overnight suitcases. The departure point was just 9 miles from the M5. Critical points of the whole journey were recorded with the driver’s heart rates and corresponding anxiety levels entered in the table, highlighted in
Table 4.
CASE STUDY 3. Route 1.
Round trip from the Cotswolds to Cornwall and back—UK
Vehicle: VW iD3 pure electric hatchback
Novice EV Driver
Round trip 430 miles.
Payment method: Apple Pay via iPhone 12 Pro Max and two contactless credit cards
Time to destination: 4 h 32 min. Average speed: 48 mph (including stops).
Return trip back to the start point: 3 h 57 min. Average speed: 54 mph.
Date: 1 May 2021.
The third case study replicates study two with the addition of access to Apple Pay or contactless credit cards. The researchers anticipated that this trip would produce far lower anxiety levels than study two and produce results comparable to study one. Again, two iPhone 12 Pro Max smartphones were used for payment on this trip, with fully functioning Apple Pay contactless apps already set up, and two contactless credit cards were made available for locations where Apple Pay was not acceptable. Rapid charging locations were selected based on each location’s claim that contactless payment is available in guest mode.
Again, a VW iD3 was used for this case study. The drivers plotted an identical route to case study one and two. The investigators were reasonably confident that the VW iD3 would reach the destination point on a single charge if charging or payment problems were encountered along the route. Although, the drivers planned to top-up at the halfway point to cover any unforeseen eventualities that may lie ahead.
The researchers departed the Cotswolds at 15:30 on Saturday, 1 May 2021. The ambient temperature was 17 °C. Two adults were travelling, plus two overnight cases. The departure point was just 9 miles from the M5. The critical points of the whole journey were recorded with the driver’s heart rates and corresponding anxiety levels entered in the table, highlighted in
Table 5.
CASE STUDY 4. Route 1
Round trip from the Cotswolds to Cornwall and back—UK
Vehicle: VW iD3 pure electric hatchback
Experienced EV Driver
Round trip 430 miles.
Payment method: Apple Pay via iPhone 12 Pro Max and two contactless credit cards
Time to destination: 4 h 32 min. Average speed: 48 mph (including stops).
Return trip back to the start point: 3 h 57 min. Average speed: 54 mph.
Date: 1 May 2021.
The fourth case study replicates study two, with access to Apple Pay® contactless payment app. The researchers anticipated that this trip would produce far lower anxiety levels than study two and three, producing results comparable to study one due to the relatively long EV experience of the driver. Again, two iPhone 12 Pro Max smartphones were used for payment on this trip, with fully functioning Apple Pay contactless apps already set up. Rapid charging locations were selected based on each location’s claim that contactless payment is available in guest mode.
Again, a VW iD3 was used for this case study. The drivers plotted an identical route to case study one, two, and three. The investigators were reasonably confident that the VW iD3 would reach the destination point on a single charge if charging or payment problems were encountered along the route. Although, the driver planned to top-up at the halfway point to cover any unforeseen eventualities that may lie ahead.
The driver and observer departed the Cotswolds at 15:30 on Saturday, 1 May 2021. The ambient temperature was 17 °C. Two adults were travelling, plus two overnight cases. The departure point was just 9 miles from the M5. The critical points of the whole journey were recorded with the driver’s heart rates and corresponding anxiety levels entered in the table, highlighted in
Table 6.
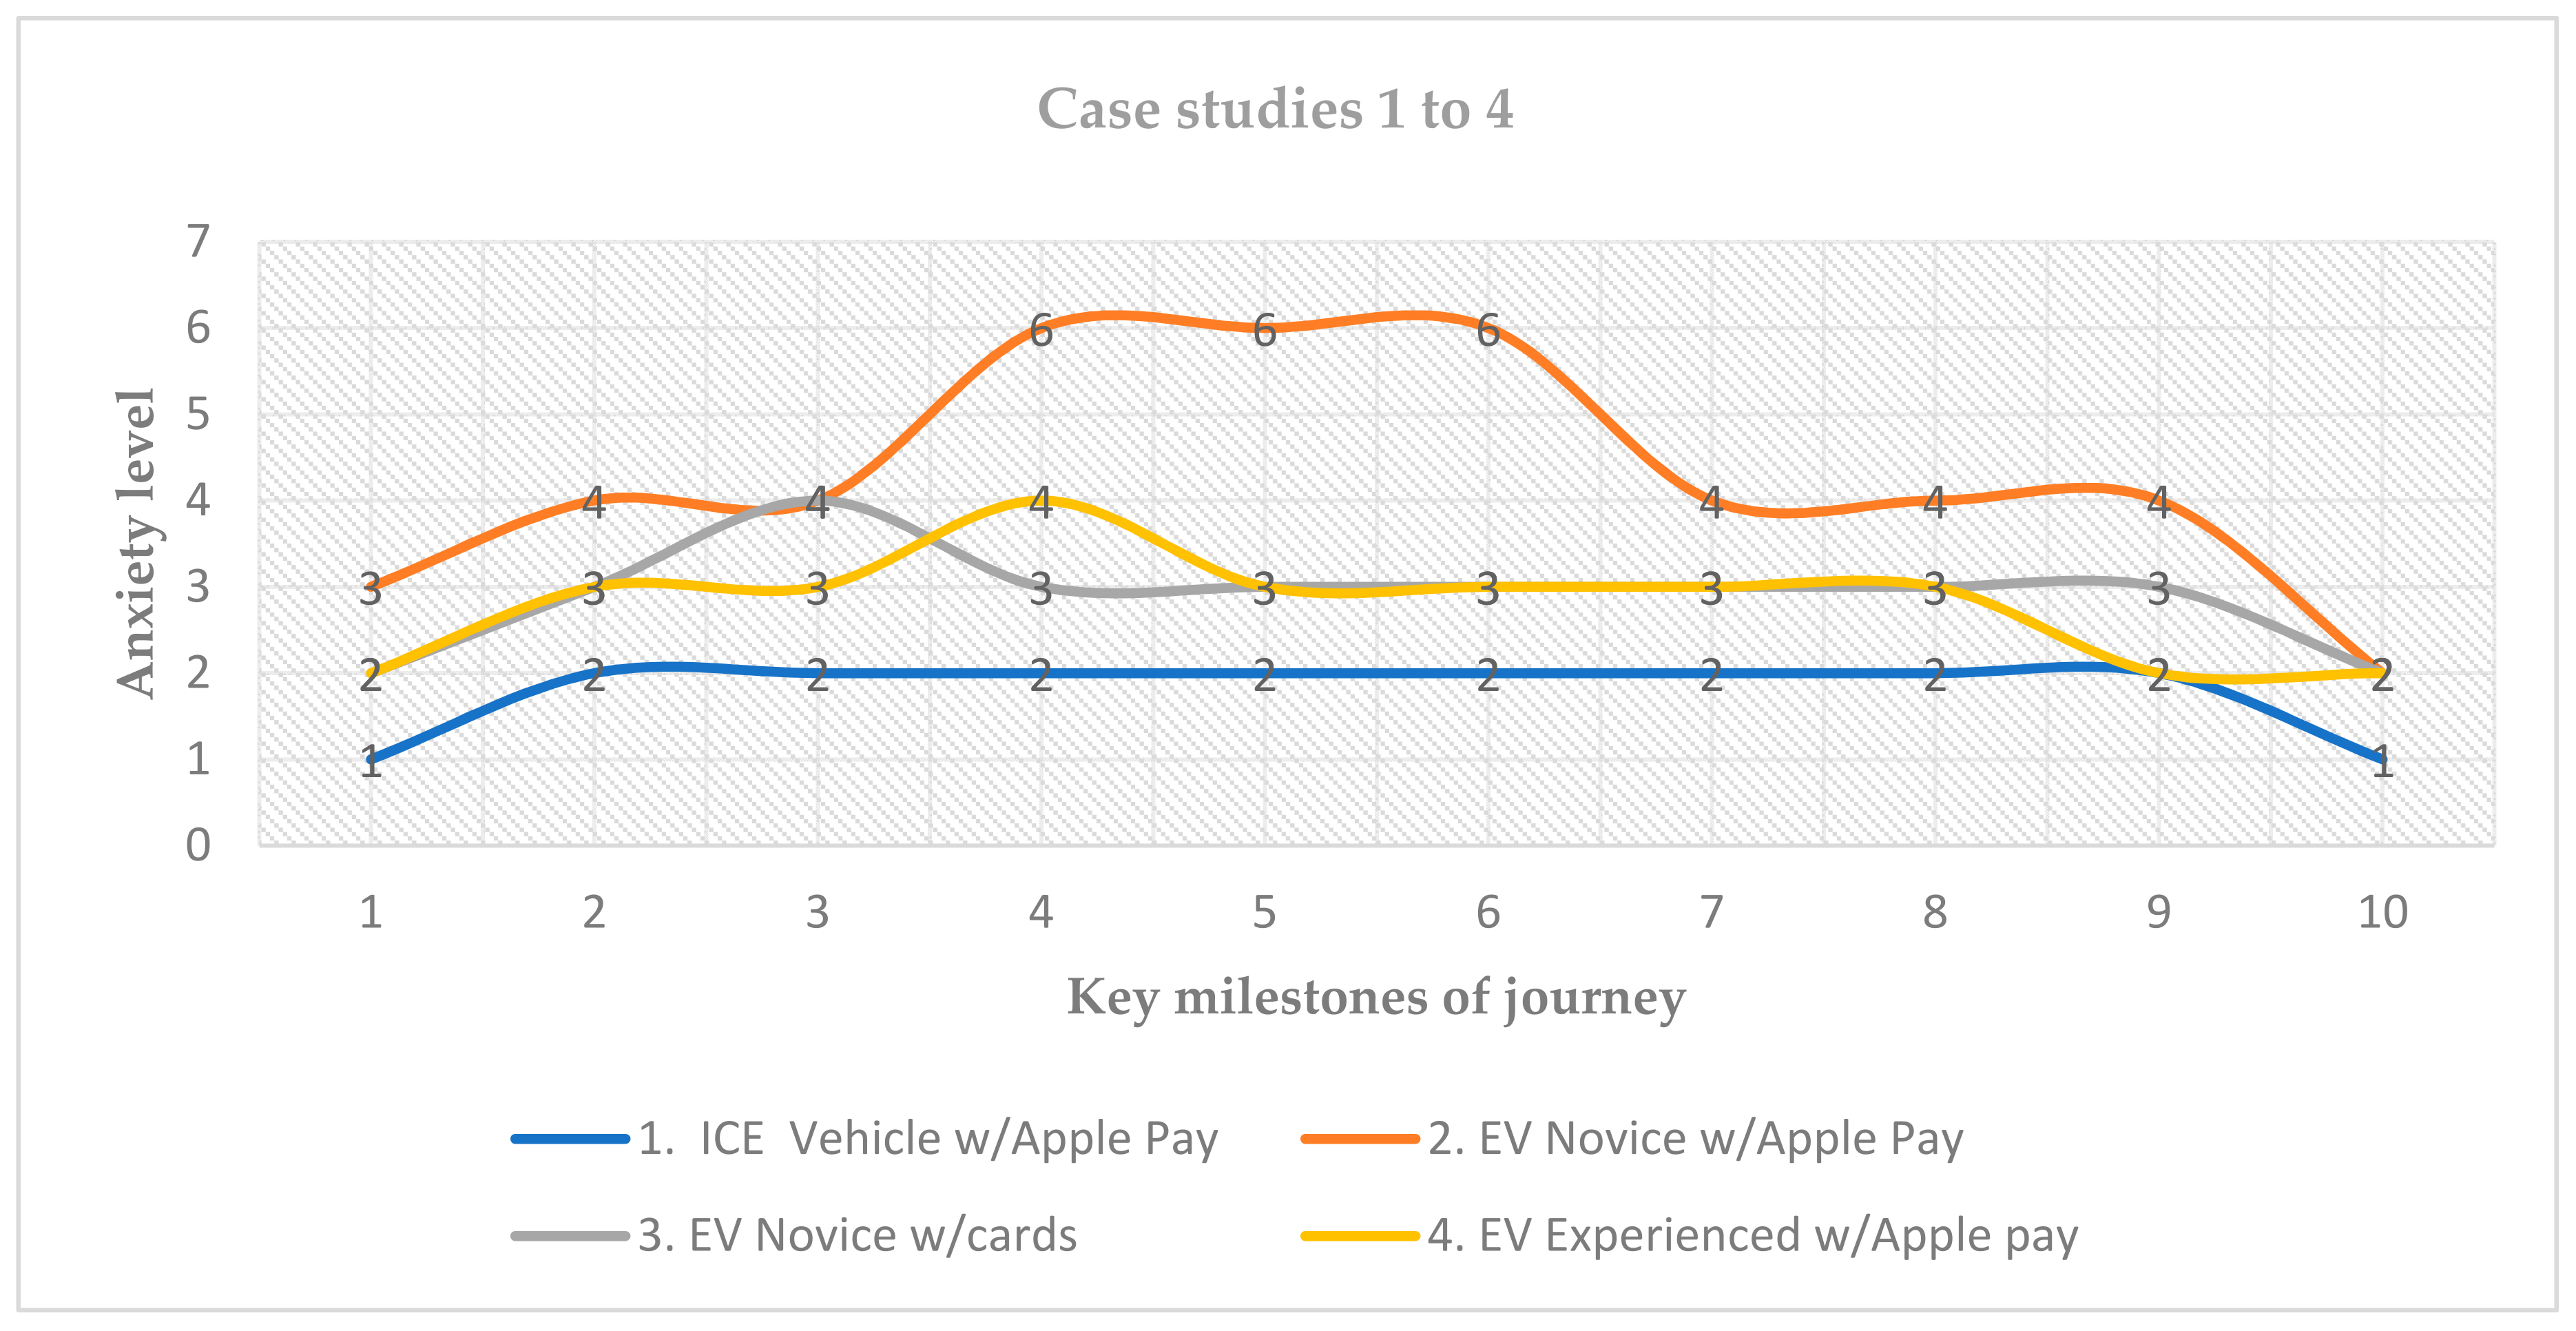
By overlaying all four case studies in a linear representation
Figure 11 (1, 2, 3, and 4), the driver anxiety levels reveal the true extent to which EV charging experiences affect driver anxiety levels compared to the same journey in a traditional ICE vehicle. The extreme EV driver anxiety levels were recorded in case study two. Equipped with only a contactless payment app on a mobile phone, drivers anxiety levels proved to rise to higher levels than study one and three due to rapid charger access and payment issues. We discuss the reasons for differing anxiety levels in
Section 4.
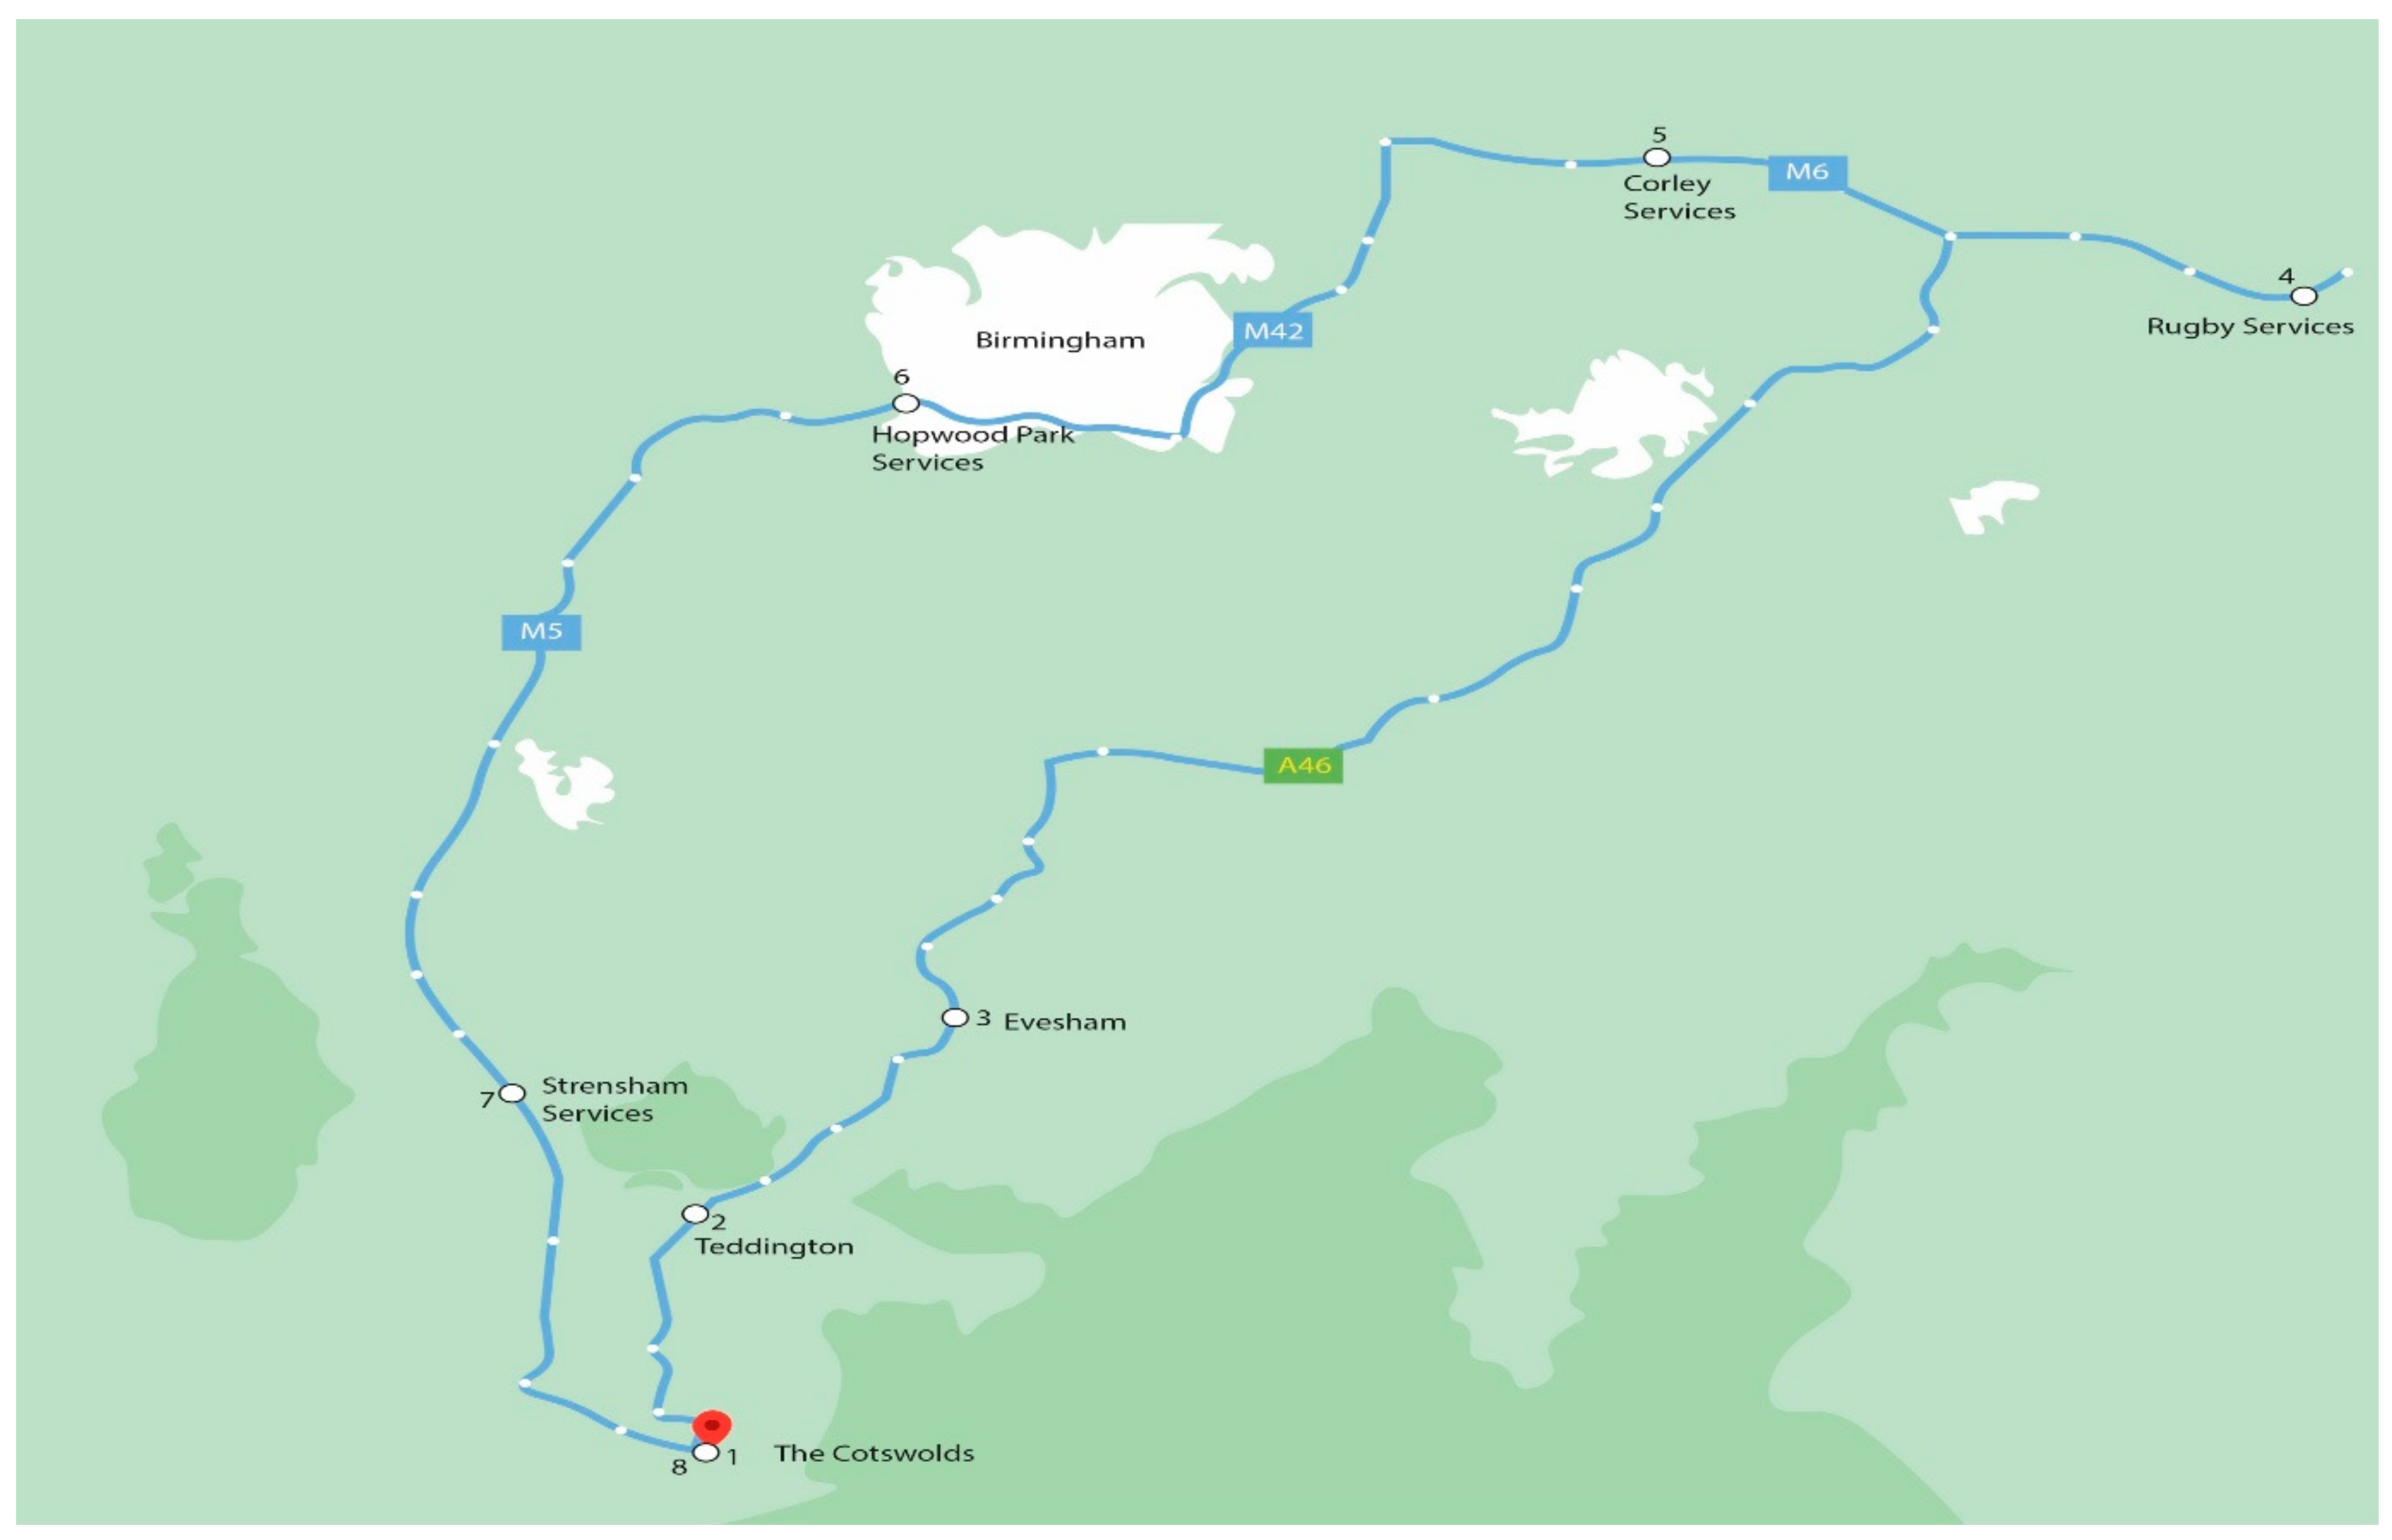
The investigators then planned a route north of the Cotswolds spanning a main A-Class trunk route and three different motorways. The mid-way recharging and refreshment point was a new service station on the M6, hosting traditional refuelling facilities and the UK’s latest cluster of eight ‘available to all’ 350 kW ultra-rapid chargers, plus eight dedicated Tesla superchargers.
CASE STUDY 5. Route 2
Round trip from the Cotswolds to Rugby and back, via Birmingham—UK.
Vehicle: 2-L diesel compact SUV ICE
Experienced ICE Driver
Total distance: 156 miles.
Payment method: Payment method: Apple Pay via iPhone 12 Pro Max
Vehicle range on departure 92 miles
Round trip back to the start point: 2 h 56 min. Average speed of 53.8 mph.
Date: Friday, 14 May 2021.
The fifth case study employs an independent driver and one passenger with the role of researcher-observer. The car in this case study is identical to case study one, a 2-litre diesel compact SUV ICE. The driver was trained in the diesel SUV operation and basic working theory, including familiarity with all controls. Additionally, the driver was fully insured for the research journey before the commencement of the investigation. This study aims to benchmark the route for an ICE vehicle, including the driver’s anxiety level, before carrying out an identical journey in an EV (case study 6). One researcher travelled as a rear seat passenger and monitored the driver’s behaviours associated with using conventional petrol or diesel cars. The driver’s only form of payment was a contactless Apple smartphone using Apple Pay
®. The driver was provided with ZapMap [
55] to plot a break in the journey mid-point for refreshments and fuel top-up and wore an Apple Watch 4 to monitor and measure heartbeat at critical points along the route. These data were then used to measure and correlate anxiety levels throughout the journey.
The driver plotted a new route for a round trip, starting and finishing at the Cotswold start point. The route was predominantly motorway, dual carriageway and A-class trunk roads based on ZapMap
® EV rapid charging data [
55]. The driver entered the start, interim, and finish coordinates using the in-car satellite navigation system from the Cotswolds to Rugby, then past Birmingham and finally returning to the start point in the Cotswolds. The total journey distance was 156 miles. However, the investigators deliberately provided the car to the driver with just a 92-mile range, compelling the driver to refill with diesel at the mid-way point.
The driver and observer departed the Cotswolds at 13:00 h on Friday, 14 May 2021. The ambient temperature was 17 °C. Two adults were travelling, comprising one researcher as an observer and one as a driver. The critical journey points were recorded with corresponding driver heart rates and resultant anxiety levels entered in the table, highlighted in
Table 7.
CASE STUDY 6. Route 2.
Round trip from the Cotswolds to Rugby and back via Birmingham—UK.
Vehicle: VW iD3 pure electric hatchback
Novice EV Driver
Total distance: 156 miles.
Charged range on departure: 88 miles (31% charge)
Payment method: Apple Pay via iPhone 12 Pro Max
Return round trip back to the start point: 3 h 05 min. Average speed: 50 mph.
Date. Tuesday, 18 May 2021
The sixth case study employs one driver entirely new to EVs. The driver was trained in the EV operation and basic working theory, including familiarity with all controls. The driver was fully insured for the research journey before the commencement of the investigation. This study aimed to observe how an experienced driver who has never driven an EV manages a round trip of 156 miles in a modern all-electric vehicle. One researcher travelled as a rear seat passenger and scrutinised any changes in the driver’s habits. As in case study five, the driver’s only form of payment was a contactless Apple smartphone using Apple Pay
®. The driver was provided with ZapMap [
55] to plot a break in the journey mid-point for refreshments and suggested recharge. The driver planned charging options based on each location’s claim that contactless payments were available in PAYG Guest mode.
Again, a VW iD3 was acquired for this case study. The driver used an Apple Watch 4 to monitor and measure heartbeat at critical points along the route. These data were then used to measure and correlate anxiety levels throughout the journey.
The 156-mile route used in case study five was duplicated for this study. The driver entered the start, interim and finish coordinates using the in-car satellite navigation system from the Cotswolds to Rugby, then on to Birmingham and finally returning to the start point in the Cotswolds. The total journey distance was 156 miles. The driver and observer departed the Cotswolds at 13:00 h on Tuesday, 18 May 2021. The ambient temperature was 17 °C. Two adults were travelling, comprising one researcher as an observer and one driver. The critical points for the whole journey were recorded using the drivers heart rates and corresponding anxiety levels entered into the table, detailed in graphical form in
Table 8.
CASE STUDY 7. Route 2.
Round trip from the Cotswolds to Rugby and back via Birmingham—UK.
Vehicle: VW iD3 pure electric hatchback
Experienced EV Driver
Total distance: 156 miles.
Charged range on departure: 86 miles (31% charge)
Payment method: Apple Pay via iPhone 12 Pro Max
Return round trip back to the start point: 3 h 01 min. Average speed: 50 mph.
Date. Wednesday, 19 May 2021
The seventh case study employs one experienced EV driver (D). The driver was trained in the iD3 EV operation and basic working theory, including familiarity with all controls. The driver was fully insured for the research journey before the commencement of the investigation. This study observed how an experienced EV driver manages a round trip of 156 miles in a modern all-electric vehicle. One researcher travelled as a rear seat passenger and scrutinised any changes in the driver’s habits. As in case study six, the driver’s only form of payment was a contactless Apple smartphone using Apple Pay
®. The driver was provided with ZapMap [
55] to plot a break in the journey mid-point for refreshments and suggested recharge. The driver planned rapid charging options based on each location’s claim that contactless payments were available in PAYG Guest mode.
Again, a VW iD3 was acquired for this case study. The driver used an Apple Watch 4 to monitor and measure heartbeat at critical points along the route. These data were then used to measure and correlate anxiety levels throughout the journey.
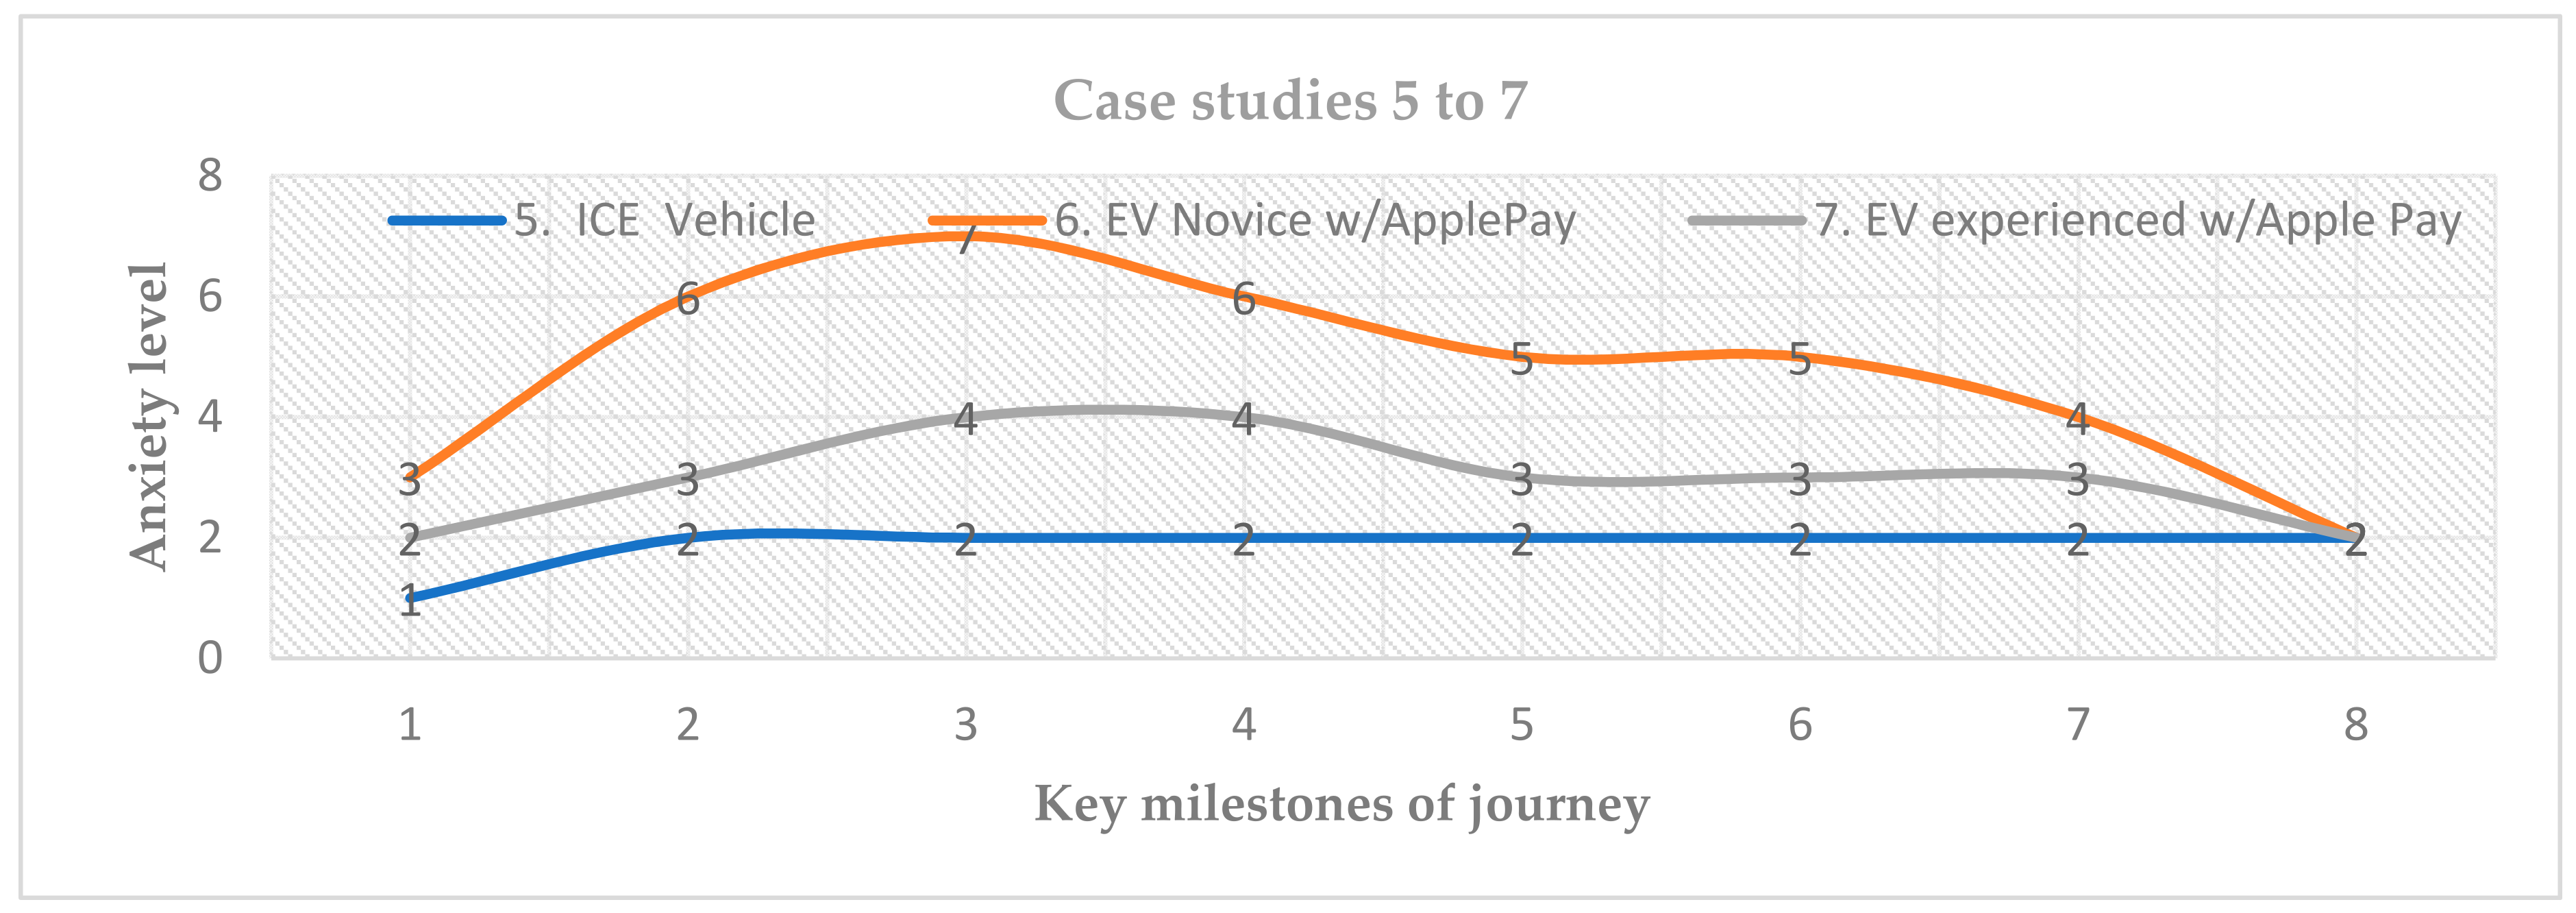
The 156-mile route used in case studies five and six was duplicated for this study. The driver entered the start, interim and finish coordinates using the in-car satellite navigation system from the Cotswolds to Rugby, then on to Birmingham and finally returning to the start point in the Cotswolds. The total journey distance was 156 miles. The driver and observer departed the Cotswolds at 13:00 h on Wednesday, 19 May 2021. The ambient temperature was 16 °C. Two adults were travelling, comprising one researcher as an observer and one driver. The critical points for the whole journey were recorded using the drivers heart rates and corresponding anxiety levels entered into the table, detailed in
Table 9, highlighted in graphical form in
Figure 12, and analysed in
Section 4.
The higher anxiety levels among EV drivers resulting from our seven case studies, highlighted in
Figure 11 and
Figure 12, link with observations and existing data from our previous peer-reviewed study [
7]. A structured survey of 282 EV motorway rapid charging EV users found four main areas contributing negatively towards growth in the EV sector (1) rapid charger geographic locations. (2) charger uptime and operability at point of use, (3) restrictive payment process, and (4) rapid charge cost per kWh.
Table 10 compares the results from our previous survey revealing anxiety levels of EV users ranging from very satisfied to very dissatisfied, all critical issues that correlate directly with the researcher’s findings within the EV long-distance case studies two, three, four, five, and six. The survey results are shown in
Table 10. The authors of [
7] concentrated wholly on the UK motorway and A-Class UK trunk road network. In contrast, the seven new case studies in this research included a mix of over 570 miles of motorways, dual carriageways, and A-class single lane trunk roads.
3.1. Case Study and Recent User Survey Summary Data
It is impossible to precisely reproduce each route due to variables that cannot be replicated on the day. Among the most important of these is ambient temperature, which can adversely affect EV battery use. Other factors may include weather conditions such as wind, rain or snow, and general traffic conditions or disruption, all of which may affect the range of an EV.
3.2. Discussion
In
Table 11 and
Table 12, the case studies reveal that an EV driver’s experience is more traumatic than a conventional ICE vehicle driver, with far higher anxiety levels being measured throughout their journey. This result is supported by recent survey [
7] of drivers across major service stations on the UK network, revealing that most EV drivers considered charge cost, charge point operability, charge point location, payment process, and access were significant areas of dissatisfaction. Our results suggest that CPT exists because of a significant correlation between increased heart rate at key journey points. Moreover, the literature confirms a significant link between heart rate and anxiety levels [
52]. We argue that unless urgent interventions are implemented to alleviate this growing EV user issue, then the introduction of enforced sector regulation to improve overall parity with ICE fuel service stations should be investigated.
4. Results, Analysis, and Discussion
The sample for this study included experienced ICE drivers, novice EV drivers, and an experienced EV driver. The rationale for the mix of driving experience was to monitor and validate any differences between the three categories, travelling the same route under the same conditions, with only driver experience and vehicle type being variables (
Table 1). Heartrate was captured and logged via a cloud-based database, using a 4G mobile link, by the minute throughout each journey.
Before analysing the data, we manually checked the benchmark novice EV drivers BPM as EV range dropped before arriving at each charging station. From the data and noting the driver’s concerns regarding range en route, BPM and anxiety heightened as the EV range lowered before arrival at the charging station on both routes. These data, coupled with the driver’s changing behaviour and growing anxiety, confirmed that, even though modern EVs such as our test car had a range above 260 miles, our novice EV drivers were still experiencing reasonably high levels of range anxiety. This was also confirmed through
t-test correlation analysis that can be observed in detail within
Appendix B.
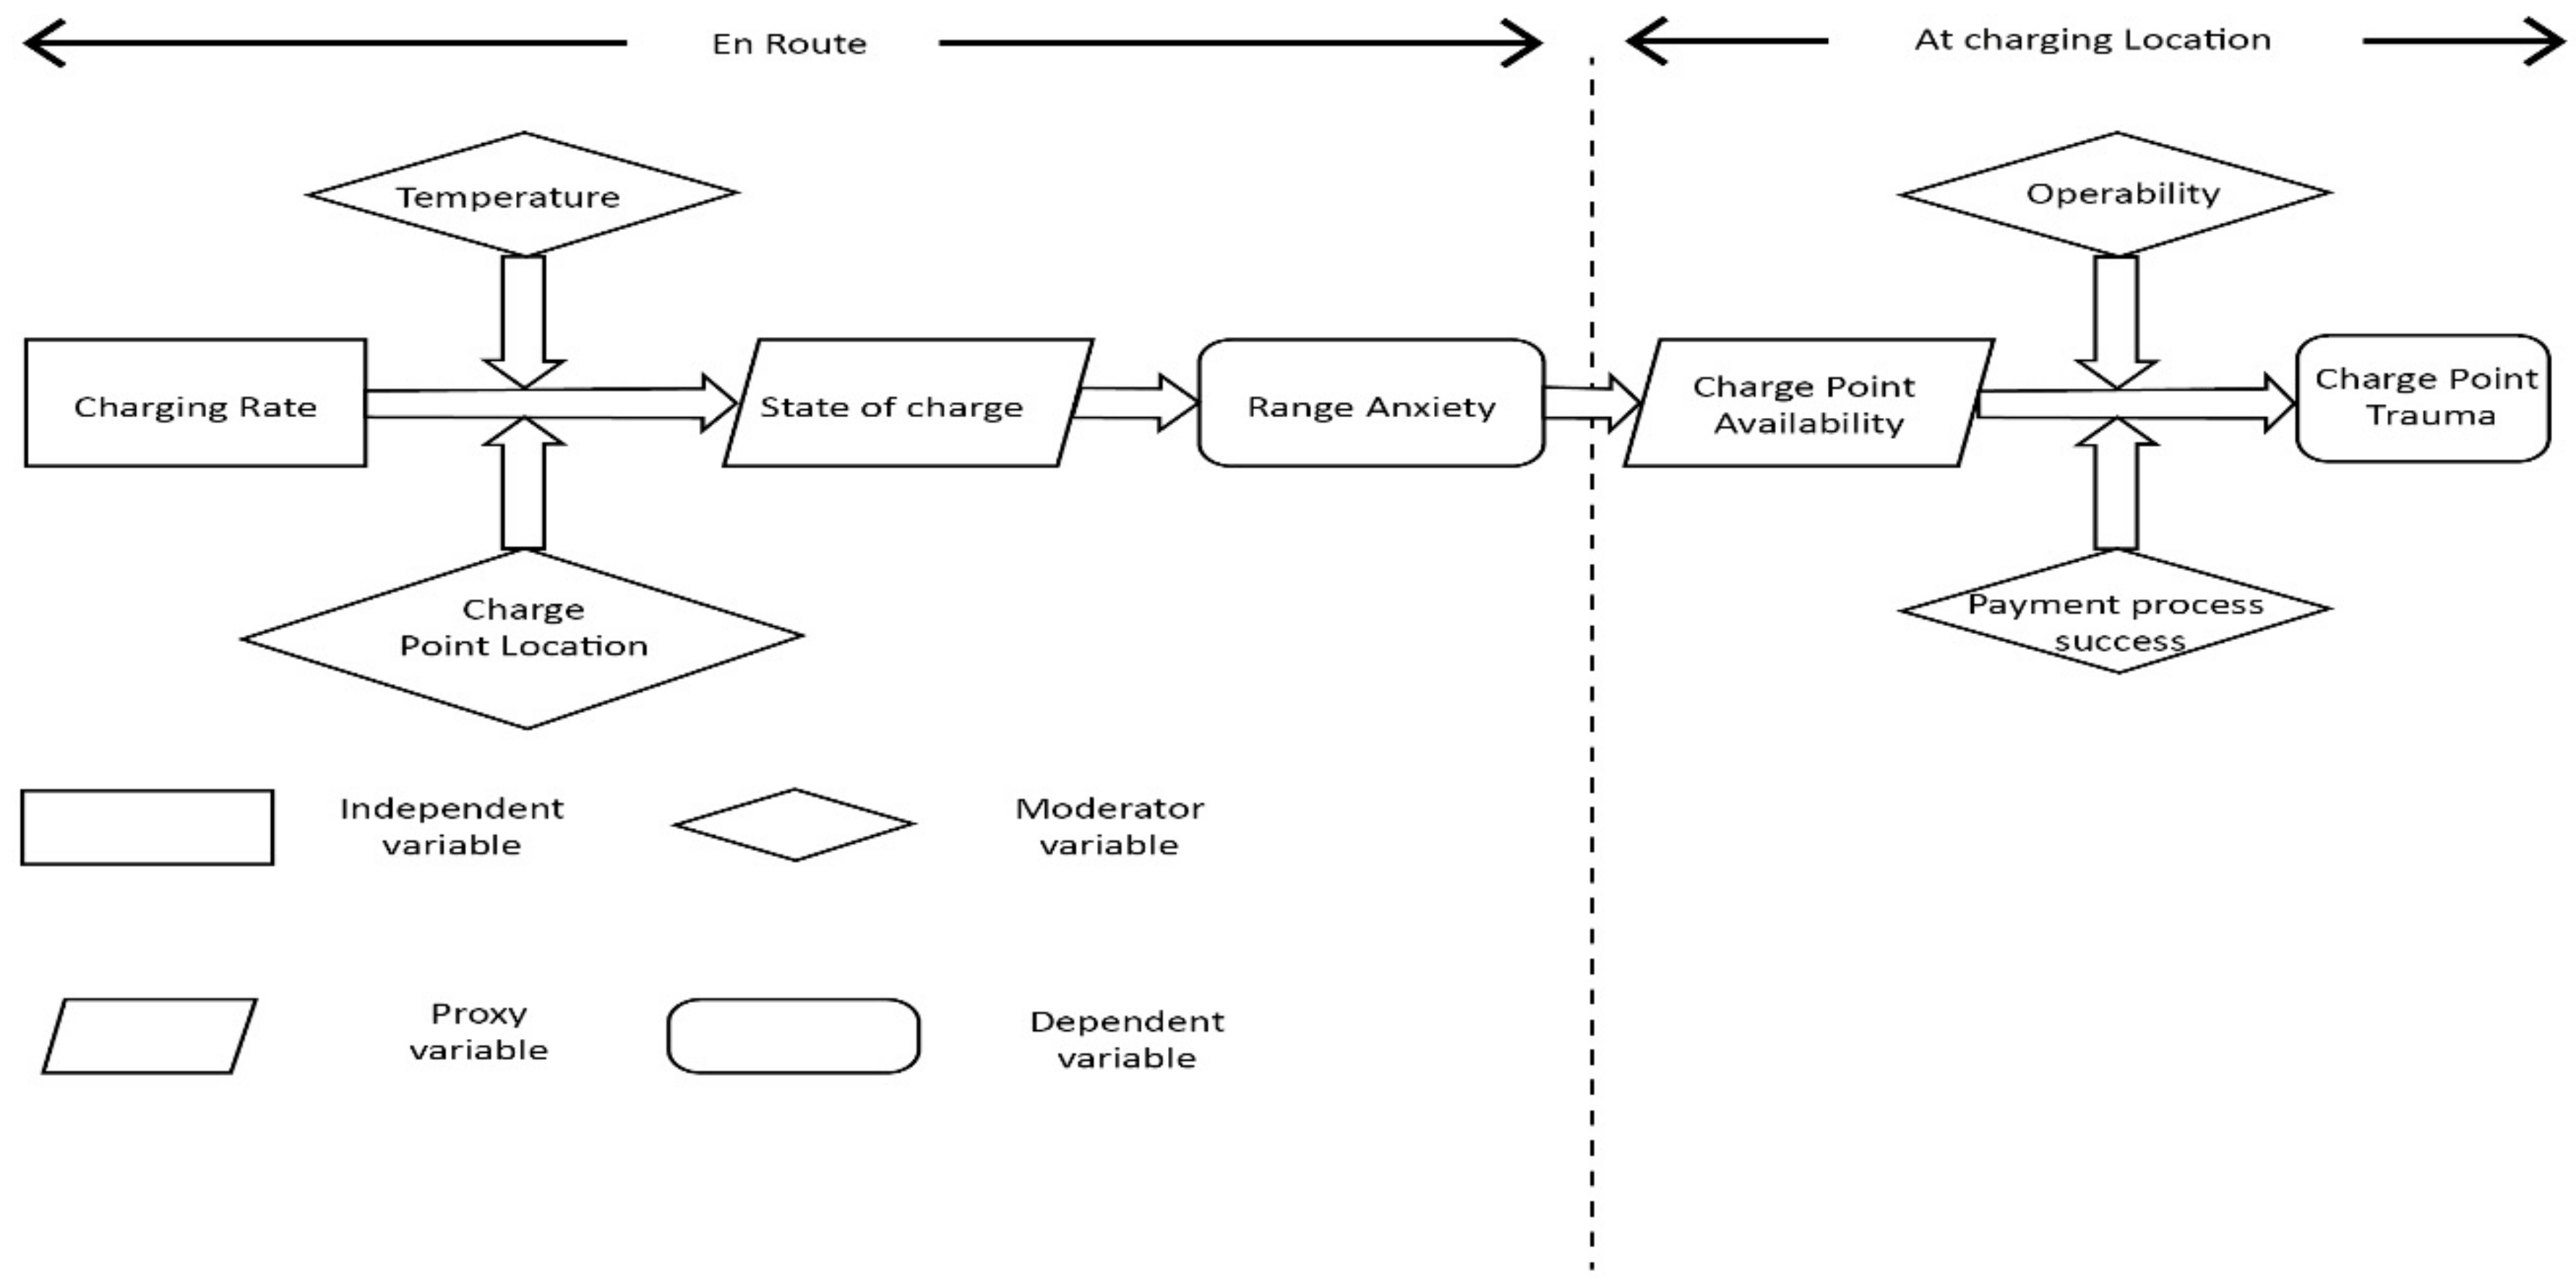
This initial case study prompted the design of a field-based theoretical framework (
Figure 2) to map not just the elements of CPT, but to illustrate how range anxiety still forms a significant component of the EV driving experience and behaviour, despite the ever-increasing mileage ranges of newer EVs. We see from the data that although range anxiety is the catalyst for increased EV driver anxiety levels amongst novice drivers, there was a significant increase in anxiety once the driver had entered the charging zone.
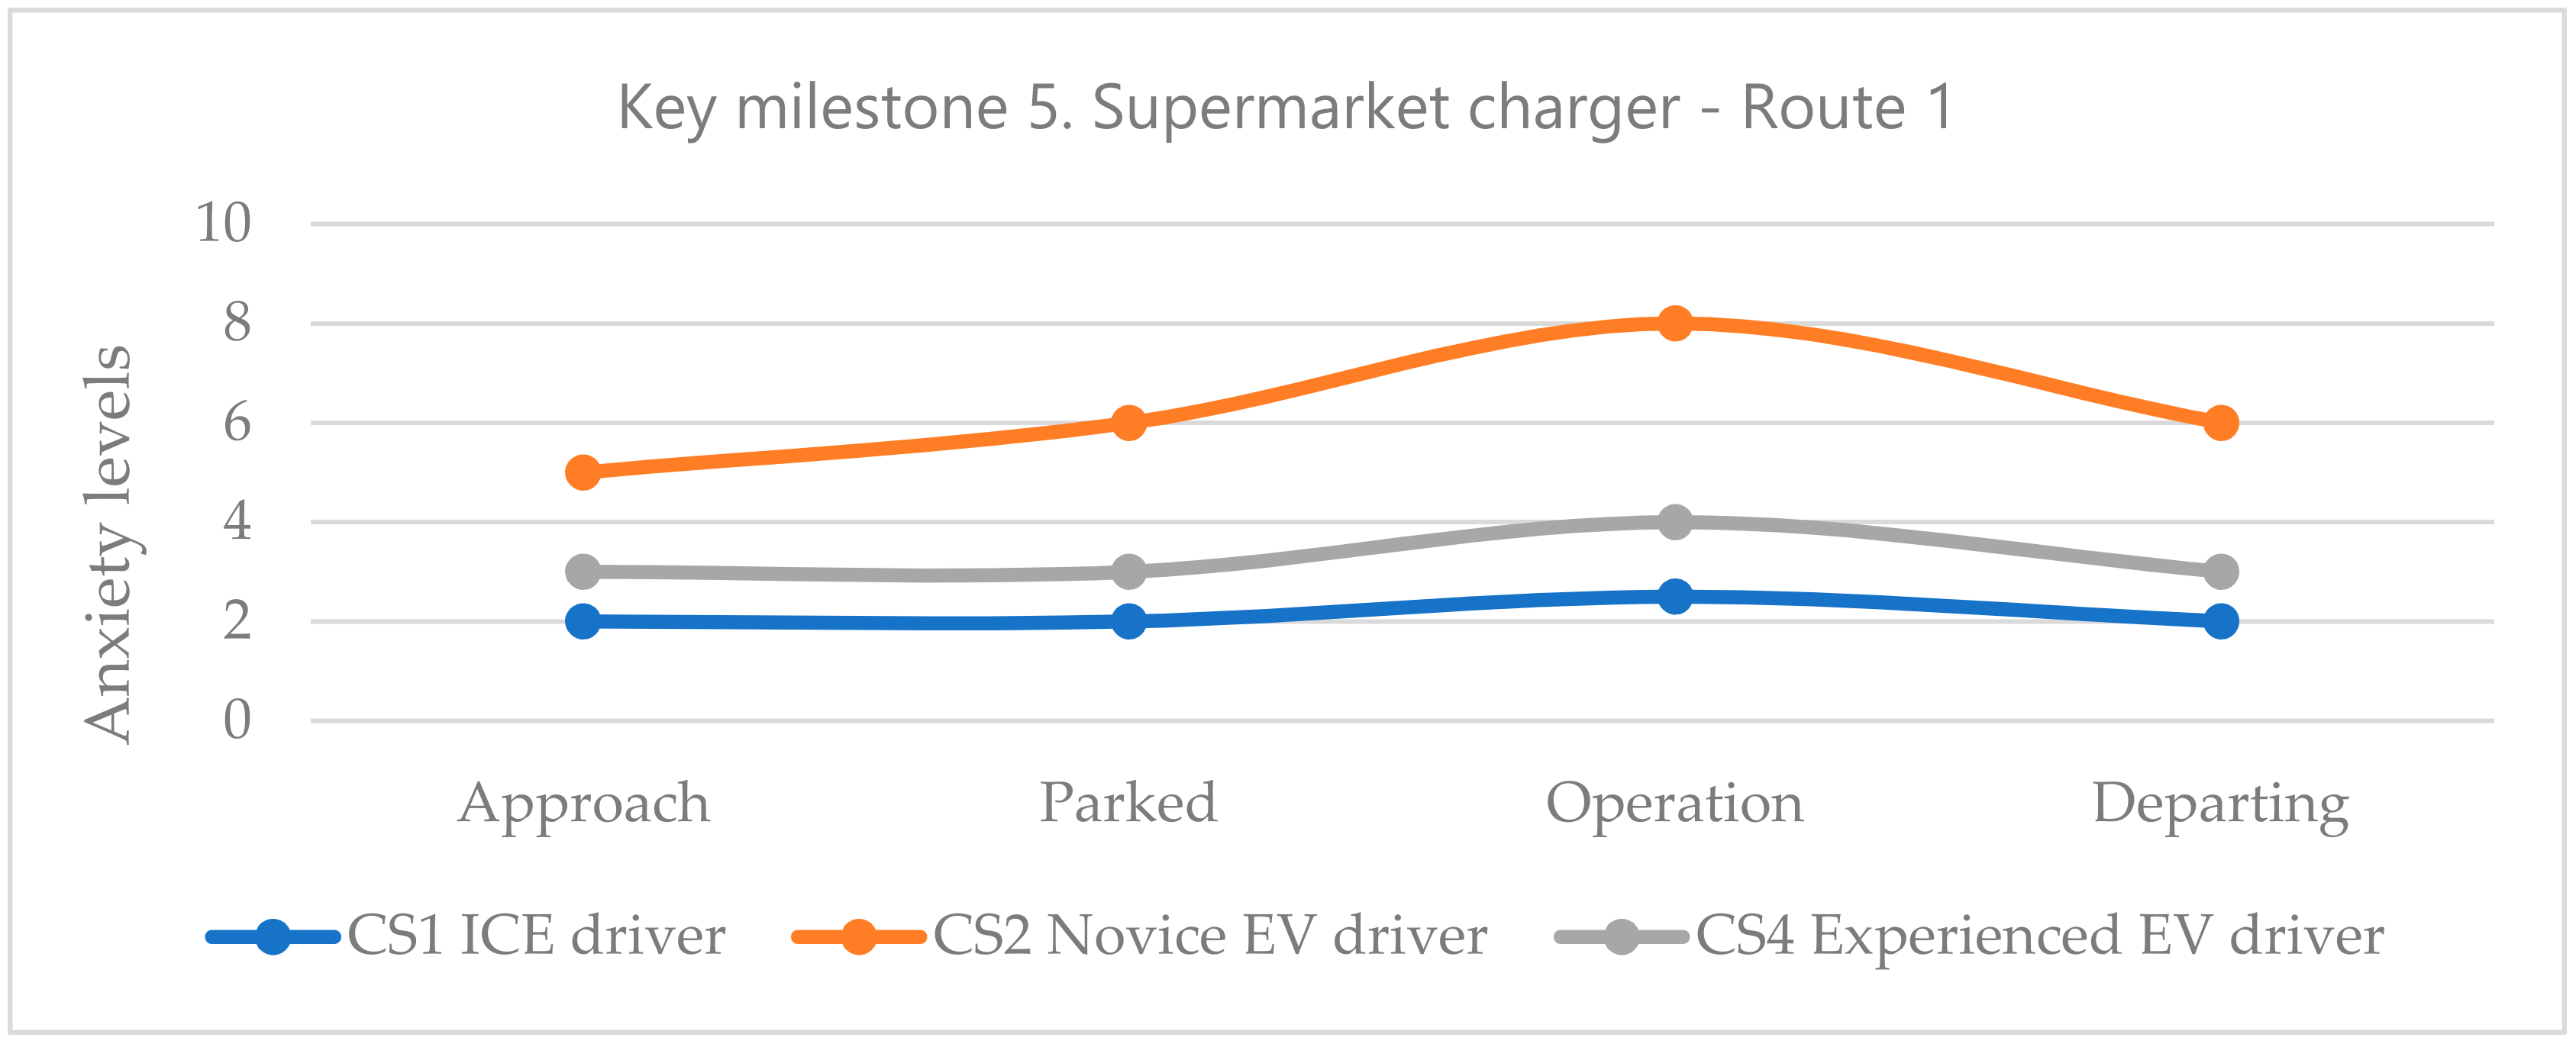
We noted that anxiety levels lowered once a successful charging cycle commenced. Conversely, when the novice EV drivers entered a charging zone and encountered one of the three barriers to charging that contribute to CPT (
Figure 2), then significant increases in anxiety were noted (
Figure 13 and
Figure 14). The data confirm a significant correlation between heightened EV driver anxiety and barriers to charging encountered at key milestone five in route one (
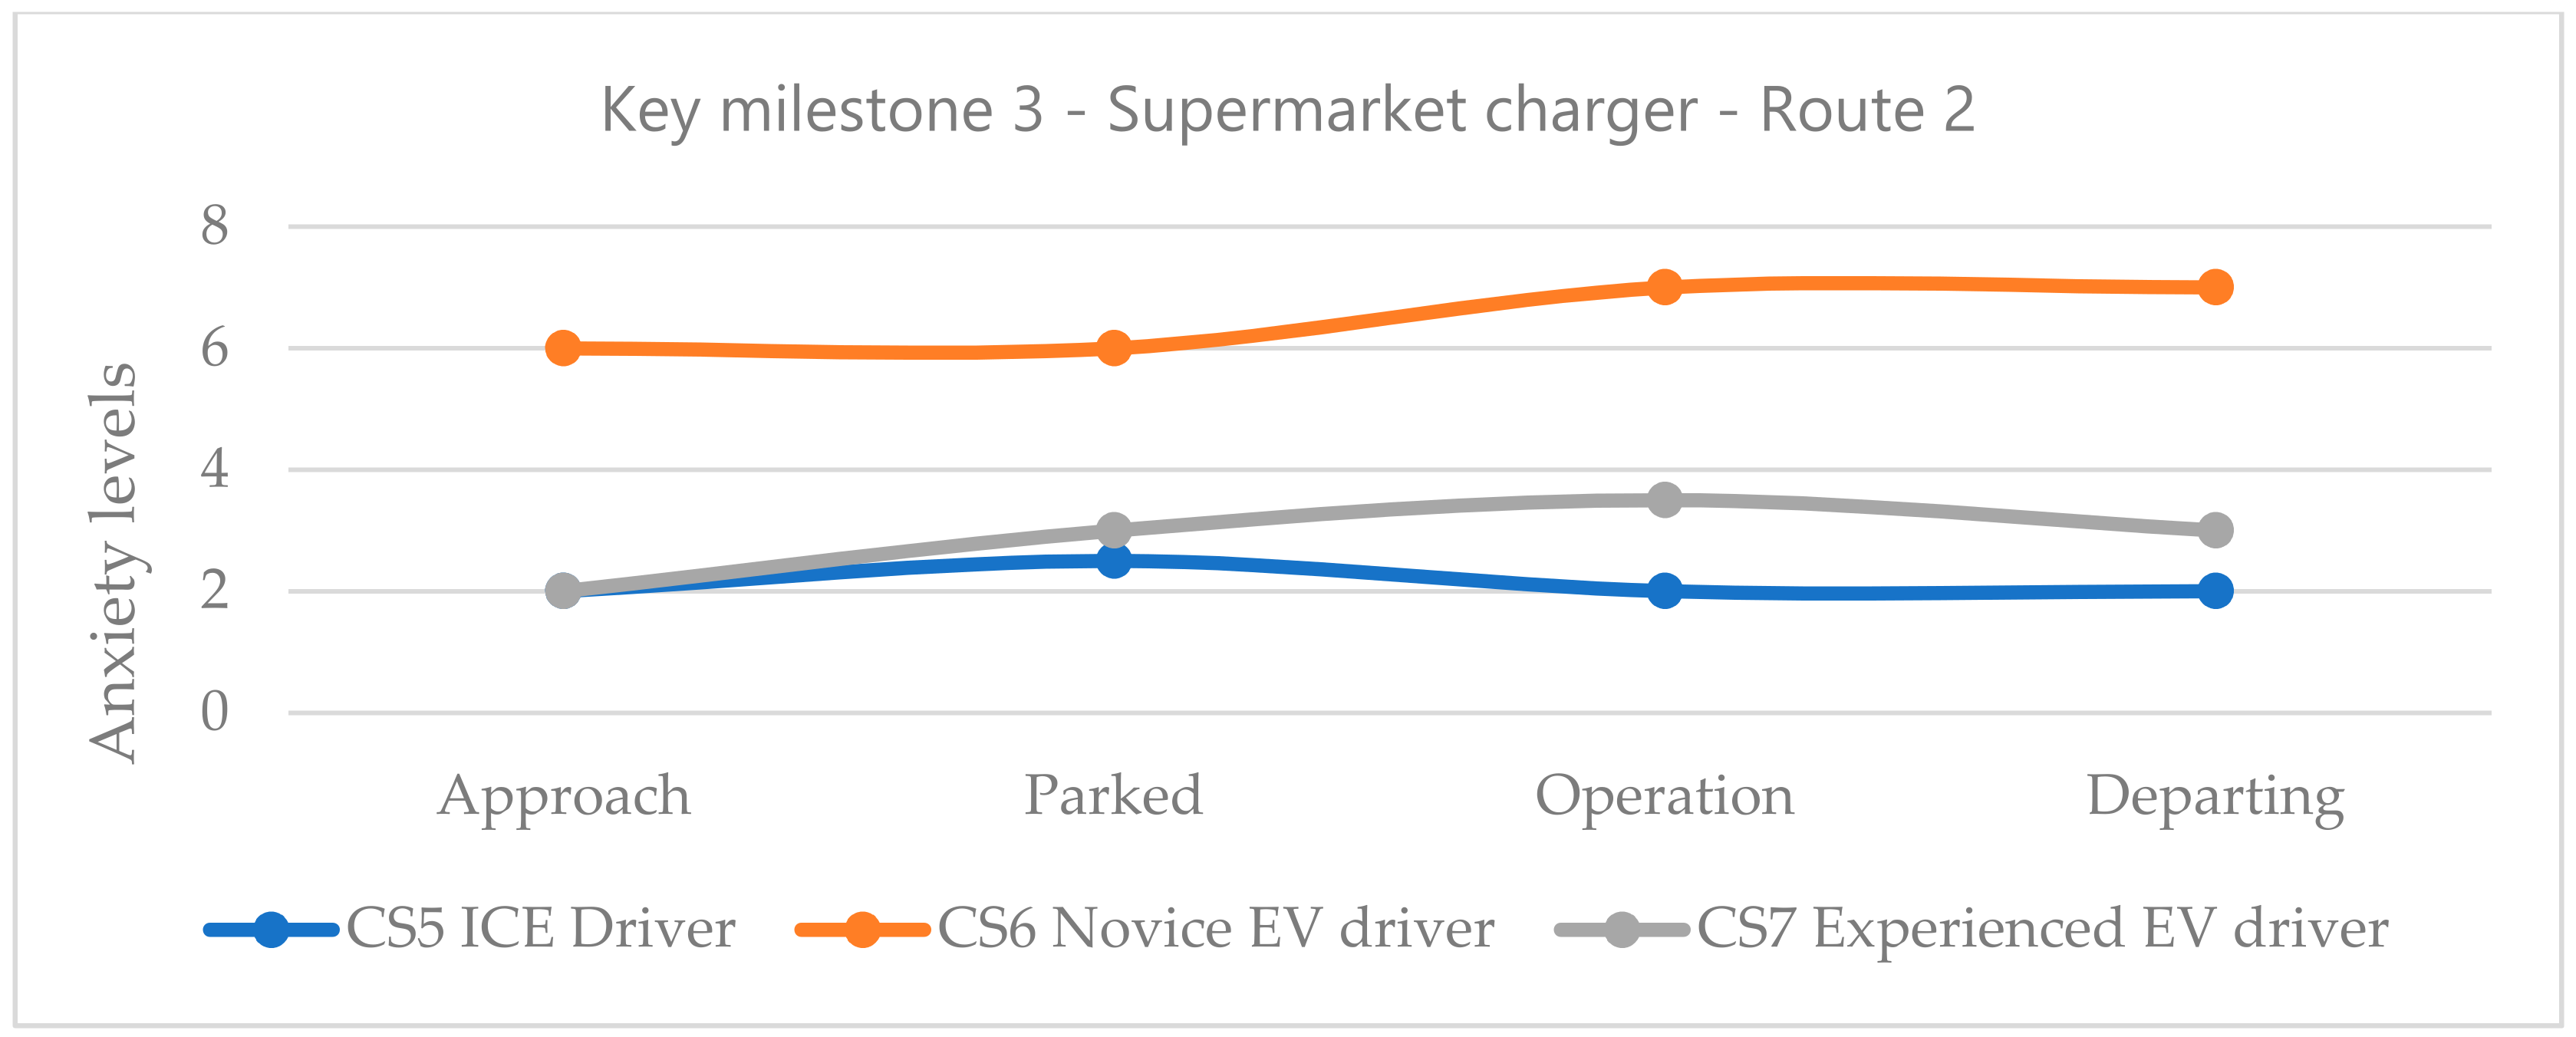
Figure 13). The novice EV driver continued to the next charging station in a state of higher anxiety. We argue that this is a combination of CPT experienced at the charge point and then displaying heightened range anxiety onward. Again, this phenomenon is observed with a clear correlation between higher anxiety and barriers to charging experienced at key milestone three in route one using a novice driver (
Figure 14).
For the experienced EV driver, the levels of range anxiety were still heightened en-route, but at a markedly lower level overall when entering the charging zone compared to the novice drivers. This suggests that as experience and familiarity with an EV develops, range anxiety and CPT levels are correspondently lower as confidence in the vehicle increases.
To confirm this theory, we further investigated our data. We observed the drivers state of anxiety when approaching a charge point, parking up, plugging in, experiencing a trouble-free charge, then continuing the journey on departure. We first investigated key milestone three at the M5 Cullompton services on route one, inbound journey (
Figure 15). This time we noted a fractional, insignificant rise in the ICE drivers state immediately before refuelling. In contrast, there was no further rise on the journey approach in the driver’s state of anxiety. Once refuelling and charging for all drivers were in progress, there was a significant drop in anxiety for both novice and experienced EV driver’s at and after recharging. This confirms our hypothesis that where no barriers to charging exist, then EV drivers state of anxiety is consistently always lower in our case studies.
Finally, we investigated the data from key milestone four, Rugby services M6 on route 2 (
Figure 16). This time we noted no rise in the ICE driver’s state immediately before refuelling. Once refuelling and charging for all drivers was in progress, there was a significant drop in the state of anxiety for both novice and experienced EV drivers. Furthermore, after recharging, particularly for novice EV drivers, their anxiety level dropped markedly, demonstrating increasing confidence in their vehicle. This confirms our hypothesis that where no barriers to charging exist, the EV drivers state of anxiety is always lower in our case studies. Even after refuelling, the novice EV drivers’ state of anxiety was higher than the experienced EV and ICE driver, confirming that prolonged EV driving experience reduces anxiety relating to both vehicle range and CPT.
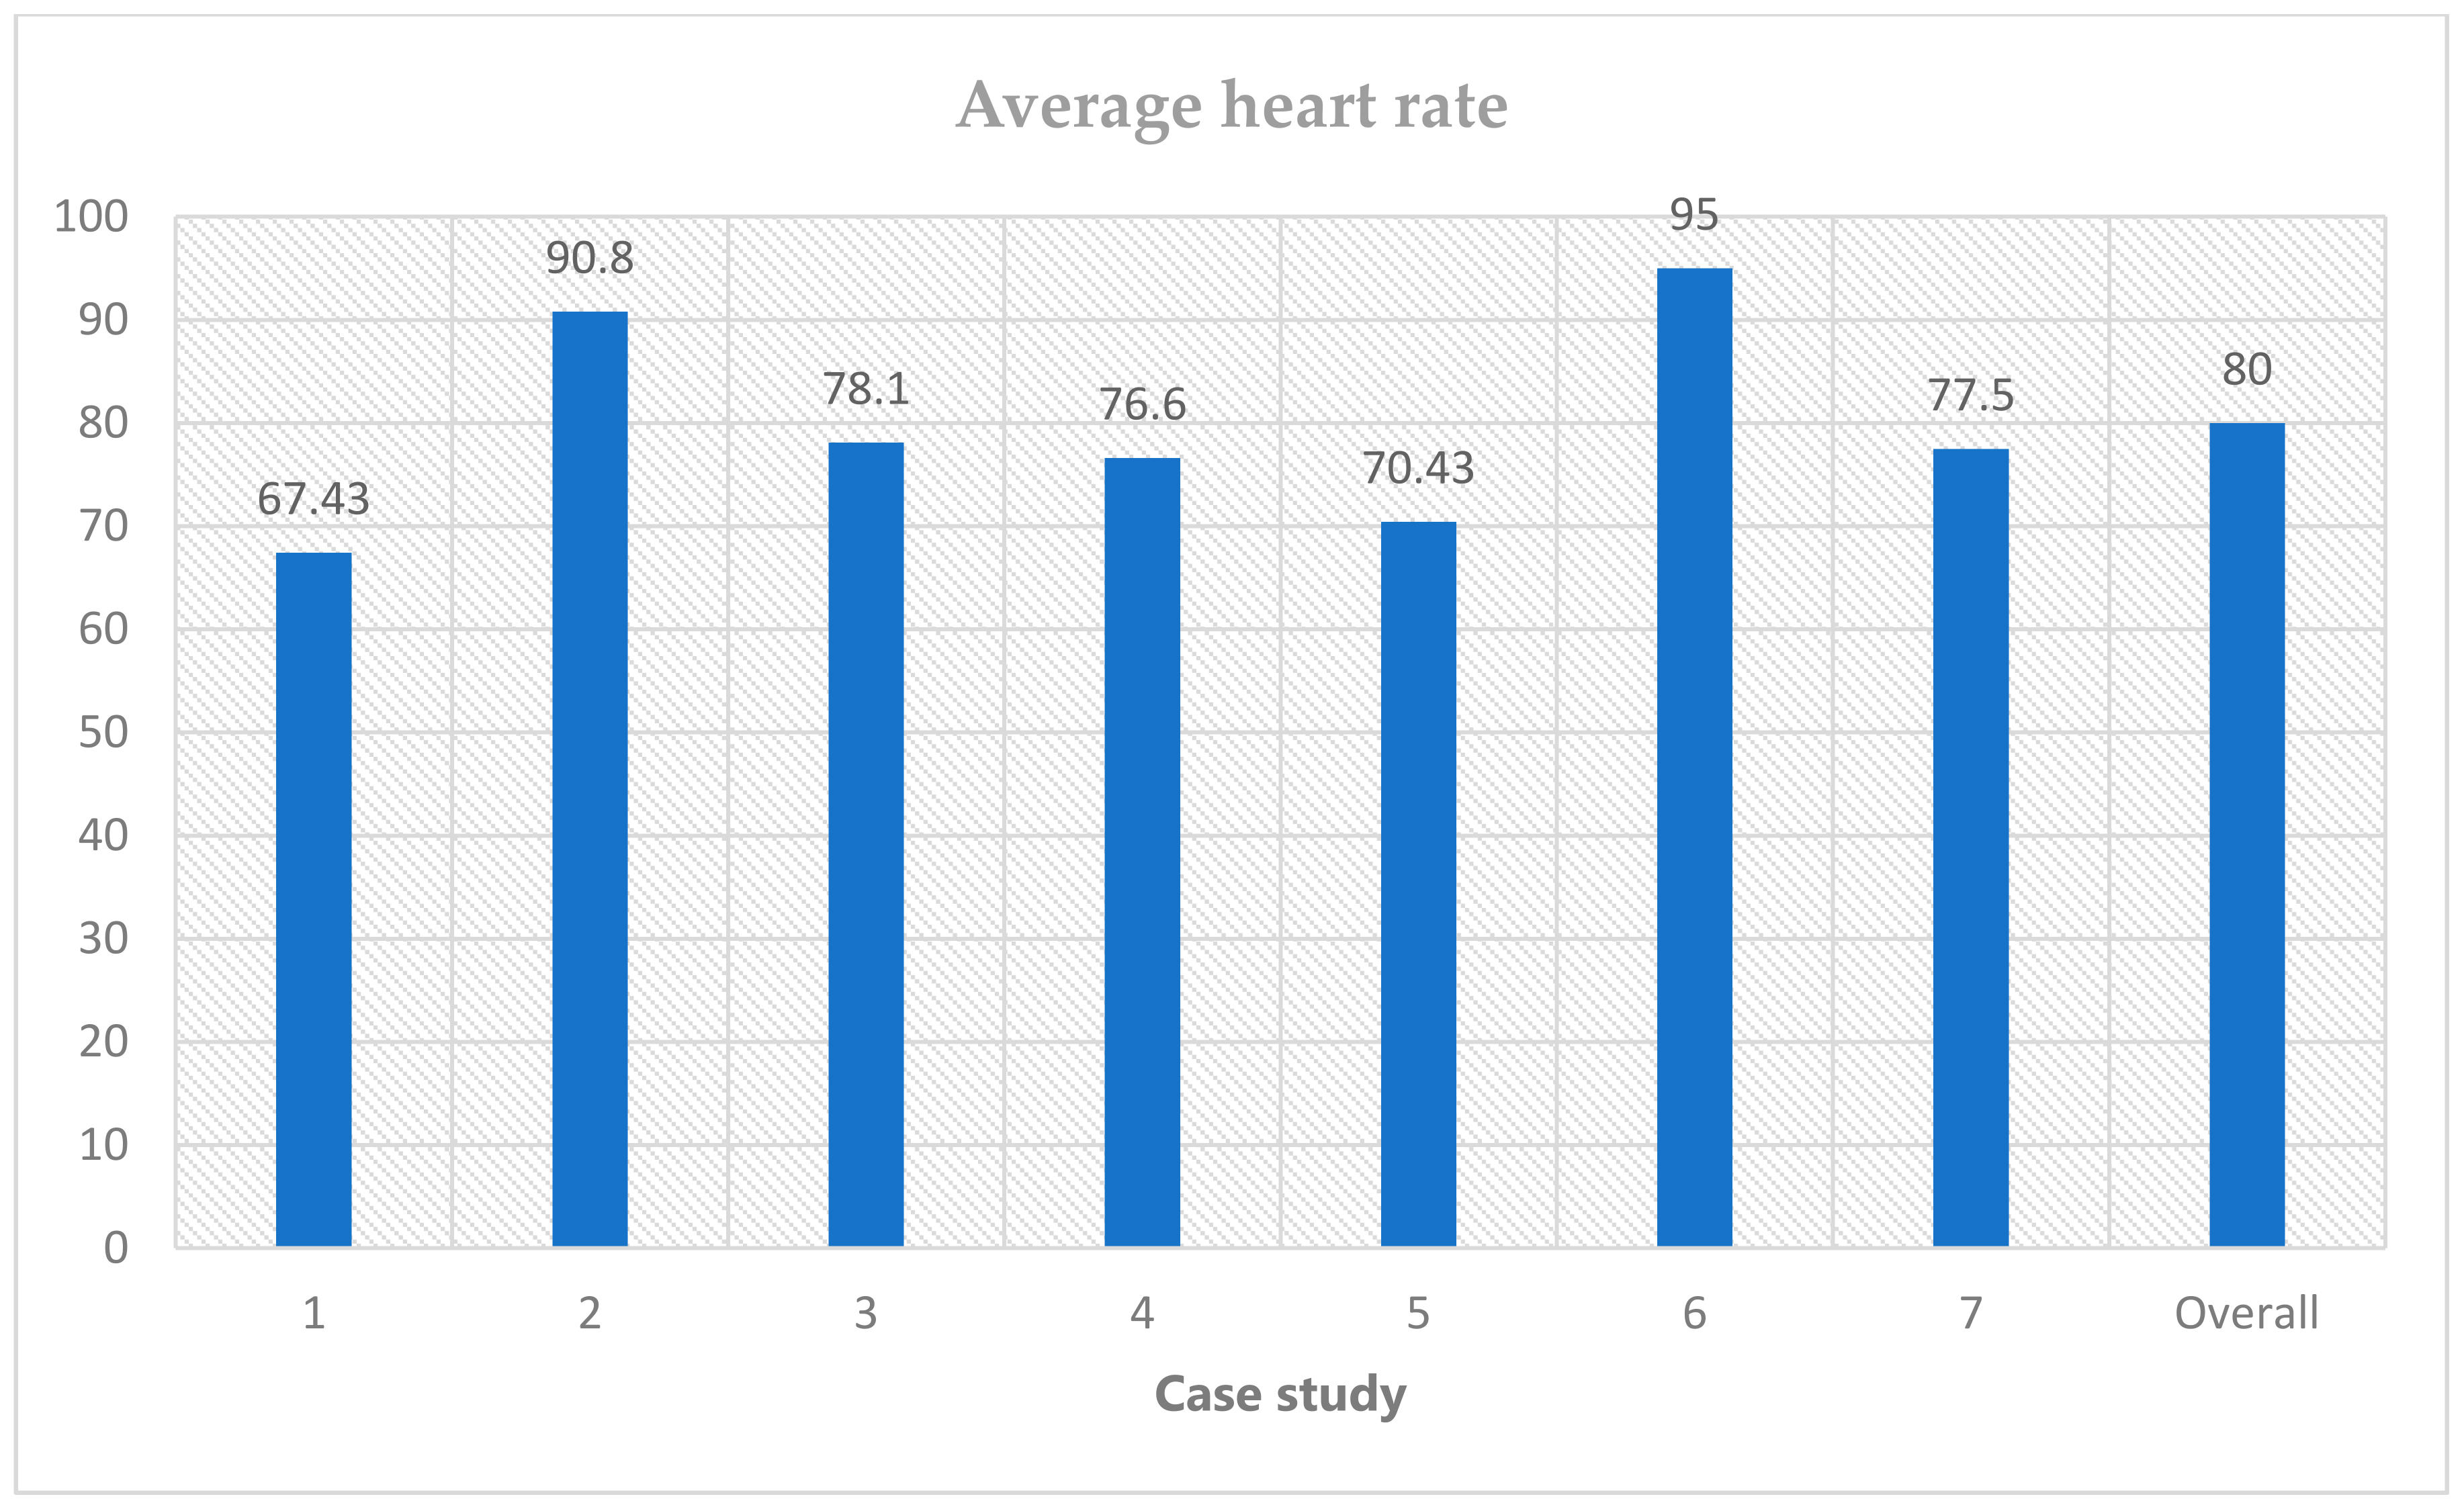
The descriptive results in
Appendix B indicate that drivers in route two had a higher average heart rate than drivers who undertook route one. The main reason for this is that route one drivers started the journey with a full charge, whereas, on route two, we purposely limited both ICE and EV vehicles with just enough fuel or charge to make it to the mid-point stop at Rugby Services, forcing a refuel or recharge.
Finally, the ICE driver with more than ten years of experience with long-distance driving rarely encountered the same levels of anxiety experienced by either type of EV driver. One of the main reasons behind this phenomenon is because the ICE vehicle’s range enabled it to travel the total round-trip distance of the south-westerly route with fuel to spare. Moreover, on the shorter northern route two, even faced with just enough fuel to complete half of the trip, the ICE driver’s confidence maintained a constant low state of anxiety. This lack of range anxiety in an ICE vehicle is almost certainly because the ICE fuelling network is more than 99% reliable [
15] and thus builds confidence in a driver’s ability to refill on-demand. Moreover, due to tight regulation on opening hours, crewed fuelling stations and highly regulated service level agreements on uptime and operability, there was practically no heightened anxiety in this cohort of drivers. To date, there is little regulation across the UK network of EV rapid charging stations.
Although our research points to increased anxiety at the charge point, and this in our analysis points to CPT, further in-depth research should be conducted to establish that CPT is more than extended range anxiety since we know from our data that in all cases, anxiety rises at the charge point zone when some form of operational problem creates a barrier to charge point use. This study is the catalyst for further investigation.
By providing insight into CPT, this research illuminates potential EV owner’s preferences regarding charging station infrastructure. Our results indicate that the location of charging stations heightened a state of anxiety, and for this reason, the charging stations should be closer to each other to reduce range anxiety. This can lead to higher EV growth by encouraging more vehicle users to purchase an EV versus a traditional ICE vehicle. Taking this into account, we argue that our investigation covers the CPT phenomenon from four different perspectives—location, accessibility, payment access, and operability.
Using the data collected via the case studies and user surveys described in
Section 4, we answer our research questions introduced in
Section 1 as follows:
Future EV owners will require a charging station infrastructure denser than the current ICE refuelling infrastructure due to an average EV taking up to ten times longer to refuel [
7].
As EVs replace ICE vehicles, there will be a surplus of traditional ICE fuelling stations due to lowering demand for their services. These may be converted to high power EV rapid charging stations to reduce the EV charge point deficit, subsequently alleviating current anxiety levels amongst EV drivers, thus lowering CPT.
For future studies, we plan to increase the survey participant pool with a more focussed and targeted audience by including drivers who are either undecided about or on the cusp of making an EV purchase. This phase is critical in understanding and quantifying that the CPT phenomenon is not only a significant issue and potential barrier to EV growth but should be a requirement to credibly remodel charge point infrastructure planning as an essential element to driver EV acceptance.
4.1. Distribution of Charge Points and CPT
The distribution of charge stations across the UK reveals that the charging infrastructure is not well-developed. The uneven distribution of charging infrastructure reported by the DfT [
19] is consistent with public EV charging infrastructure observations. Specifically, the DfT argued that there are no predefined criteria for infrastructure installation, and manufacturers have relied on a ‘postcode lottery’ approach leading to
user anxiety. Beyond the uneven distribution of rapid charge infrastructure, the manufacturer’s low transition to electric mobility and low EV mileage range indirectly contribute to
CPT, discussed in
Section 5.2.
4.2. Manufacturer’s Low Transition to Electric-Powered Mobility
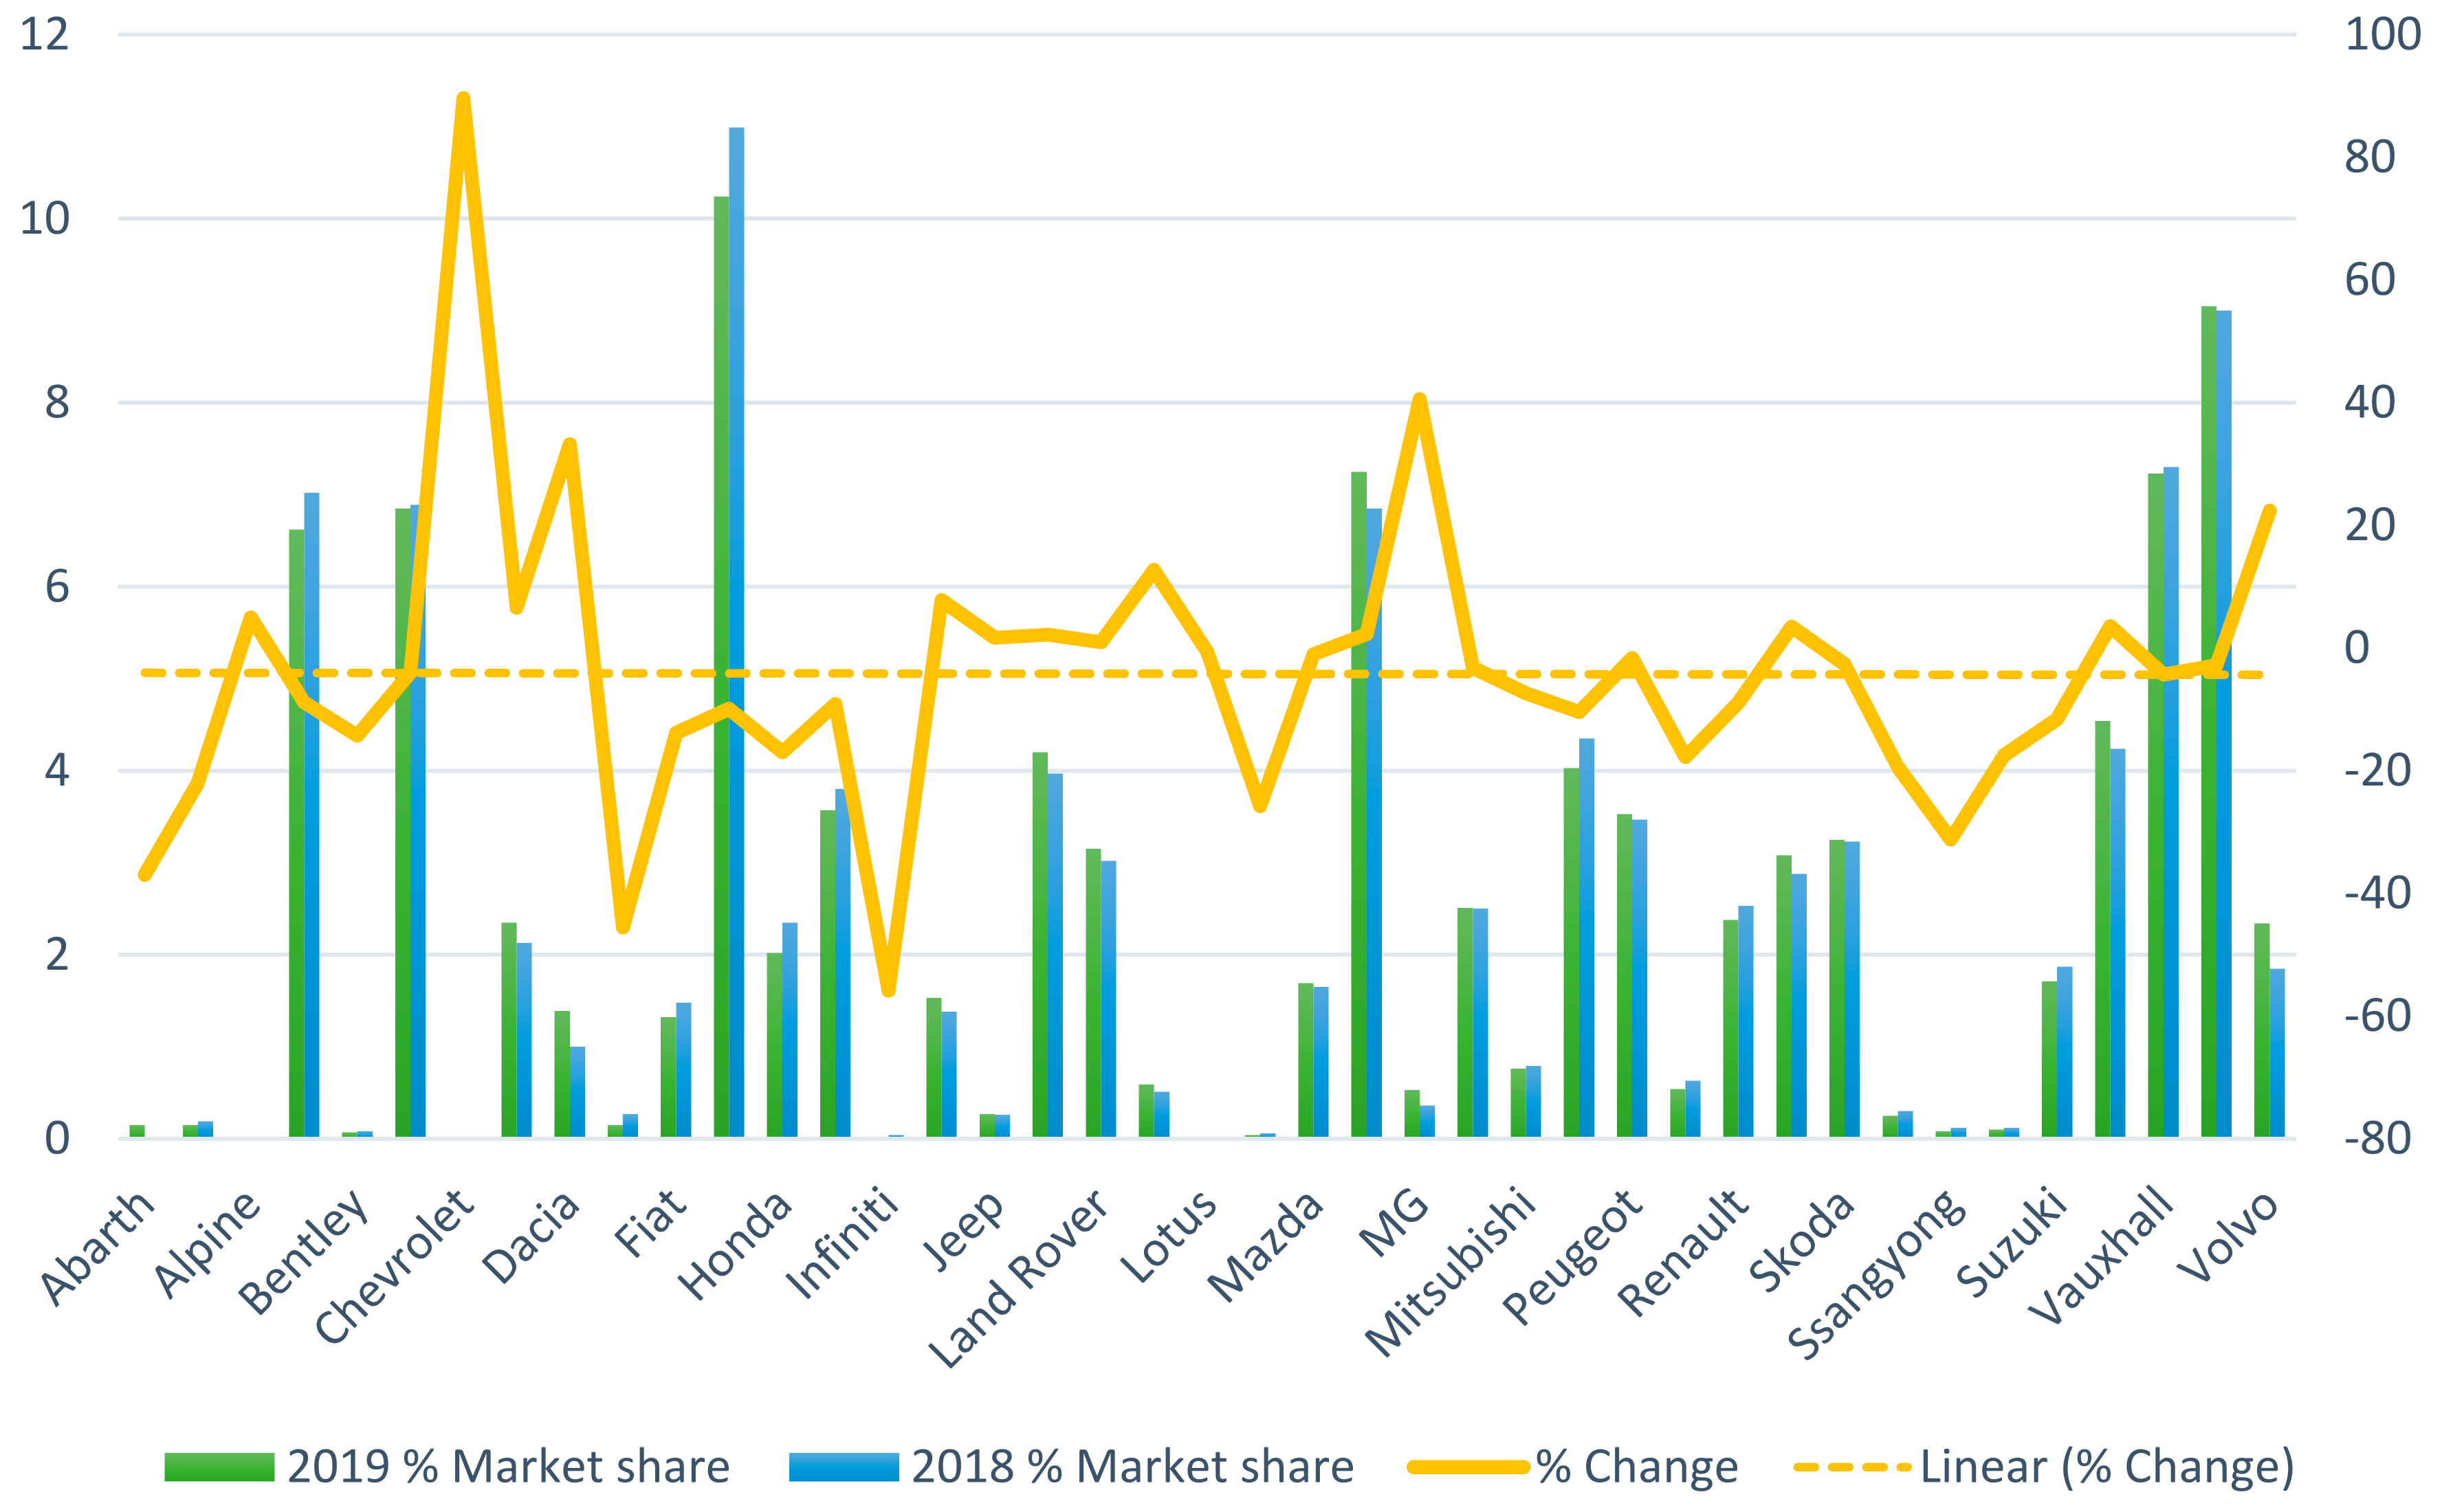
Current industry data shows that established manufacturers fulfilled the limited EV development of EVs. This phenomenon is reinforced by a comparative analysis of the market share and the state of growth of carbon fuel-powered vehicles. According to SMMT data [
37], the principal UK manufacturers largely maintained their market share in the 2018/2019 financial year. In addition, the number of non-EVs sold was incomparable to the ratio of EVs traded, noted by SMMT [
37]. The Business, Energy, and Industrial Strategy Committee of the House of Commons (HoC) similarly established that manufacturers showed varying commitment levels to electric mobility [
1]. Both Volkswagen and Mercedes committed to achieving a 25% transition to EVs by 2030, seen as unsatisfactory within the UK government report [
1]. Volvo and Toyota have announced their intentions to transition to 50% within this period by 2030. Porsche and Jaguar were the only exceptions, with both companies proposing a 100% transition by 2030 [
1]. This inconsistent commitment to the electrification of the powertrain could contribute to a slowdown in the adoption of EVs in the UK market, considering that Volkswagen and Mercedes have a combined market share of 17% as of 2019 [
37]. The above observation is supported by the fact that limited EV development would make the installation of brand-specific charging infrastructure economically unsustainable. Further research is required to ascertain the extent to which commitment to electrification slowed EV growth in the UK.
The level of rapid-charging network growth in the UK is comparable to similarly established European markets, as shown in
Figure 17 below. Conversely, the UK lags China, Norway, and the USA in the number of vehicles adopted but are similar as a per capita ratio to China and the USA. Furthermore, the UK, USA, Norway, and China are market leaders in EV technologies and vehicle development. This problem could be addressed if stakeholders collaborate to develop the charging infrastructure jointly. Nevertheless, private sector efforts are inadequate without government-supported policy support changes by the government. According to Hirst [
1], examples of such policies include EV registration tax exemptions, VAT exemption at the point of purchase, ongoing zero road tax, access to free municipal parking and elimination of tolls, parking, and bridge fees for EVs. We concur with Hirst that such policy changes would incentivise charge point operators to increase charge station’s deployment.
6. Conclusions
The following observations were made from this investigation. First, there is a level of evidence in our research and analysis regarding the link between CPT that, if ignored, may act as a barrier to EV growth in the UK due to significant EV user dissatisfaction in fundamental areas [
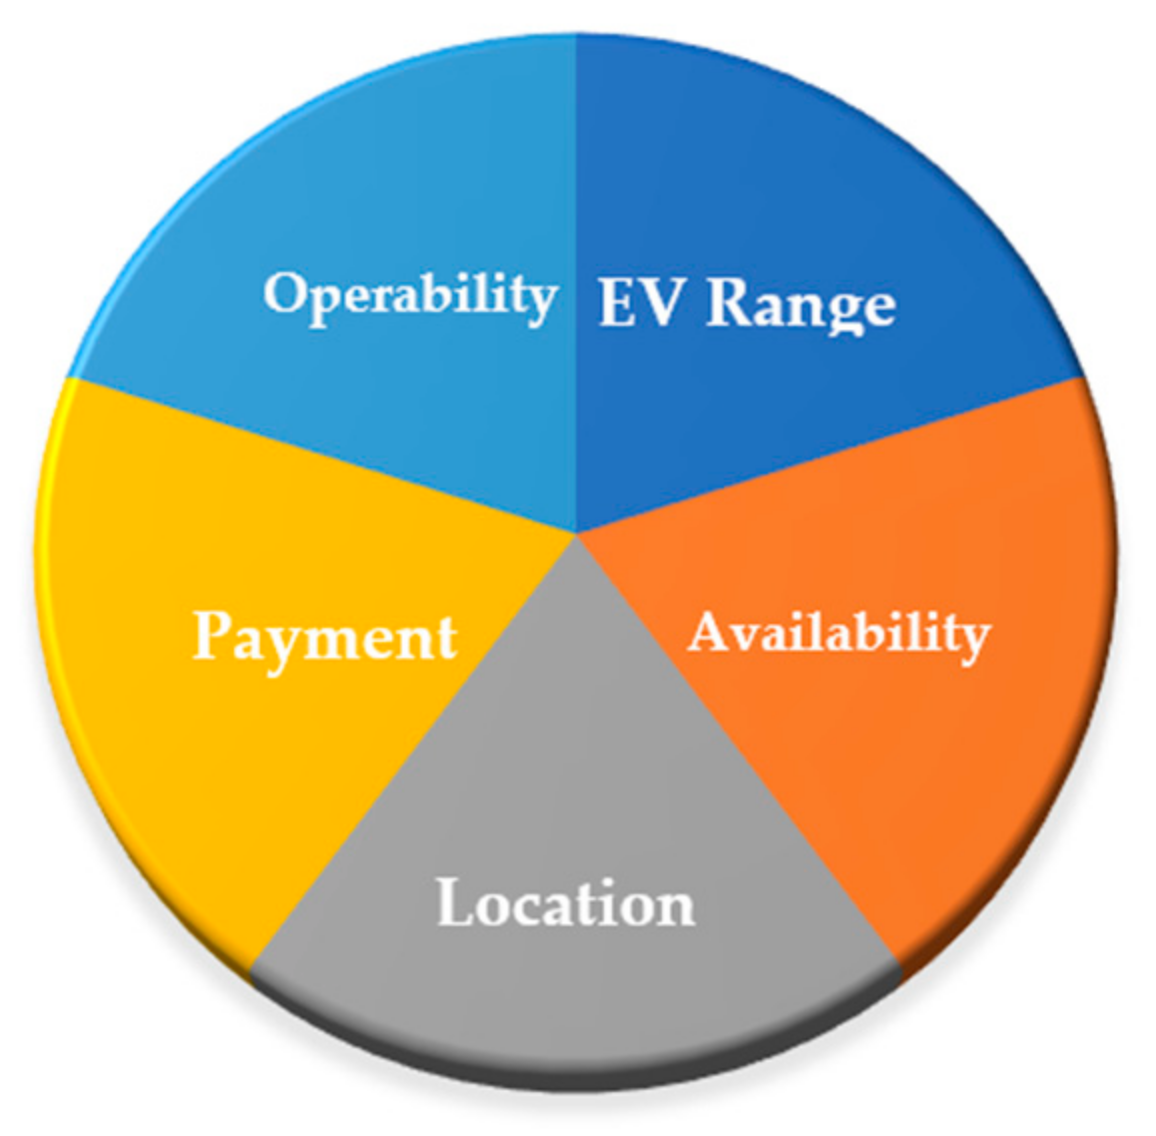
7]. Both primary case studies and surveys revealed user ambiguity in the following five areas. (1) range anxiety, an element that we had discounted initially but still intensely exists, (2) rapid charger locations, or lack of, (3) point of use availability, (4) disparate payment processing and variable charge costs, and (5) general operability (
Figure 1). The evidence is informed by industry statistics, research and our seven case studies correlated with previously obtained survey results [
7]. Secondly, we found that the level of anxiety lowers with experience and vehicle familiarisation. Finally, the consumer concerns are further validated by the often-random network planning of rapid charger deployment, due chiefly to grid availability rather than user-accessible trunk route location [
2]. We believe there should be a government-funded National Network Planning Committee (NNPC) to eliminate the current barriers facing EV drivers using the UK rapid charging network. This will ensure that before random EV charging locations are granted local planning permission, every project must add tangible value to the overall national network. This will prevent charge point blackspots or, conversely, excess charge points in one area, ensuring contiguous coverage nationwide, comparable to the current ICE fuelling station network.
Founded on our findings proving a direct correlation between heart rate and anxiety levels, our case studies revealed a worrying upward trend in EV driver anxiety levels caused by infrastructure pinch points, such as lack of available chargers and payment processing complications. Therefore, this research to date through our detailed data analysis employing a
t-test and correlation analysis (
Appendix A), confirms our hypothesis that there is a critical CPT link to the EV user anxiety levels experienced in our case studies and the dissatisfaction of EV users in four key areas, revealing significant increases in anxiety levels compared to corresponding journey range anxiety. However, a more stringent investigation covering a much larger sample size may confirm or refute these findings.
From an engineering and technological perspective, it can be argued that there is a casual connection between technical limitations in EV energy storage systems (energy density versus power density) and CPT because the power limitations in level 1 and 2 Rapid charging systems are linked to the constraint of available technologies. In brief, the central research hypothesis is validated by our current data. Our case studies, supported by our recent user survey of 282 motorway EV drivers, revealed a correlation between the four main user survey areas of dissatisfaction [
7] and the high anxiety events witnessed in our seven case studies, confirming a clear link between anxiety or trauma levels experienced by EV drivers compared to ICE drivers. This is the first study of its kind and one which will hopefully lead to substantial future investigations. We argue that CPT will increase amongst EV users and propagate adverse publicity through traditional and digital media channels. We also believe that a slow-down in growth could be reversed by intervention through governmental regulation and harmonisation in standards for all charge point operators [
7]. This would bring parity of EV user experience toward that of regular ICE drivers.
In general, this research has advanced the current body of knowledge on EV users’ post-acquisition by exploring a critical theme beyond the availability and service of the UK EV rapid charge network and mileage range of EVs.
As this study is the first example of an investigation to link four constituent barriers to EV growth that together results in a new phenomenon identified as CPT, we suggest that further research should focus on the most critical negative EV user issue—to reverse the practice of continuous deployment of rapid chargers in grid friendly outlying areas, rather than locating rapid charge points in areas where they are most needed to fulfil EV users’ needs on main trunk routes. We argue that this can only be remedied through government intervention, design, and enforcement of new regulations. We encourage deploying emerging AI-driven technology to integrate with grid availability and control rather than overlooking this vital issue.
More complete and accurate documentation, including additional case studies during peak summer months, with higher traffic volumes, higher ambient temperature, and a more detailed driver profile (i.e., age, sex, and physical fitness), may produce a more comprehensive assessment of individual circumstances, leading to complete knowledge of the processes affecting long-term trauma levels in EV drivers. Once we have a clearer understanding of the relationship between CPT and factors such as age, length of ownership, and familiarity with the EV, measures can be designed and implemented to improve the UK’s EV long-distance commuting user experience. This would include a ubiquitous pay-as-you-go payment system for all contactless payment types, regardless of whether the EV user is a brand member of the charge point operator (CPO).
Furthermore, we suggest a legally binding service level agreement between the CPO and the Department for Transport (DfT) regulator mandating a minimum uptime for operability and accessibility of all users. Additionally, thousands more rapid charge points are required across all UK main trunk routes. We found that the average time spent at a charge point was approximately 50 min–1 h during our case study observations. We also noted that most UK motorway service stations had only two rapid chargers (two exceptions had four). Given that the UK government is banning the sale of diesel and petrol cars by 2030, the number of rapid charge points on main trunk routes will need to increase at least ten-fold to avoid major queuing at service stations and subsequent delays in an EV user’s journey, leading the investigators to pursue ongoing research in this area.
In the short to medium term, whilst we fully understand that there will be a penalty of additional upfront capital costs in developing dedicated EV service areas; for instance, we believe this can be offset by greater use of the charging station and increased footfall in on-site amenities due to locality, convenience, and access to main trunk routes. If implemented, our findings and recommendations point to a significant correlation between lower CPT and greater EV user satisfaction, indicating an acceleration in the adoption of EVs by mitigating current barriers to growth and promoting incentives in line with the government “Road to Zero” target. In conclusion, we suggest all stakeholders, including manufacturers and government, should be fully invested in reducing CPT since it may slow EV adoption and could be a significant barrier to growth in the EV sector. We believe an acceleration of current rapid charger deployment will also diminish current levels of range anxiety due to increased rapid charging capacity across the UK.


