Article

Intelligent Control Approaches for Warehouse Performance Optimisation in Industry 4.0 Using Machine Learning

Institute of Logistics, University of Miskolc, 3515 Miskolc, Hungary
*
Author to whom correspondence should be addressed.
Future Internet 2025, 17(10), 468; https://doi.org/10.3390/fi17100468 (registering DOI)
Submission received: 15 September 2025 / Revised: 6 October 2025 / Accepted: 9 October 2025 / Published: 11 October 2025
(This article belongs to the Special Issue Artificial Intelligence and Control Systems for Industry 4.0 and 5.0)

Abstract

In conventional logistics optimization problems, an objective function describes the relationship between parameters. However, in many industrial practices, such a relationship is unknown, and only observational data is available. The objective of the research is to use machine learning-based regression models to uncover patterns in the warehousing dataset and use them to generate an accurate objective function. The models are not only suitable for prediction, but also for interpreting the effect of input variables. This data-driven approach is consistent with the automated, intelligent systems of Industry 4.0, while Industry 5.0 provides opportunities for sustainable, flexible, and collaborative development. In this research, machine learning (ML) models were tested on a fictional dataset using Automated Machine Learning (AutoML), through which Light Gradient Boosting Machine (LightGBM) was selected as the best method (R2 = 0.994). Feature Importance and Partial Dependence Plots revealed the key factors influencing storage performance and their functional relationships. Defining performance as a cost indicator allowed us to interpret optimization as cost minimization, demonstrating that ML-based methods can uncover hidden patterns and support efficiency improvements in warehousing. The proposed approach not only achieves outstanding predictive accuracy, but also transforms model outputs into actionable, interpretable insights for warehouse optimization. By combining automation, interpretability, and optimization, this research advances the practical realization of intelligent warehouse systems in the era of Industry 4.0.

1. Introduction

Industry 4.0 (I4.0) technologies are increasingly being deployed across diverse sectors, ranging from fire and safety management [1] to traffic control systems, where real-time data and automation enhance decision-making and operational reliability. These applications highlight how intelligent systems and advanced analytics can transform traditional processes into adaptive, data-driven solutions. Within logistics, the integration of Industry 4.0 is particularly relevant, as warehousing represents a critical link between production and distribution. Modern warehouses face complex challenges such as fluctuating demand, dynamic material flows, and rising efficiency requirements.
By leveraging ML, IoT, and automation, I4.0 opens new opportunities for optimizing storage performance and resource allocation. Consequently, warehouse management becomes a prime field for exploring how data-driven methods can redefine cost-efficiency and adaptability in industrial practice.
Within this frame, we review selected articles to highlight the importance of the research field and identify research gaps. The review focuses on peer-reviewed papers published between 2000 and 2025, identified in Scopus and Google Scholar using the keywords “warehouse optimization,” “machine learning in logistics,” and “Industry 4.0 warehouse performance.” Priority was given to studies that applied quantitative optimization or AI-based approaches in warehousing contexts. This addition strengthens the methodological transparency of the literature review.
The rapid expansion of e-commerce has fundamentally reshaped logistics and warehousing systems, compelling manufacturing companies to shorten the order-to-delivery cycle and adopt intelligent, data-driven optimization strategies [2]. Reinforcement learning (RL) and soft computing methods have been successfully applied to warehouse automation, supporting dynamic scheduling and coordination of Automated Guided Vehicles (AGVs) and stackers [2]. In parallel, the Industrial Internet of Things (IIoT) and Edge Intelligence (EI) paradigms have enabled real-time, distributed decision-making closer to the source of data, enhancing reliability and responsiveness compared to cloud-centric architectures [3,4]. These developments illustrate the growing importance of IIoT intelligence for digital manufacturing transformation and large-scale industrial integration [4]. Moreover, integrating RL with time-series forecasting and deep learning techniques has proven effective in improving demand prediction and inventory management, enabling adaptive responses to market volatility [5]. Building on these advances, the present study applies machine learning-based regression models and automated modeling techniques to uncover hidden performance patterns in warehouse operations, offering interpretable, cost-oriented optimization insights consistent with the principles of Industry 4.0 and Industry 5.0.
Cost reduction and efficiency improvement are strategic priorities for manufacturing companies operating in competitive markets. While certain expenditures are inherently tied to value-creating activities, such as production and quality assurance, and thus considered essential, there are numerous sub-processes within manufacturing and supply chain (SC) operations that offer potential for reorganization and optimization. By identifying and refining these areas, companies can achieve measurable cost savings. Even a reduction of a few tenths of a percentage point in operational costs can translate into substantial financial benefits, underscoring the importance of exploiting optimization opportunities through advanced analytical and algorithmic approaches.
The efficient organization of finished goods warehouses plays a critical role in overall SC performance. Numerous configurations exist for structuring SCs and managing the flow of finished products, typically involving the transfer of goods from manufacturing plants to distribution centers, followed by delivery to retailers. This study focuses on the performance optimization of finished goods warehouses by analyzing a dataset containing key performance indicators from various manufacturing sites. The dataset includes multiple descriptive parameters characterizing warehouse operations. The primary objective variable in the optimization process is the quantity of outgoing materials, which serves as a proxy for warehouse throughput and operational efficiency.
Warehouse performance optimisation can be approached via several parameters and broken down into several sub-processes. According to one study, the costliest process in warehouse operations is order picking, which can account for up to 55% of total operating costs [6]. The general approach is to determine warehouse performance based on the distance travelled by various material handling equipment. This can be optimally achieved by designing a layout tailored to the specific warehouse [7]. The minimum distance travelled can also be achieved with different storage strategies, as the picking route can be reduced by dynamically changing the destination. The random assignment method results in high space utilisation (or low space requirements), but this is accompanied by an increase in distances. This operation can only be implemented with IT support. If the storage location can be freely selected, a layout can be created in which the utilisation rate varies significantly in different areas of the warehouse [8]. According to one study, the two strategies are almost equally efficient [9]. The Cube Per Order Index (COI) strategy was developed to enable efficient storage. Its aim is to place products in the warehouse based on their picking frequency and space requirements, so that fast-moving products are closer to the picking area, thus saving travel time. However, the method does not consider multi-command orders, i.e., product–product relationships that arise during an order, which can significantly impair the performance of the method [10]. The Order Oriented Slotting (OOS) method was developed to eliminate these errors. It focuses on which products occur frequently in an order and arranges them in nearby storage locations, thus reducing the distance travelled during order picking [11].
In addition to layout planning methods, other approaches have also been developed: the batching method examines how picking processes can be coordinated for small orders, thereby reducing travel time [12]. Using the zoning method, the warehouse is divided into different areas, and SKUs belonging to the same product group are stored close to each other. Compared to the batching method, this procedure does not have a significant impact on the performance of warehousing systems [13].
Many procedures and methodologies have been developed to improve warehouse performance efficiency. However, with the spread of artificial intelligence, new and significantly more efficient methodologies have been created that offer more comprehensive solutions that are better adapted to individual needs than general and theoretical procedures, utilising technological advances. Due to growing customer demands and constantly evolving global competition, one of the most important indicators is the choice of warehousing strategy, which is why the dynamic storage location assignment problem (DSLAP) was defined. Deep Reinforcement Learning (DRL) is used to solve this problem, which helps to find the optimal storage locations to reduce costs within the warehouse. When extending this to a real industrial problem, it was found that after two months, warehouse costs were reduced by 6.3% [14], which is a significant saving, given that the method did not require any significant investment.
In the field of SCM, the use of artificial intelligence is most prevalent in demand forecasting. Based on recent years, numerous ML [15], deep learning [16] and time series [17] models have been examined for the implementation of forecasting. It has been found that AI-based forecasting is increasingly replacing traditional statistical models, and companies are investing more and more in AI technologies to optimise their entire SC [18]. Emerging research covers various industries, including the automotive industry [19], healthcare [20] and retail [21].
Several methodologies have been developed to implement order batching. A genetic algorithm-based metaheuristic approach has been developed to minimize picking distances, which is both fast and efficient for large warehouses [22]. Genetic algorithms can be supplemented with weighted association rules, so order batching and thus the avoidance of delays can also be implemented using a hybrid model [23].
Various formulations have been developed directly for route optimization, in which the layout and other factors are considered constant, so implementation must be carried out with the available resources. The preferred solution technique is the “S-shape” heuristic, as it can be used frequently due to its simplicity [24], while the Largest Gap, Return, and Composite methods have also become popular [25]. In addition to route determination, optimization can also be implemented in other ways, as the results of strategic-level predictive planning based on storage technologies, material handling systems, and picking strategies can approach the efficiency of general optimization [26].
In warehousing processes, many sub-processes can be replaced by robotics for automation purposes. The use of robotics is most often complemented by some form of AI-based decision-making, for which Reinforcement Learning-based algorithms [27] or Deep Learning-based methods [28] may be suitable choices for real-time control of robots to achieve maximum performance.
Based on the above literature review, the spread of artificial intelligence in the field of SCM is widespread and its popularity is constantly growing. One element of the SC is warehousing, for which numerous methodologies and algorithms have also been developed, and case studies confirm the importance of this research topic. The review of the literature revealed no studies employing regression models for pattern recognition rather than prediction in the context of SCM; consequently, the research objective can be regarded as both valid and significant for future applications.
The aim of the research is to employ a less common method rather than general and well-known optimization techniques for maximizing the material flow of warehouse performance. The primary goal of ML-based regression methods is prediction, i.e., the determination of unknown states. In such models, the recognition of relationships between variables is essential, as these parameters influence the value of the target variable. These relationships could be expressed and subsequently used to determine the objective function.
The novelty of the approach lies in the application of automated ML techniques for selecting the most suitable regression model and in the use of interpretable methods, such as Feature Importance and Partial Dependence Plots, to reveal hidden patterns in warehousing processes. Furthermore, it is demonstrated how these insights can be translated into mathematical functions defining cost-based performance, thereby offering a new perspective for optimization in industrial practice.
This paper fits within the scope of Future Internet as it demonstrates how ML and automated modeling can transform warehouse operations into data-driven, networked, and intelligent systems. By linking logistics optimization with Industry 4.0 and Industry 5.0 concepts, the research contributes to the broader vision of Future Internet, where industrial processes are increasingly interconnected, adaptive, and sustainable. Thus, the study aligns with the journal’s focus on advancing digital and internet-based technologies across different domains.
The remainder of this paper is structured as follows. Section 2 describes the research methodology, including the applied optimization and ML techniques, as well as the dataset and modeling procedures. Section 3 presents the results obtained from the AutoML modeling, feature interpretation, and optimization modeling. Section 4 discusses the implications, limitations, and potential industrial relevance of the findings. Finally, Section 5 concludes the study and outlines directions for future research. Figure 1 shows the graphical abstract of the article. The figure illustrates the main steps of the proposed methodology for warehouse performance optimization: dataset preparation and preprocessing, AutoML model selection (LightGBM), feature interpretation using Feature Importance and SHAP/PDP analysis, and formulation of cost-based mathematical optimization functions. The workflow demonstrates how data-driven modeling supports interpretable and efficient decision-making in Industry 4.0 warehousing.
By integrating automated modeling and interpretable optimization, this research advances the development of smart, transparent, and cost-efficient warehouse systems aligned with the principles of Industry 4.0.

2. Materials and Methods

This section presents the modeling steps of the research. Section 2.1 provides an overview of optimization methods in logistics, while Section 2.2 reviews the main ML models applied in this context, thereby placing this work into a broader methodological framework. Section 2.3 presents the dataset used for the research and its general properties, focusing on the target variable and the most important parameters. Section 2.4 discusses the correlations between the indicators, their meaning and possible consequences, and their potential uses. For effective modeling, the AutoML method is used, the theory and results of which are explained in Section 2.5. Finally, the model with the best evaluation is presented in Section 2.6.

2.1. Optimization Methods in Logistics

The subject of logistics process optimisation is broad and offers various methodologies for solving numerous problems to achieve more efficient, faster and more cost-effective operations. According to the general approach, various logistics problems can be understood as mathematical optimisation, the simplest case of which is linear programming, where both the objective function and the constraints are specified in linear form. A more advanced solution to mathematical optimisation is dynamic programming, which is a recursive approach, meaning that a problem consists of several decision steps that build on each other.
The complexity of a logistics problem often exceeds the capabilities of mathematical modelling. Heuristic algorithms were developed to solve this problem, as they can provide optimal solutions to more complex, non-linear and multi-variable problems. Metaheuristic frameworks can be applied to various types of optimisation problems, the best-known types being genetic algorithms (GA), tabu search, simulated annealing and Ant Colony Optimisation (ACO) [29].
Simulation modelling in logistics optimisation allows the operation of complex systems to be tracked and analysed without having to implement various activities. These procedures are particularly useful as they help to predict different scenarios and the potential risks of events, while risk analysis can be used to determine the optimal operating conditions. The most widely known simulation methods are discrete event simulation (DES), which is a time-based method that follows the sequence of events [30], and Monte Carlo simulation, which is a statistical method that uses random inputs and models using thousands or millions of different runs [31].
In addition to programming-based optimisation procedures, organisational and logic-based process development procedures have also been created. The Lean and Six Sigma methodologies have identified problems that can be observed during operation and addressed with simple solutions, including loss reduction, quality improvement and standardisation [32]. Parallel to the development of digital technologies, modern methodologies requiring IT support have been developed to facilitate optimisation, resulting in the emergence of Digital Twin technology [33] and IoT integration [34].
Nowadays, the popularity of artificial intelligence and ML-based techniques remains robust, and their use is becoming increasingly widespread in many industries. The application of predictive techniques can be particularly important in logistics processes; for example, demand forecasting can significantly support warehousing and capacity planning tasks, as it can prevent excessively high inventory levels or product shortages [35]. Various object detection solutions can be used to improve warehousing processes, helping to identify specific products and analyse capacities [36]. In addition to warehousing, these solutions can also support the optimisation of other processes, such as Reinforcement Learning methods, which are increasingly used for route planning and optimizing transportation networks [37]. In this research, ML-based regression techniques were used, but not as the primary goal of use, rather to support an alternative approach.
Effectiveness and novelty comparing of prior approaches to warehouse optimisation and this research are shown in Table 1.

2.2. Machine Learning Models

The purpose of ML-based models is to recognise patterns and correlations in the data sets under examination, which are then used to make predictions, decisions or classifications. Based on the information collected, they can apply the correlations to new, unknown cases and make estimates for these situations. ML models can be divided into two main groups: supervised learning and unsupervised learning.
The most important types of supervised ML are regression models. In this type of model, the predicted target variable is a numerical value, meaning that the model estimates a specific numerical value based on the specified independent parameters. The independent variables can be either numerical or categorical. In the case of categorical variables, they must be transformed into numerical values using encoding methods. In this research, the target variable depends on several variable values, so initially it is possible to write the predictive model as a multivariate linear regression:
y = β 0 + β 1 x 1 + β 2 x 2 + + β n x n + ε
where y is the dependent value, x 1 , x 2 , , x n are the independent values, β 0 is the intercept (constant term), β 1 , β 2 , , β n are the regression coefficients, and ε is the error term or residual.
There are numerous statistical indicators for evaluating regression models, which examine from different perspectives the quality with which a model can predict unknown target variables based on the trained data set:
  • MAE: Mean Absolute Error
  • MSE: Mean Squared Error
  • R2: Coefficient of Determination
In this research, the regression model is not used for prediction but rather for the extraction of patterns identified during model creation, thereby allowing various correlations between the target variable and other parameters to be identified. To extract patterns, it is essential that the evaluation of the model building is positive, i.e., the metrics presented above show sufficiently good ratios in relation to the predictive power of the model. If this evaluation is successful, hidden patterns can be extracted from the model (see Figure 2).
There are several interpretation techniques in ML that help understand the extent to which different input variables contribute to the value of the target variable. The most widely known technique is Feature Importance, which examines, specifies and ranks the importance of variables in a weighted list.
The SHAP (Shapley Addictive exPlanations) method iterates through all predictions and shows how each variable influences a given prediction. Like the feature importance method, it displays the independent variables in a ranking. The Partial Dependence Plot (PDP) shows how the model responds to the prediction when a categorical parameter is changed. By averaging these evaluations, the average level of change in the target variable resulting from a change in a parameter can be obtained.
These techniques are used in research to determine which parameters most influence the target variable, and the results are expressed in a target function that also includes the degree of influence.
In summary, although several optimization methods have been developed for warehouse operations, there is still a need for approaches that go beyond pure prediction and enable the extraction of hidden patterns from operational data. This perspective opens up opportunities for constructing optimization-oriented objective functions that are more closely aligned with real industrial processes. Therefore, the main objective of this research is to explore the applicability of ML-based regression models for identifying hidden patterns in warehouse performance data and to formulate an optimization-oriented objective function from the extracted relationships. Beyond demonstrating the predictive capabilities of the models, the aim is to highlight their interpretative power in supporting data-driven decision-making in warehouse management.

2.3. Dataset Introduction

In this research, a dataset containing 25,000 warehouse cases after data cleaning and preprocessing was used. The dataset presents the given warehouse with several characteristics, including both numerical and categorical variables. Initially, no information is available about the relationships between the variables. The dataset is freely available for download and use, ensuring transparency and reproducibility of the research [38].
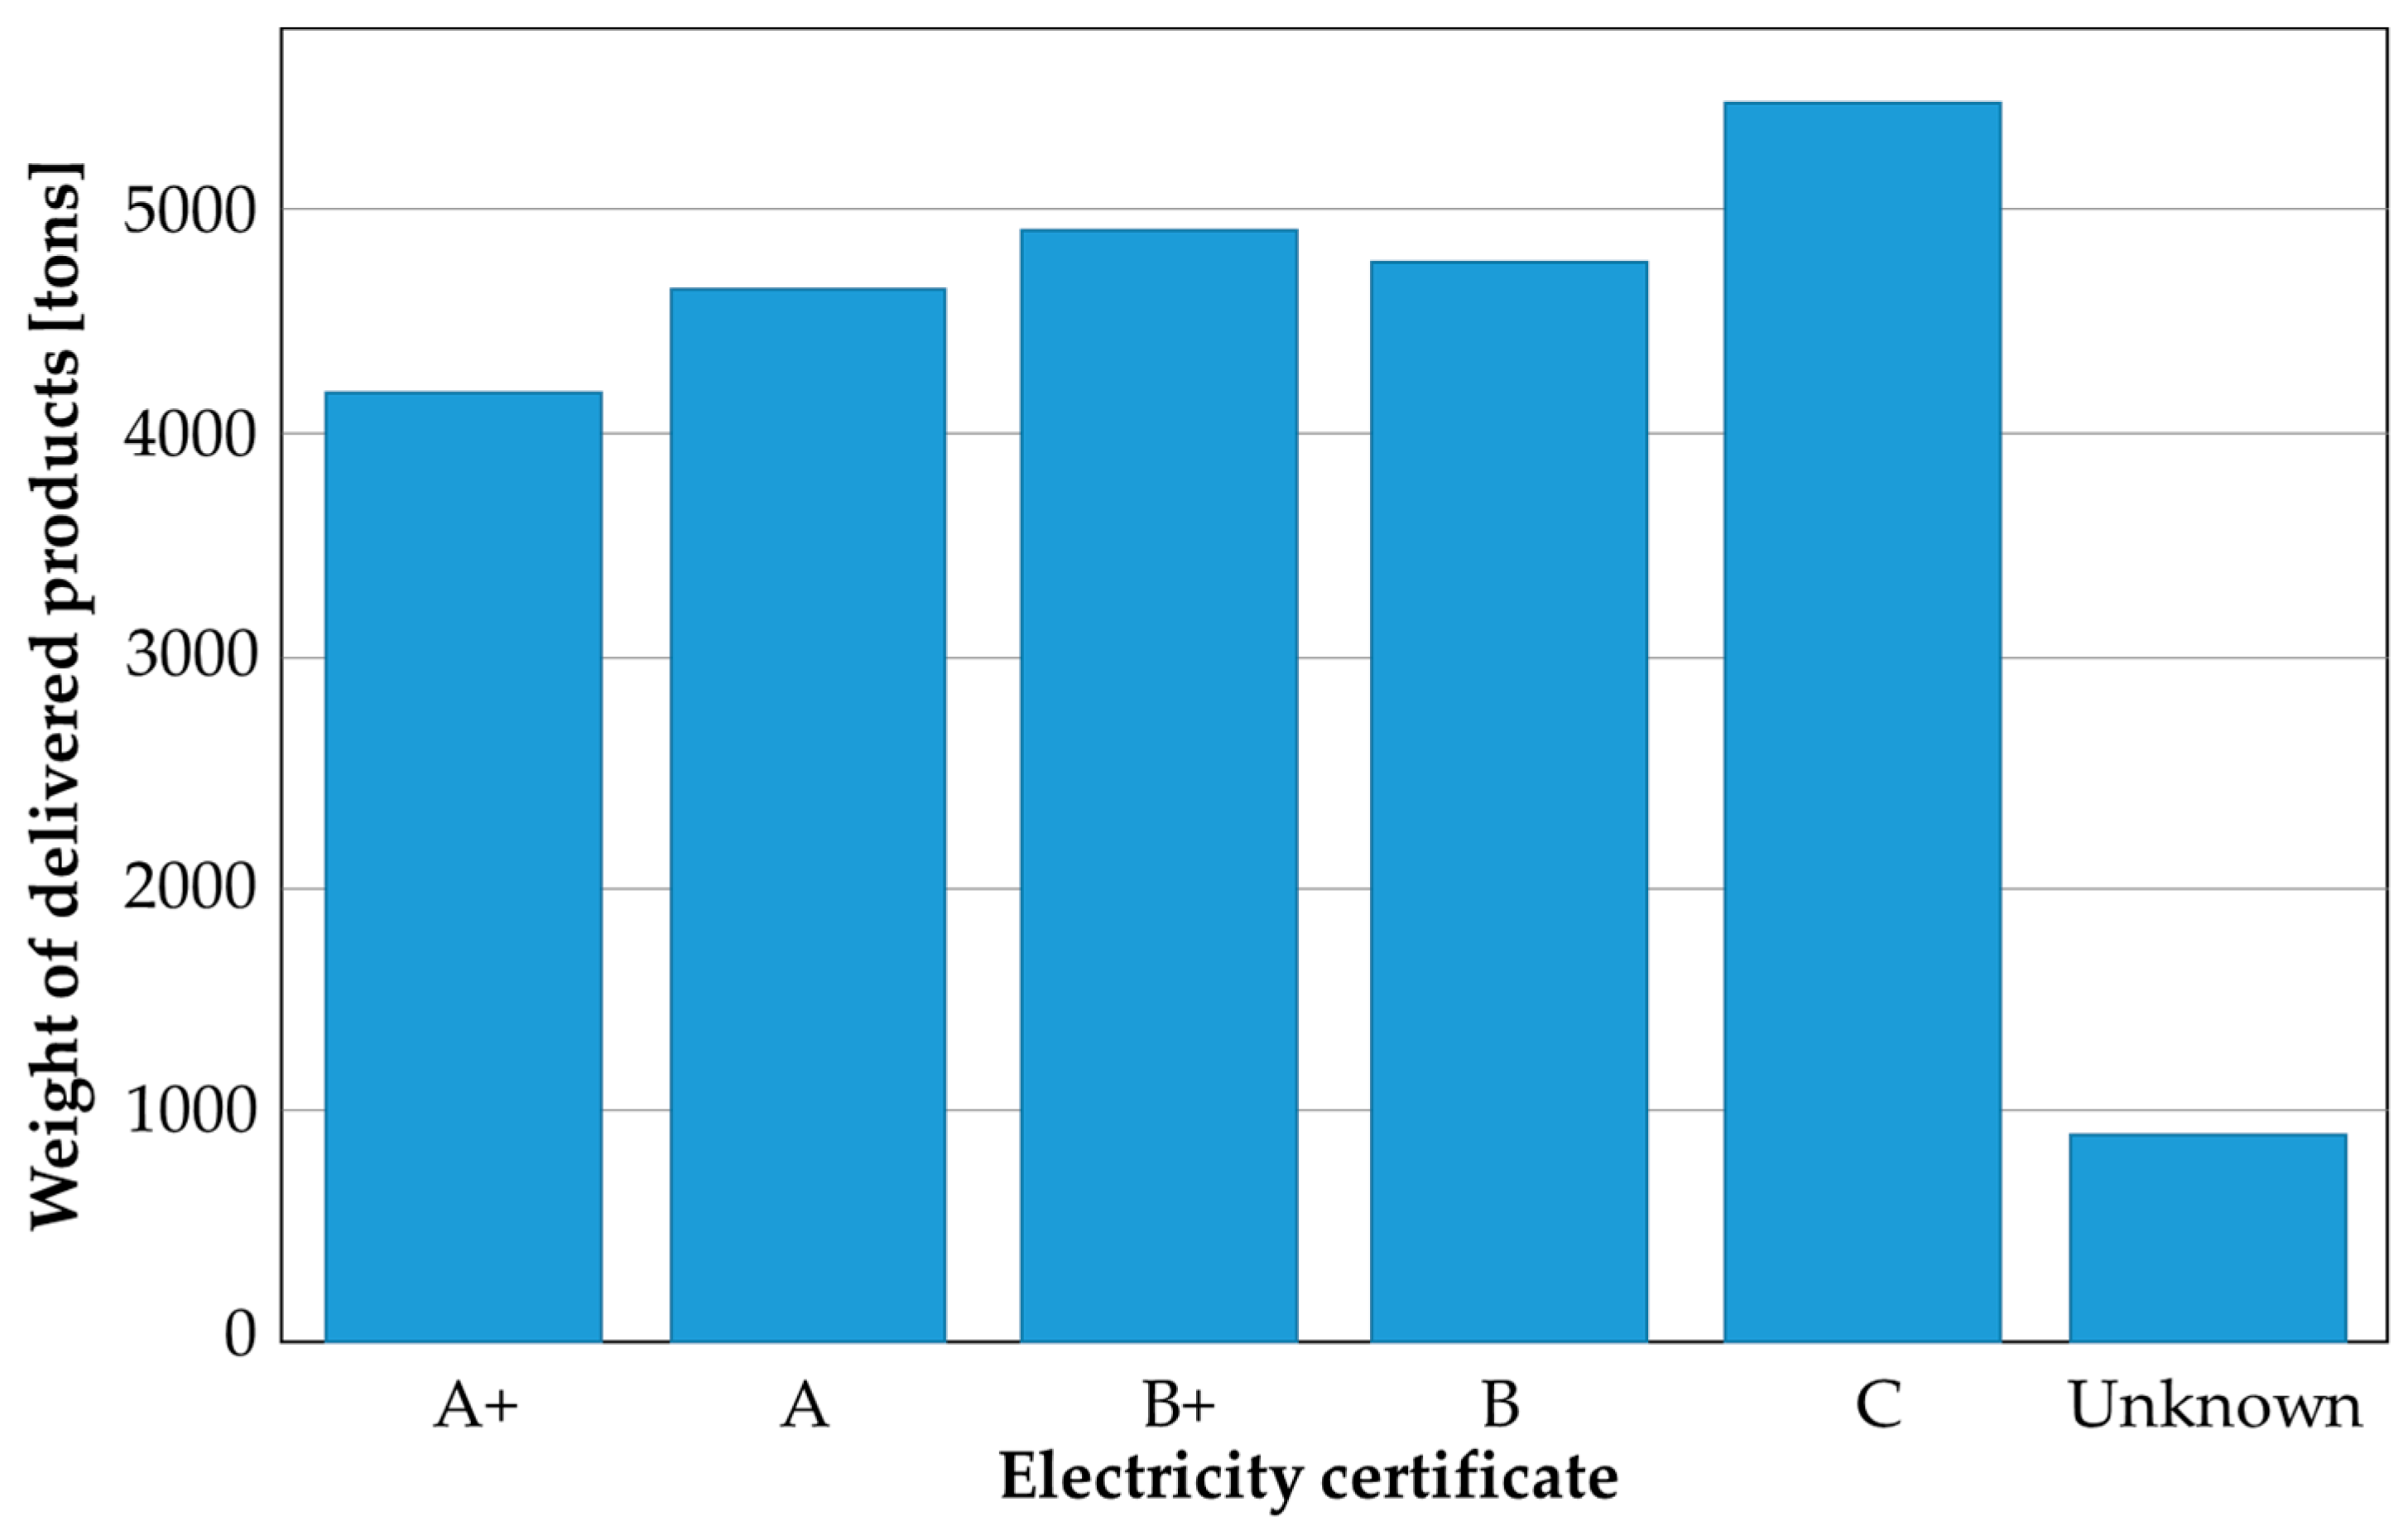
A total of 20 variables can be identified that may influence the target variable. These include variables describing location (e.g., type of location, zone, regional zone, etc.), parameters characterizing various events (e.g., shipping errors, warehousing errors during a given period), physical characteristics (e.g., geographical, electronic, etc.), and characteristics necessary for warehouse operation (number of employees, number of retailers served, distances, etc.) (Figure 3).
The target variable of the model is the weight (in tons) of the products delivered by the warehouse. This can be considered the most relevant parameter, as the goal in this research is to model this parameter with the highest possible quality, and then, using this model and extracting the hidden patterns, determine a possible, optimizable target function.
The main function of the violin plot is to display the information that can be shown by both the box plot and the histogram (Figure 4). The boxplot shows the general statistical characteristics (median, quartiles, and outliers), while the histogram shows the distribution of values. The distribution of the dependent variable values is suitable for building a ML model.

2.4. Exploratory Data Analysis

When recognizing data sets, it is crucial to identify the relationships between variables. Correlation analysis is a suitable choice for this purpose, as it is a statistical indicator that describes the linear relationship between variables on a scale of [−1, 1]. This is a good starting point, but the relationship between variables is not necessarily linear, and the analysis can only compare numerical variables; other methods can be used to analyze categorical variables.
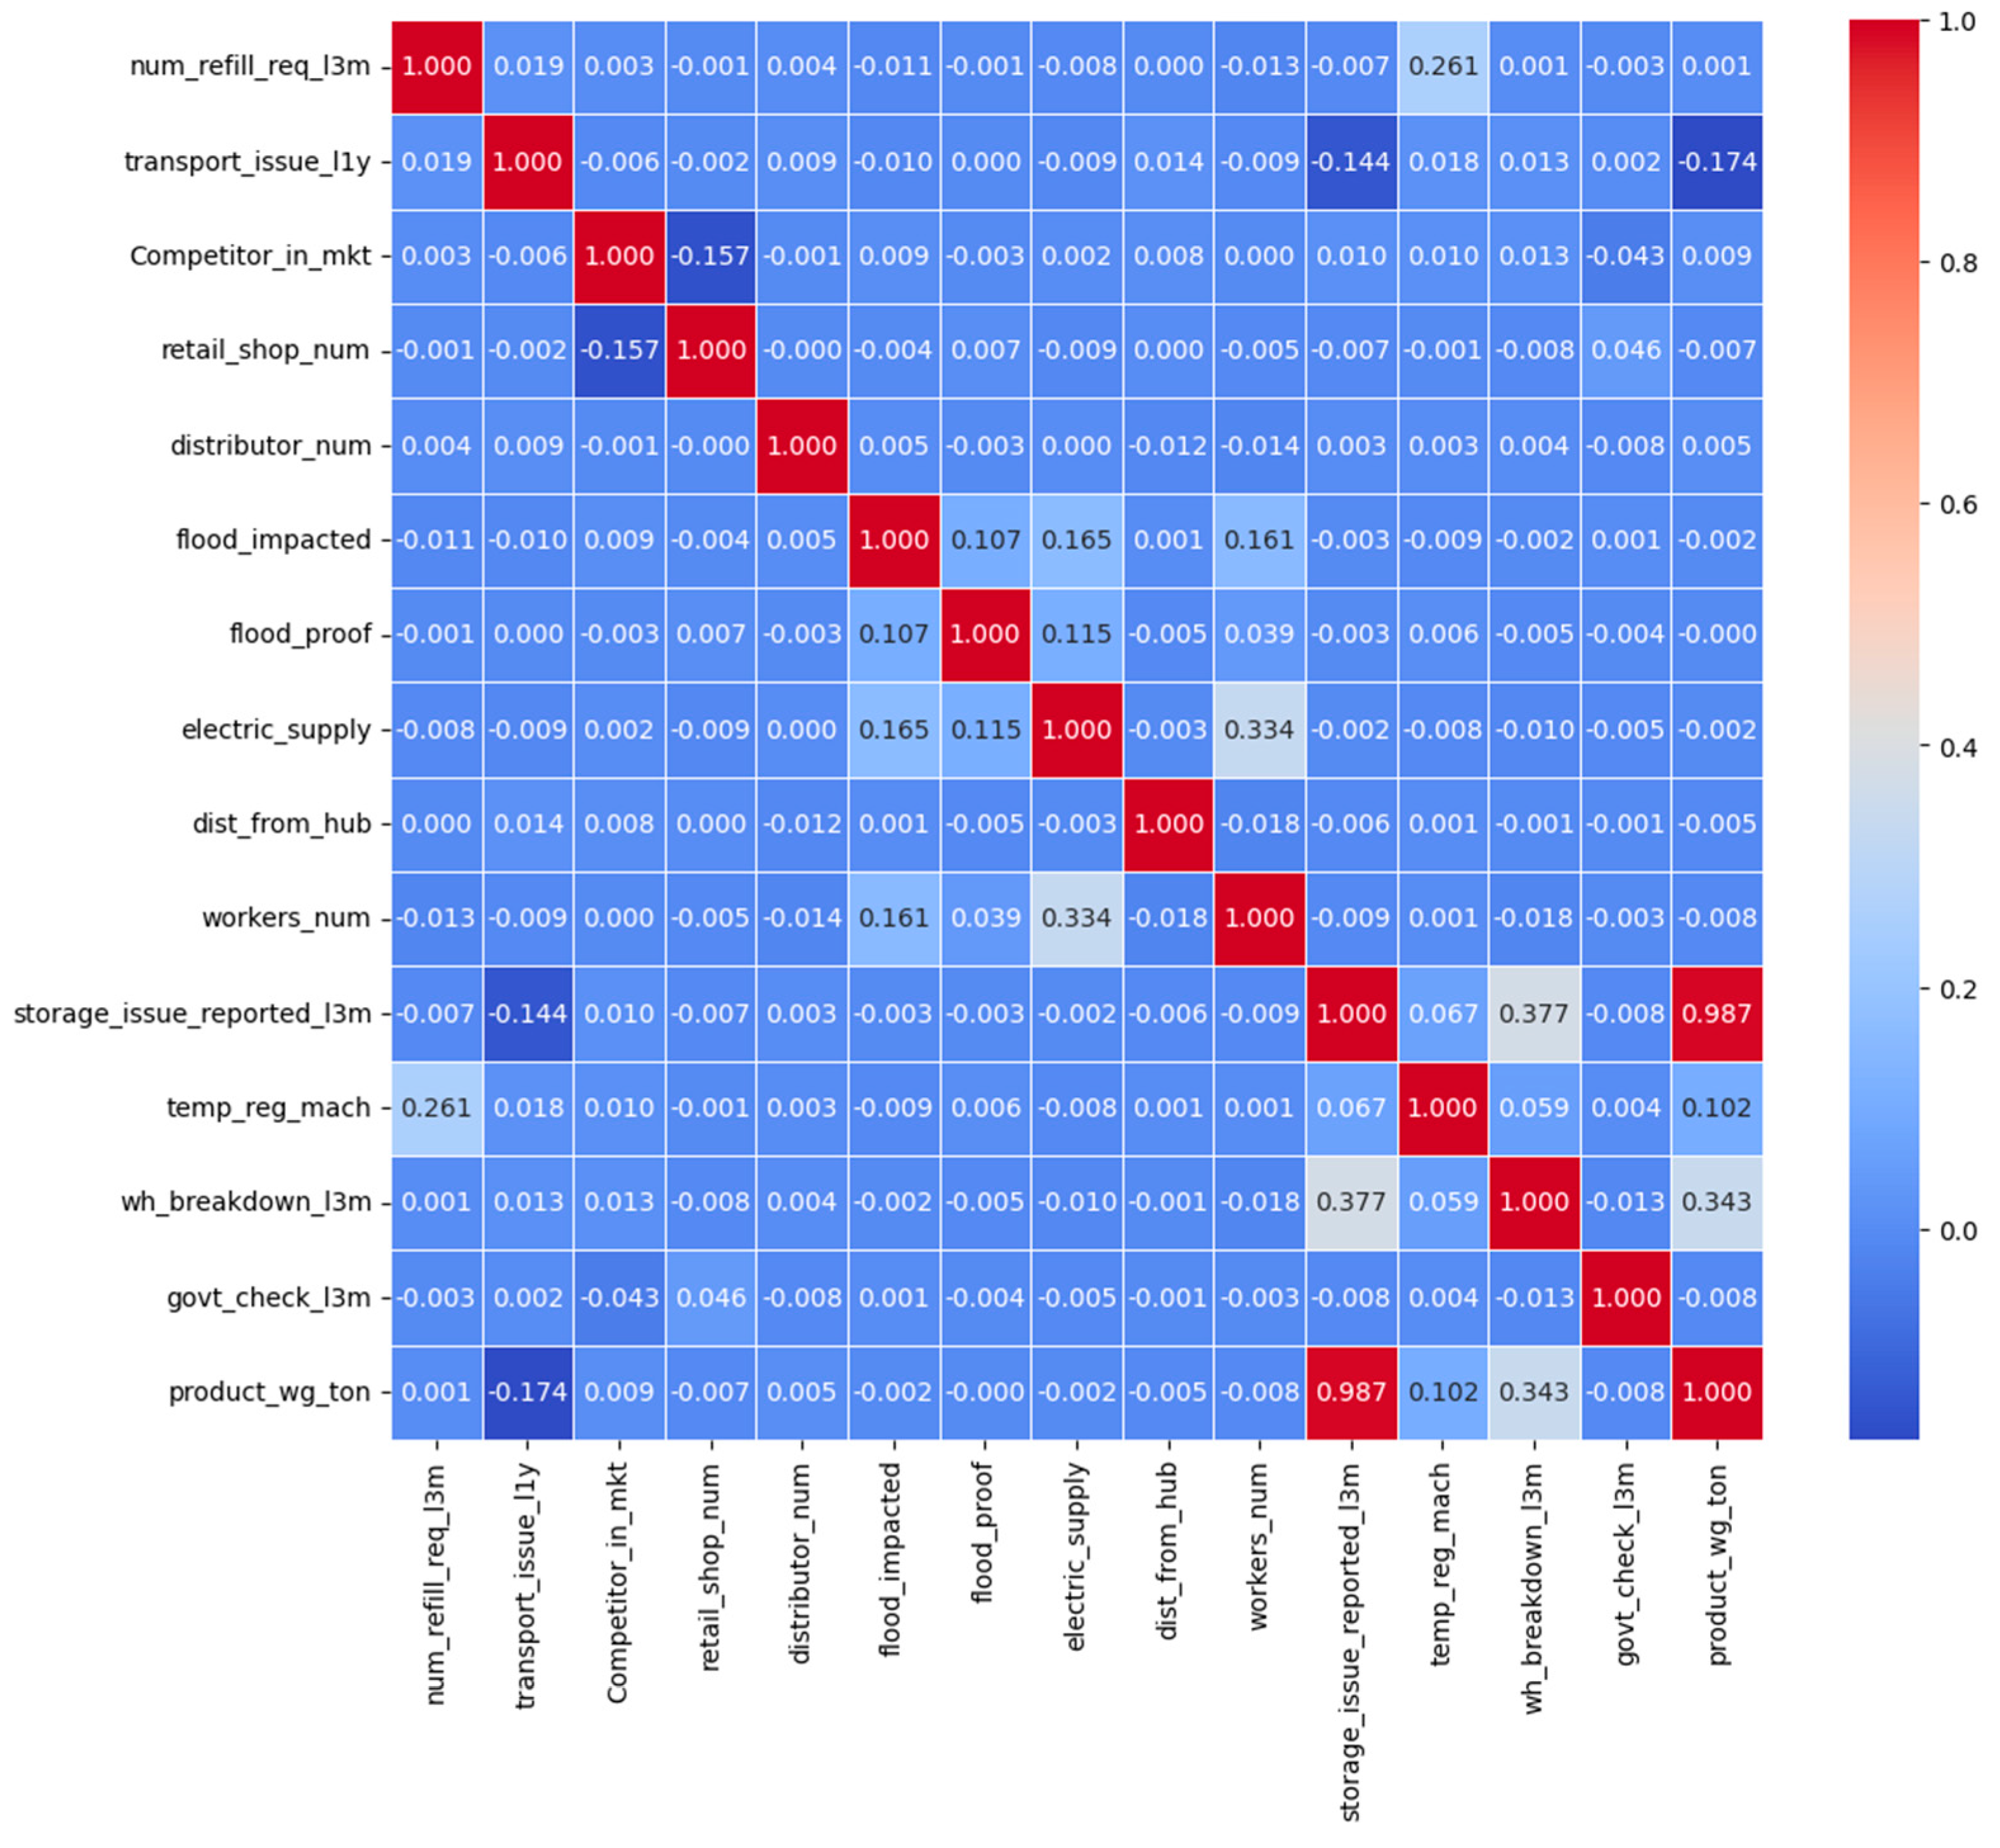
Figure 5 shows the correlations between the different variables. The focus is placed on the target variable, the “product_wg_ton” parameter. The target variable has the highest correlation value with another variable. The “storage_issue_reported_l3m” variable shows how many storage errors the given warehouse has reported in the last 3 months. The correlation is close to the maximum, which indicates a very high linear relationship. This relationship is also clearly visible in Figure 6. However, it is important to note that this indicator is not an influencing factor, i.e., increasing errors does not lead to an increase in warehouse performance, but is a consequence, as higher warehouse performance is associated with more operational errors. This observation also applies to the “wh_breakdown_l3m” parameter.
The goal of this research is to identify the parameters that influence and affect the target variable. This characteristic cannot be determined from correlation indicators; the determination and interpretation of relevant factors require the application of domain-specific knowledge in logistics.

2.5. Applying of Automated Machine Learning

Preparing and training machine learning models is very time-consuming, and each model must be trained separately. Automated Machine Learning (AutoML) began to spread in the 2010s. It is a concept that automates ML processes, thereby reducing the time required and the amount of human intervention in building systems [39]:
  • The process starts with data preparation, which includes data collection, data cleaning, and data augmentation.
  • Next comes feature engineering, where raw data is transformed into useful features. This involves feature selection, feature extraction, and feature construction. The outcome is the set of features used by the models.
  • In model generation, the search space is defined: it can involve traditional models (e.g., SVM, KNN) or deep neural networks (e.g., CNN, RNN). Performance is improved through optimization methods such as hyperparameter optimization and architecture optimization. The process can also include Neural Architecture Search (NAS).
  • Finally, in model estimation, efficient evaluation methods are applied to save computational resources: low-fidelity estimation, early stopping, surrogate models, and weight-sharing.
AutoML may be a suitable choice, as the goal is to select the best method for subsequent optimization. After evaluating the models, there are numerous opportunities for further development to improve model building, but the results offered by the AutoML methodology are already a suitable choice for filtering out correlations. The PyCaret open-source library is used for the application, as despite its low-code nature, it allows the automation of the ML processes required for this research.
The authors have chosen PyCaret because it provides a unified and low-code framework for rapid prototyping, model comparison, and reproducible experimentation. While more specialized libraries may exist, PyCaret integrates multiple algorithms and preprocessing steps under a single, standardized. This not only accelerates the experimental cycle but also minimizes the implementation overhead, allowing researchers to focus on the scientific problem rather than technical details. Furthermore, prior familiarity with PyCaret ensured an efficient workflow, reducing the cognitive and time costs associated with learning a new framework. In this context, the choice of PyCaret is scientifically justified by the trade-off between ease of use, reproducibility, and research efficiency.
Based on Table 2, it can be observed during the evaluation that an AutoML model examines several ML models and provides feedback based on various metrics. In the case of models built on the data set, the Light Gradient Boosting Machine (LightGBM) model provides the best evaluation according to all indicators, so this model will be used for this research.

2.6. LightGBM Model

Gradient Boosting Machine is an ensemble learning technique that typically trains decision trees iteratively, with each new model correcting the errors of the previous ones. The algorithm optimizes predictions by moving in the direction of the gradient of the loss function [40].
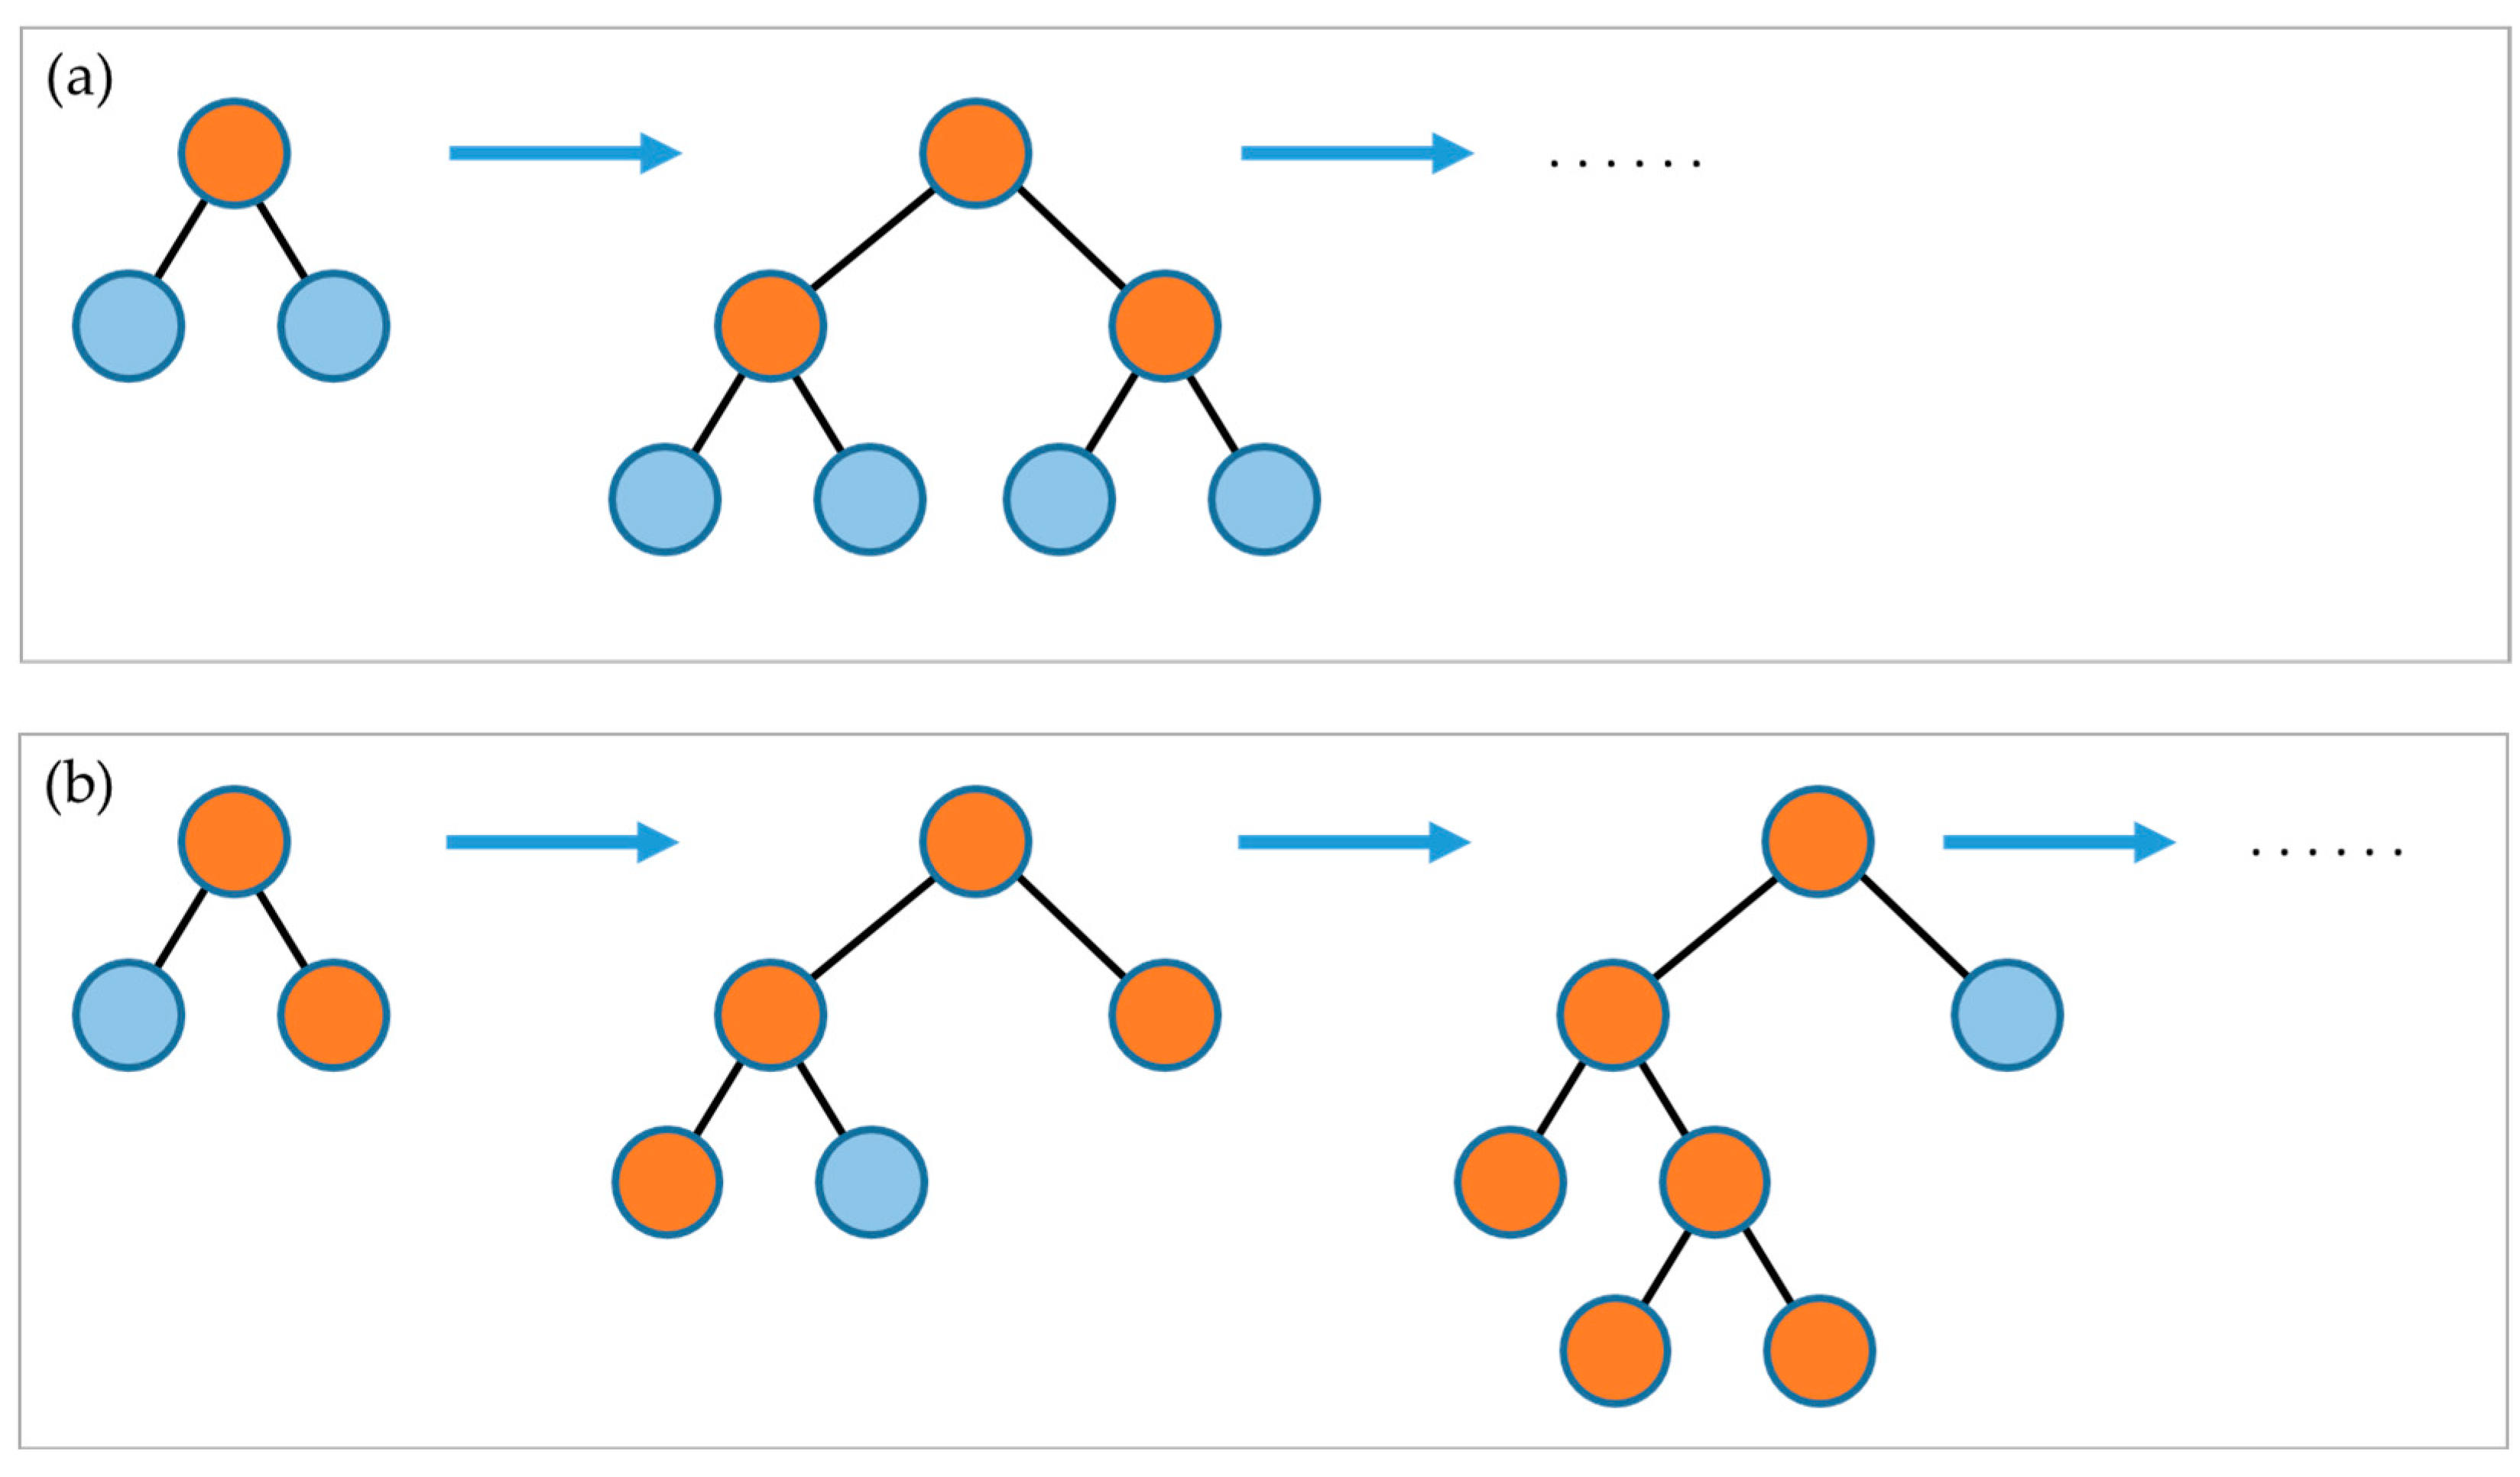
In recent years, several improved versions of the GBM algorithm have appeared, the most popular being CatBoost, XGBoost, and LightGBM. The latter model was published by Microsoft Research Asia in 2017. Its goal is to be faster and more efficient than previous GBM implementations, especially with large data sets and high dimensions. Figure 7 shows that the traditional GBM algorithm builds the decision tree level by level, expanding all leaves at each level before moving on to the next level. In contrast, the LightGBM algorithm uses leaf-level growth, meaning that it always expands the leaf that results in the greatest error reduction [41]. Furthermore, decision trees are also capable of predicting numerical values, so these models can be used to solve regression problems [42].
For later use, the model was generated using the LightGBM library, where an exceptionally high R2 value of 0.994 was also obtained, corresponding to the result shown in Table 1.

3. Results

The following chapter presents the main question examined by the research, namely the potential uses of ML methods for logistics performance optimisation. Section 3.1 examines the results of the feature importance and SHAP methods, highlighting the parameters found to be most important. These indicators are examined in Section 3.2, which uses the PDP methodology to examine the consequences of changing a given variable. The resulting methodology is presented in Section 3.3 through mathematical modelling.

3.1. Feature Importance

The objective of this research is for hidden relationships to be extracted from the constructed model and used to develop an optimisation model. To achieve this, a number of methods have been developed and are incorporated in order to explore the widest possible range of relationships.
The most common method for achieving this is feature selection, which is generally a data preparation step in ML modelling, as it helps to select the most relevant variables when building a model. As a result, overfitting can be reduced, as less but more relevant data helps to generalise. In addition, it speeds up implementation time, improves model performance, and makes the model easier to interpret thanks to fewer variables. There are several methods for implementing this:
  • Filter Method: features are selected not based on model performance, but on some statistical or information-theoretic measure (correlation, mutual information, chi-squared test, ANOVA).
  • Wrapped Method: a learning algorithm is wrapped into the feature selection process, which is evaluated based on various metrics, and the method selects the best method.
  • Hybrid Method: a combination of filter and wrapped methods for feature selection on large data sets [43].
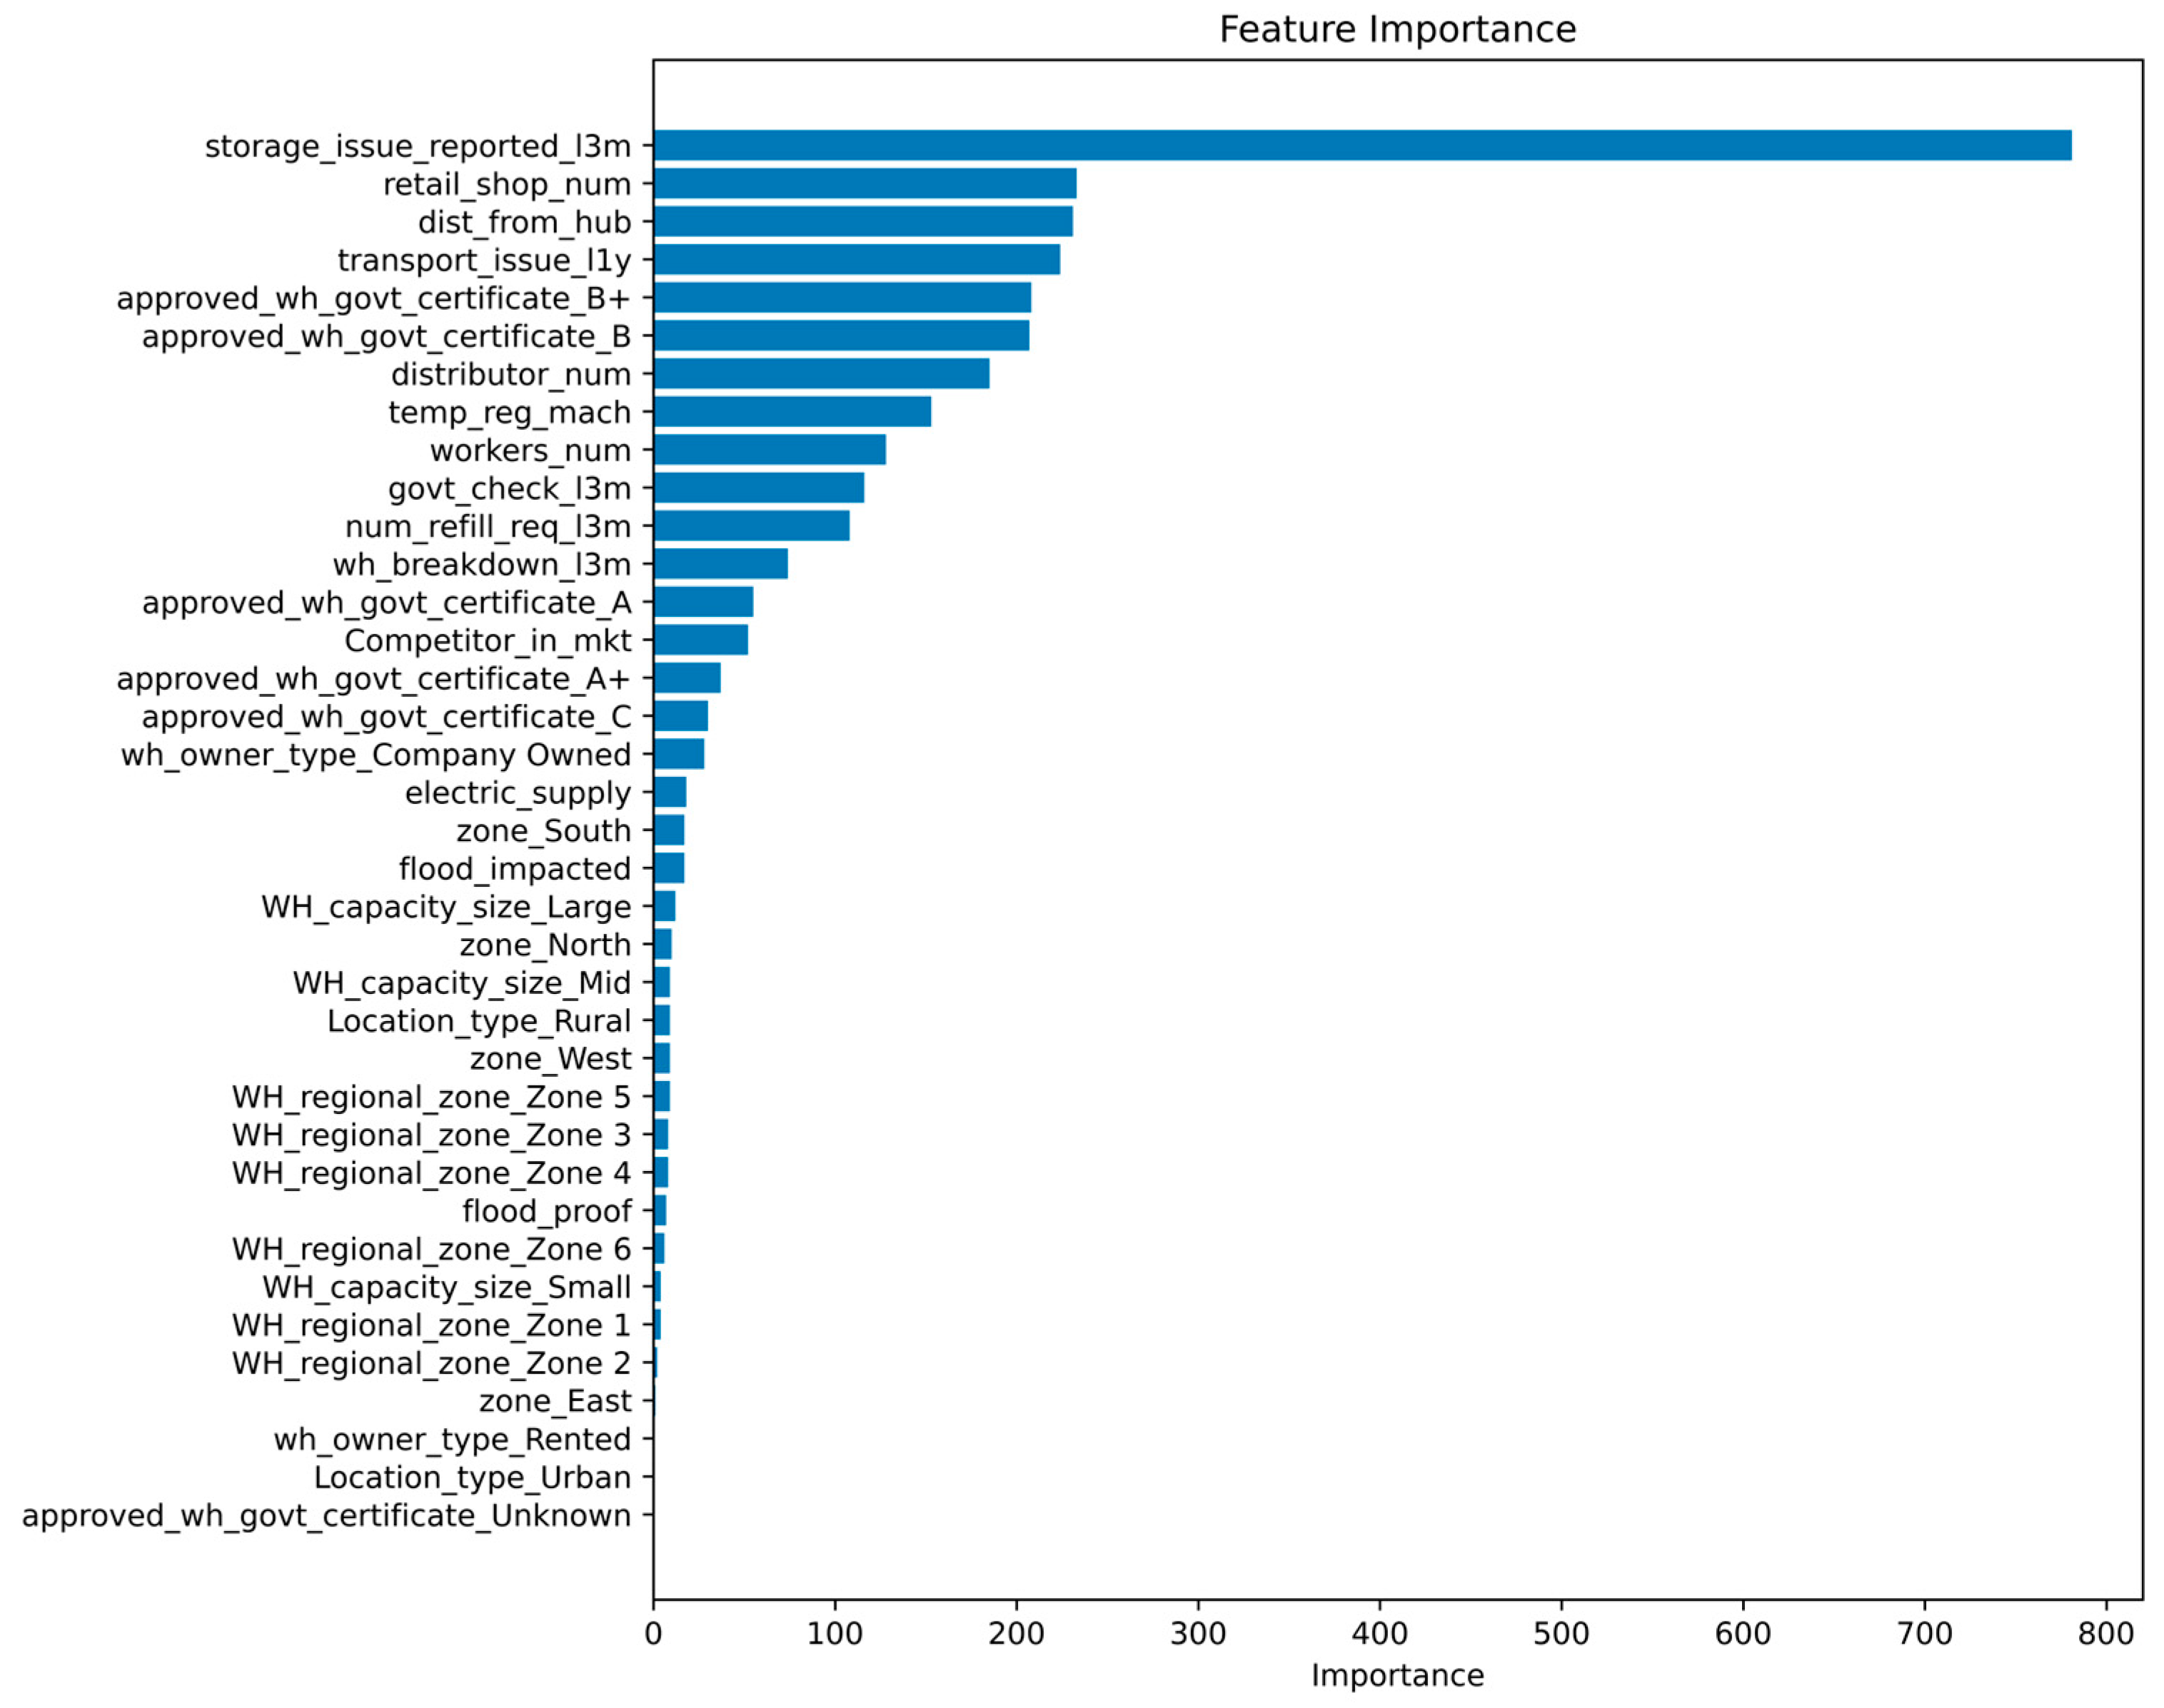
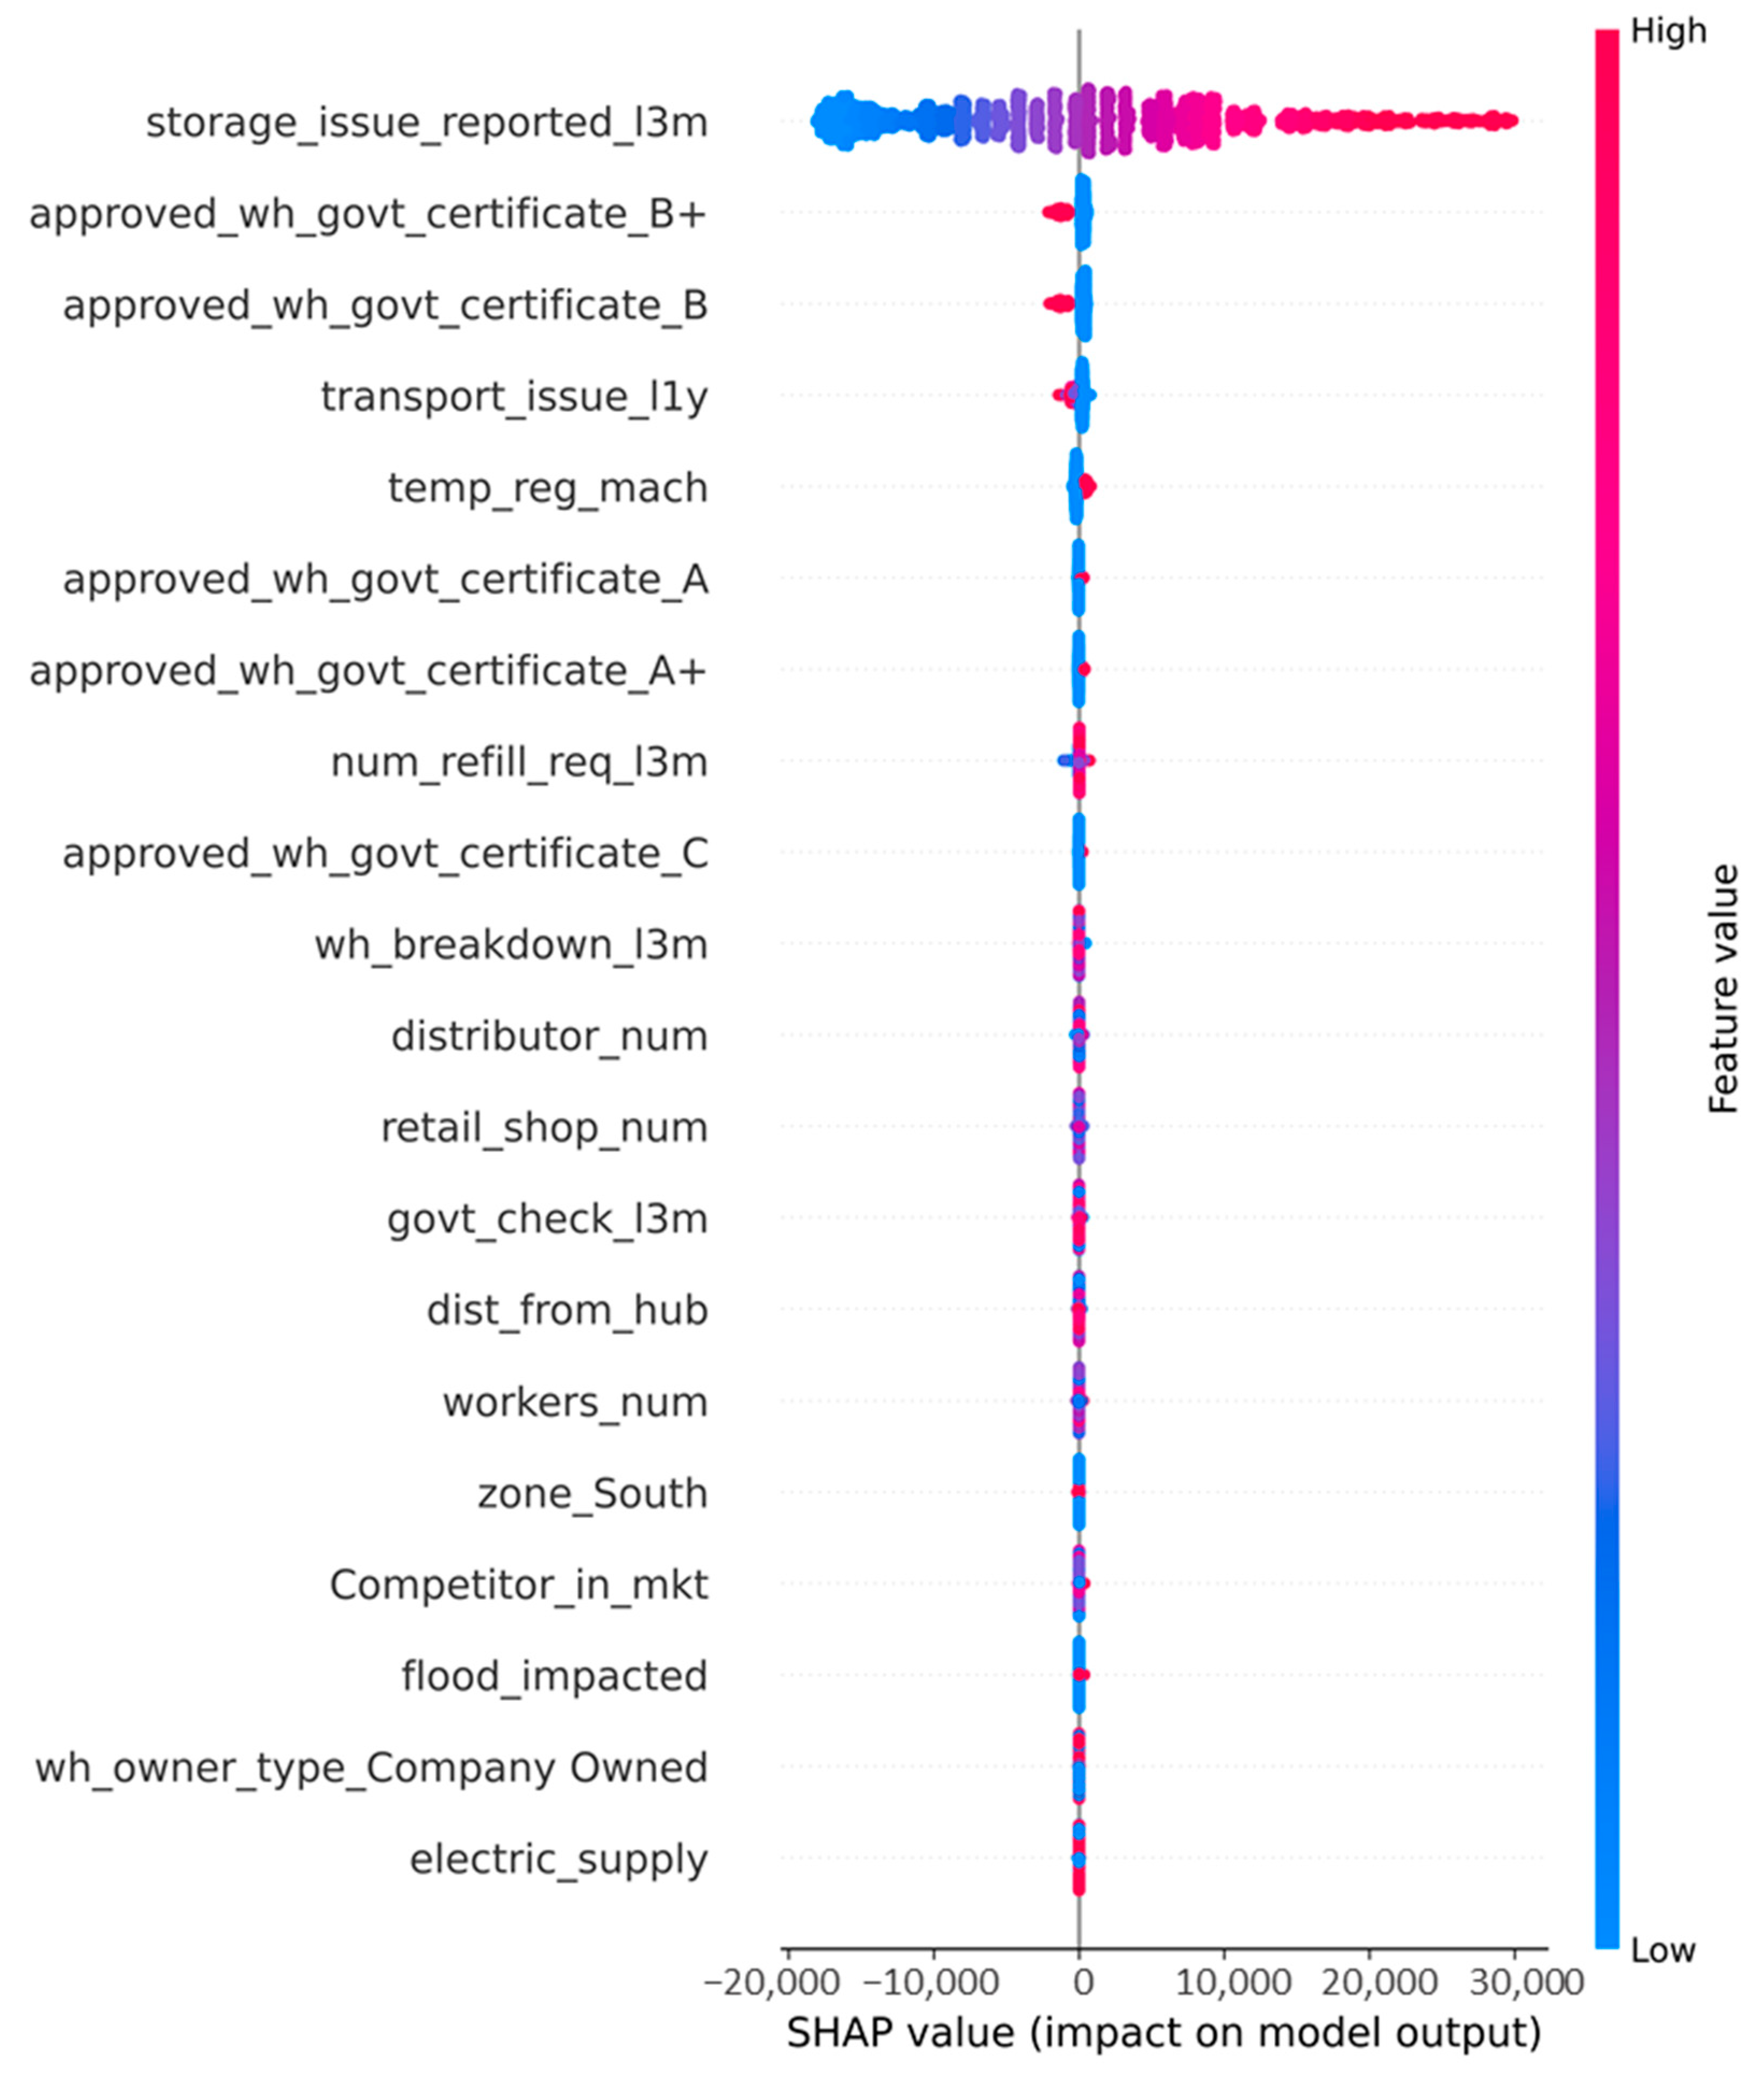
We chose the embedded method for the application, as the feature selection performed during training can be efficiently queried using the model library. Figure 8 shows the most influential variables. The most important parameter is the number of reported storage errors, but as Section 2.4 shows, this is a general consequence of high storage performance rather than an influencing factor that may be important in optimising mathematical modelling. However, several other parameters can be shown to be important, which may indeed be influencing factors: the number of transport errors, the number of retailers and employees, distance values, and encoded energy certificates may also influence storage performance. The following section discusses these parameters.
Another approach to extracting the importance of variables is the SHAP method, which is widely used in the interpretation of ML models, especially in the case of neural networks and GBM-based methods. The method is based on Shapley values, which are derived from game theory: the model’s prediction is treated as a ‘payoff’ and the values are distributed among the parameters according to their influence. Thus, the summary plot shows all predictions, so each variable has a one-dimensional scatter plot. Its position on the x-axis shows how much the given parameter increases or decreases the prediction in the given observation. The colour of the point shows its characteristic value, which helps to understand which characteristic values cause positive or negative SHAP values [44]. Based on visual inspection, it can be concluded that although there are differences between the SHAP and feature importance methods, a good conclusion can be drawn about the influencing parameters in terms of pseudo-probability. Reasons why reliable conclusions can be drawn despite differences between SHAP and feature importance:
  • Both methods consistently highlight overlapping key features.
  • SHAP explains local, instance-level effects, while feature importance captures global trends.
  • Normalization and averaging increase stability of results.
  • Using two independent techniques reduces bias of a single method.
  • Differences reflect complementary perspectives rather than contradictions.
  • Cross-validation of results strengthens interpretability and trustworthiness.
  • Robustness is enhanced because similar influential parameters appear under different assumptions.
Both methods are widely validated in ML literature for feature interpretability. After calculating the values of the two models (Figure 9), the parameter values were normalized using the MinMaxScaler method, then averaged the results of the methods, based on which the following parameters can be considered significant influencing factors:
  • transport issue l1y;
  • certificate;
  • retail shop num;
  • dist from hub;
  • distributor num;
  • temp reg mch;
  • workers num.

3.2. Parameter Value Changes

The value of a target variable depends on various parameters, but it is possible to check what effect a given variable has on the value of the target variable. PDP is a visualisation technique that helps to understand how one or two input variables affect the predictions of a ML model on average, filtering out the effects of all other variables. The procedure helps to interpret models, supports the exploration of nonlinear relationships and the examination of feature importance.
During the research, various parameters are examined and analysed, and the level of warehouse performance achievable by changing their values is determined. The aim of the analysis is the exploration of possibilities that can be extended to real industrial problems if the costs of changing the parameters are also available. The LightGBM model was also used to create the figures.
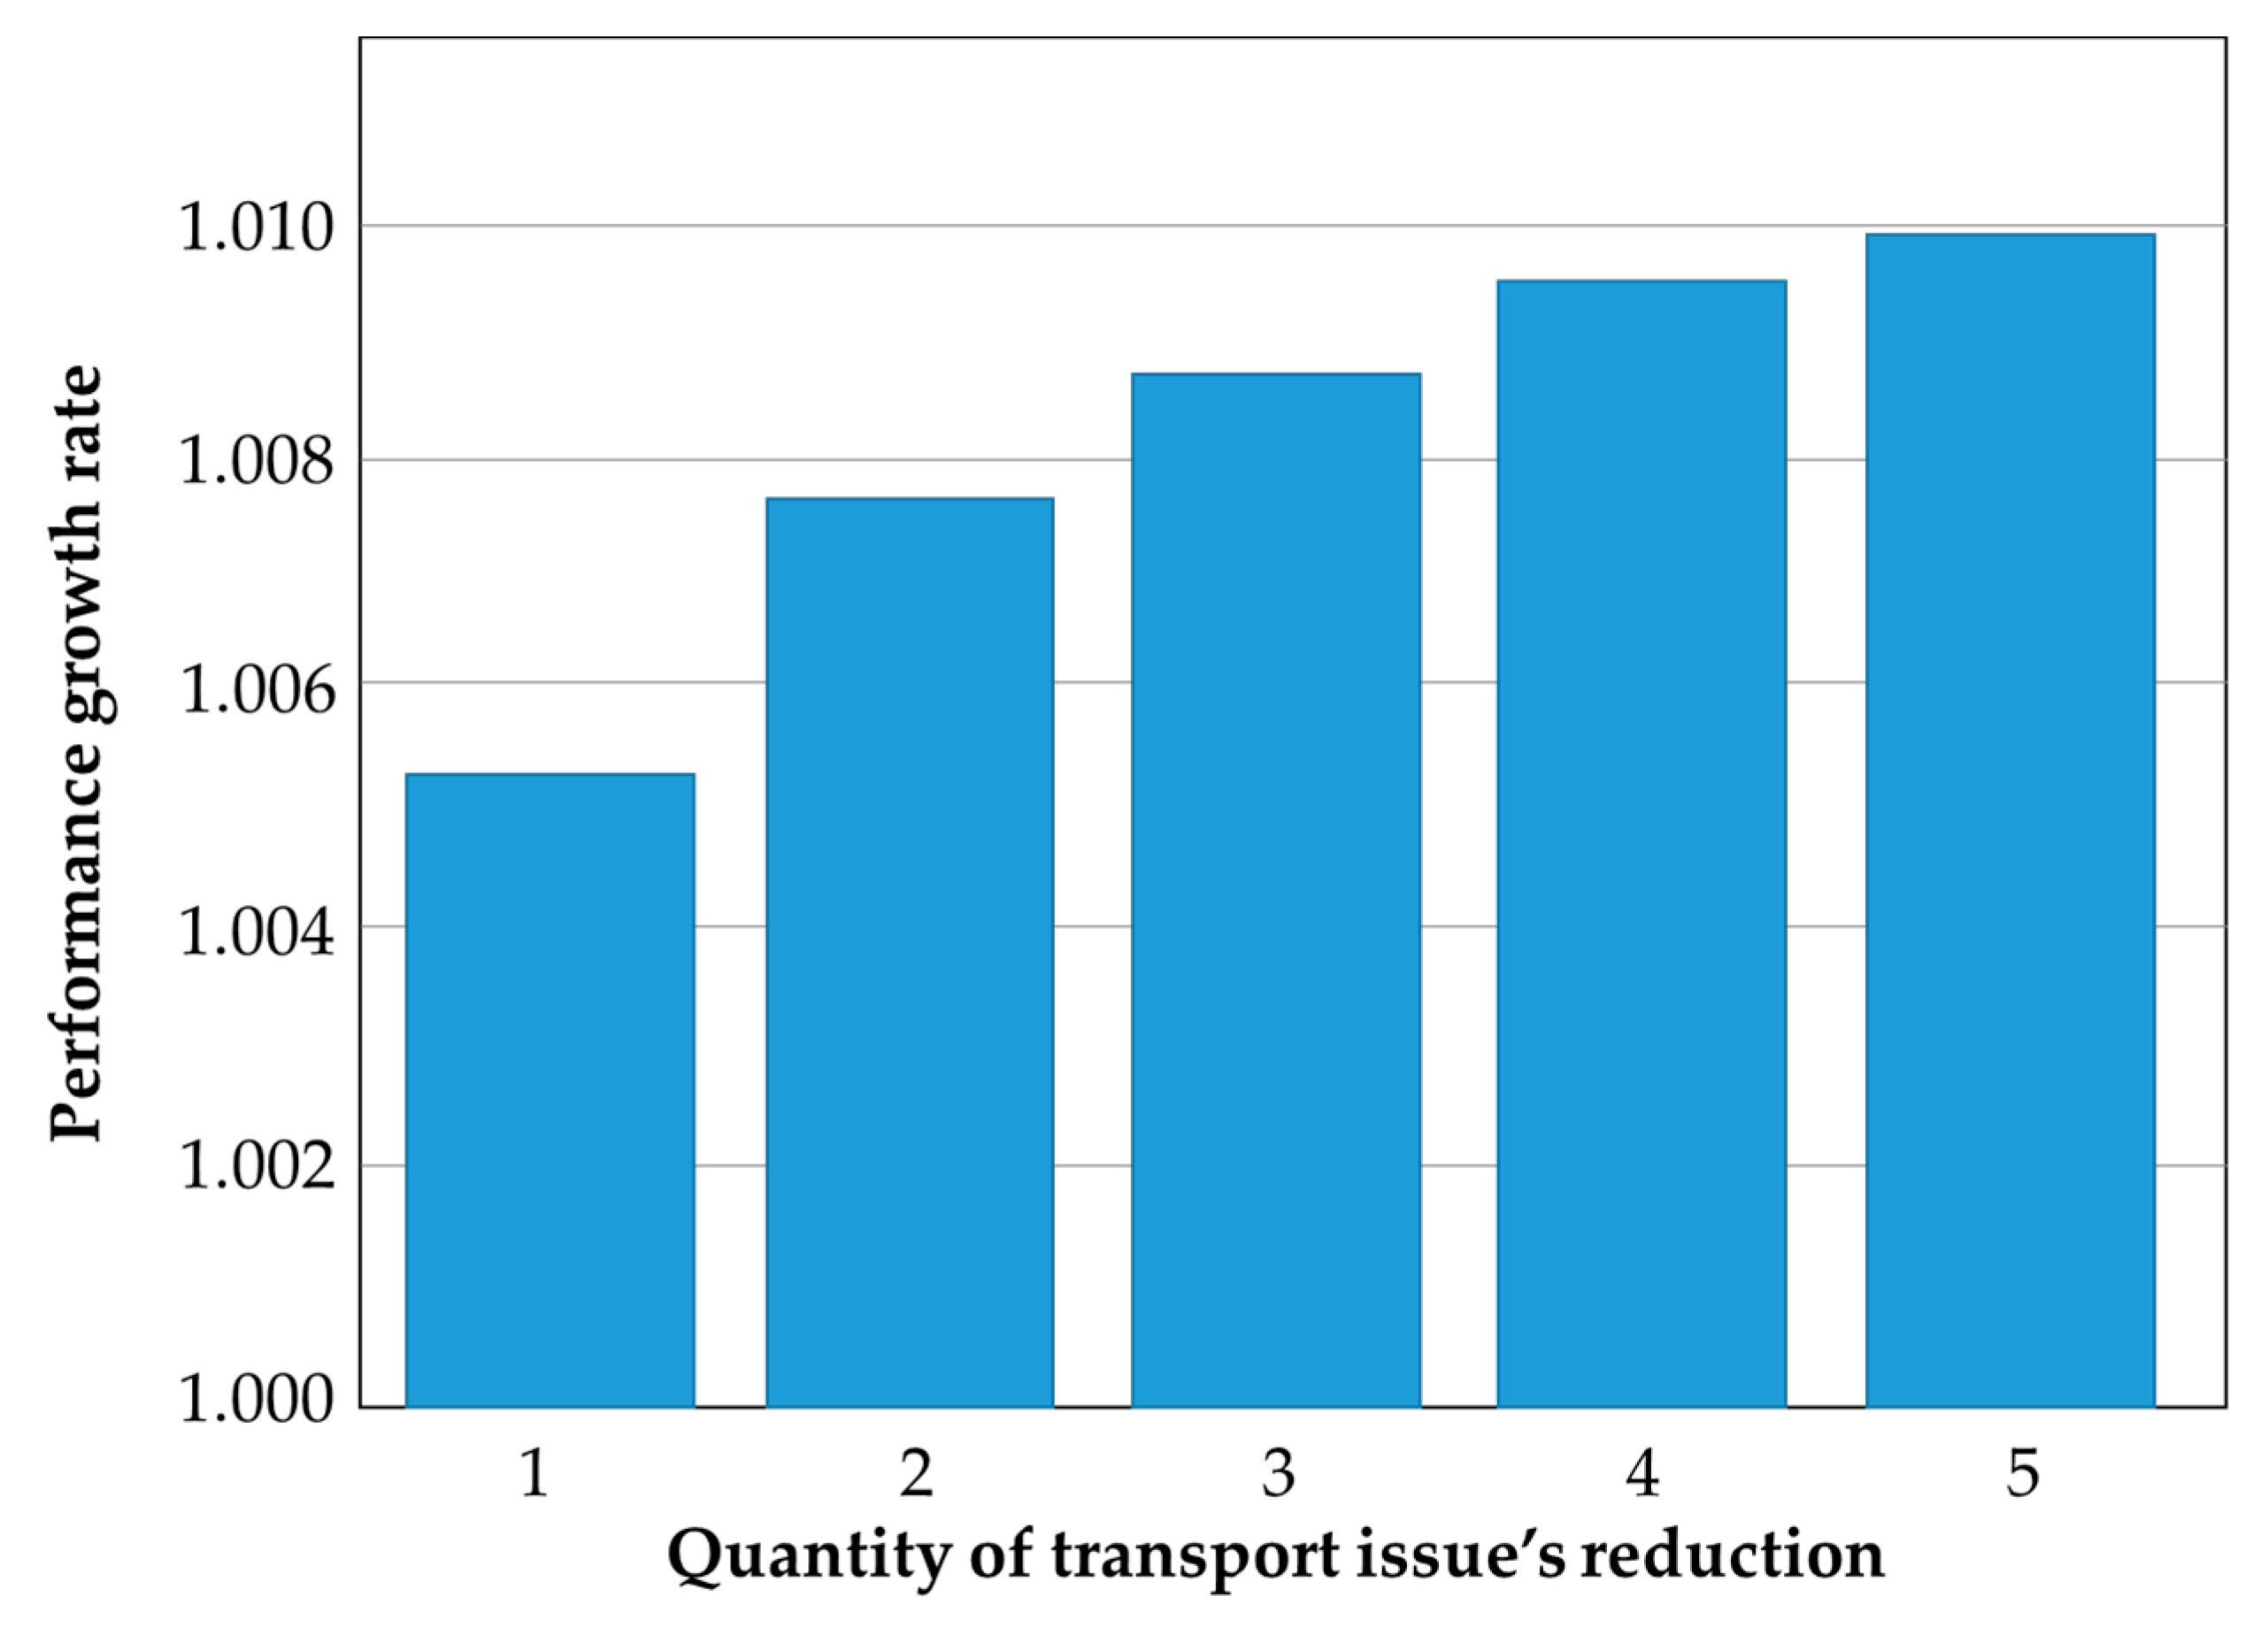
First of all, the delivery errors that occurred in the past year are examined. In the dataset, a maximum of 5 delivery errors were recorded for a single warehouse. If all errors are reduced to zero, a 1% improvement in performance is shown by the model. However, if the number of delivery errors is reduced by only one, a 0.5% improvement can be achieved. The latter scenario is considered much more feasible, as avoiding all delivery errors requires significant investment; therefore, it is not reasonable to reduce them to zero, but avoiding a single error is realistic, and the 0.5% increase may be worthwhile. Figure 10 shows the extent of performance improvement according to the predictive model for the amount of error reduction at a given warehouse (the value ‘1′ indicates that every storage error with a value of at least 1 is reduced by 1, while smaller values are set to 0).
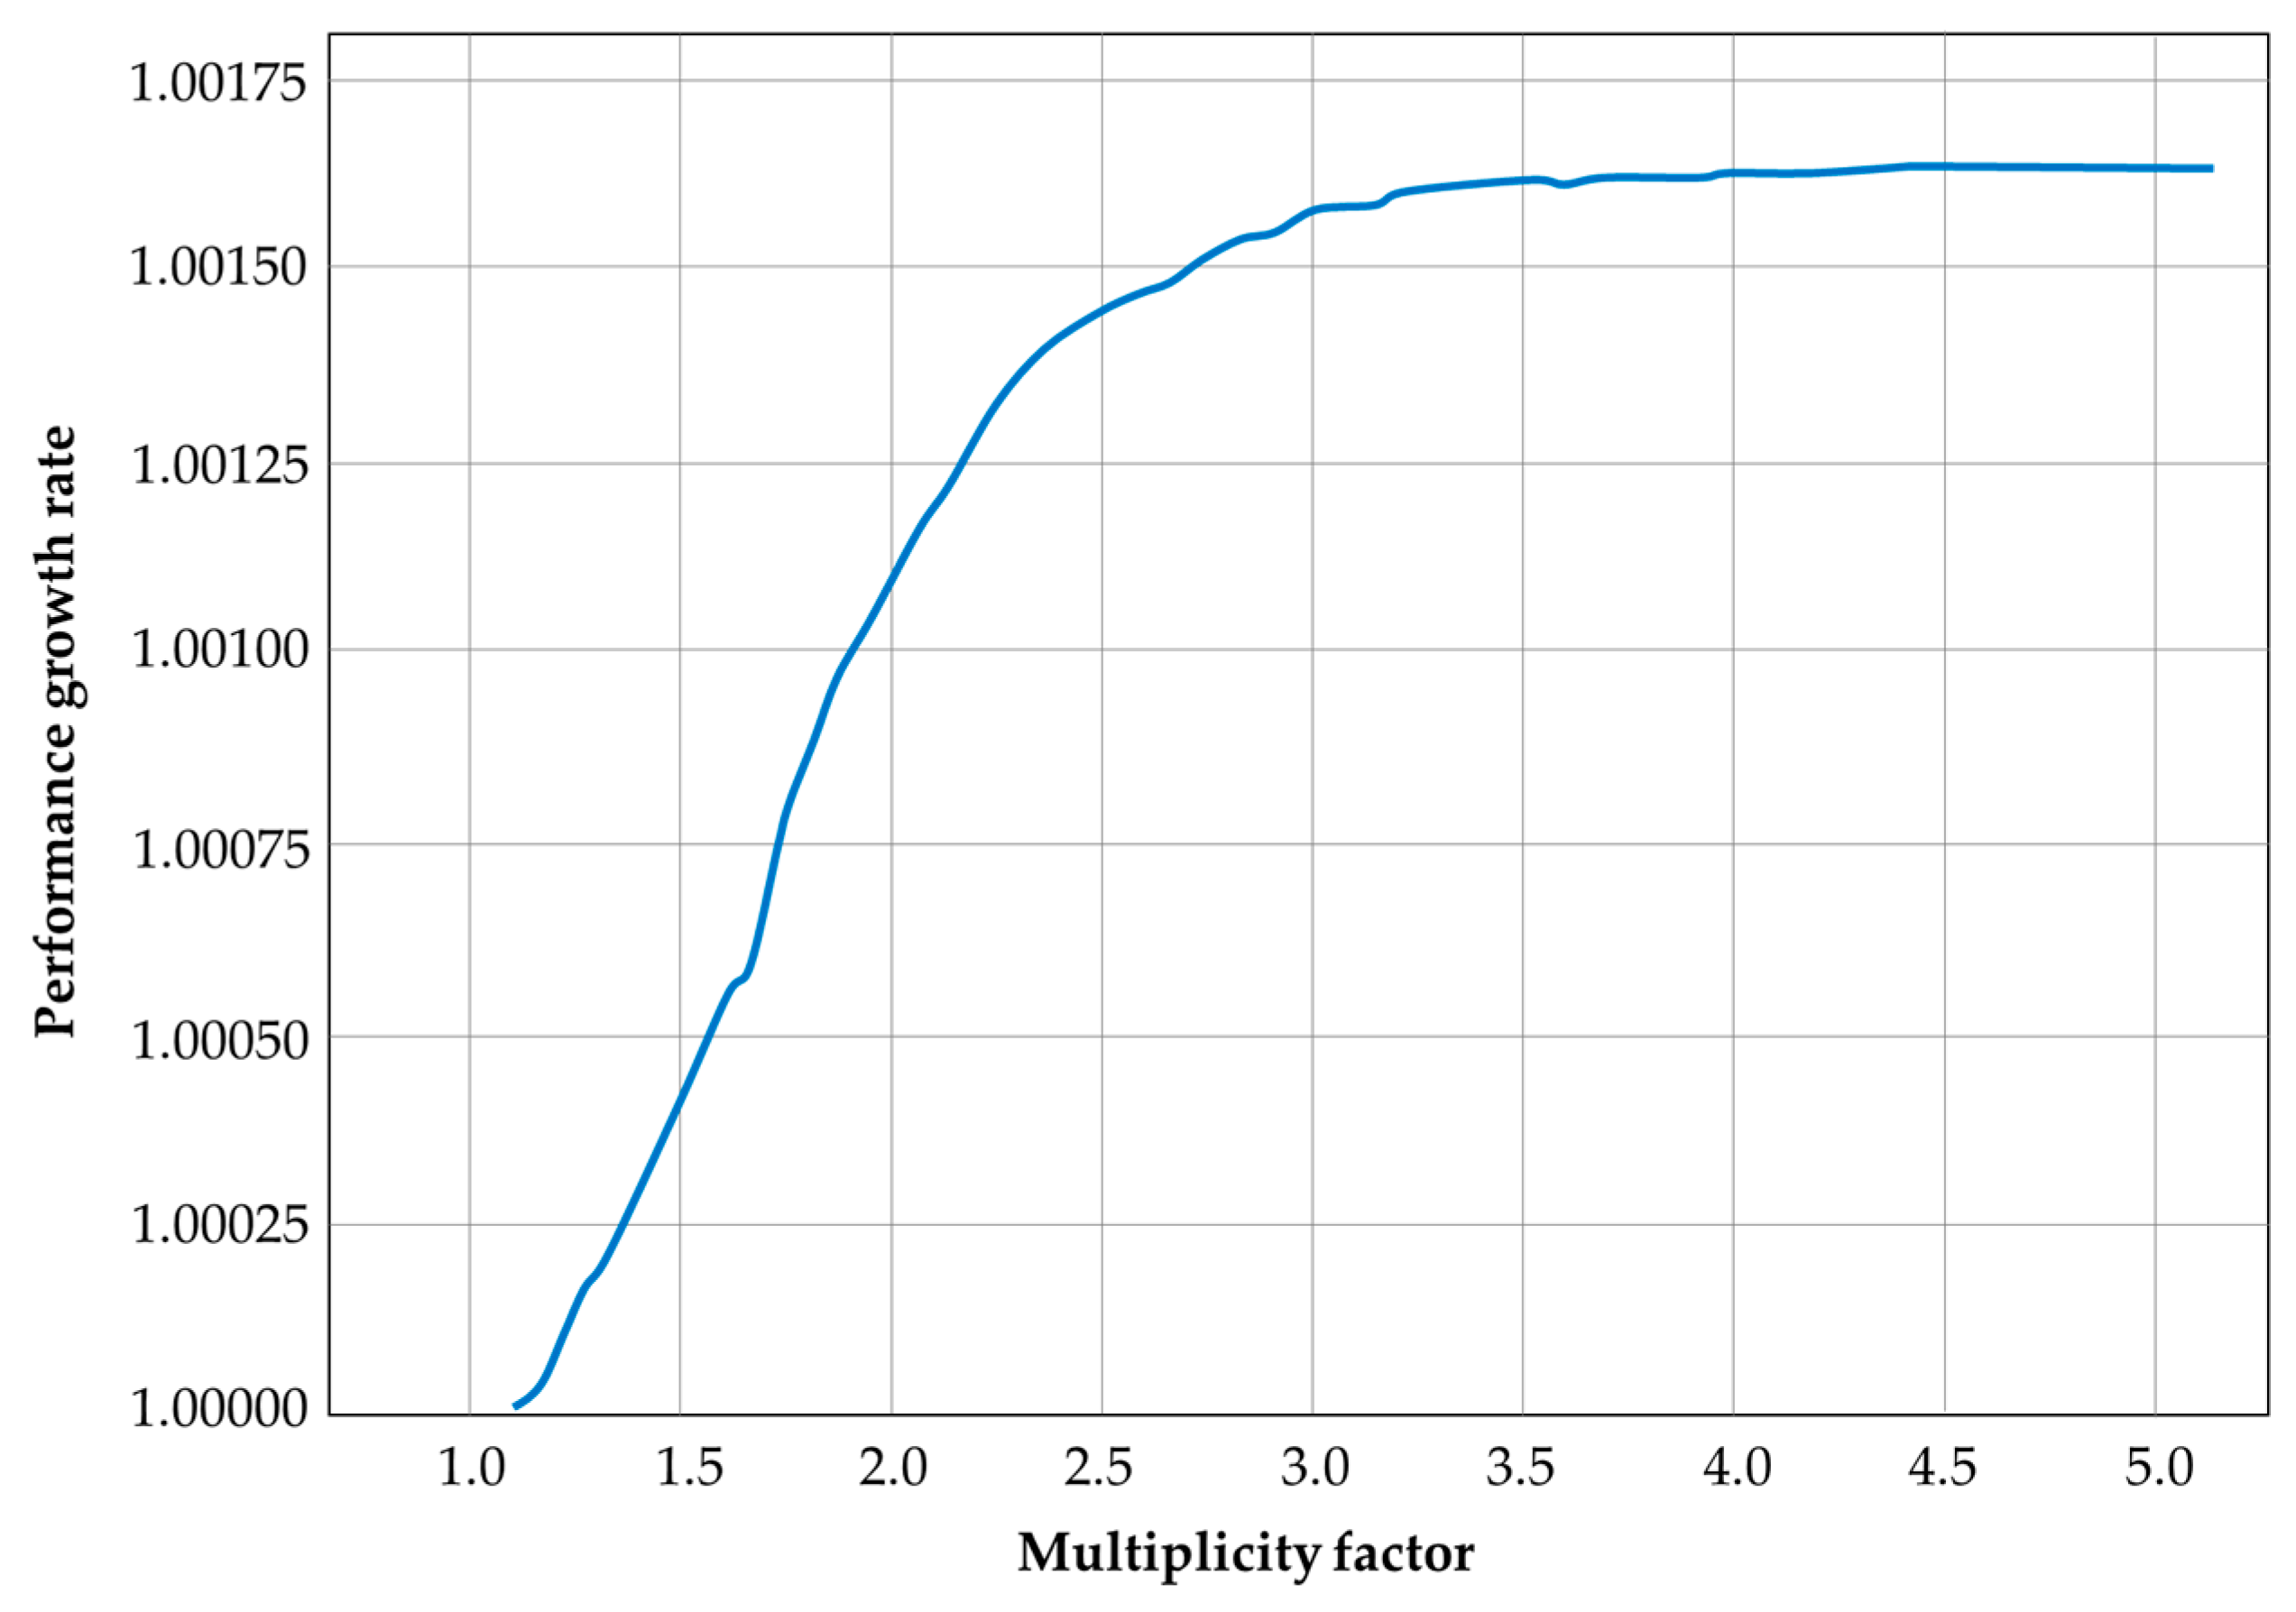
Warehouse performance is related to the number of warehouse workers. However, it is also important to examine the cost of increasing the number of workers and how this relates to the surplus resulting from the increase in performance. This can be calculated precisely in the given industrial case; the research examines the determination of surplus performance using the PDP method. Figure 11 shows the rate of increase in warehouse performance if the number of employees is increased by a given multiplier. It can be concluded that doubling the number of employees would increase performance by 0.1%. Even in the absence of any other information, this cannot be considered a significant increase, but the method can be validated because feedback is obtained from a reliable model without considering the added value of the other parameters.
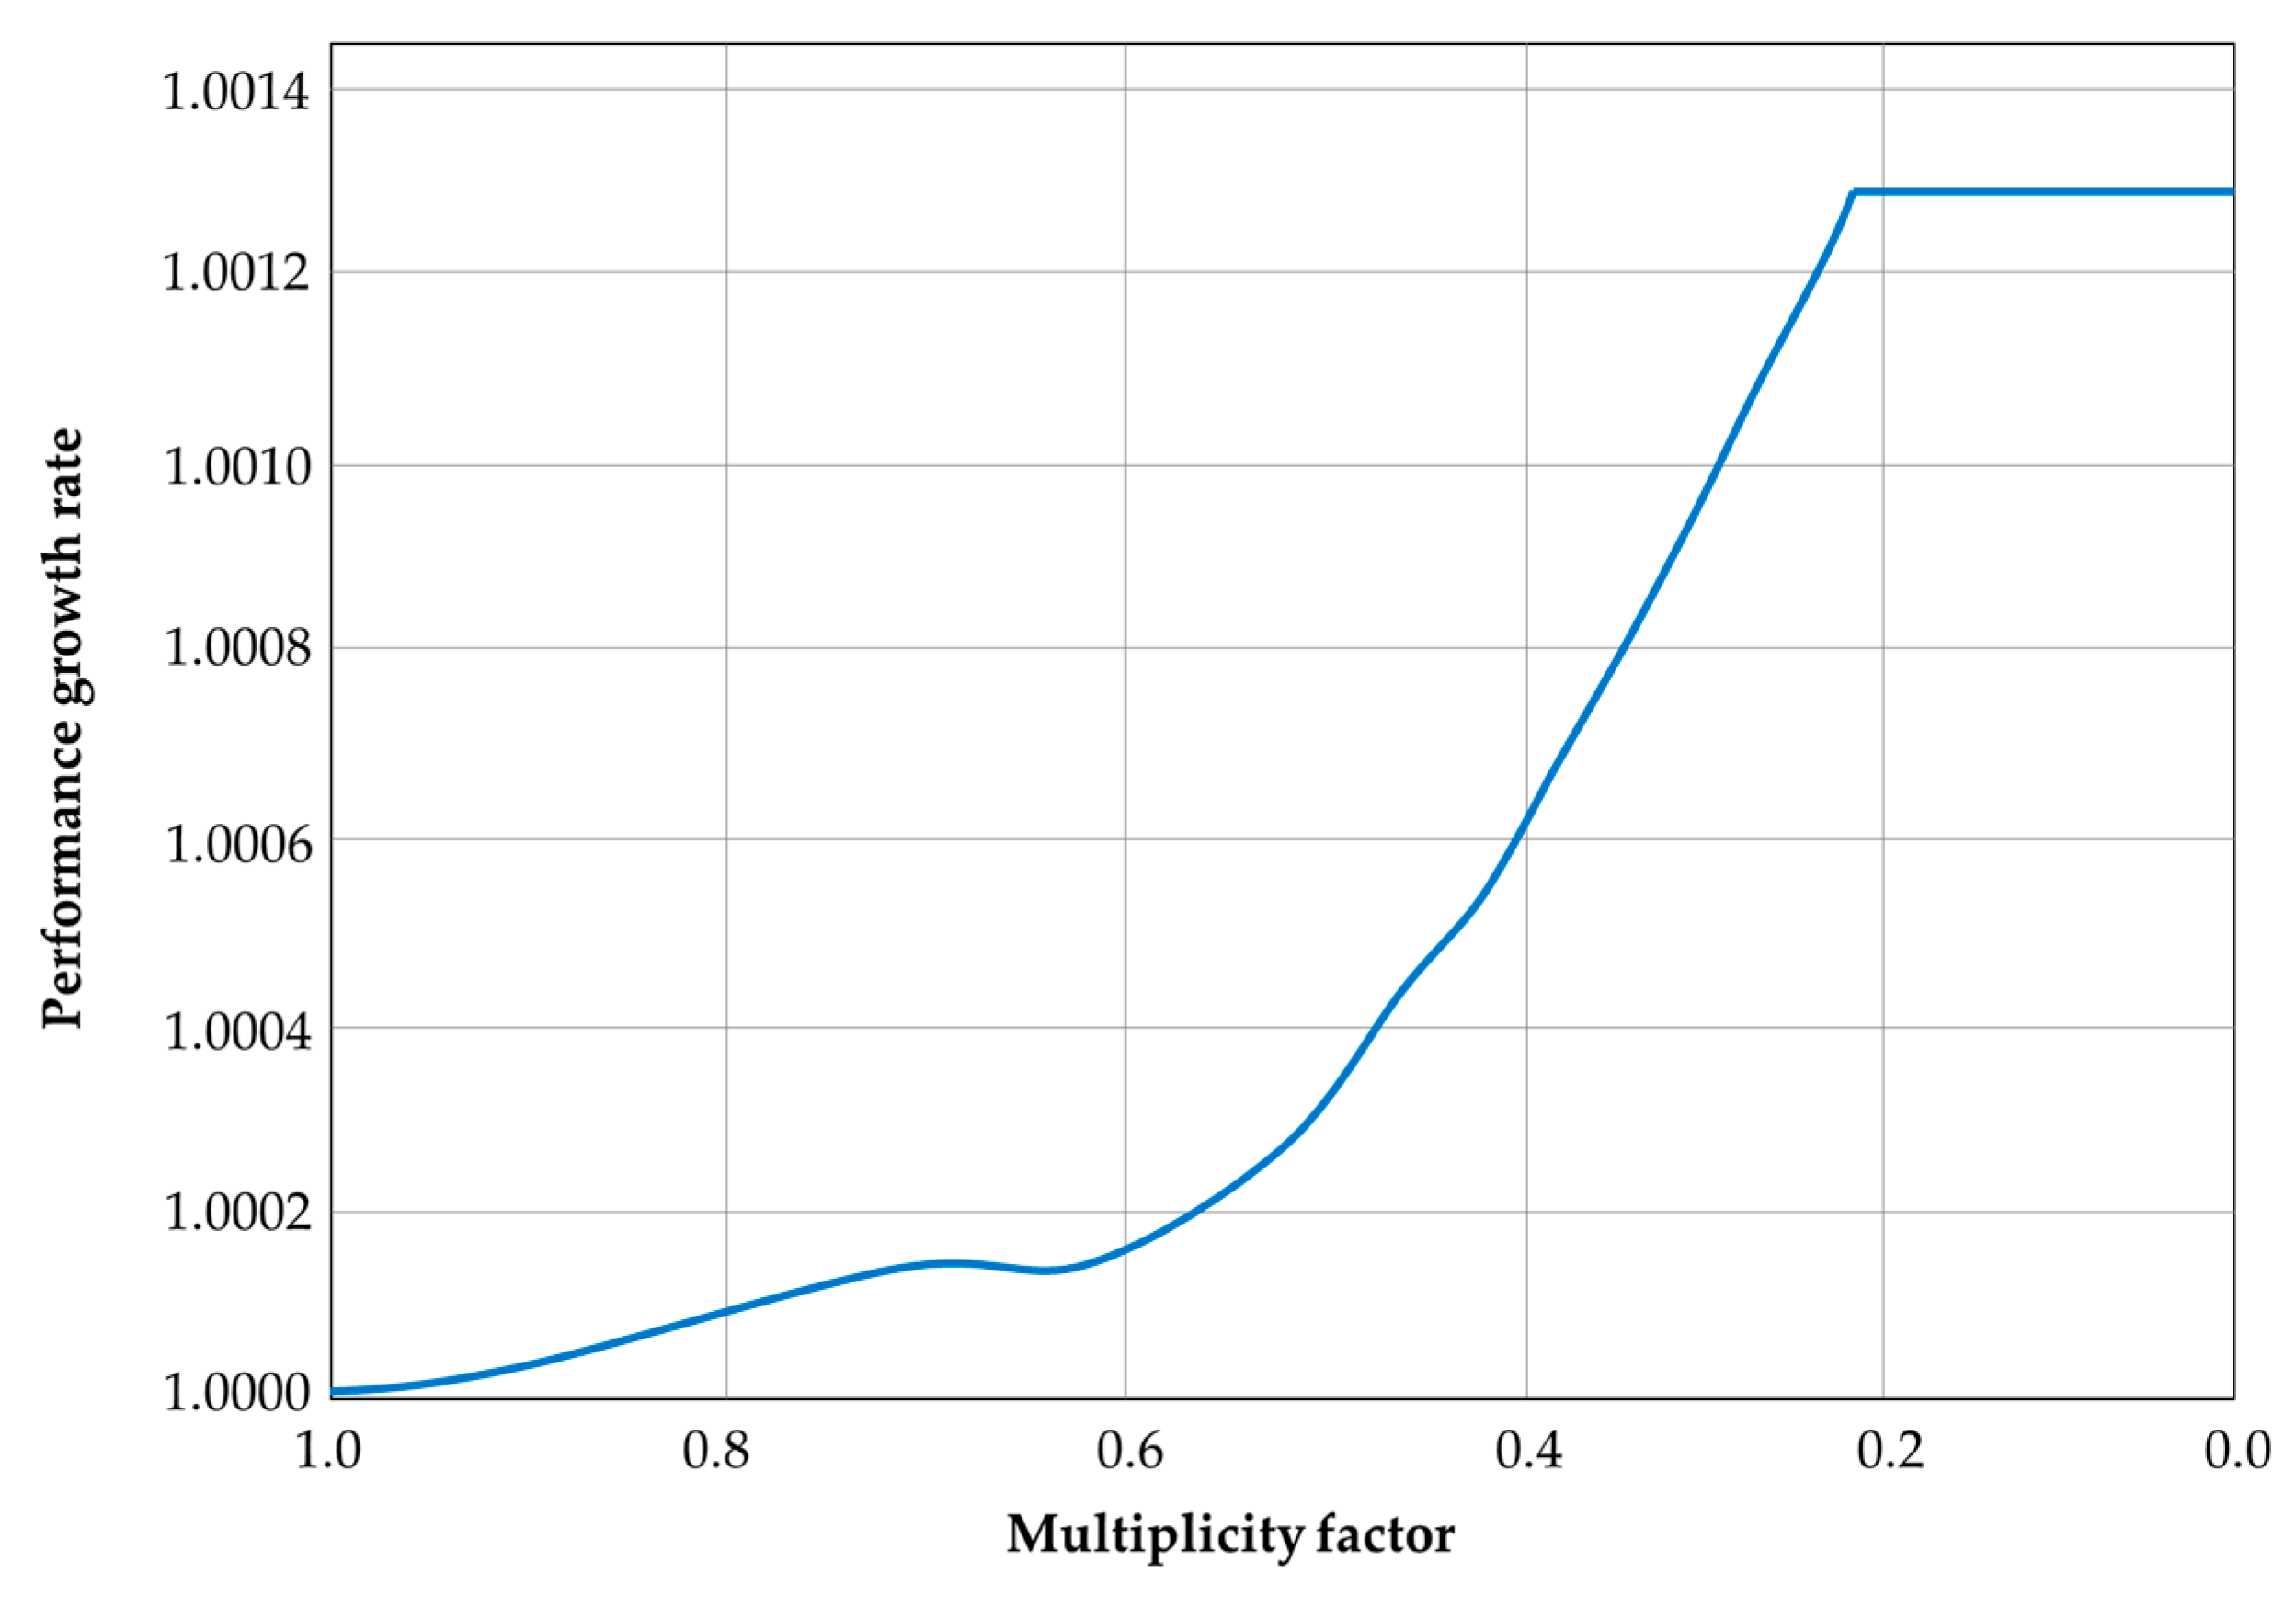
For some variables, reducing the parameter can increase performance, such as in the case of distance from the production unit. Figure 12 shows that if the distance between the warehouse and the production unit is reduced by a certain proportion, a minimal increase in the efficiency of warehousing activities can be observed, the extent of which is indicated by the ML model. This assumption is confirmed by several studies, which show that intelligent layout and automation can reduce travel time, resulting in faster execution and service [45].
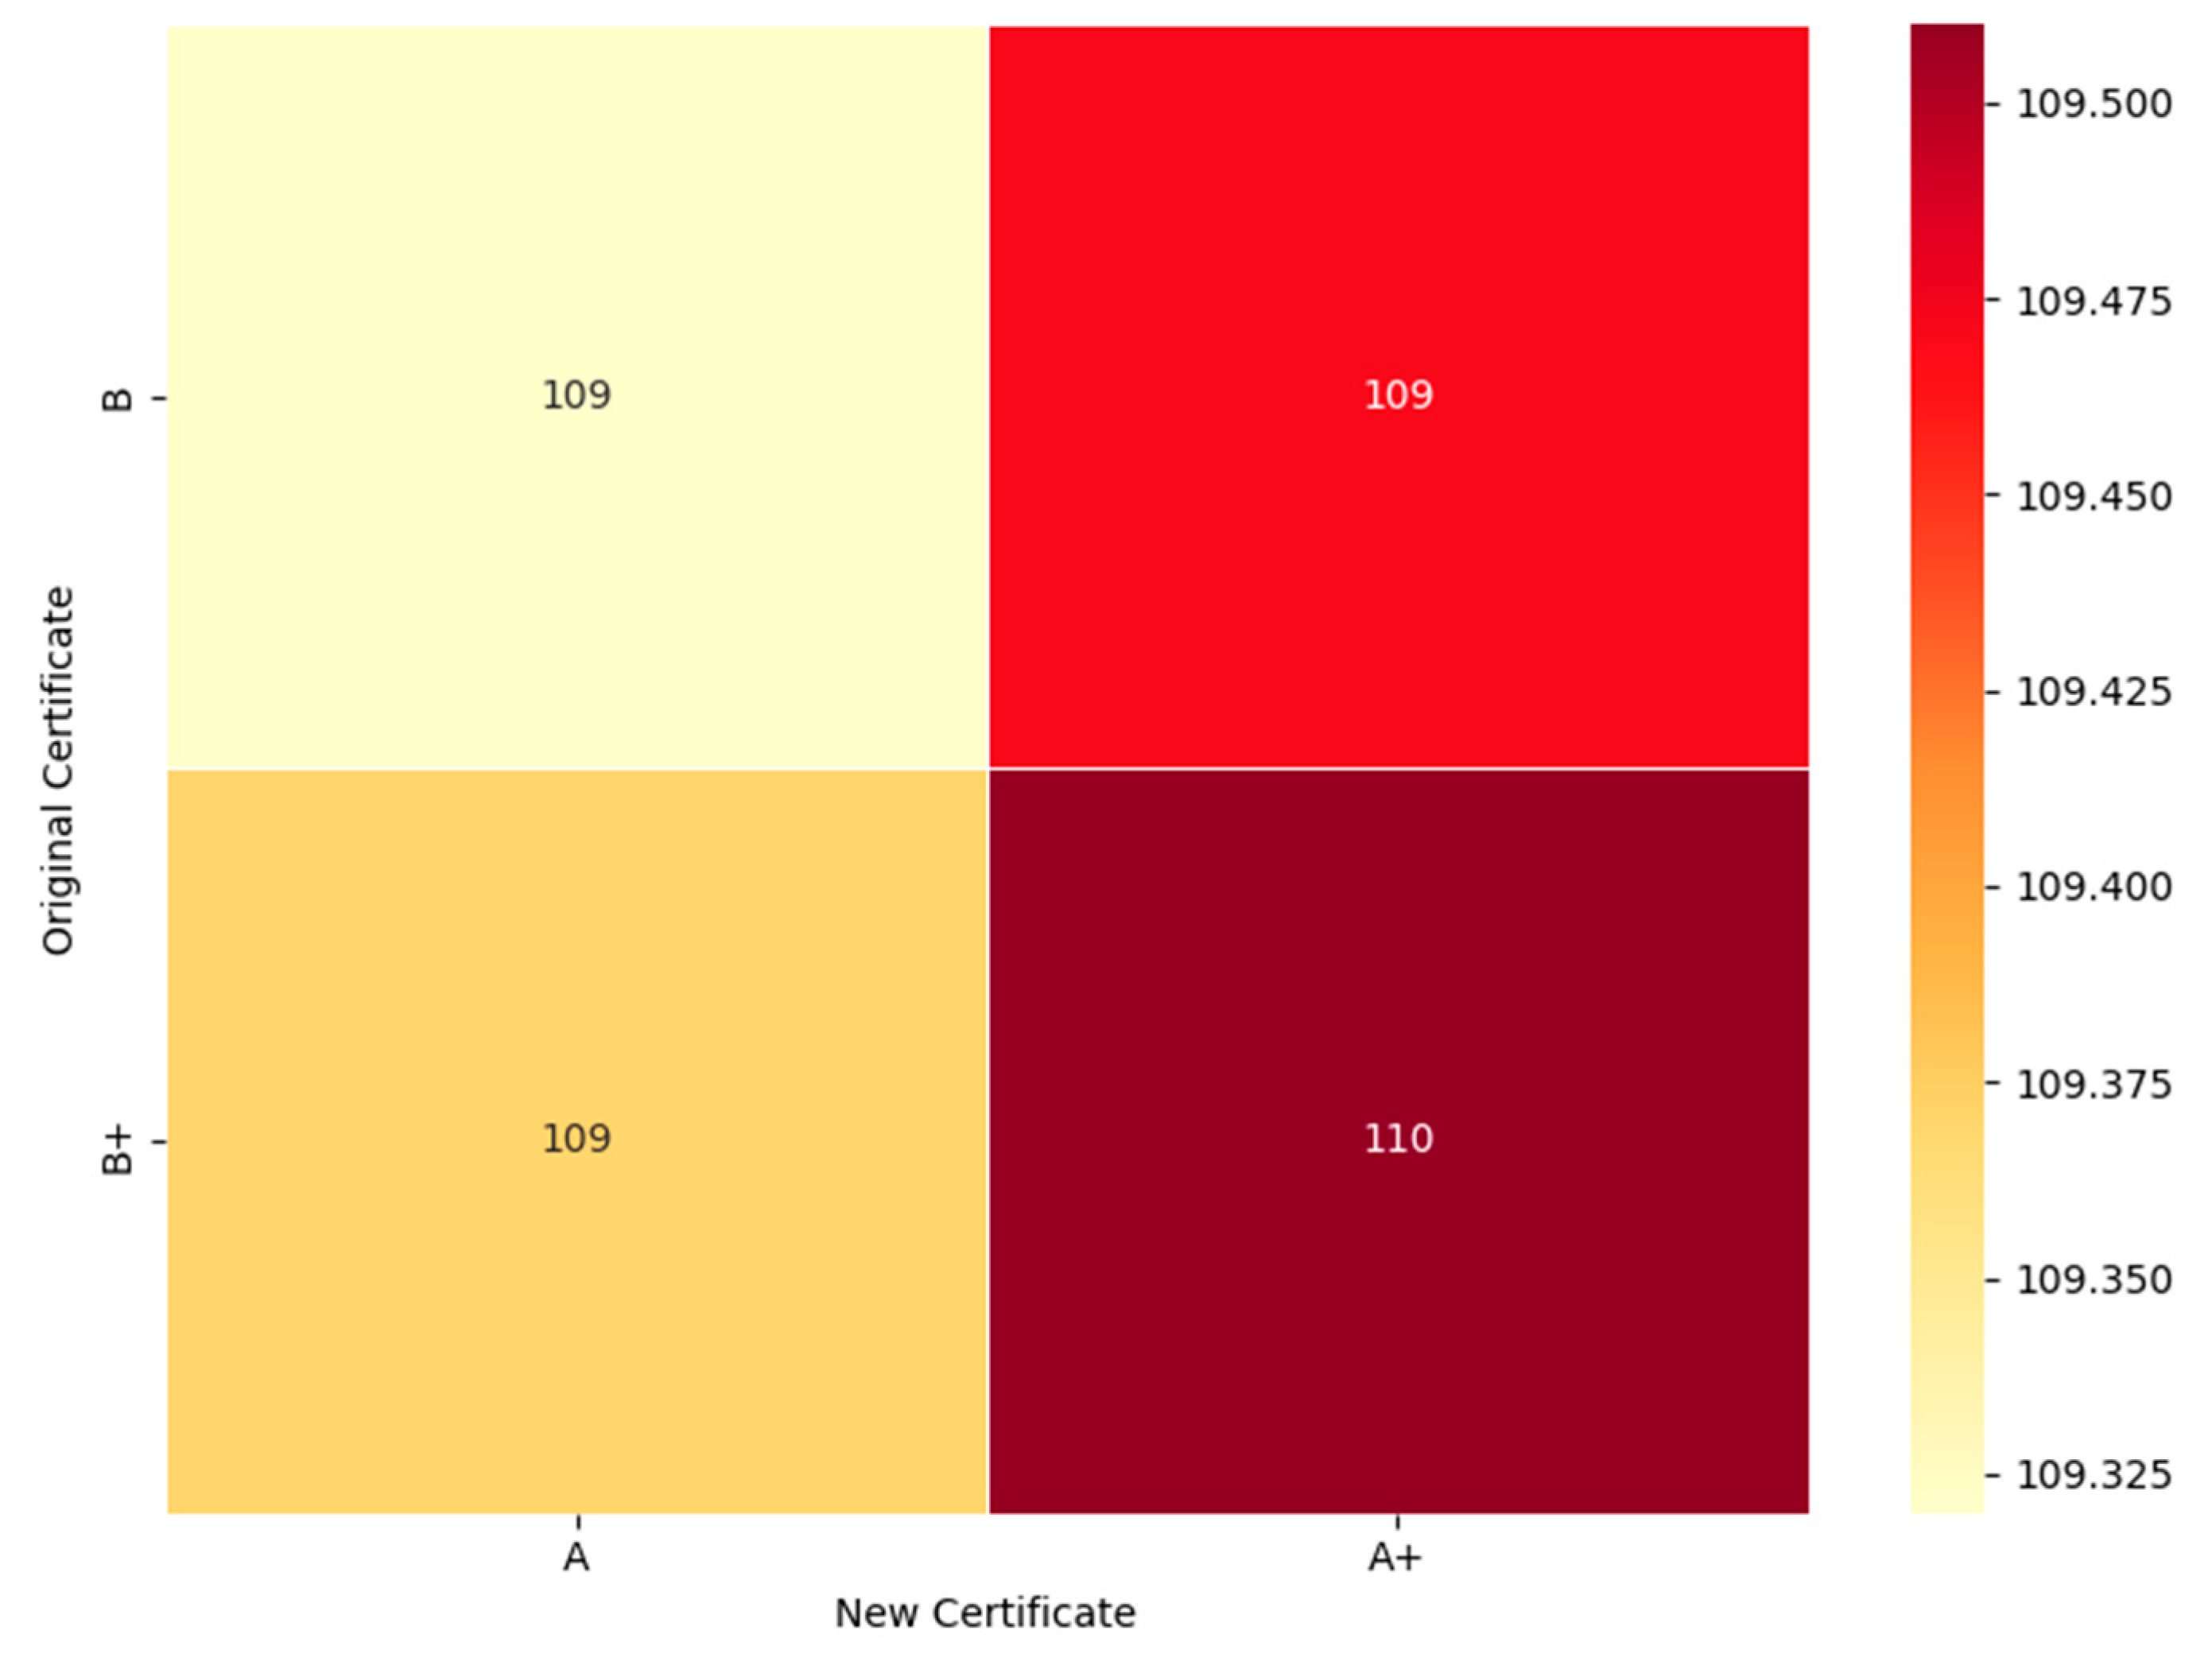
The Partial Dependence Plot was originally developed for changing numerical values, but similar methods can also be used to analyze changes in categorical values. In this example, the energy certificate is examined, as warehouse performance was revealed by feature importance to be influenced by it. Today’s modern and automated warehouses (e.g., AGVs, robots, RFID systems) require a large amount of continuous and reliable energy supply, making the quality of the energy infrastructure (e.g., substations, charging stations, energy management systems) is a critical factor for smooth operation and has a direct impact on productivity, maintenance costs, and the availability of automated systems [46]. Figure 13 shows that if a given warehouse can increase from energy level “B” or “B+” to level “A” or “A+”, an efficiency increase of 9–10% can be achieved, which is by far the highest increase among the parameters examined.

3.3. Mathematical Modelling

Mathematical modeling is a method by which a part of reality is described in abstract form using mathematical tools. During modeling, the essential characteristics of the phenomenon or system under investigation are highlighted and represented using variables, parameters, and equations.
In this research, the objective function is defined to include the parameters of transport errors presented in Section 3.2, the number of employees, the distance from the production unit, and the energy certification. Mathematical tools are applied to show the extent and trends of the changes. In addition to the maximization of performance, the costs associated with the activities must also be considered, as changing any parameter incurs a specific cost; therefore, the optimization objective function is determined according to the cost parameter.
The function describing the reduction in shipping errors refers to a saturating but increasing type of function, where the rate of performance growth decreases as more shipping problems are successfully reduced:
P 1 x 1 = a 1 · 1 e b 1 x 1
where x 1 is the amount of reduction in transportation problems, P 1 is the performance increase, a 1 is the maximum growth, and b 1 is the growth rate.
For the final objective function, it is necessary to determine the cost function C 1 x 1 , but its trend and extent depend on the specific industrial problem, so this will not be discussed in detail in the present study. The objective function for the total parameter is as follows:
Z 1 x 1 = W 1 · P 1 x 1 C x 1
where W 1 is the weight parameter, which expresses the cost of performance increase, and C 1 is the cost function of change.
The function describing the number of employees is identical to the function describing the reduction in delivery errors, as this function is also saturating and increasing, tending towards a maximum value, so its mathematical description is also identical:
P 2 x 2 = a 2 · 1 e b 2 x 2
Z 2 x 2 = W 2 · P 2 x 2 C x 2 ,
where x 2 is the number of employees, P 2 is the performance increase, a 2 is the maximum growth, b 2 is the growth rate, W 2 is the weight parameter, which expresses the cost of performance increase, and C 2 is the cost function of change.
The distance between the storage unit and the production can also be described by a saturation function, but in reverse, as the distance decreases when performance increases:
P 3 x 3 = a 3 · 1 e b 3 ( 1 x 3 )
Z 3 x 3 = W 3 · P 3 x 3 C x 3 ,
where x 3 is the distance between storage unit and the production, P 3 is the performance increase, a 3 is the maximum growth, b 3 is the growth rate, W 3 is the weight parameter, which expresses the cost of performance increase, and C 3 is the cost function of change.
In the case of changes to the energy certificate, the increase in performance can also be written as follows:
P 4 x 4 = 1.0932   i f   x 4 : B A 1.0937   i f   x 4 :   B + A 1.0947   i f   x 4 :   B A + 1.0951   i f   x 4 :   B + A +
Z 4 x 4 = W 4 · P 4 x 4 C x 4 ,
where x 4 is the energy certificate changes, P 4 is the performance increase, W 4 is the weight parameter, which expresses the cost of performance increase, and C 4 is the cost function of change.
The total objective function of the modeling is the sum of the components presented above. This objective function must be maximized to achieve the optimum, as the components were explained based on the cost increase resulting from the performance increase, and this increase must be maximized:
Z =   Z 1 + Z 2 + Z 3 + Z 4 m a x .

4. Discussion

In recent years, AI- and ML-based solutions have become increasingly popular across a range of industries. The field of logistics process optimization is broad, encompassing numerous industrial problems, and several methodologies have been developed to address them in recent decades [47,48]. Keeping pace with modern technologies, it is essential to integrate the possibilities of ML into logistics optimization.
The use of future Internet technologies, including advanced telecommunications and Internet-based solutions, represents a promising direction for improving warehousing and SC performance. These technologies enable real-time data exchange, predictive analytics, and intelligent automation, which can significantly improve the responsiveness and coordination of logistics networks. By proactively integrating these digital innovations into their warehousing activities, manufacturing companies can achieve new levels of efficiency, transparency, and scalability. This strategic alignment with emerging internet paradigms not only supports operational optimization, but also long-term competitiveness in increasingly digitized markets and logistics [49,50,51].
Predictive data models are used to determine future values, as knowing these future indicators can make the planning and implementation of many logistics processes more efficient. However, these models have many other useful features that can be used for various activities. During model training, several methods (Feature Importance, SHAP, PDP) can provide feedback on how a given parameter influences the value of the target variable. Using these reports, information can be obtained about the dataset and the possibilities for influencing the target variable.
The maximization of warehouse performance is regarded as a key factor for manufacturing companies and the entire SC, as non-value-adding processes are known to significantly affect the quality of logistics processes. In this research, a fictional dataset was used to examine the applicability of ML models for optimization. The AutoML procedure was applied to select the regression method, through which the model best suited to the problem at hand was determined. The best results were obtained with the LightGBM procedure, which, with an R2 value of 0.994, was found to be sufficiently reliable for feature selection.
The results of the research show that the Feature Importance methods of ML models can be applied with sufficient quality to understand the dataset and to determine the factors influencing the target variable. In many industrial cases, detailed information about material flow factors is not available, as these patterns are often non-trivial. The recognition of such patterns can provide several new opportunities for optimizing storage performance and improving efficiency. The Partial Dependence Plot method was used to test how changes in a given parameter affect the value of the target variable, and the diagrams created clearly show the extent of influence. Finally, mathematical modeling was employed to explain the functions describing the influencing parameters, whose curves (e.g., linear, exponential, logarithmic, etc.) were identified using the PDP method. Storage performance was defined as a cost indicator, since changes in logistics processes are costly, and the final optimal result is always determined according to cost.
Beyond the methodological results, it is important to situate the presented findings in the context of previous research on warehouse optimization. While most existing studies emphasize heuristic and metaheuristic approaches such as order-picking optimization, layout design, or reinforcement learning for dynamic slotting, the proposed regression-based approach demonstrates that interpretable ML methods can also provide valuable insights for decision support. The integration of Feature Importance and Partial Dependence Plots makes it possible not only to identify key influencing parameters but also to understand the direction and magnitude of their impact, which enhances managerial decision-making. In this sense, the described research complements existing optimization techniques by providing an alternative perspective that is strongly aligned with Industry 4.0 goals of data-driven operations and the Industry 5.0 focus on human-centric and sustainable solutions.
As a further improvement opportunity, it should be noted that testing the theoretical procedure in a real industrial environment may be crucial. It can be examined what hidden parameters the Feature Importance procedures reveal and what added value they have in actual practical optimization. In addition to maximizing storage performance, it is possible to examine the cost of changing each parameter, thus verifying the possibilities for cost-based optimization.
Despite the promising results, this study has several limitations that should be acknowledged. The analysis was conducted using a fictional and cleaned dataset rather than real industrial data, which limits the external validity and generalizability of the results. Only a subset of potentially relevant warehouse parameters was included; factors such as real-time environmental conditions, human behavior, and SC disruptions were not modeled. The cost functions integrated into the optimization framework were conceptual rather than empirically derived, so the financial realism of the model remains to be validated. The AutoML process and LightGBM model selection were performed on a static dataset, dynamic or time-series effects were not considered, which may influence warehouse performance in practice. The study did not compare the regression-based optimization framework against other AI-driven or heuristic methods (e.g., DRL, metaheuristics) in a benchmarked environment. These limitations indicate that while the framework is theoretically robust, future research should include validation on real datasets, integration of temporal and stochastic factors, and cross-method comparison to ensure industrial applicability.

5. Conclusions

This research demonstrated that machine learning-based regression models (particularly the Light Gradient Boosting Machine (LightGBM) algorithm identified through AutoML) can effectively uncover hidden performance patterns in warehouse operations. The combined use of Feature Importance and Partial Dependence Plot (PDP) analyses enabled the detection of the most influential parameters and the visualization of their effects on the target variable. By translating these insights into mathematical relationships, the study introduced a novel, data-driven approach for constructing optimization-oriented objective functions. This framework enhances both predictive accuracy and interpretability, offering a transparent, cost-based perspective that supports more efficient and informed decision-making in warehouse management.
Despite these promising results, several limitations must be acknowledged. The analysis focused on a limited range of parameters, whereas real-world warehouse performance is likely affected by a broader set of operational, environmental, and human factors. In addition, the cost functions were defined conceptually rather than empirically, which may constrain the immediate industrial applicability of the proposed optimization model.
Future research should address these limitations by validating the methodology with real industrial datasets and extending the scope of influencing variables. Particular attention should be given to quantifying cost structures and embedding them into the optimization process to ensure practical relevance. Moreover, integrating regression-based interpretability with reinforcement learning or simulation-based methods could open new directions for adaptive, real-time warehouse optimization. Finally, cross-industry comparative studies are recommended to evaluate the robustness, scalability, and generalizability of the proposed framework under diverse operational conditions.

Author Contributions

Conceptualization, Á.F. and T.B.; methodology, T.B.; software, Á.F.; validation, Á.F.; formal analysis, Á.F. and T.B.; investigation, Á.F. and T.B.; resources, Á.F.; data curation, Á.F.; writing—original draft preparation, Á.F. and T.B.; writing—review and editing, Á.F. and T.B.; visualization, Á.F.; supervision, T.B.; project administration, T.B.; funding acquisition, T.B. All authors have read and agreed to the published version of the manuscript.

Funding

This research received no external funding.

Data Availability Statement

Data are unavailable due to privacy restrictions.

Acknowledgments

The authors have reviewed and edited the output and take full responsibility for the content of this publication.

Conflicts of Interest

The authors declare no conflicts of interest.

Abbreviations

The following abbreviations are used in this manuscript:
ACO Ant Colony Optimization
AGV Automated Guided Vehicle
AI Artificial Intelligence
ANOVA Analysis of Variance
APIApplication Programming Interface
AutoML Automated Machine Learning
COI Cube Per Order Index
DES Discrete Event Simulation
DRL Deep Reinforcement Learning
DSLAP Dynamic Storage Location Assignment Problem
GA Genetic Algorithms
GBM Gradient Boosting Machine
IoT Internet of Things
IT Information Technology
MAE Mean Absolute Error
MAPE Mean Absolute Percentage Error
ML Machine Learning
MSE Mean Squared Error
OOS Order Oriented Slotting
PDP Partial Dependence Plot
RFID Radio Frequency Identification
RMSE Root Mean Squared Error
RMSLE Root Mean Squared Logarithmic Error
SC Supply Chain
SHAP SHapley Additive exPlanations
SKUStock Keeping Unit

References

  1. Negi, P.; Pathani, A.; Bhatt, B.C.; Swami, S.; Singh, R.; Gehlot, A.; Thakur, A.K.; Gupta, L.R.; Priyadarshi, N.; Twala, B.; et al. Integration of Industry 4.0 Technologies in Fire and Safety Management. Fire 2024, 7, 335. [Google Scholar] [CrossRef]
  2. Li, K. Optimizing Warehouse Logistics Scheduling Strategy Using Soft Computing and Advanced Machine Learning Techniques. Soft Comput. 2023, 27, 18077–18092. [Google Scholar] [CrossRef]
  3. Savaglio, C.; Mazzei, P.; Fortino, G. Edge Intelligence for Industrial IoT: Opportunities and Limitations. Procedia Comput. Sci. 2024, 232, 397–405. [Google Scholar] [CrossRef]
  4. Hu, Y.; Jia, Q.; Yao, Y.; Lee, Y.; Lee, M.; Wang, C.; Zhou, X.; Xie, R.; Yu, F.R. Industrial Internet of Things Intelligence Empowering Smart Manufacturing: A Literature Review. IEEE Internet Things J. 2024, 11, 19143–19167. [Google Scholar] [CrossRef]
  5. Hosseini, M.; Chalil Madathil, S.; Khasawneh, M.T. Reinforcement Learning-Based Simulation Optimization for an Integrated Manufacturing-Warehouse System: A Two-Stage Approach. Expert Syst. Appl. 2025, 290, 128259. [Google Scholar] [CrossRef]
  6. de Koster, R.; Le-Duc, T.; Roodbergen, K.J. Design and Control of Warehouse Order Picking: A Literature Review. Eur. J. Oper. Res. 2007, 182, 481–501. [Google Scholar] [CrossRef]
  7. Roodbergen, K.J. Layout and Routing Methods for Warehouses, 1st ed.; Erasmus University Rotterdam: Rotterdam, The Netherlands, 2001. [Google Scholar]
  8. Small Parts Order Picking: Design and Operation. Available online: https://www2.isye.gatech.edu/~mgoetsch/cali/Logistics%20Tutorial/order/article.htm (accessed on 12 August 2025).
  9. Hausman, W.H.; Schwarz, L.B.; Graves, S.C. Optimal storage assignment in automatic warehousing systems. Manag. Sci. 1976, 22, 629–638. [Google Scholar] [CrossRef]
  10. Schuur, P.C. The Cube Per Order Index Slotting Strategy, How Bad Can It Be? University of Twente: Enschede, The Netherlands, 2014. [Google Scholar]
  11. Mantel, R.J.; Schuur, P.C.; Heragu, S.S. Order oriented slotting: A new assignment strategy for warehouses. Eur. J. Ind. Eng. 2007, 1, 301. [Google Scholar] [CrossRef]
  12. De Koster, M.B.M.; Van der Poort, E.S.; Wolters, M. Efficient orderbatching methods in warehouses. Int. J. Prod. Res. 1999, 37, 1479–1504. [Google Scholar] [CrossRef]
  13. Tsige, M. Improving Order-Picking Efficiency Via Storage Assignments Strategies. Master’s Thesis, University of Twente, Enschede, The Netherlands, 2013. [Google Scholar]
  14. Waubert de Puiseau, C.; Nanfack, D.T.; Tercan, H.; Löbbert-Plattfaut, J.; Meisen, T. Dynamic Storage Location Assignment in Warehouses Using Deep Reinforcement Learning. Technologies 2022, 10, 129. [Google Scholar] [CrossRef]
  15. Seyedan, M.; Mafakheri, F. Predictive big data analytics for supply chain demand forecasting: Methods, applications, and research opportunities. J. Big Data 2020, 7, 53. [Google Scholar] [CrossRef]
  16. Aamer, A.; Eka Yani, L.; Alan Priyatna, I. Data Analytics in the Supply Chain Management: Review of Machine Learning Applications in Demand Forecasting. Oper. Supply Chain. Manag. Int. J. 2020, 14, 1–13. [Google Scholar] [CrossRef]
  17. Falatouri, T.; Darbanian, F.; Brandtner, P.; Udokwu, C. Predictive Analytics for Demand Forecasting—A Comparison of SARIMA and LSTM in Retail SCM. Procedia Comput. Sci. 2020, 200, 993–1003. [Google Scholar] [CrossRef]
  18. Douaioui, K.; Oucheikh, R.; Benmoussa, O.; Mabrouki, C. Machine Learning and Deep Learning Models for Demand Forecasting in Supply Chain Management: A Critical Review. Appl. Syst. Innov. 2024, 7, 93. [Google Scholar] [CrossRef]
  19. Omprakash, M.K. Optimizing Demand Forecasting and Inventory Management with AI in Automotive Industry. Master’s Thesis, Lappeenranta–Lahti University of Technology LUT, Lappeenranta, Finland, 2024. [Google Scholar]
  20. Umoren, J.; Utomi, E.; Adukpo, T. AI-powered Predictive Models for U.S. Healthcare Supply Chains: Creating AI Models to Forecast and Optimize Supply Chain. IJMR 2025, 11, 2455–3662. [Google Scholar]
  21. Srinivas, A. AI-Driven Demand Forecasting in Enterprise Retail Systems: Leveraging Predictive Analytics for Enhanced Supply Chain. Int. J. Sci. Technol. 2025, 16, 1–22. [Google Scholar] [CrossRef]
  22. Cergibozan, Ç.; Tasan, A.S. Genetic algorithm based approaches to solve the order batching problem and a case study in a distribution center. J. Intell. Manuf. 2022, 33, 137–149. [Google Scholar] [CrossRef]
  23. Azadnia, A.H.; Taheri, S.; Ghadimi, P.; Mat Saman, M.Z.; Wong, K.Y. Order Batching in Warehouses by Minimizing Total Tardiness: A Hybrid Approach of Weighted Association Rule Mining and Genetic Algorithms. Sci. World J. 2013, 2013, 246578. [Google Scholar] [CrossRef]
  24. de Koster, R.; van der Poort, E.; Roodbergen, K.J. When to apply optimal or heuristic routing of orderpickers. In Advances in Distribution Logistics, 1st ed.; Fleischmann, B., van Nunen, J.A.E.E., Speranza, M.G., Stähly, P., Eds.; Springer: Berlin, Germany, 1998; Volume 460, pp. 375–401. [Google Scholar] [CrossRef]
  25. Cano, J.A.; Correa-Espinal, A.A.; Gómez-Montoya, R.A. An Evaluation of Picking Routing Policies to Improve Warehouse Efficiency. Int. J. Ind. Eng. Manag. 2017, 8, 229–238. [Google Scholar] [CrossRef]
  26. Tufano, A.; Accorsi, R.; Manzini, R. A machine learning approach for predictive warehouse design. Int. J. Adv. Manuf. Technol. 2022, 119, 2369–2392. [Google Scholar] [CrossRef]
  27. Wang, Y.; Vasan, G.; Mahmood, R. Real-Time Reinforcement Learning for Vision-Based Robotics Utilizing Local and Remote Computers. arXiv 2022, arXiv:2210.02317. [Google Scholar] [CrossRef]
  28. Peyas, I.S.; Hasan, Z.; Tushar, M.R.R.; Musabbir, A.; Azni, R.M.; Siddique, S. Autonomous Warehouse Robot using Deep Q-Learning; IEEE: Piscataway, NJ, USA, 2022. [Google Scholar] [CrossRef]
  29. Vinod Chandra, S.S.; Anand, H.S. Nature inspired meta heuristic algorithms for optimization problems. Computing 2022, 104, 251–269. [Google Scholar] [CrossRef]
  30. Discrete Event Simulation (DES). Available online: https://www.ebsco.com/research-starters/mathematics/discrete-event-simulation-des (accessed on 1 September 2025).
  31. Georgescu, I. The early days of Monte Carlo methods. Nat. Rev. Phys. 2023, 5, 372. [Google Scholar] [CrossRef]
  32. Antony, J. Six Sigma for service processes. Bus. Process Manag. J. 2006, 12, 234–248. [Google Scholar] [CrossRef]
  33. Yao, J.F.; Yang, Y.; Wang, X.C.; Zhang, X.P. Systematic review of digital twin technology and applications. Vis. Comput. Ind. Biomed. 2023, 6, 10. [Google Scholar] [CrossRef]
  34. Dubey, V.; Kumari, P.; Patel, K.; Singh, S.; Shrivastava, S. Amalgamation of Optimization Algorithms with IoT Applications. In Sustainable Development in Industry and Society 5.0; IGI Global: Hershey, PA, USA, 2024; pp. 176–204. [Google Scholar] [CrossRef]
  35. Wen, X.; Liao, J.; Niu, Q.; Shen, N.; Bao, Y. Deep learning-driven hybrid model for short-term load forecasting and smart grid information management. Sci. Rep. 2024, 14, 13720. [Google Scholar] [CrossRef]
  36. Edozie, E.; Shuaibu, A.N.; John, U.K.; Sadiq, B.O. Comprehensive review of recent developments in visual object detection based on deep learning. Artif. Intell. Rev. 2025, 58, 277. [Google Scholar] [CrossRef]
  37. Ma, C.; Li, A.; Du, Y.; Dong, H.; Yang, Y. Efficient and scalable reinforcement learning for large-scale network control. Nat. Mach. Intell. 2024, 6, 1006–1020. [Google Scholar] [CrossRef]
  38. Supply Chain Optimization for a FMCG Company. Available online: https://www.kaggle.com/datasets/suraj9727/supply-chain-optimization-for-a-fmcg-company/data (accessed on 20 July 2025).
  39. He, X.; Zhao, K.; Chu, X. AutoML: A survey of the state-of-the-art. Knowl.-Based Syst. 2021, 212, 106622. [Google Scholar] [CrossRef]
  40. Bentéjac, C.; Csörgő, A.; Martínez-Muñoz, G. A comparative analysis of gradient boosting algorithms. Artif. Intell. Rev. 2021, 54, 1937–1967. [Google Scholar] [CrossRef]
  41. Ke, G.; Meng, Q.; Finley, T.; Wang, T.; Chen, W.; Ma, W.; Ye, Q.; Liu, T.-Y. LightGBM: A Highly Efficient Gradient Boosting Decision Tree. In Proceedings of the 30th Conference on Neural Information Processing Systems (NeurIPS 2017), Long Beach, CA, USA, 4–9 December 2017. [Google Scholar]
  42. LightGBM Documentation. Available online: https://lightgbm.readthedocs.io/en/latest/Features.html# (accessed on 16 August 2025).
  43. Theng, D.; Bhoyar, K.K. Feature selection techniques for machine learning: A survey of more than two decades of research. Knowl. Inf. Syst. 2024, 66, 1575–1637. [Google Scholar] [CrossRef]
  44. Rodríguez-Pérez, R.; Bajorath, J. Interpretation of machine learning models using shapley values: Application to compound potency and multi-target activity predictions. J. Comput.-Aided Mol. Des. 2020, 34, 1013–1026. [Google Scholar] [CrossRef]
  45. Reducing Picker Travel Time: Enhancing Warehouse Efficiency with Automation and Smart Slotting. Available online: https://www.logiwa.com/blog/reducing-picker-travel-time-to-enhance-warehouse-efficiency (accessed on 17 August 2025).
  46. Transforming Logistics: The Rise of High-Power Warehouses and Smart Energy Systems. Available online: https://blog.intellimeter.com/transforming-logistics-the-rise-of-high-power-warehouse-and-smart-energy-systems (accessed on 17 August 2025).
  47. Korponai, J.; Bányai, Á.; Illés, B. The Effect of the Safety Stock on the Occurrence Probability of the Stock Shortage. Manag. Prod. Eng. Rev. 2017, 8, 69–77. [Google Scholar] [CrossRef]
  48. Borodavko, B.; Illés, B.; Bányai, Á. Role of Artificial Intelligence in Supply Chain. Acad. J. Manuf. Eng. 2021, 19, 75–79. [Google Scholar]
  49. Veres, P. A Comparison of the Black Hole Algorithm against Conventional Training Strategies for Neural Networks. Mathematics 2025, 13, 2416. [Google Scholar] [CrossRef]
  50. Veres, P. ML and Statistics-Driven Route Planning: Effective Solutions without Maps. Logistics 2025, 9, 124. [Google Scholar] [CrossRef]
  51. Veres, P. The Opportunities and Possibilities of Artificial Intelligence in Logistic Systems: Principles and Techniques. In Advances in Digital Logistics, Logistics and Sustainability; Tamás, P., Bányai, T., Telek, P., Cservenák, Á., Eds.; CECOL 2024. Lecture Notes in Logistics; Springer: Cham, Switzerland, 2024. [Google Scholar] [CrossRef]
Figure 1. Graphical abstract of the research framework (source: own elaboration).
Futureinternet 17 00468 g001
Figure 2. Feature importance extraction from ML models (source: own elaboration).
Futureinternet 17 00468 g002
Figure 3. Type of electricity certificate could be important for modelling (source: own elaboration).
Futureinternet 17 00468 g003
Figure 4. Violinplot of dependent variable (source: own elaboration).
Futureinternet 17 00468 g004
Figure 5. Correlation Matrix (source: own elaboration).
Futureinternet 17 00468 g005
Figure 6. Correlation between dependent variable and storage issues (source: own elaboration).
Futureinternet 17 00468 g006
Figure 7. Comparison of level-wise tree growth (a) and leaf-wise tree growth (b).
Futureinternet 17 00468 g007
Figure 8. Feature importance based on embedding method (source: Python 3.12.11).
Futureinternet 17 00468 g008
Figure 9. SHAP summary plot (source: Python 3.12.11).
Futureinternet 17 00468 g009
Figure 10. Transport issue reduction (source: Python 3.12.11).
Futureinternet 17 00468 g010
Figure 11. Workers number increasing (source: Python 3.12.11).
Futureinternet 17 00468 g011
Figure 12. Decreasing distance between warehouse and production (source: Python 3.12.11).
Futureinternet 17 00468 g012
Figure 13. Matrix of the effects of energy certificate modifications (source: Python 3.12.11).
Futureinternet 17 00468 g013
Table 1. Effectiveness and novelty: comparison of prior approaches to warehouse optimisation and this research.
ApproachMain FocusLimitationsNovelty
Layout design & distance minimisation [14,15,16,17]Reduce travel distances of material handling equipmentStatic, layout-specific, limited adaptabilityGoes beyond static layouts by extracting dynamic patterns from data
Slotting strategies (COI, OOS) [18,19]Product placement based on frequency or co-occurrenceLimited to order relations, ignores other factorsConsiders multiple parameters simultaneously via regression
Batching & zoning [20,21]Coordinating small orders, grouping SKUsLimited overall impact on performanceBroader optimisation perspective using data-driven models
Metaheuristics (GA, hybrid models) [30,31]Optimising picking and batching routesHigh computational cost, less interpretableOur approach emphasizes interpretability and cost functions
Routing heuristics (S-shape, Largest Gap, etc.) [32,33]Picker route optimisationSimplistic, not globally optimalProposes mathematical functions derived from ML for optimisation
Robotics + AI (RL, DL) [35,36]Automation and real-time controlRequires heavy investment, complex integrationProvides a lightweight, interpretable alternative for optimisation
This researchPattern recognition via regression models (AutoML + LightGBM)Needs validation on real data, causality not guaranteedTransforms regression from prediction to pattern extraction, formulating an optimisation-oriented, interpretable objective function
Table 2. Evaluation of AutoML model (source: Python 3.12.11).
ModelMAEMSERMSER2RMSLEMAPE
lightgbmLight Gradient
Boosting Machine
678.8557839,779.1779916.09460.99380.08010.0438
gbrGradient Boosting Regressor695.8355869,759.6419932.26770.99350.08370.0456
rfRandom Forest Regressor712.245934,943.3382966.63370.99310.08340.0459
xgboostExtreme Gradient Boosting713.7591937,255.2687967.5980.9930.08760.0469
etExtra Trees Regressor730.84051,013,394.9221006.18080.99250.08590.0469
ridgeRidge Regression884.64691,309,630.2511144.08360.99030.10920.0611
llarLasso Least Angle Regression883.82481,309,304.1821143.93770.99030.10870.0609
brBayesian Ridge884.61941,309,632.4731144.08440.99030.10910.0611
lassoLasso Regression884.03971,309,316.3671143.94380.99030.10890.061
lrLinear Regression884.76281,309,630.9041144.08470.99030.10930.0612
dtDecision Tree Regressor882.63881,773,604.0051331.06110.98680.11270.056
enElastic Net1152.87242,577,668.81604.70770.98090.24730.0773
adaAdaBoost Regressor1413.08063,132,509.5871769.59490.97680.16170.1072
huberHuber Regressor1264.96223,142,596.7271767.49490.97670.45950.0853
ompOrthogonal Matching Pursuit1353.62493,421,633.2091849.26220.97460.34840.0895
parPassive Aggressive Regressor1587.60084,461,971.2352078.85670.96680.39970.1086
knnK Neighbors Regressor6103.773260,215,414.017759.3330.55340.47240.459
dummyDummy Regressor9576.893134,923,670.311,615.2979−0.00080.67430.7883
larLeast Angle Regression91,640.59121.116 × 1015133,455.673−860.2080.85616.2092
Disclaimer/Publisher’s Note: The statements, opinions and data contained in all publications are solely those of the individual author(s) and contributor(s) and not of MDPI and/or the editor(s). MDPI and/or the editor(s) disclaim responsibility for any injury to people or property resulting from any ideas, methods, instructions or products referred to in the content.