1. Introduction
The Sixth Assessment Report (AR6) of the Intergovernmental Panel on Climate Change (IPCC) highlights that climate change will exert irreversible impacts on ecosystems and human societies [
1]. According to IPCC projections, global temperatures are projected to increase by 1.8 to 4.0 °C by the end of the 21st century [
1]. Climate change is projected to alter the suitable distribution ranges of particular species, driving habitat fragmentation and exacerbating global biodiversity loss [
2]. Medicinal plants, as core resources in traditional medical systems, play a pivotal role in sustaining both human health and biodiversity conservation. Therefore, investigating the responses of medicinal plants to climate change and predicting shifts in their habitat distribution are of critical importance.
Turpinia arguta (Lindl.) Seem, an evergreen shrub or small tree in the Staphyleaceae family, is traditionally used in China for medicinal purposes, with its dried leaves listed in the 2025 Chinese Pharmacopoeia [
3]. It is valued for clearing heat, detoxifying, relieving sore throat, promoting blood circulation, and alleviating pain [
4,
5]. It is commonly used to treat respiratory and inflammatory conditions, including tonsillitis, sore throat, throat arthralgia, and novel coronavirus pneumonia [
4,
6]. Modern research has identified key compounds such as flavonoids and triterpenoids that provide anti-inflammatory, antibacterial, antioxidant, analgesic, and immunomodulatory effects [
6]. The species possesses significant ecological and economic values in addition to its medicinal properties.
T. arguta has significant industrial value, serving as a primary raw material for various patent medicines with high market demand [
7], and is also used in animal feed [
8], ointments [
9], mosquito repellents [
10], and hand sanitizers [
11].
As a characteristic medicinal plant of southern China,
T. arguta also plays an important ecological role within forest ecosystems stability. It is mainly distributed across the subtropical monsoon regions of China, including Jiangxi, Anhui, Zhejiang, Hunan, Hubei, Chongqing, Guizhou, Fujian, Guangdong, and Guangxi provinces [
3]. The species prefers cool, moist climates; seedlings tolerate partial shade, while mature trees thrive under full sunlight and exhibit moderate cold tolerance [
12]. It requires deep, fertile, and well-drained soils [
12]. However, with the continuous increase in products derived from
T. arguta as raw materials, its wild resources have been excessively exploited, resulting in resource depletion and falling far short of market demand [
12]. Furthermore, climate change poses additional threats by altering suitable habitats and fragmenting populations. Therefore, understanding the current and future ecological suitability of
T. arguta is essential to guide sustainable cultivation and conservation efforts.
Species Distribution Models (SDMs) use species occurrence and environmental data to predict species distributions and habitat preferences [
13]. Commonly used species distribution models (SDMs) include Ecological Niche Factor Analysis (ENFA) [
14], Bioclimatic Analysis System (BIOCLIM) [
15], Genetic Algorithm for Rule-set Production (GARP) [
16], CLIMEX Model [
17], Generalized Linear Model (GLM) [
18], Artificial Neural Network (ANN), Random Forest (RF) [
19], and Maximum Entropy Modeling (MaxEnt) [
20]. Among these, MaxEnt often achieves superior predictive accuracy, especially with incomplete data [
21,
22,
23]. MaxEnt effectively handles variable interactions and sampling bias, operates quickly, and performs well even with limited samples [
24]. It has been widely applied in invasive species monitoring [
25], habitat suitability prediction [
26], conservation of endangered/rare species [
27], and pest and disease management [
28], yielding favorable simulation results across these case studies. MaxEnt also identifies key environmental factors affecting species growth and adaptive ranges. The selection of MaxEnt model parameters (feature combinations and regularized multipliers) has a significant impact on the modeling results, and the kuenm R package provides a standardized process for model optimization [
29]. In addition to predicting potential species distributions, incorporating quality analysis allows for a comprehensive evaluation of how environmental factors influence the spatial variation in key medicinal compounds [
30]. This integrative approach facilitates not only habitat suitability assessments but also the identification of high-quality production areas, thereby enhancing the practical value of species distribution modeling for medicinal plants.
Current research on
T. arguta primarily focuses on chemical constituents [
5,
31,
32,
33], pharmacological effects [
33,
34,
35,
36], and optimization of extraction processes for active components [
37,
38,
39], while extending to practical applications such as propagation techniques [
40], cultivation practices [
41], animal feed utilization [
8], and determination of optimal harvest timing [
42]. However, studies predicting the suitable distribution areas of
T. arguta under current and future climate change have not been reported, and the key factors influencing its distribution remain unclear. Meanwhile, studies on current and future ecological suitability rarely consider quality suitability, and research on medicinal plant quality suitability seldom incorporates future climate projections. Therefore, to scientifically understand the distribution patterns of
T. arguta, its responses to climate change, and the relationships between environmental factors and quality, this study employed an optimized MaxEnt model to simulate and predict its potential suitable areas in China under current and future climate conditions during the periods of the 2050s (2041–2060), 2070s (2061–2080) and 2090s (2081–2100) under three SSP emission scenarios (SSP126, SSP245 and SSP585). This study focuses on three primary research objectives: ① identifying key environmental drivers influencing the distribution of
T. arguta, encompassing climate, soil, topography, and vegetation type variables; ② predicting the distribution patterns and temporal changes in its potential suitable habitats in China from the present to 2100; and ③ analyzing relationships between environmental factors and
T. arguta quality. The findings will provide a robust scientific basis for guiding the sustainable utilization of its resources and optimizing artificial cultivation practices.
2. Materials and Methods
This study integrated 247 filtered distribution records and 55 environmental variable datasets into the MaxEnt model. Parameter optimization of the model was conducted using the kuenm R package, enabling the evaluation of
T. arguta’s growth suitability and the mapping of its future suitable habitats under climate change scenarios. For chemical validation, 40 field samples with GPS coordinates were collected, and their contents of the pharmacopoeial marker compounds ligustroflavone and rhoifolin were quantified; results are presented in the
Supporting Information. To explore relationships between medicinal quality and growing environments, stepwise regression was applied to establish environmental-driver models for key chemical components, and distribution maps of quality suitability for
T. arguta were generated.
2.1. Species Distribution Data
Distribution data for
T. arguta were sourced from field surveys and the Global Biodiversity Information Facility (GBIF;
https://doi.org/10.15468/dl.zekau6, accessed on 27 July 2024). The global distribution of this species is concentrated in Hong Kong and other regions of China, which motivated selecting China as the study area. A total of 911 georeferenced samples were obtained from the GBIF database after filtering by the time period 1949–2024. Subsequently, we used the R software package “CoordinateCleaner” to remove samples with coordinate uncertainty greater than 1 km and suspected outliers, ensuring data spatial reliability [
26]. The research team conducted field sampling in the primary distribution regions of
T. arguta across Jiangxi, Hunan, Fujian, and Guangdong provinces (China), collecting 40 samples and recording their geographic coordinates (latitude and longitude). Additionally, the contents of pharmacopoeial marker compounds—ligustroflavone and rhoifolin—were quantified in these samples. The filtered GBIF samples (after time, uncertainty, and outlier filtering) and 40 field-collected samples (
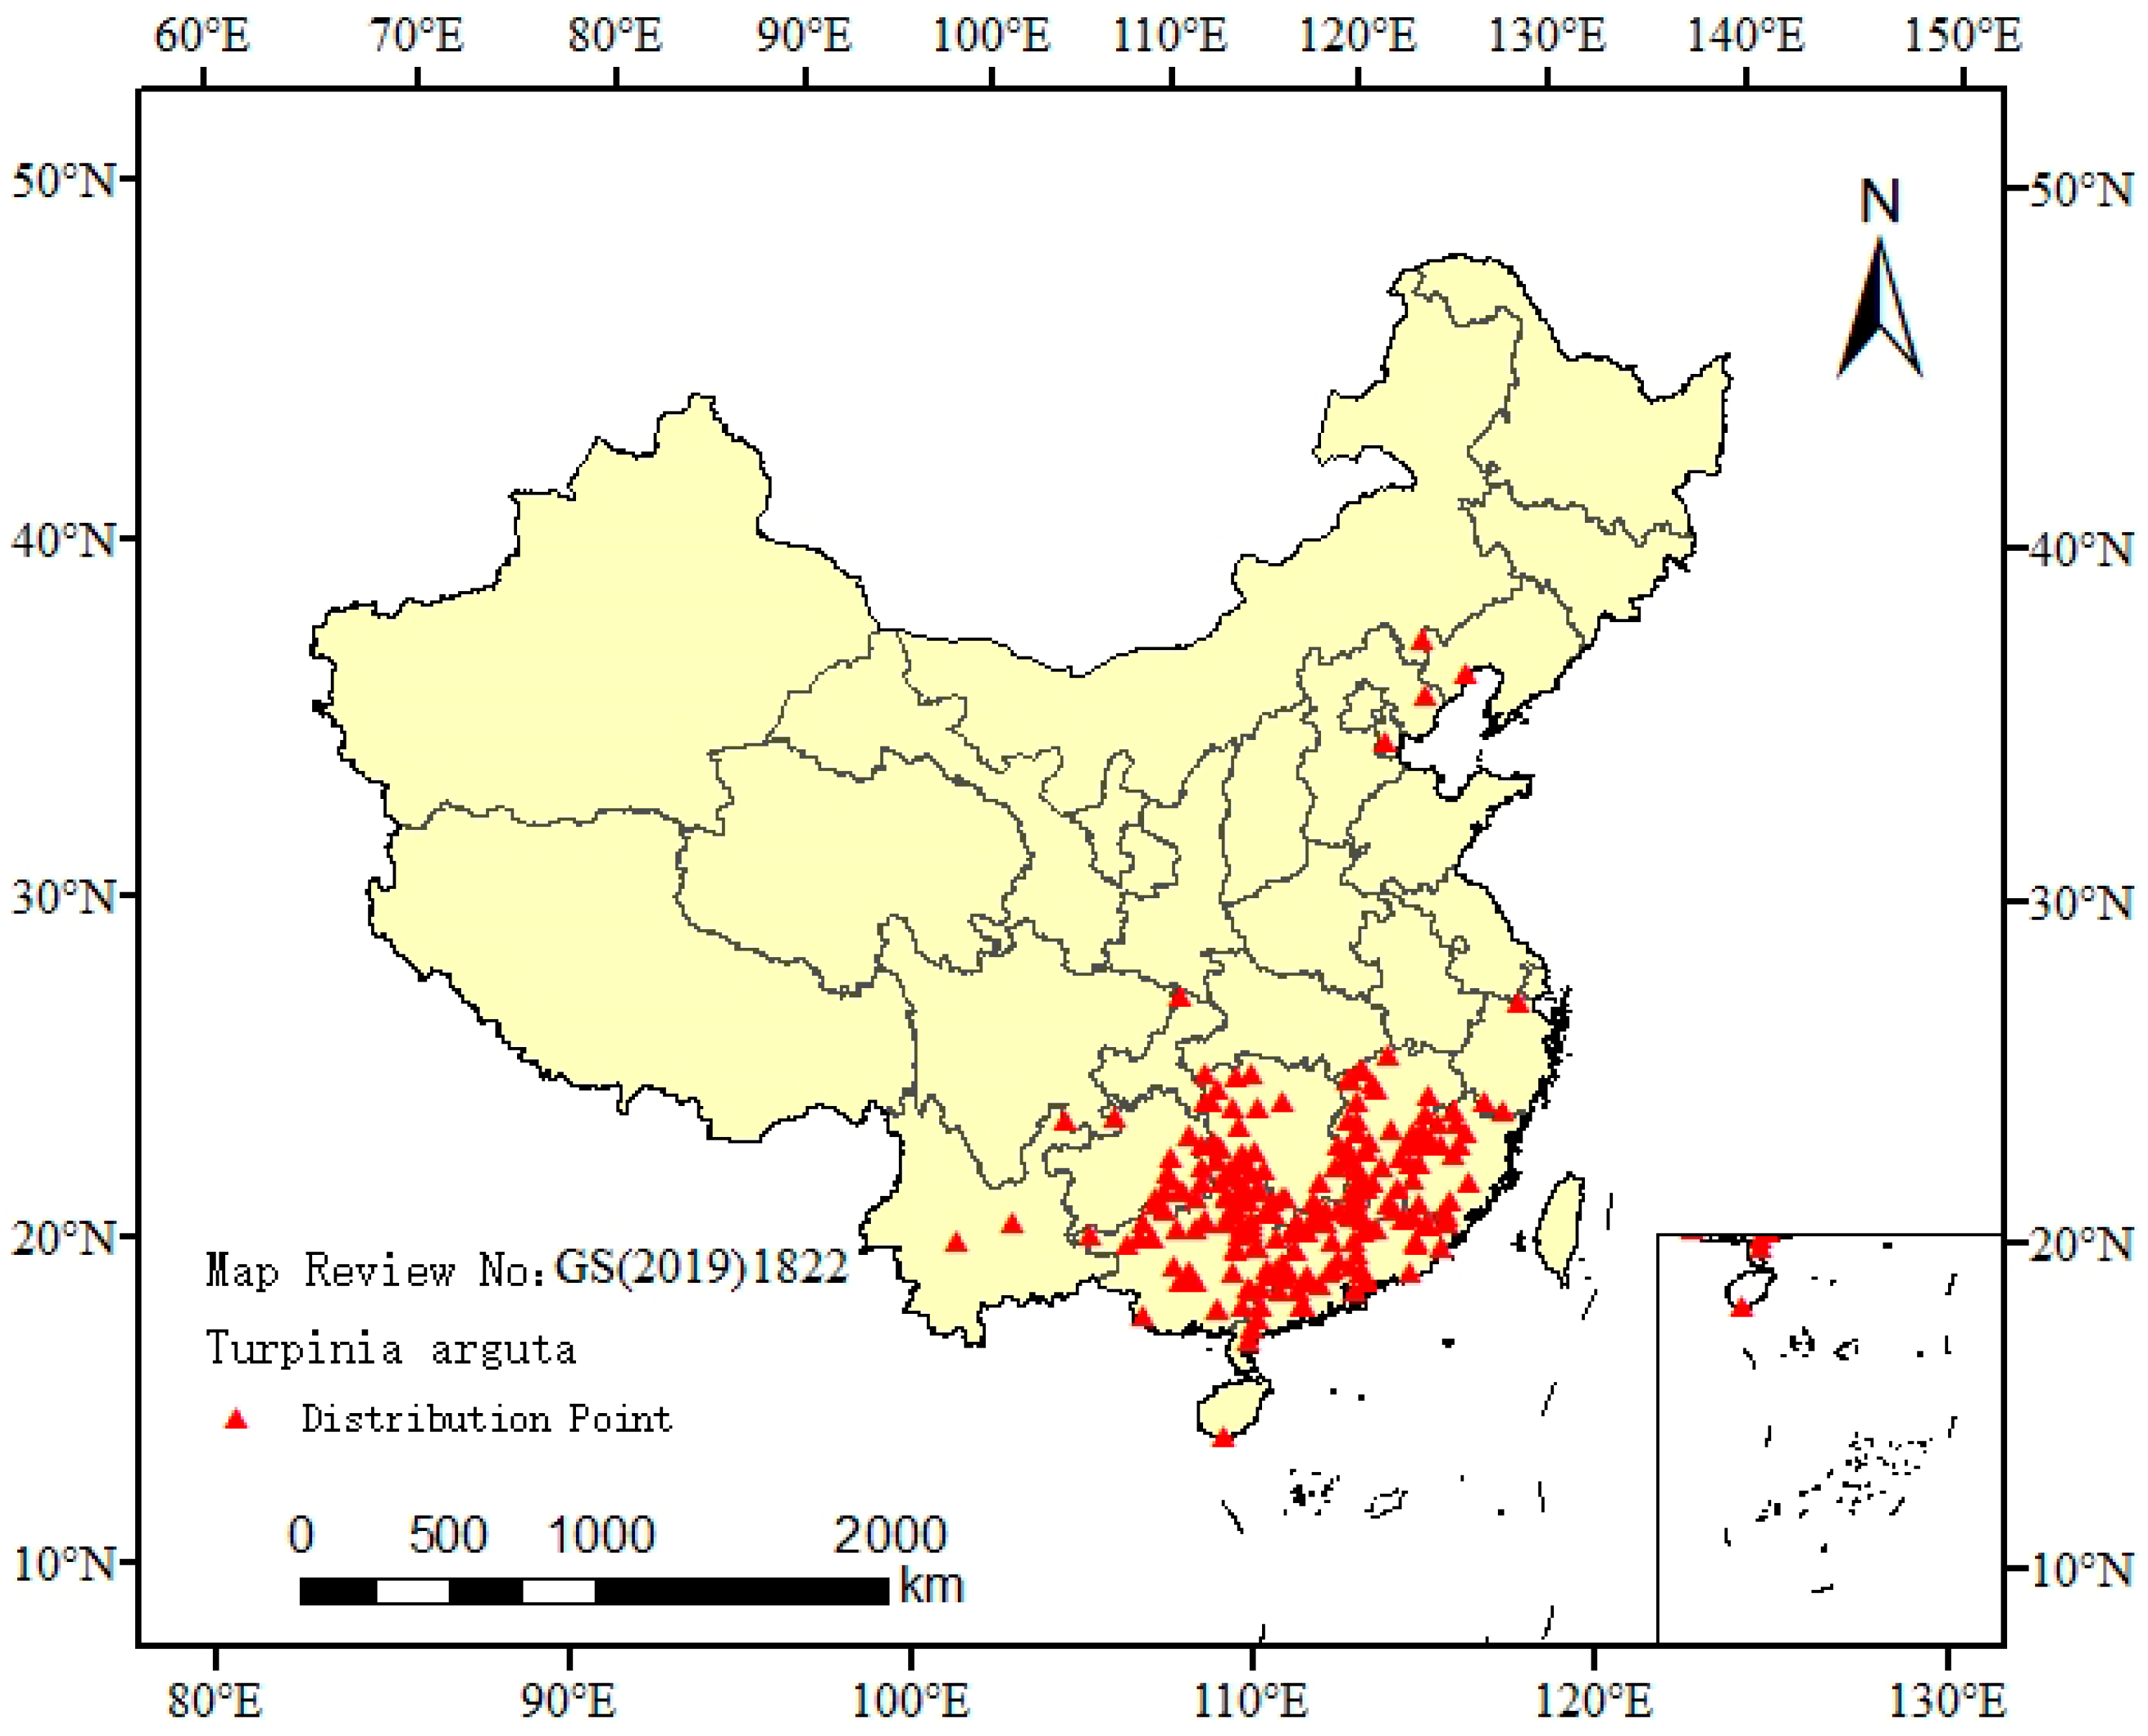
Figure S1 in Supporting Information) were combined and saved as CSV format. The combined dataset was imported into ENMTools software for spatial filtering. Points within a 1 km radius were removed to eliminate spatial redundancy, leaving 247 non-overlapping distribution sites (
Figure 1) suitable for MaxEnt modeling.
2.2. Environmental Factors
Fifty-five environmental variables with a spatial resolution of 1 km were obtained from the “Chinese Medicine Resource Spatial Information Grid Database” (
http://www.tcm-resources.com/). These variables were categorized into four groups: climate data (43 variables, including monthly precipitation and mean temperature, plus 19 comprehensive climate indices); soil data (8 variables); topographic data (3 variables: elevation, slope, and aspect); and vegetation type. To mitigate multicollinearity among environmental variables and reduce data redundancy—issues that can compromise model performance and interpretability—we implemented the following preprocessing steps [
32,
34]. First, 55 environmental variables and species occurrence data were input into MaxEnt and run 10 times independently to quantify variable contributions (percent and permutation importance), with results detailed in the
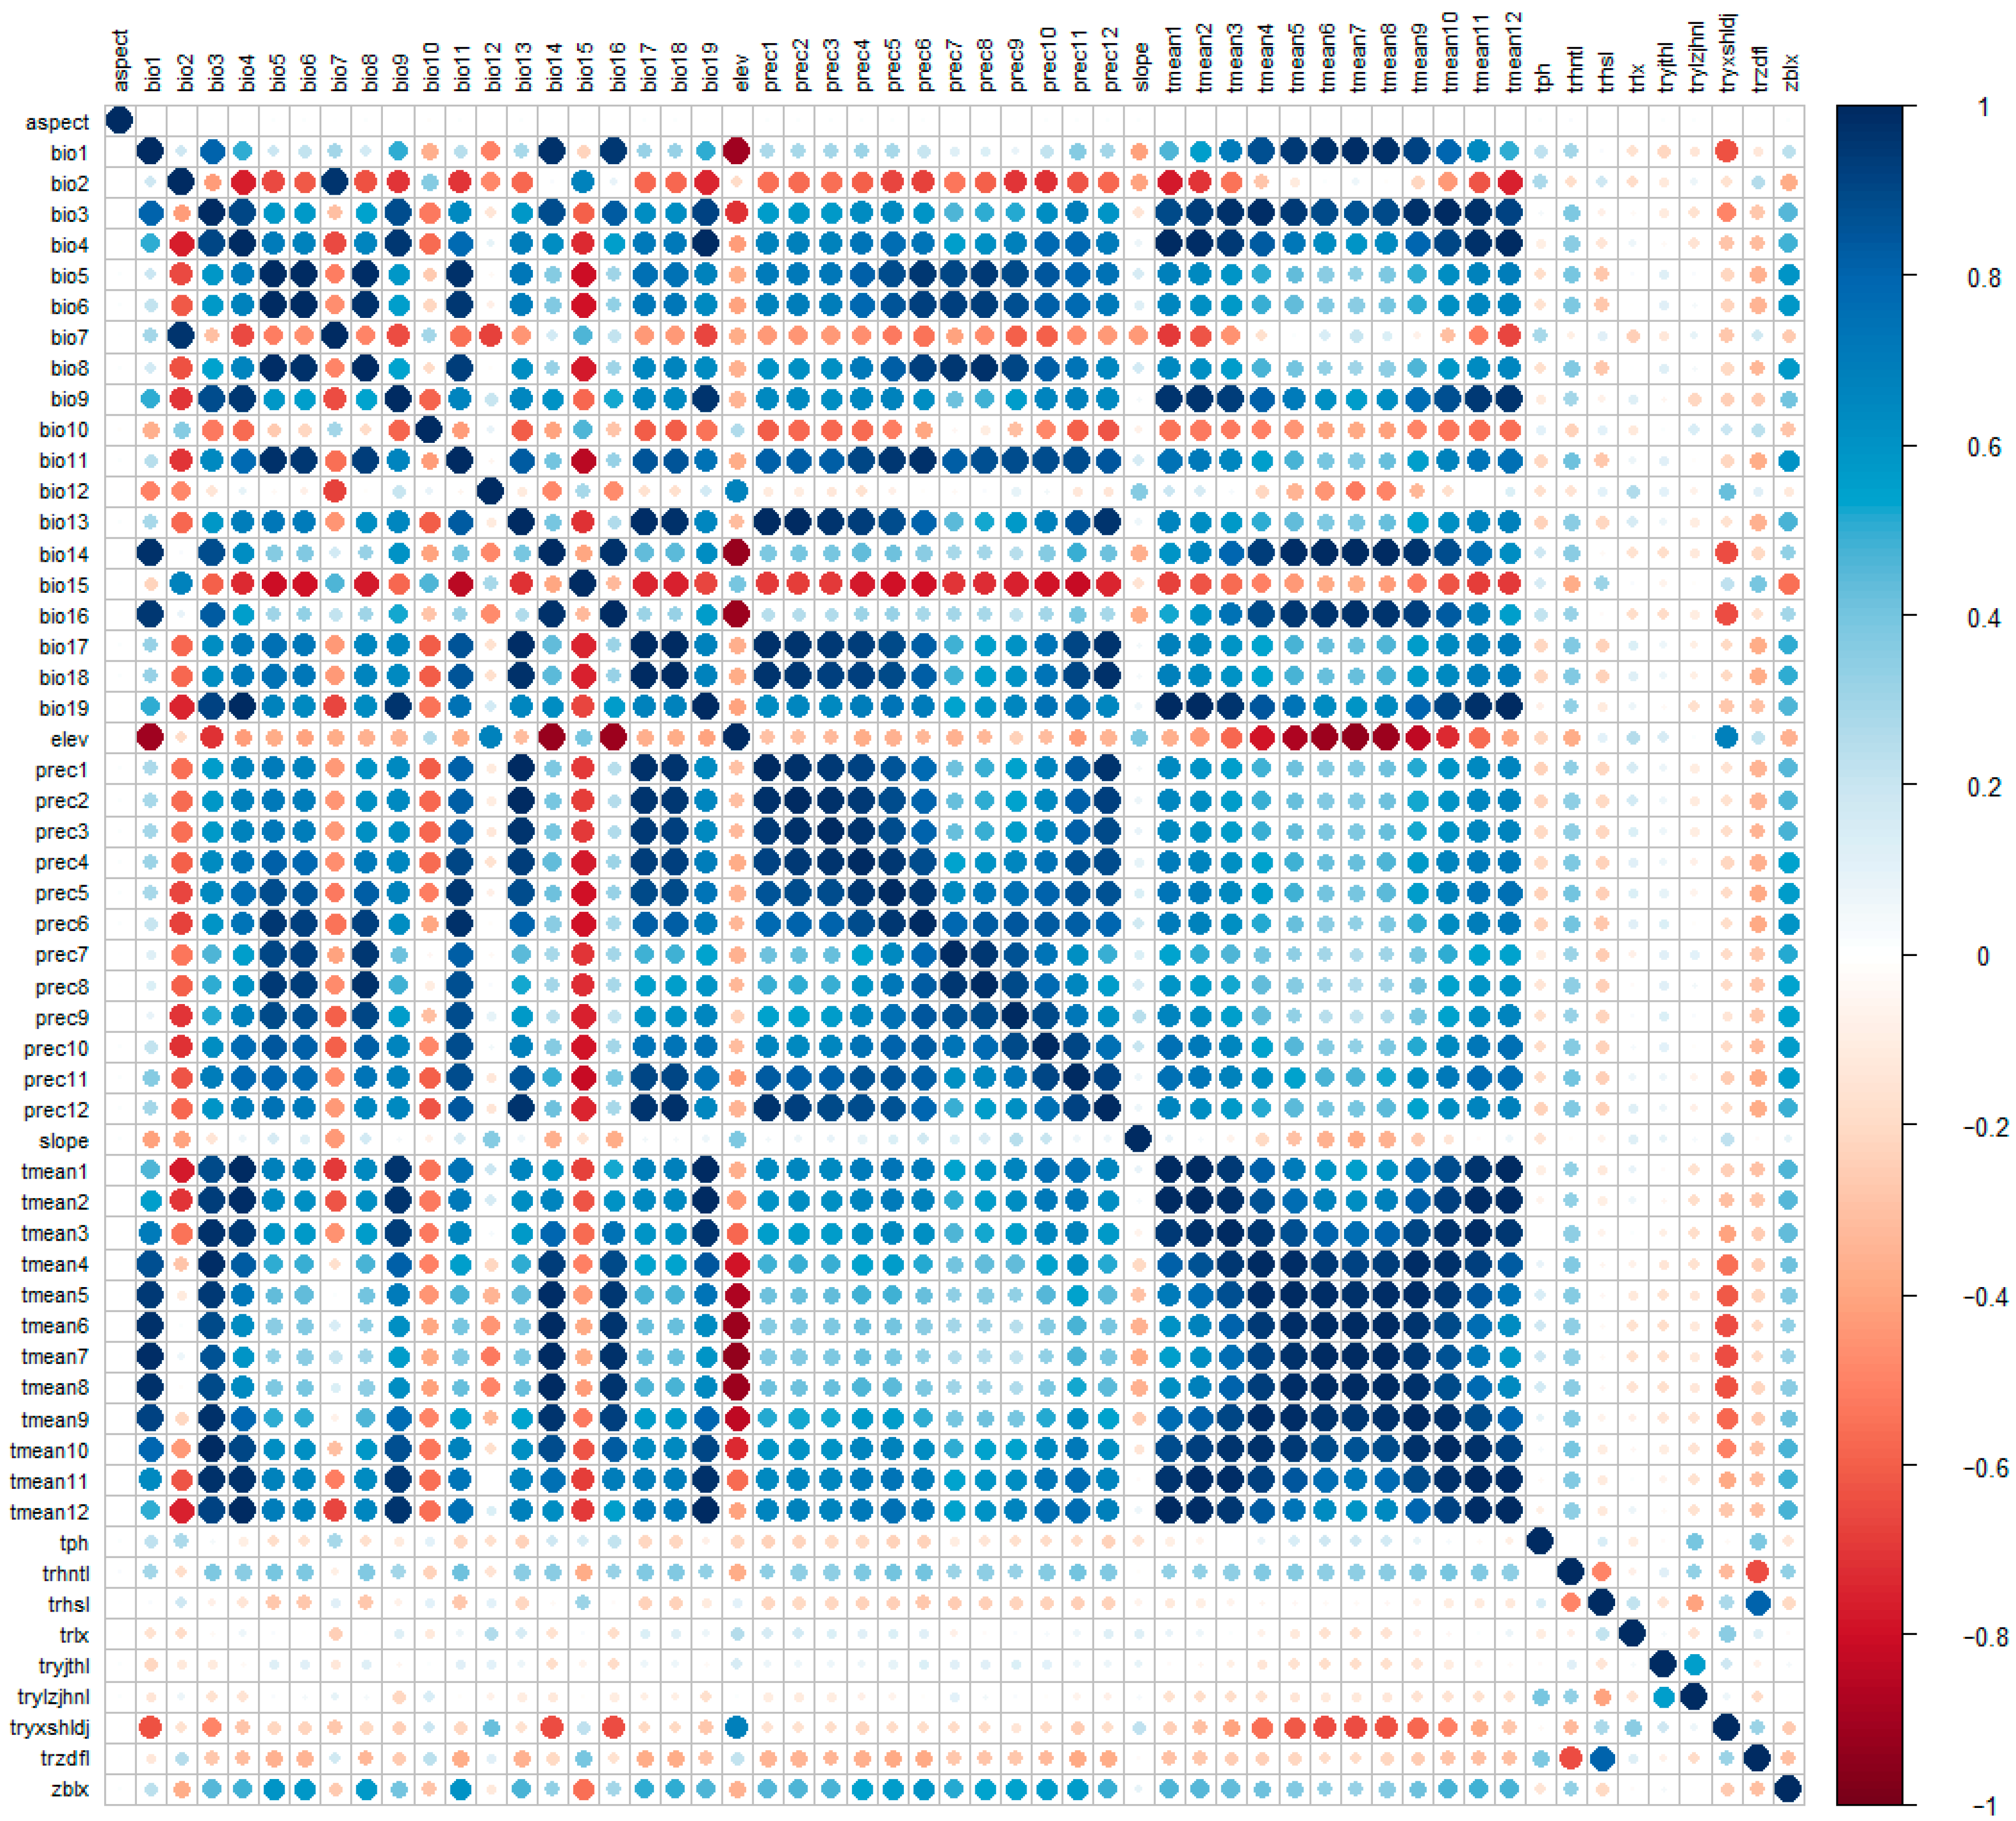
Supporting Information. Pairwise correlations were evaluated using ENMTools and visualized as a heatmap in R 4.4.3 (
Figure 2), with highly correlated variables defined as |r| > 0.8 [
24]. Multicollinearity was assessed via Variance Inflation Factor (VIF) using the usdmpackage, applying criteria: VIF < 5 (no multicollinearity, retained), 5 ≤ VIF < 10 (weak multicollinearity), 10 ≤ VIF < 100 (moderate to strong multicollinearity, excluded), VIF ≥ 100 (severe multicollinearity, excluded) [
26]. A stepwise filtering process balanced model simplicity and ecological relevance: (1) removed variables with percent contribution < 0.6 (MaxEnt output); (2) for highly correlated pairs (|r| > 0.8), retained the variable with higher contribution and clearer ecological significance; (3) ensured all retained variables had VIF < 5. This approach minimized multicollinearity while preserving meaningful predictors. Ultimately, 11 key environmental variables were retained for subsequent distribution modeling.
Future climate variables were obtained from the CMIP6 dataset available on the WorldClim platform (
https://worldclim.org/), including 43 climate variables at a spatial resolution of 30 arc-seconds (about 1 km). The BCC-CSM2-MR (China Meteorological Administration Coupled Model, version 2-Medium Resolution), a regionally optimized climate system model developed in China, was selected due to its well-documented suitability for representing climate dynamics in China [
43,
44,
45]. Three Shared Socioeconomic Pathway (SSP) scenarios were considered: SSP126 representing low emissions, SSP245 representing medium emissions, and SSP585 representing high emissions. Climate projections cover three future periods: the 2050s (2041–2060 average), the 2070s (2061–2080 average), and the 2090s (2081–2100 average). Topographic and soil data were integrated into future projections under the assumption that these variables would remain static over the 100-year simulation period, consistent with the approach of Wang et al. [
26,
46].
Given that T. arguta occurs in Hong Kong and other regions of China, China was selected as the study area. The administrative boundaries map was sourced from the Standard Map Service System of Natural Resources of China (scale: 1:20,000,000; approval number: GS(2019)1822; obtained date: 6 March 2025).
2.3. Model Parameterization and Evaluation
The occurrence records of
T. arguta and environmental variables were separately imported into the respective modules of MaxEnt v3.4.4. To ensure model robustness, 25% of the occurrence data were designated as the test dataset, and 75% were used for training. The number of background points was set to 10,000, and ten replicates were used to obtain mean predictions, thereby enhancing model accuracy. Model accuracy was assessed by the area under the receiver operating characteristic curve (AUC). The AUC value is typically categorized into four levels: AUC < 0.5: indicates negligible predictive ability, equivalent to random guessing; 0.5 ≤ AUC < 0.7: represents low predictive ability with poor accuracy; 0.7 ≤ AUC < 0.9: signifies moderate predictive ability with acceptable accuracy; AUC ≥ 0.9: denotes high predictive ability and good accuracy. The maximum training sensitivity plus specificity test omission rate represents the omission error on the MaxEnt model’s test dataset. A lower value indicates stronger model generalization ability. In ecological studies, an omission rate below 0.1 is generally considered indicative of good predictive performance. Additionally, the TSS, CBI, and Smoothed Boyce Index were employed to assess model performance. The True Skill Statistic (TSS) measures model discrimination ability by balancing sensitivity (correctly predicting presences) and specificity (correctly predicting absences) [
24]. TSS ranges from −1 to +1, where values close to +1 indicate excellent predictive performance, values near 0 suggest predictions no better than random, and negative values reflect poor model performance [
24].
2.4. Model Optimization
The parameters that significantly influence the accuracy of MaxEnt models are primarily the feature class (FC) and the regularization multiplier (RM). FC (which defines the allowed relationships between variables, including linear, quadratic, product, and threshold) and RM (which scales the penalty term applied to the maximum entropy solution) are critical. The default MaxEnt configuration (FC = LQHP, RM = 1) is a general-purpose setting that may yield suboptimal predictions for specific taxa. Thus, parameter customization is necessary to avoid systematic bias. To address this, we employed the kuenmR package to refine parameters: RM values spanned 0.1–4 in increments of 0.1, and 31 unique FC configurations were examined, resulting in 1240 candidate models [
28]. Ten-fold cross-validation was used to split the samples into training and testing sets, enhancing the model’s generalization ability and helping to prevent overfitting or underfitting. Model selection followed three rigorous criteria: (1) statistical significance, evaluated through ROC analysis with 500 iterations; (2) predictive performance, quantified by an omission rate (OR) < 5%; and (3) model complexity, assessed via the Akaike Information Criterion (AIC), retaining only models with AIC < 2 [
2,
47,
48]. The optimal parameter set (RM = 0.6, FC = LQ, delta_AICc = 0, and omission rate = 4.8%) was implemented in MaxEnt v3.4.1 for modeling.
2.5. Sample Content Determination
Based on wild resource distribution data and information on the harvesting, processing, supply, and marketing of T. arguta, 40 representative samples were collected from 23 cities across Jiangxi, Guangdong, Hunan, and Fujian Provinces. According to the “Chinese Pharmacopoeia” standards, the pharmacopeial marker compounds of T. arguta are ligustroflavone and rhoifolin, quantified via high-performance liquid chromatography (HPLC; General Rule 0512). Chromatographic conditions: A C18 column was used, with a mobile phase of methanol-0.5% phosphoric acid solution (43:57), and detection at a wavelength of 336 nm. Preparation of reference standard solution: Appropriate amounts of ligustroflavone and rhoifolin reference standards were accurately weighed and dissolved in 50% (v/v) methanol to yield a solution containing 50 μg/mL of ligustroflavone and 20 μg/mL of rhoifolin. Preparation of test sample solution: Approximately 0.3 g of T. arguta powder (sieved through a No. 3 sieve) was accurately weighed, placed in a stoppered conical flask, and 50 mL of 50% (v/v) methanol was added. After weighing, the mixture was subjected to ultrasonic treatment for 1 h, shaken well, filtered, and the filtrate was collected as the test sample solution. Quantification: In total, 10 µL of the reference standard solution and the test sample solution were separately injected into the HPLC system for analysis. On a dry weight basis, the content of ligustroflavone (C33H40O18) in the sample was determined to be no less than 0.30%, and rhoifolin (C27H30O14) no less than 0.10%.
2.6. Quality Relationship Model
To explore the quality distribution patterns of T. arguta, 50 environmental variables (derived from 55 initial variables by excluding five categorical variables) were initially screened by correlation analysis with flavonoid contents (|r| > 0.3, p < 0.05), followed by stepwise regression to develop parsimonious models. This process developed prediction models for the compounds to uncover relationships between ecological factors and T. arguta quality. In the models, the two quality components were set as dependent variables. At the same time, ecological factors served as independent variables to fit linear relationships, establishing a framework for mapping quality-suitable areas of T. arguta. Based on the distribution of suitable habitats, areas classified as unsuitable or low-suitability were excluded. Using ArcGIS software, spatial distribution maps of the quality-related indicators within the suitable regions were then generated to visualize the spatial patterns of component concentrations.
3. Results
3.1. Evaluation of Model Accuracy and Key Environmental Factors
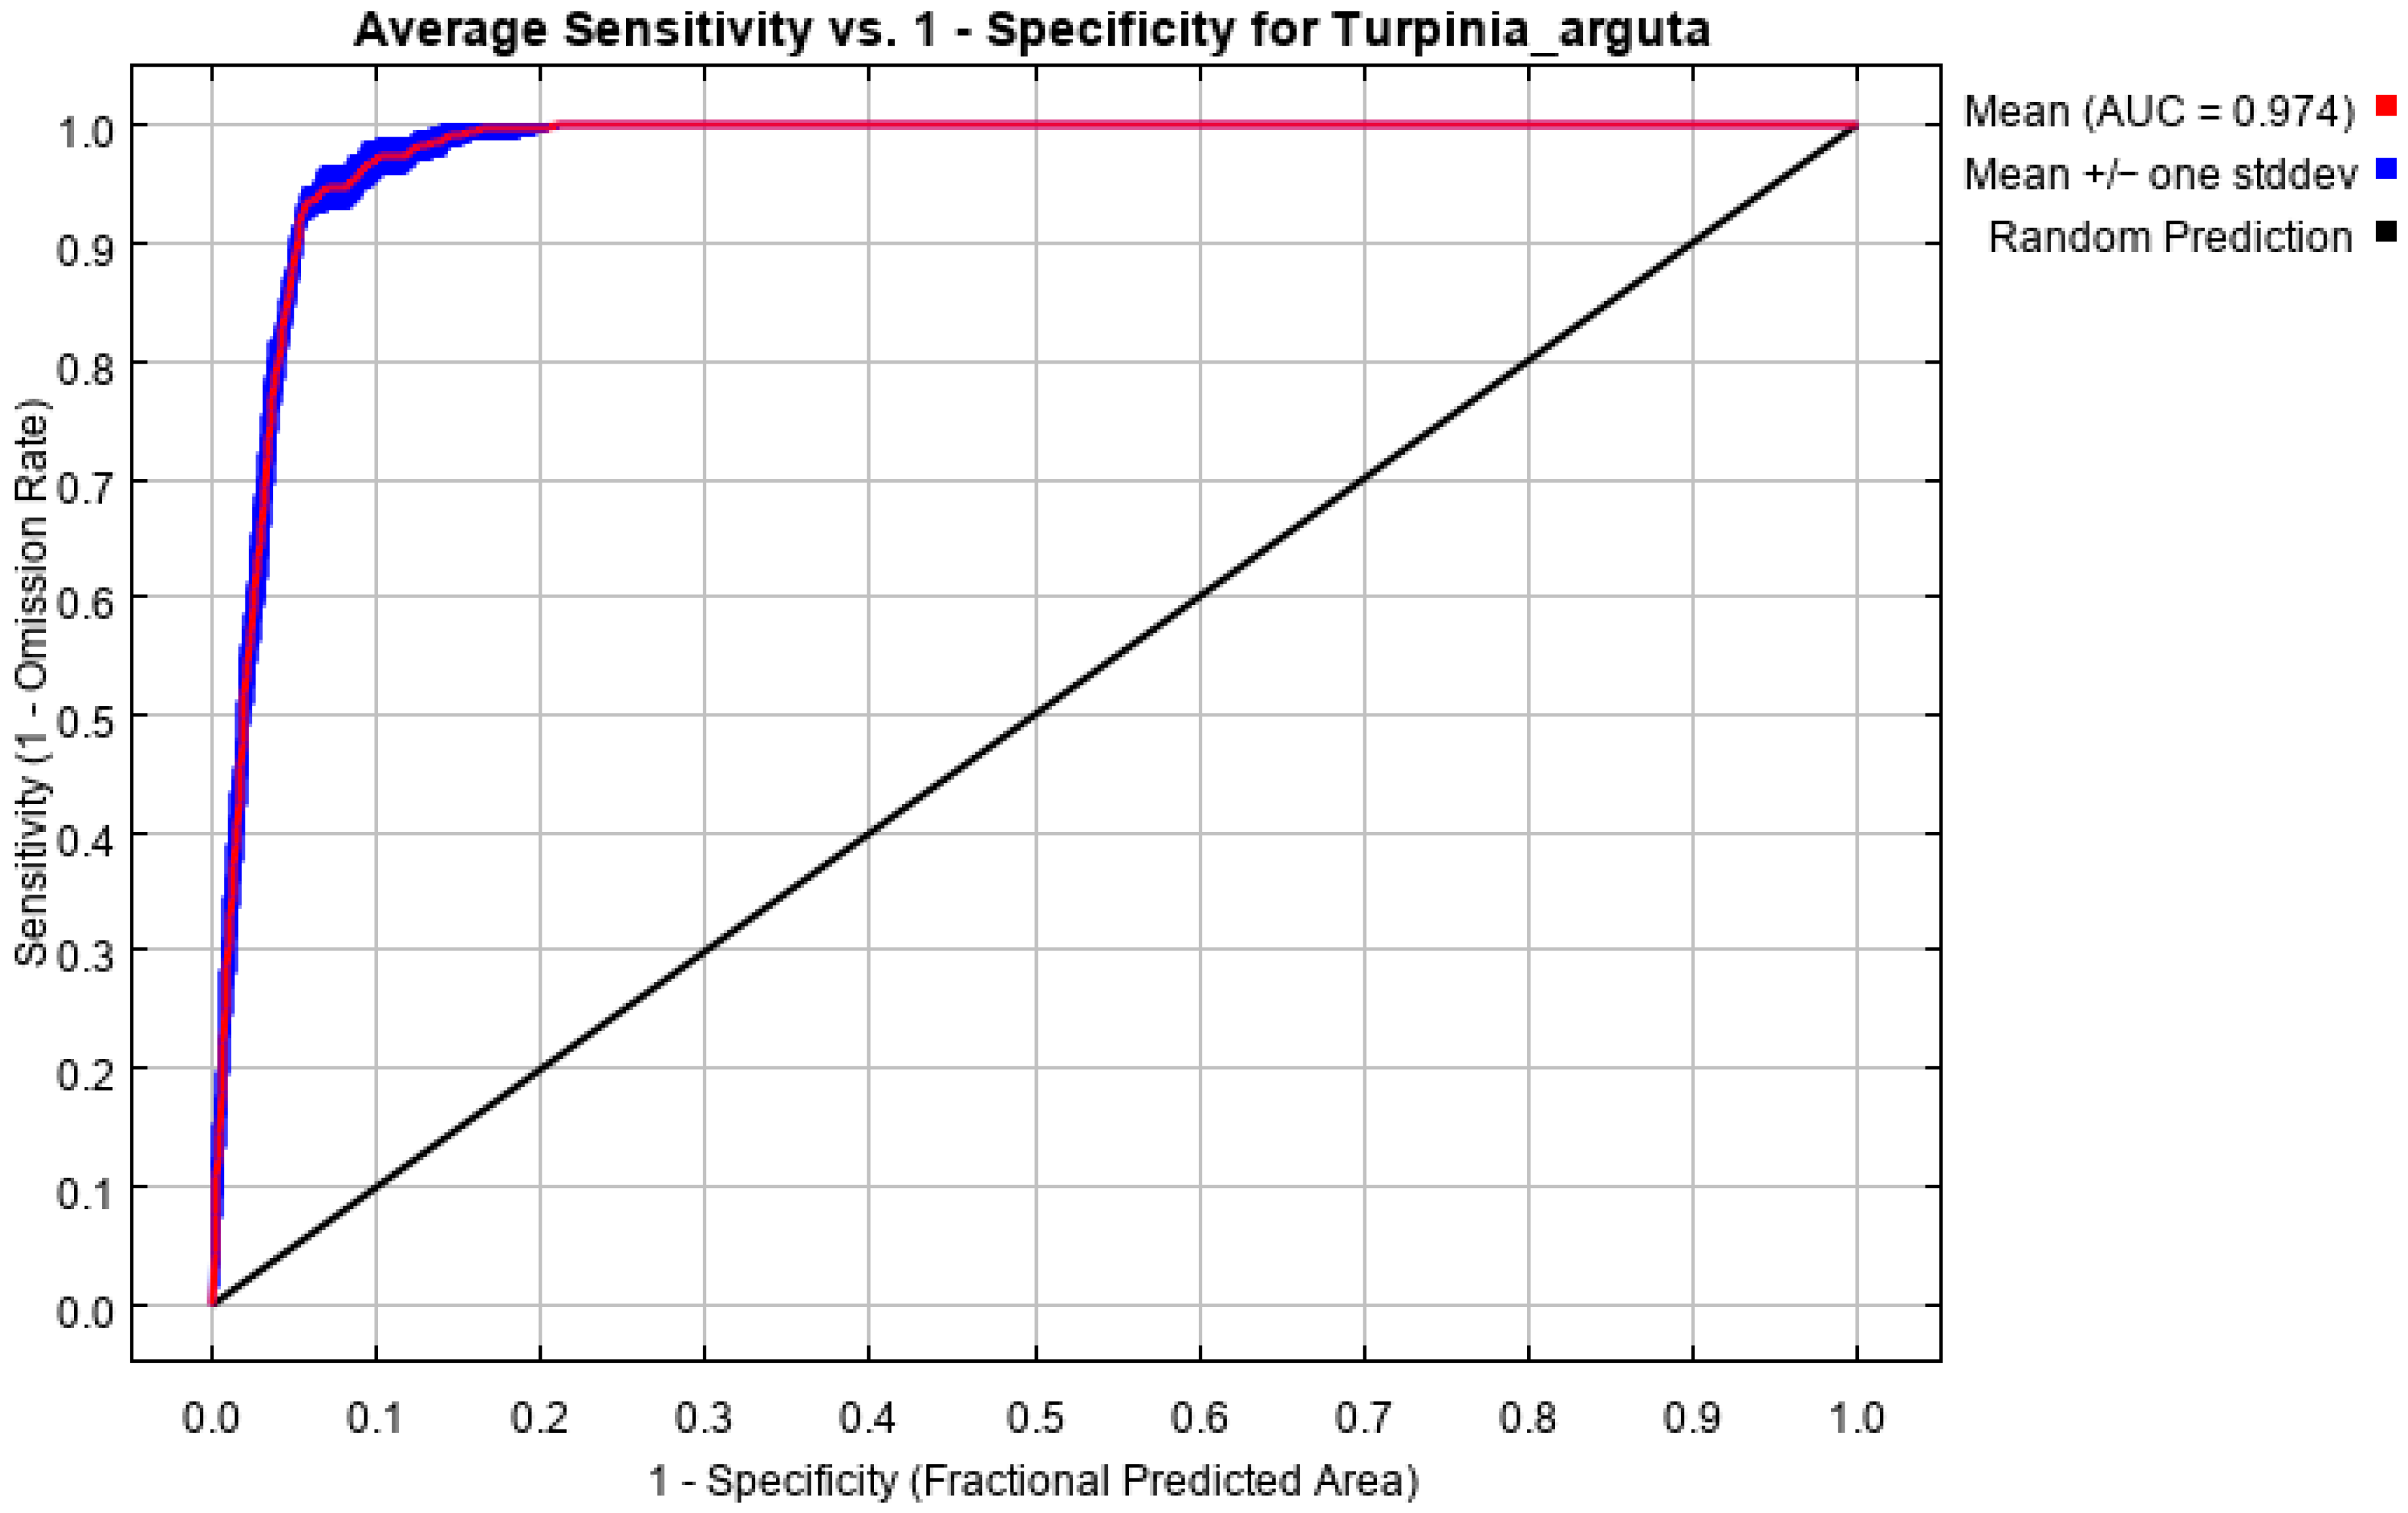
Ten independent MaxEnt model runs were conducted using the 11 preliminarily screened ecological factors, with the optimized parameter combination (RM = 0.6, FC = LQ) derived from model calibration. Under these parameters, the model achieved a mean AUC of 0.974 (
Figure 3), indicating high predictive accuracy and reliability; an average omission rate of 0.0607 (below the 0.1 threshold), reflecting strong model generalization; a mean TSS of 0.8346 (excellent discrimination ability, as TSS > 0.8 denotes outstanding performance); an average CBI of 0.8574 (excellent match between predicted suitability and observed distribution, with CBI > 0.8 indicating high consistency); and a mean Smoothed Boyce Index of 0.6793 (good model performance, as 0.5–0.8 signifies a significant positive correlation between predicted and observed distributions). Collectively, these metrics confirm the model’s robustness and reliability for predicting the potential distribution of
T. arguta.
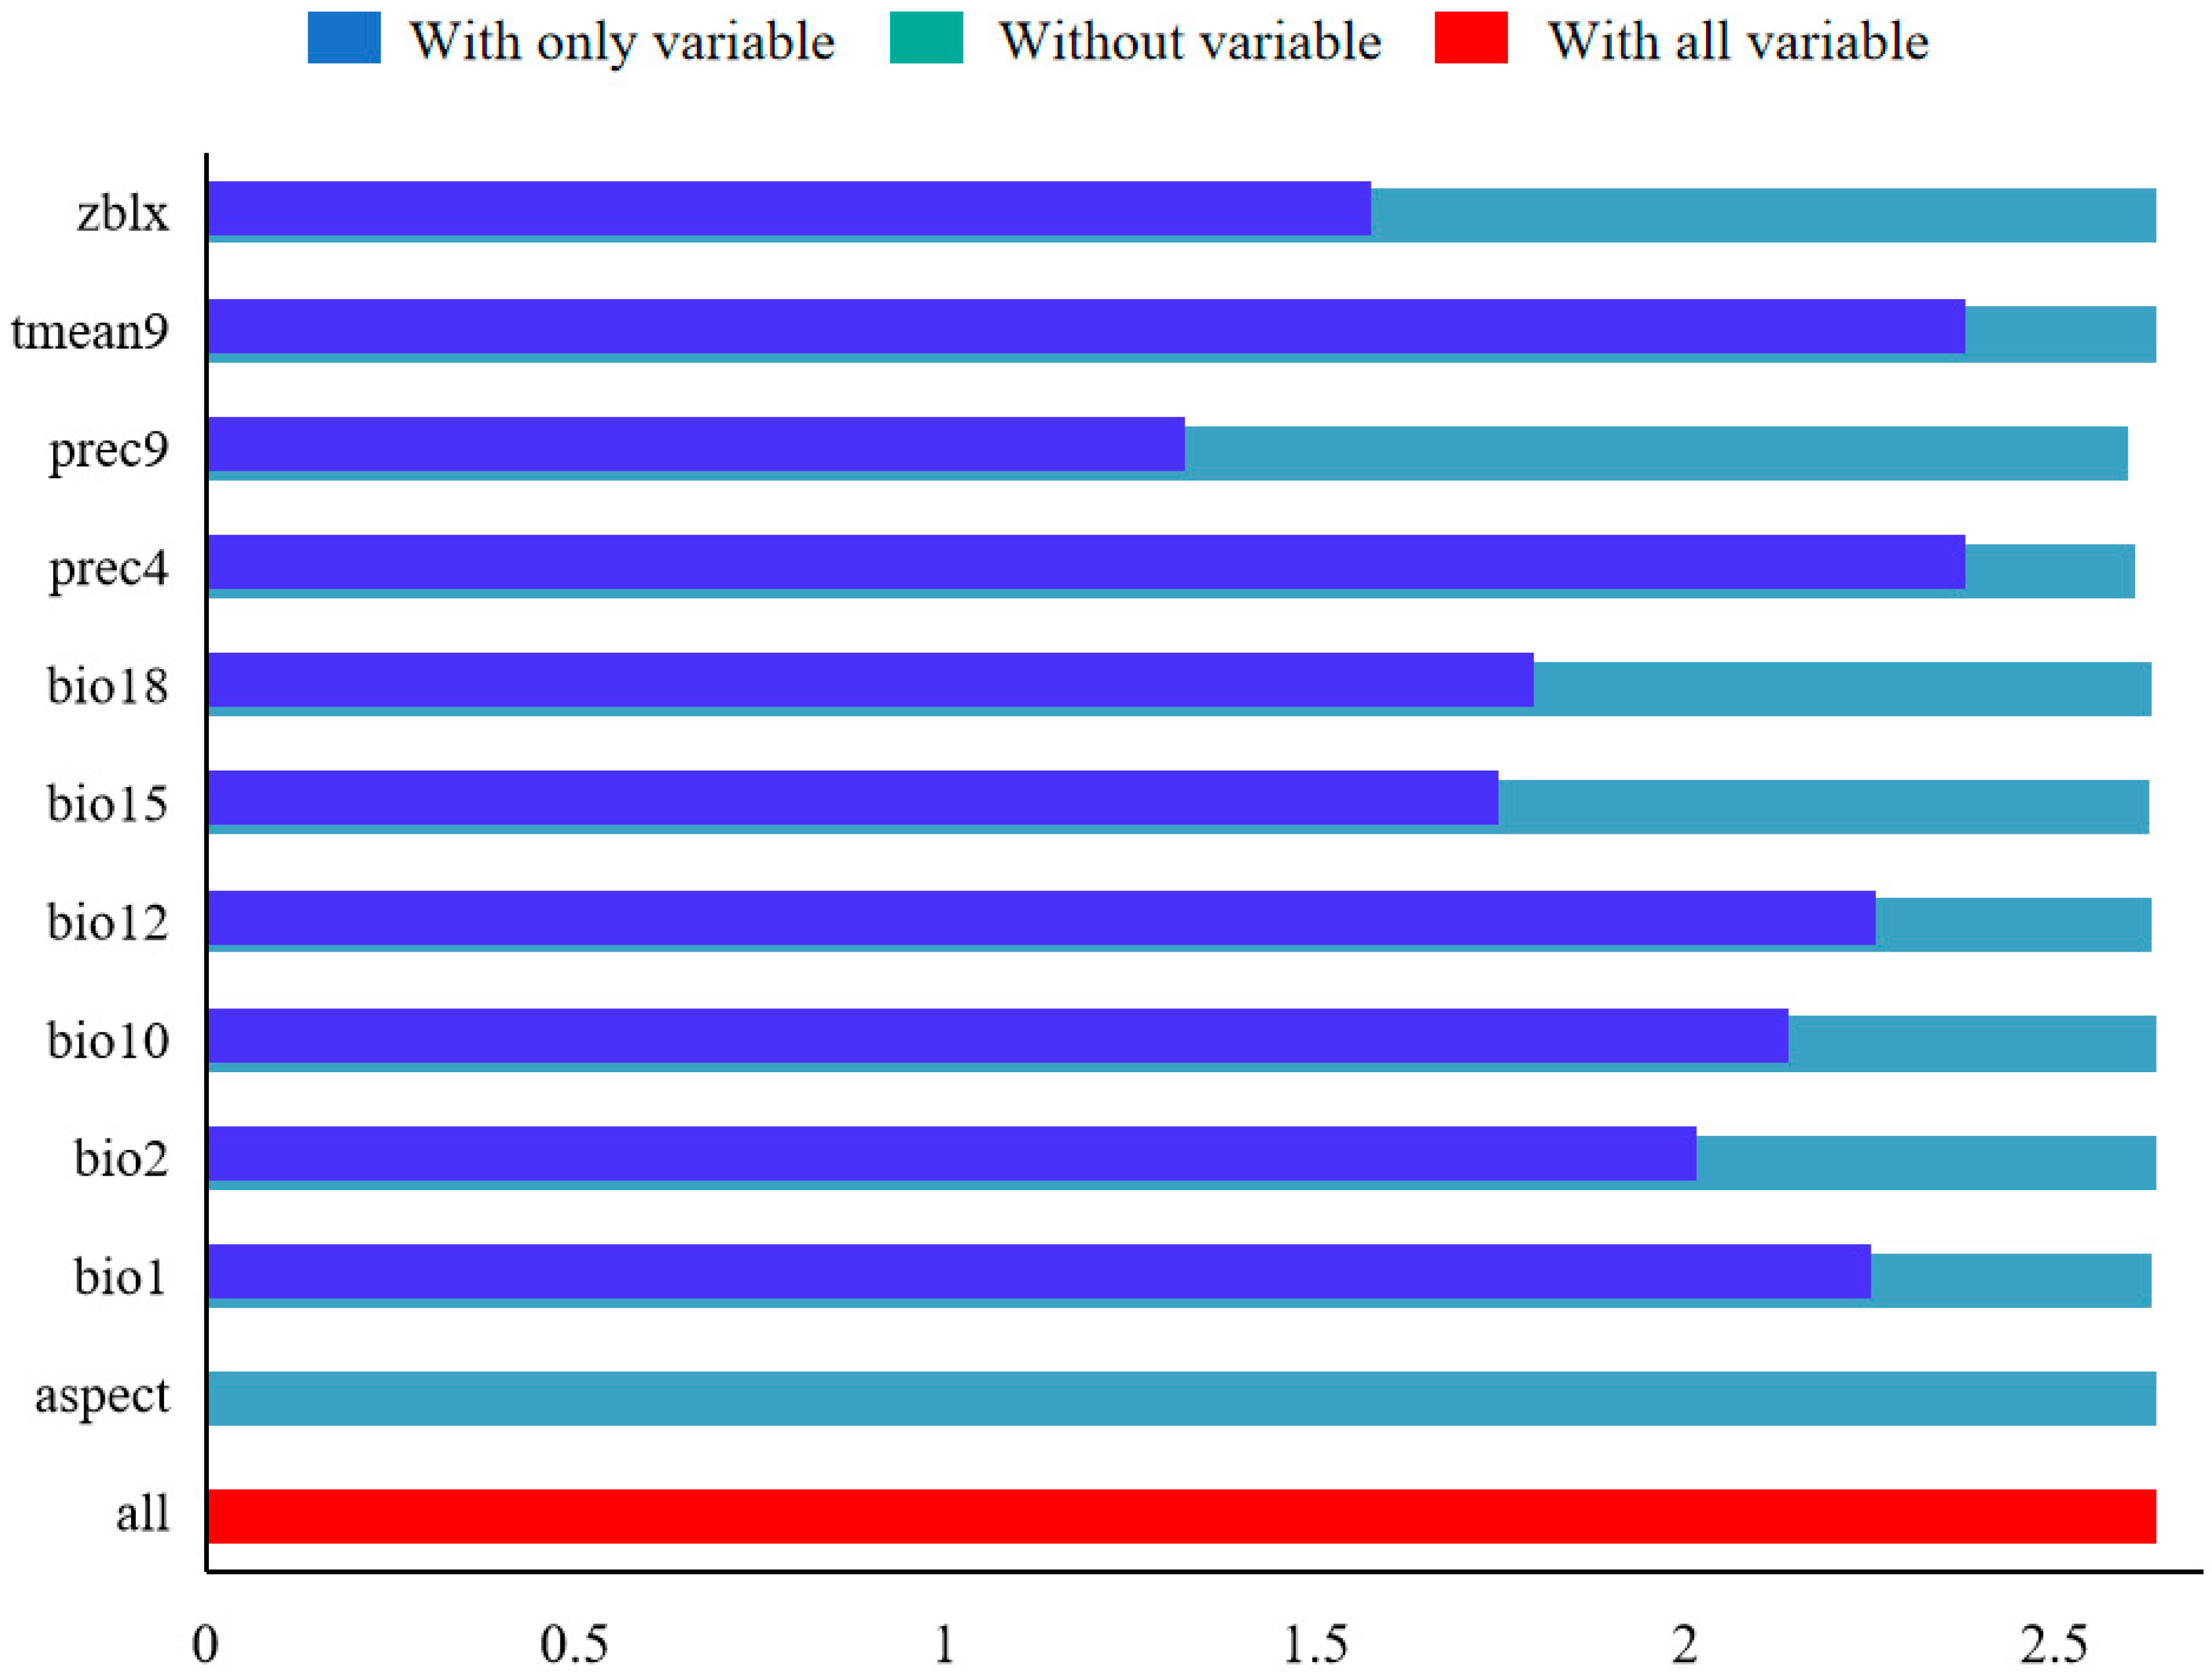
Figure 4 shows the influence of different environmental variables on the distribution of
T. arguta, based on the Jackknife method. The contribution of each environmental factor to the suitable distribution of
T. arguta was calculated using the Jackknife test (
Table 1). The average temperature in September exhibited the highest contribution to the distribution, accounting for 83.1%. This was followed by precipitation in April, contributing 12.1%. Other factors with contributions exceeding 0.5% included: precipitation in September (1.7%), annual mean temperature (1.2%), annual precipitation (0.9%), and mean temperature of the warmest quarter (0.5%). Collectively, these factors accounted for over 99% of the cumulative contribution. Factors with importance values exceeding 5% were: annual mean temperature (29.2%), precipitation in April (26.8%), annual precipitation (13.2%), average temperature in September (12.5%), and precipitation in September (6%), with a cumulative importance value reaching 87.7%. Notably, vegetation type and aspect showed zero contribution and importance values individually.
3.2. Potential Distribution Area of T. arguta Under Current Climatic Conditions
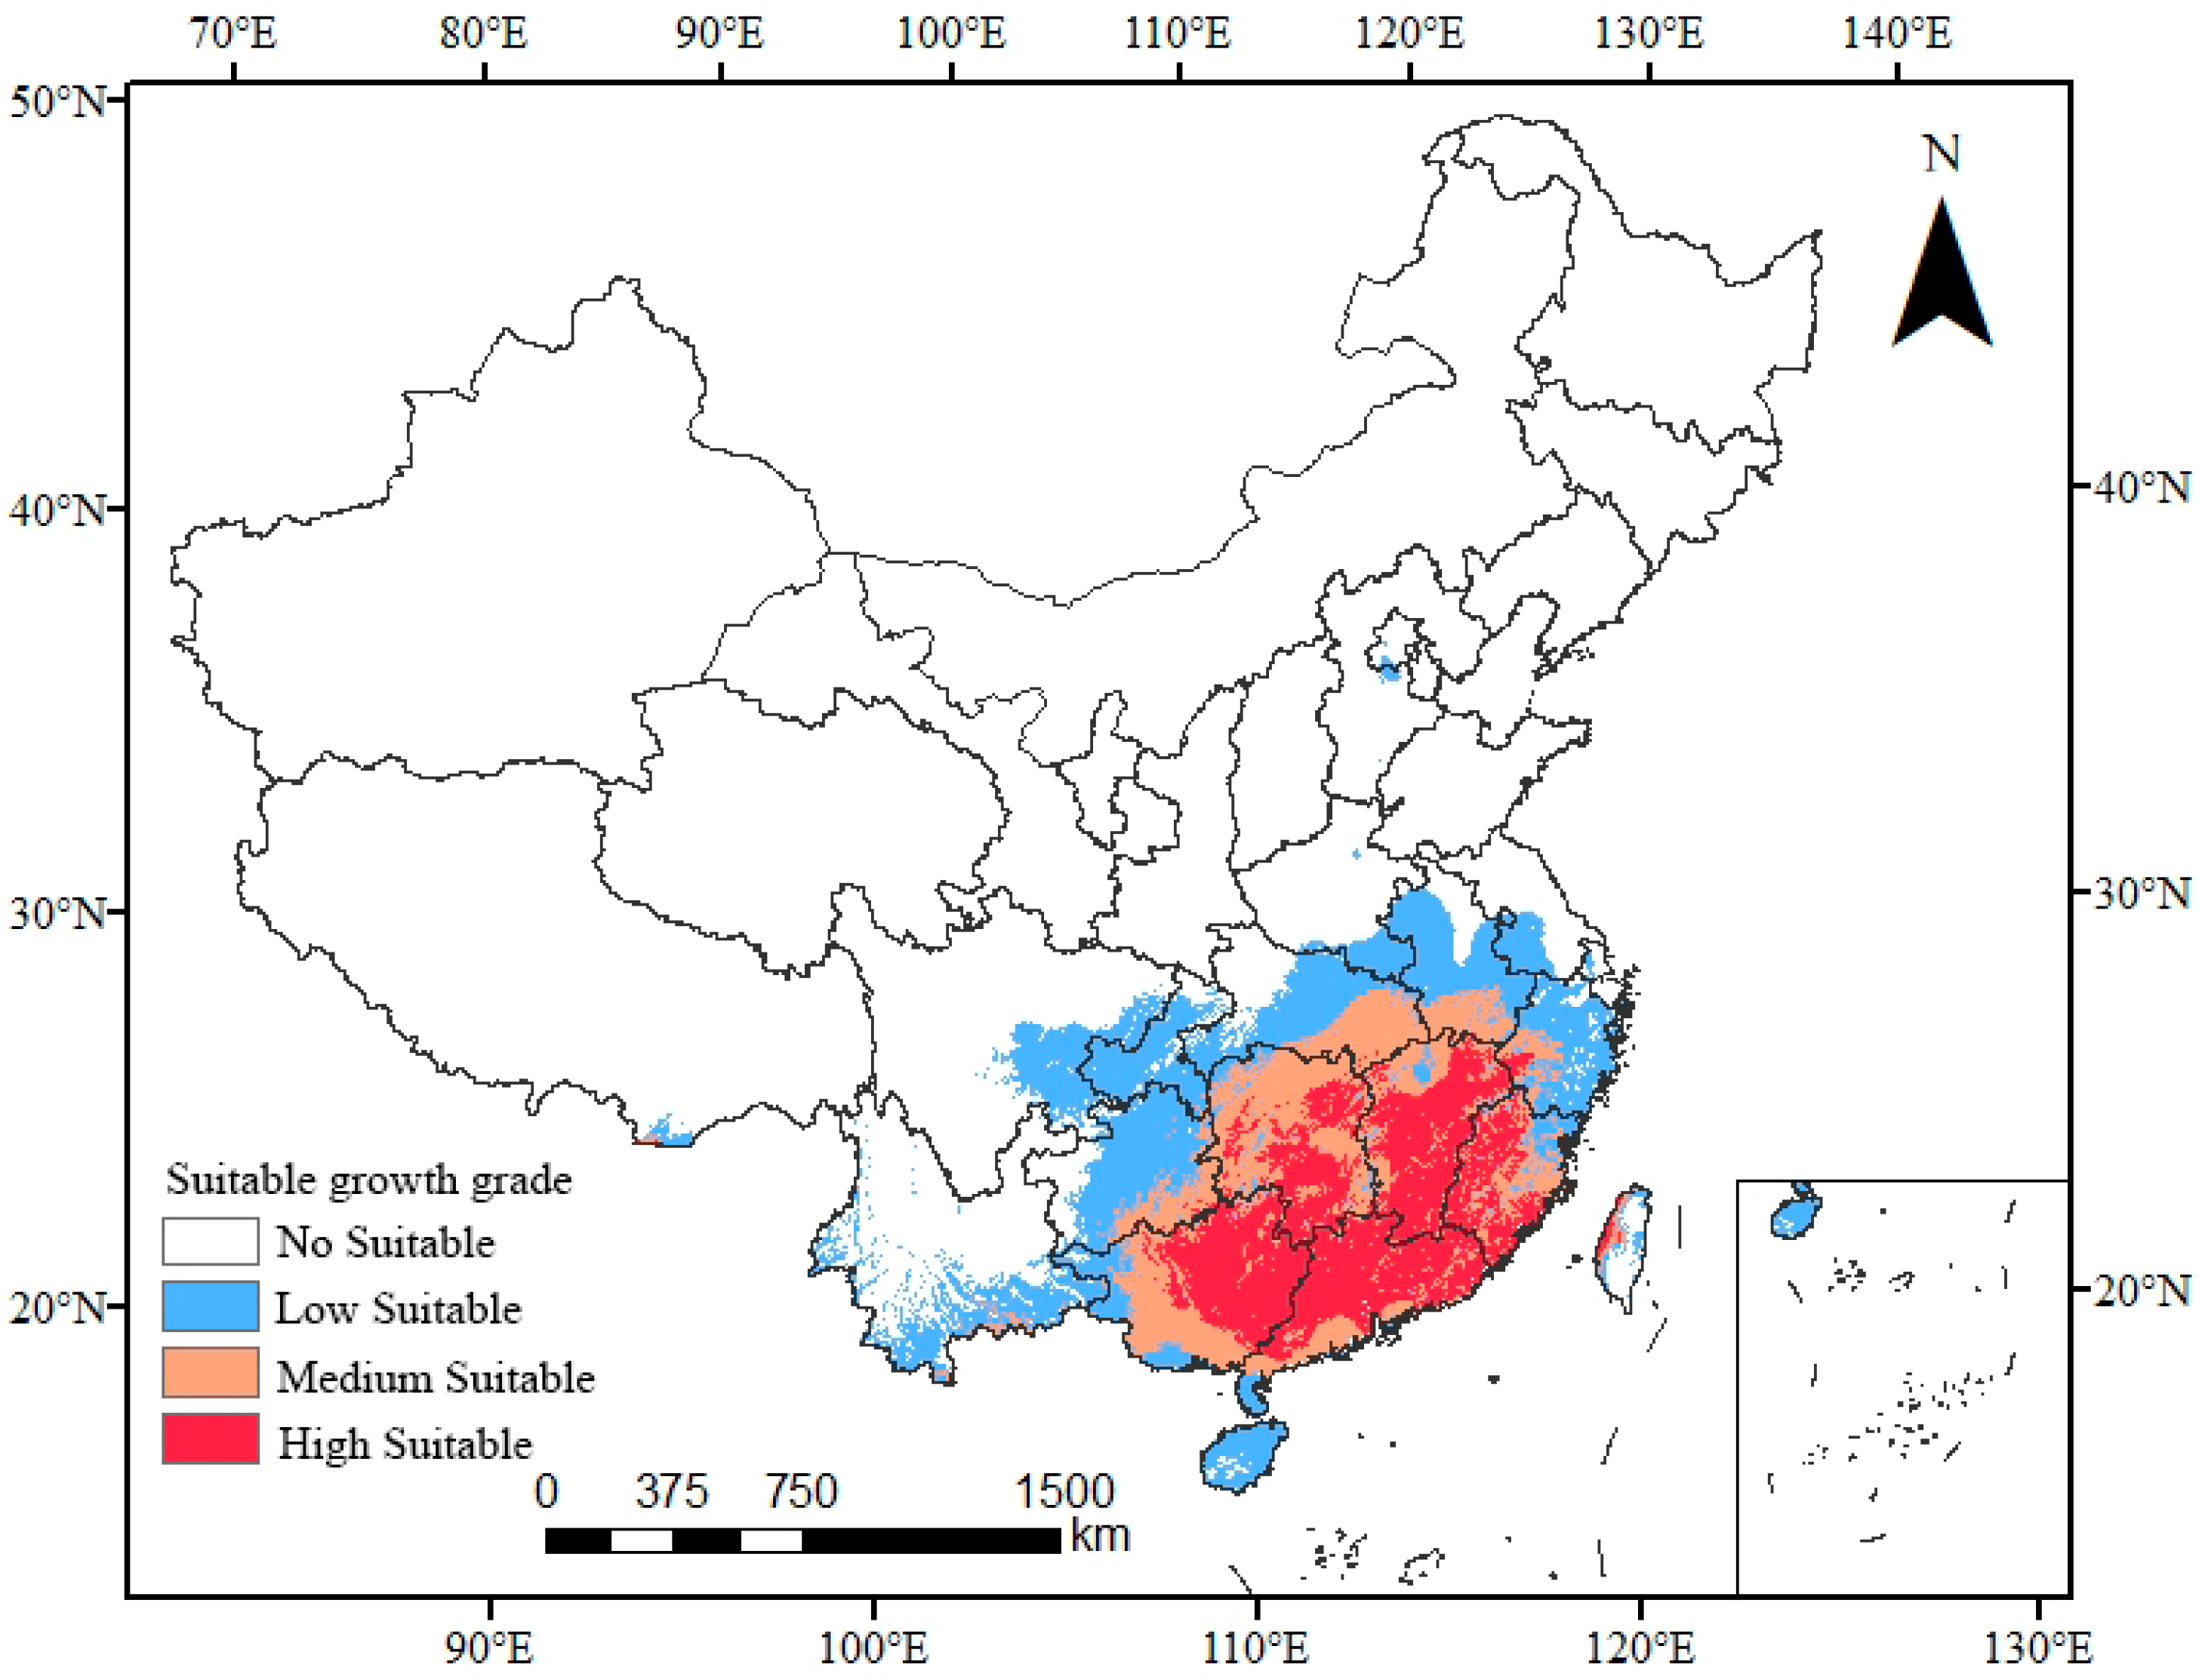
Under the current climate model, the potential distribution area of
T. arguta is shown in
Figure 5. Using the natural breaks classification method, the results were divided into four grades: unsuitable growth area, low suitable growth area, medium suitable growth area, and high suitable growth area. Calculations revealed that the total area of suitable growth areas for
T. arguta is 172.80 × 10
4 km
2, accounting for approximately 18.00% of mainland China’s land area. The areas of low, medium, and high suitable growth areas are 75.39 × 10
4 km
2, 47.88 × 10
4 km
2, and 49.53 × 10
4 km
2, respectively, representing 7.85%, 4.99%, and 5.16% of the total area.
T. arguta is primarily distributed in southeastern China, with high suitable growth areas concentrated in Jiangxi, Guangdong, Guangxi Zhuang Autonomous Region, Fujian, and Hunan Provinces, as detailed in
Table 2.
3.3. Environmental Factor Response Curve Analysis
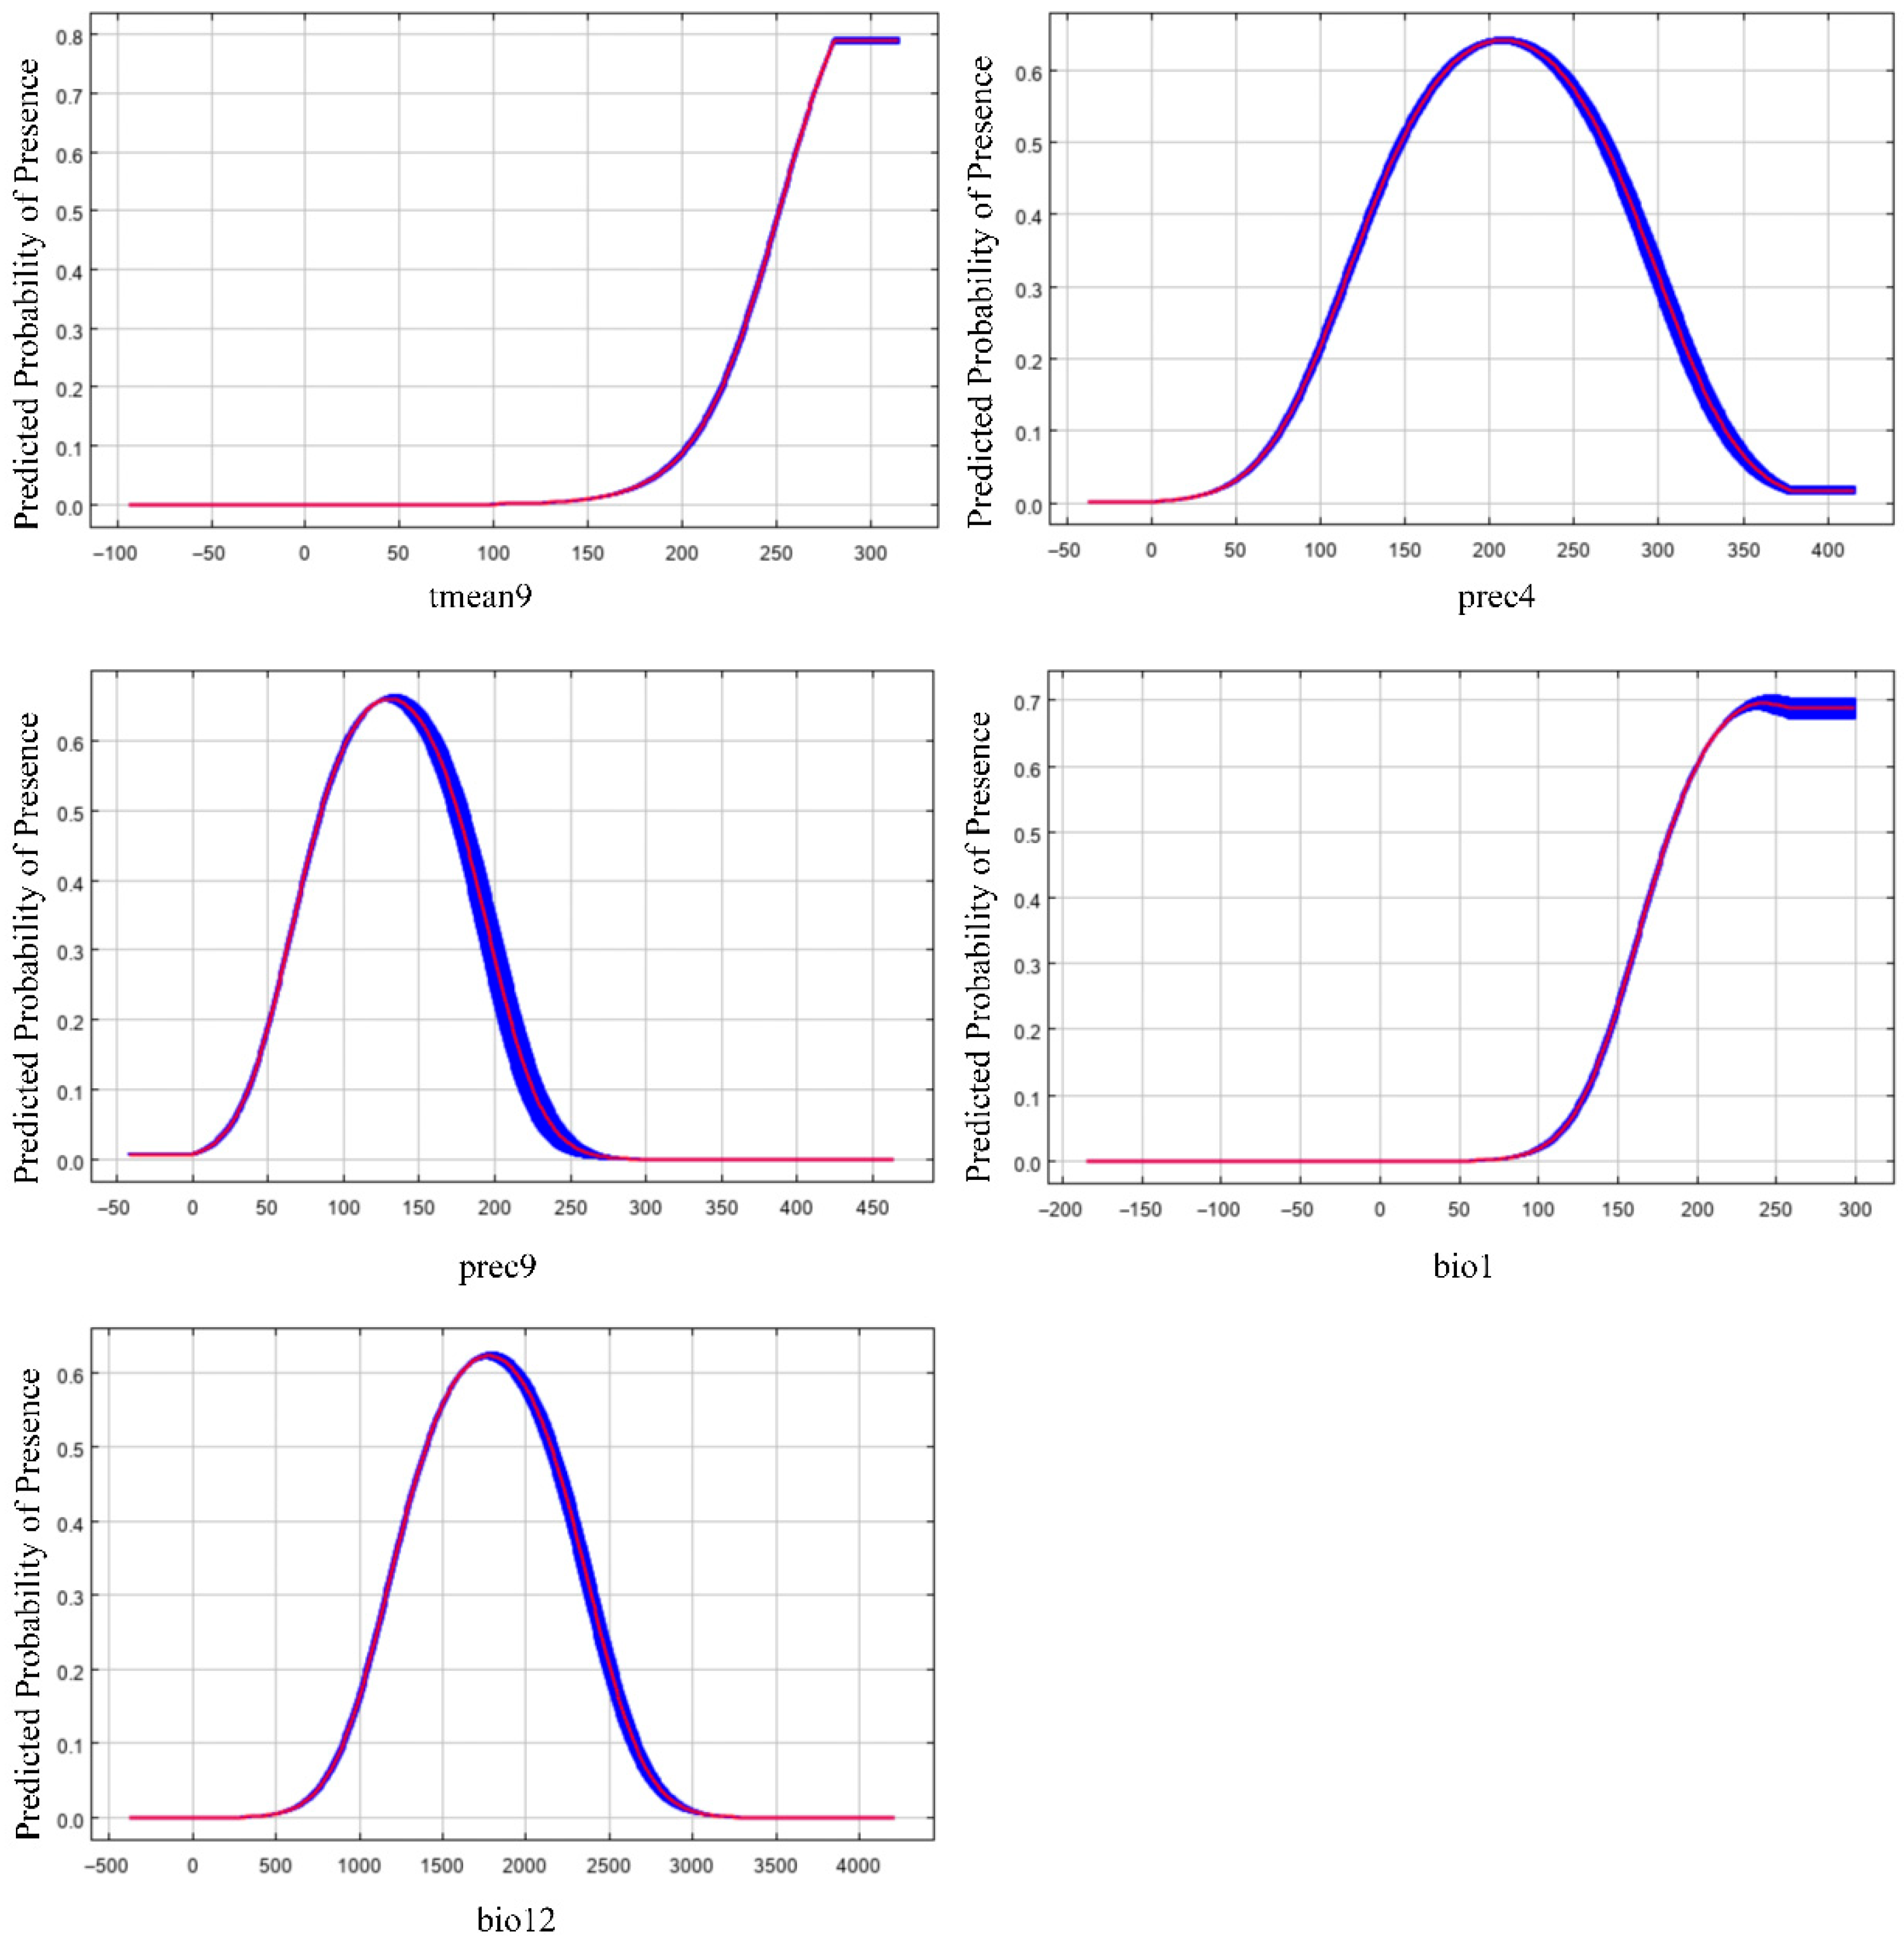
Environmental factor response curves illustrate the predicted probability of the presence of
T. arguta under varying ecological conditions (
Figure 6). Peaks in these curves represent the optimal environmental conditions favoring the species’ growth. The logistic output ranges from 0 to 1 and reflects the relative habitat suitability. An environment with a value near 1 is highly suitable, while values close to 0 indicate unsuitable conditions. In this study, suitability was defined as logistic output values greater than 0.6, indicating environments with a higher likelihood of supporting the species [
24,
26,
49]. The distribution of
T. arguta is primarily driven by temperature and precipitation. The response curve of the average temperature in September (tmean9) shows a linear trend, with a suitable range > 26 °C and an optimal temperature range of 28–32 °C. The response curve of precipitation in April (prec4) is unimodal, with a suitable range of 175–250 mm. Similarly, the response curve of precipitation in September (prec9) is unimodal, with a suitable range of 100–160 mm. The response curve of the annual mean temperature (bio1) is linear, with an appropriate range of 20–30 °C and an optimal temperature > 22.5 °C. The response curve of the annual precipitation (bio12) is unimodal, with a suitable range of 1500–2000 mm and a peak at approximately 1750 mm. These findings support decision-making for optimizing the artificial cultivation conditions of
T. arguta.
3.4. Potential Distribution Area of T. arguta Under Future Climate Conditions
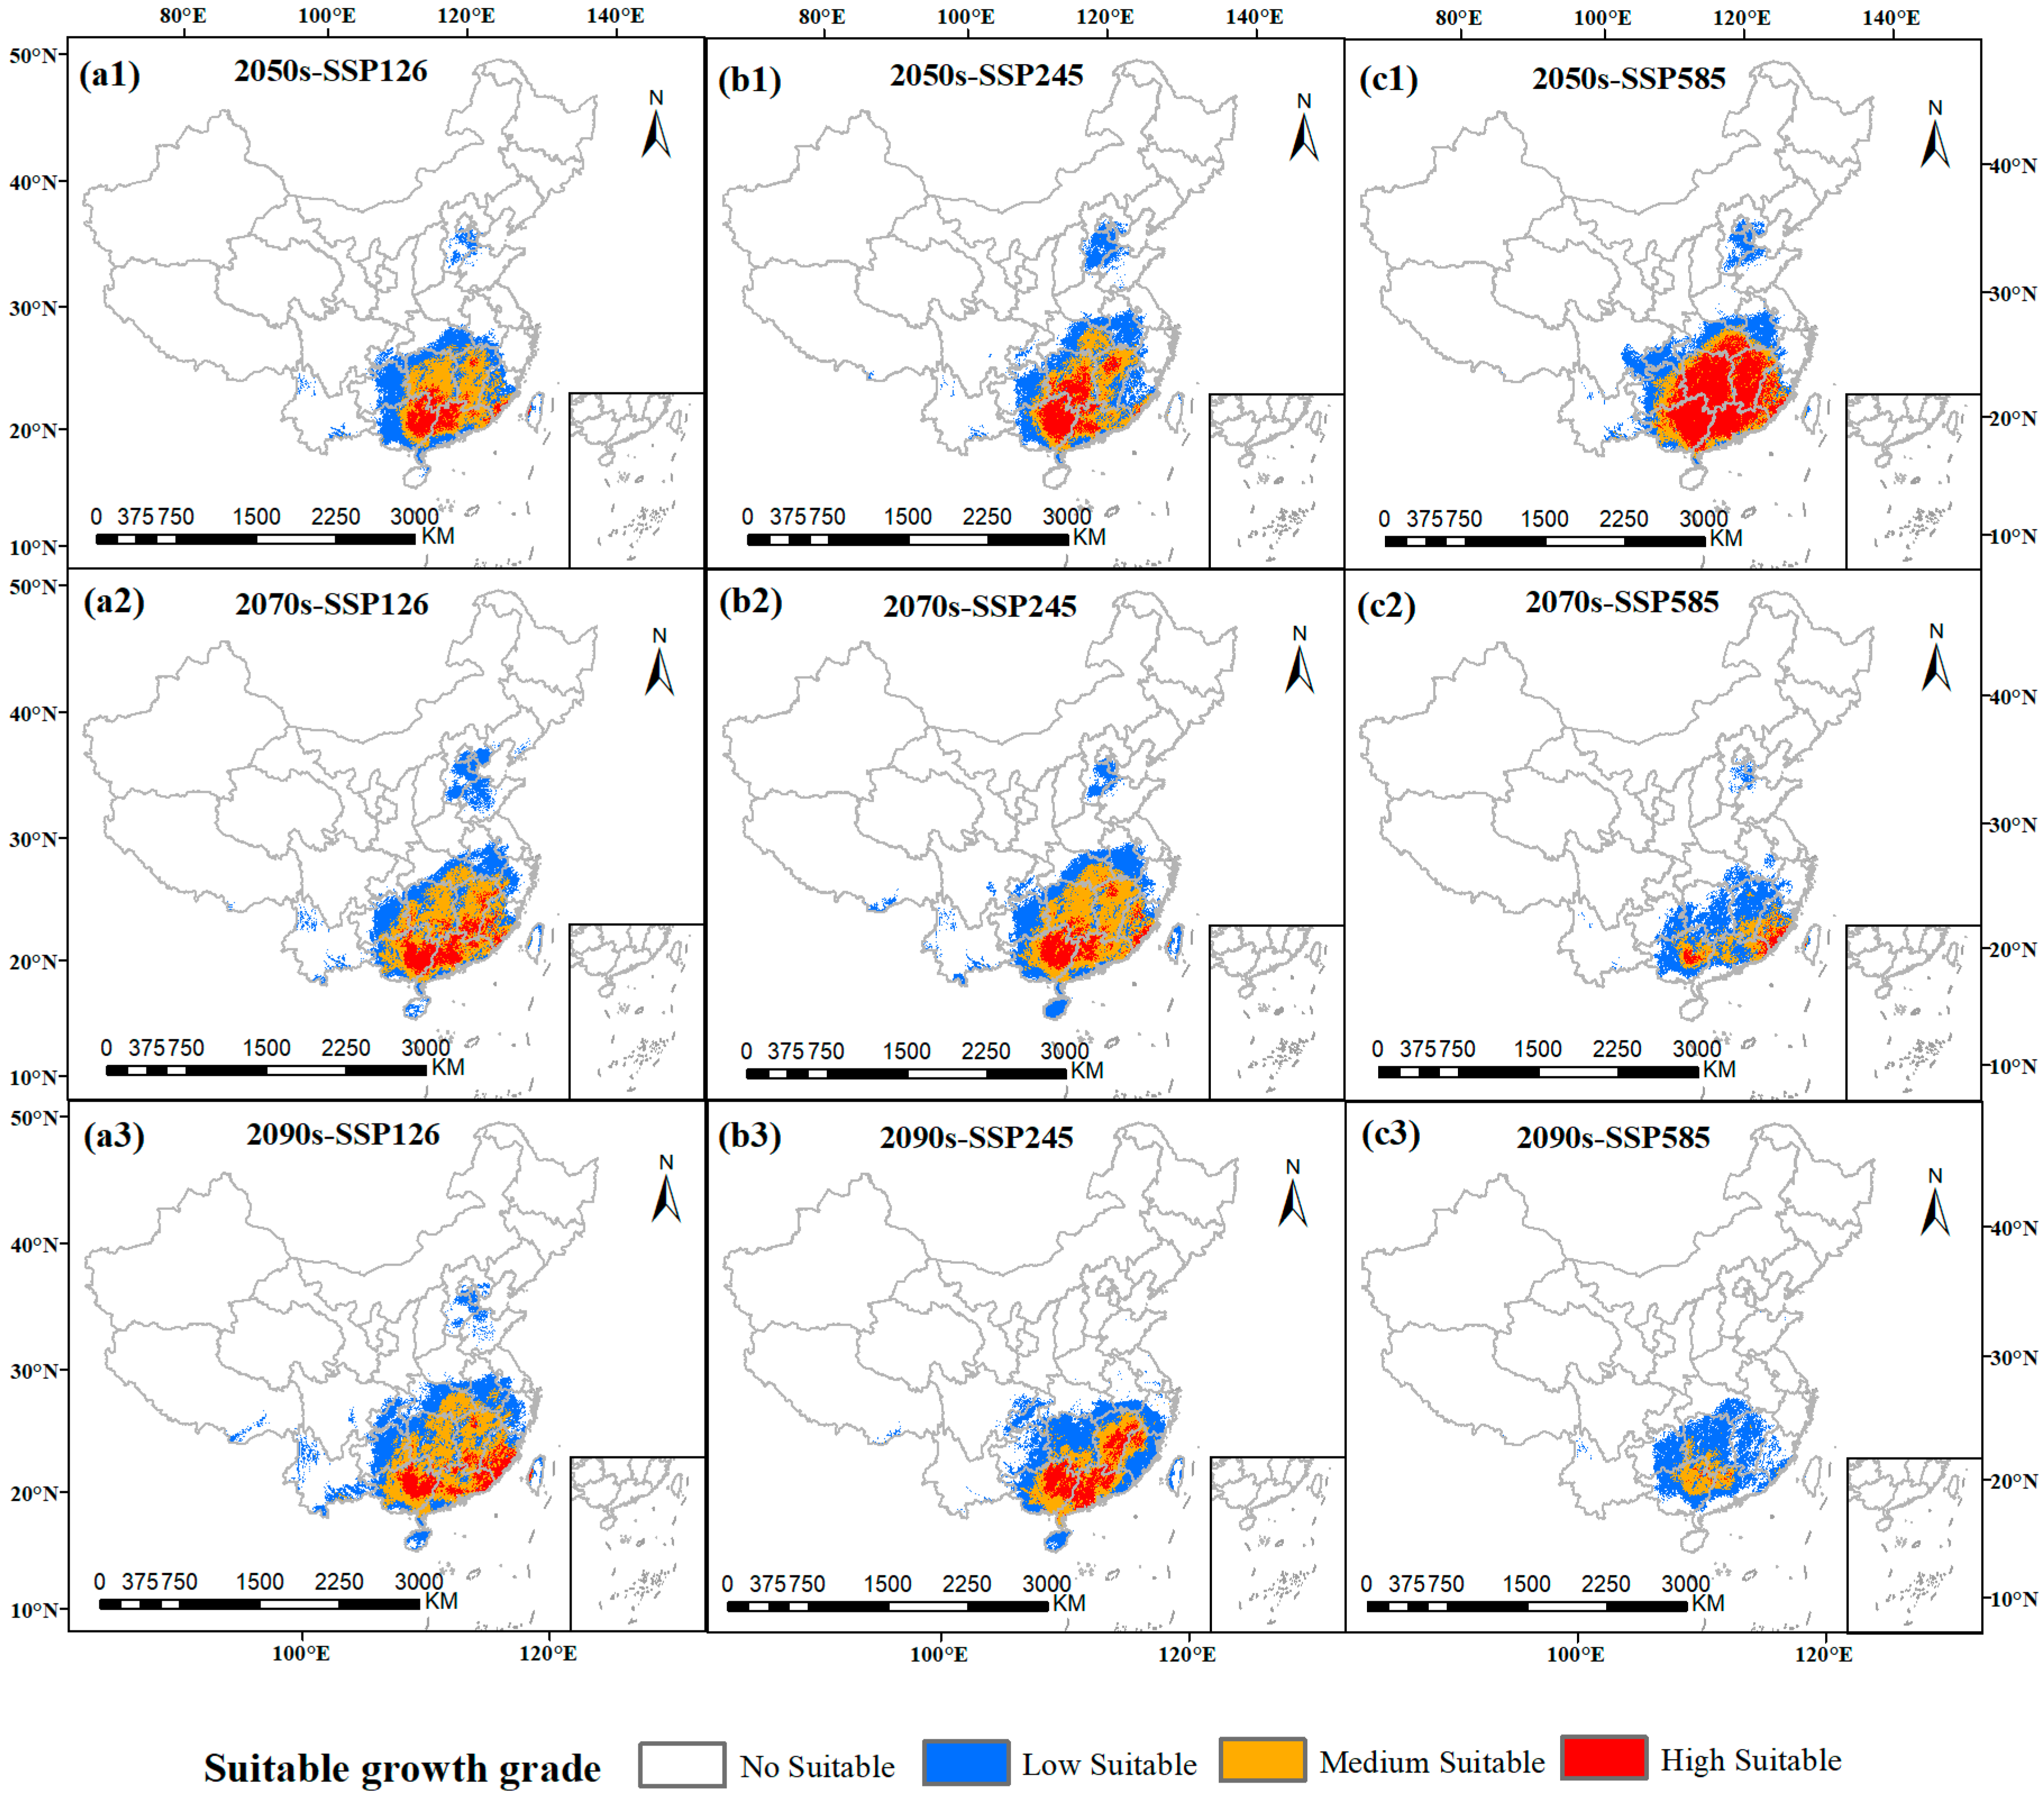
The potential distribution map of
T. arguta under future climate change scenarios is shown in the figure (
Figure 7), including three time periods (2050s, 2070s, and 2090s) and three SSP emission scenarios (SSP126, SSP245, and SSP585), for a total of nine climate scenario combinations. Changes in the area of each suitable zone (high, medium, and low suitable) were evaluated by calculating the change value (future value − current value) and the change rate [(future value − current value)/current value × 100%] to quantify shifts relative to the current suitable areas, as detailed in
Table 3.
Compared to the current total suitable area, the projected area declined across all future periods and scenarios. Under the SSP126 scenario, the reduction was the least severe, with the total area decreasing to 146.84 × 10⁴ km2 by the 2090s, representing a 15.02% loss. In contrast, more obvious contractions were observed under the SSP245 and SSP585 scenarios. By the 2090s, the total area under the SSP245 was reduced to 137.57 × 10⁴ km2 (−20.39%), while under the SSP585 scenario, it was reduced to 66.87 × 10⁴ km2, indicating a 61.30% loss.
Under the SSP126 scenario: For the periods 2050s, 2070s, and 2090s, the high suitable area decreased by 68.85%, 61.72%, and 65.50%, respectively, with decreased values of 34.10 × 10⁴ km2, 30.57 × 10⁴ km2, and 32.44 × 10⁴ km2. The medium suitable area changed by −20.51%, +2.21%, and +13.64%, with change values of −9.82 × 10⁴ km2, +1.06 × 10⁴ km2, and +6.53 × 10⁴ km2. The low suitable area decreased by 27.88%, 15.12%, and 0.07%, with decreased values of 21.02 × 10⁴ km2, 11.40 × 10⁴ km2, and 0.05 × 10⁴ km2. Under the SSP245 scenario: For the same periods, the highly suitable area decreased by 58.67%, 65.84%, and −49.91%, with absolute reductions of 29.06 × 10⁴ km2, 32.61 × 10⁴ km2, and 24.72 × 10⁴ km2. The medium suitable area changed by −27.21%, +13.47%, and −4.16%, with change values of −13.03 × 10⁴ km2, 6.45 × 10⁴ km2, and −1.99 × 10⁴ km2. The low suitable area decreased by 17.27%, 18.78%, and 11.30%, with absolute reductions of 13.02 × 10⁴ km2, 14.16 × 10⁴ km2, and 8.52 × 10⁴ km2. Under the SSP585 scenario: For the periods 2050s, 2070s, and 2090s, the high suitable area changed by +22.25%, −91.22%, and −98.83%, with change values of 11.02 × 10⁴ km2, −45.18 × 10⁴ km2, and −48.95 × 10⁴ km2. The medium suitable area decreased by 42.86%, 68.11%, and 74.77%, with absolute reductions of 20.52 × 10⁴ km2, 32.61 × 10⁴ km2, and 35.80 × 10⁴ km2. The low suitable area decreased by 29.90%, 29.14%, and 28.09%, with absolute reductions of 22.54 × 10⁴ km2, 21.97 × 10⁴ km2, and 21.18 × 10⁴ km2.
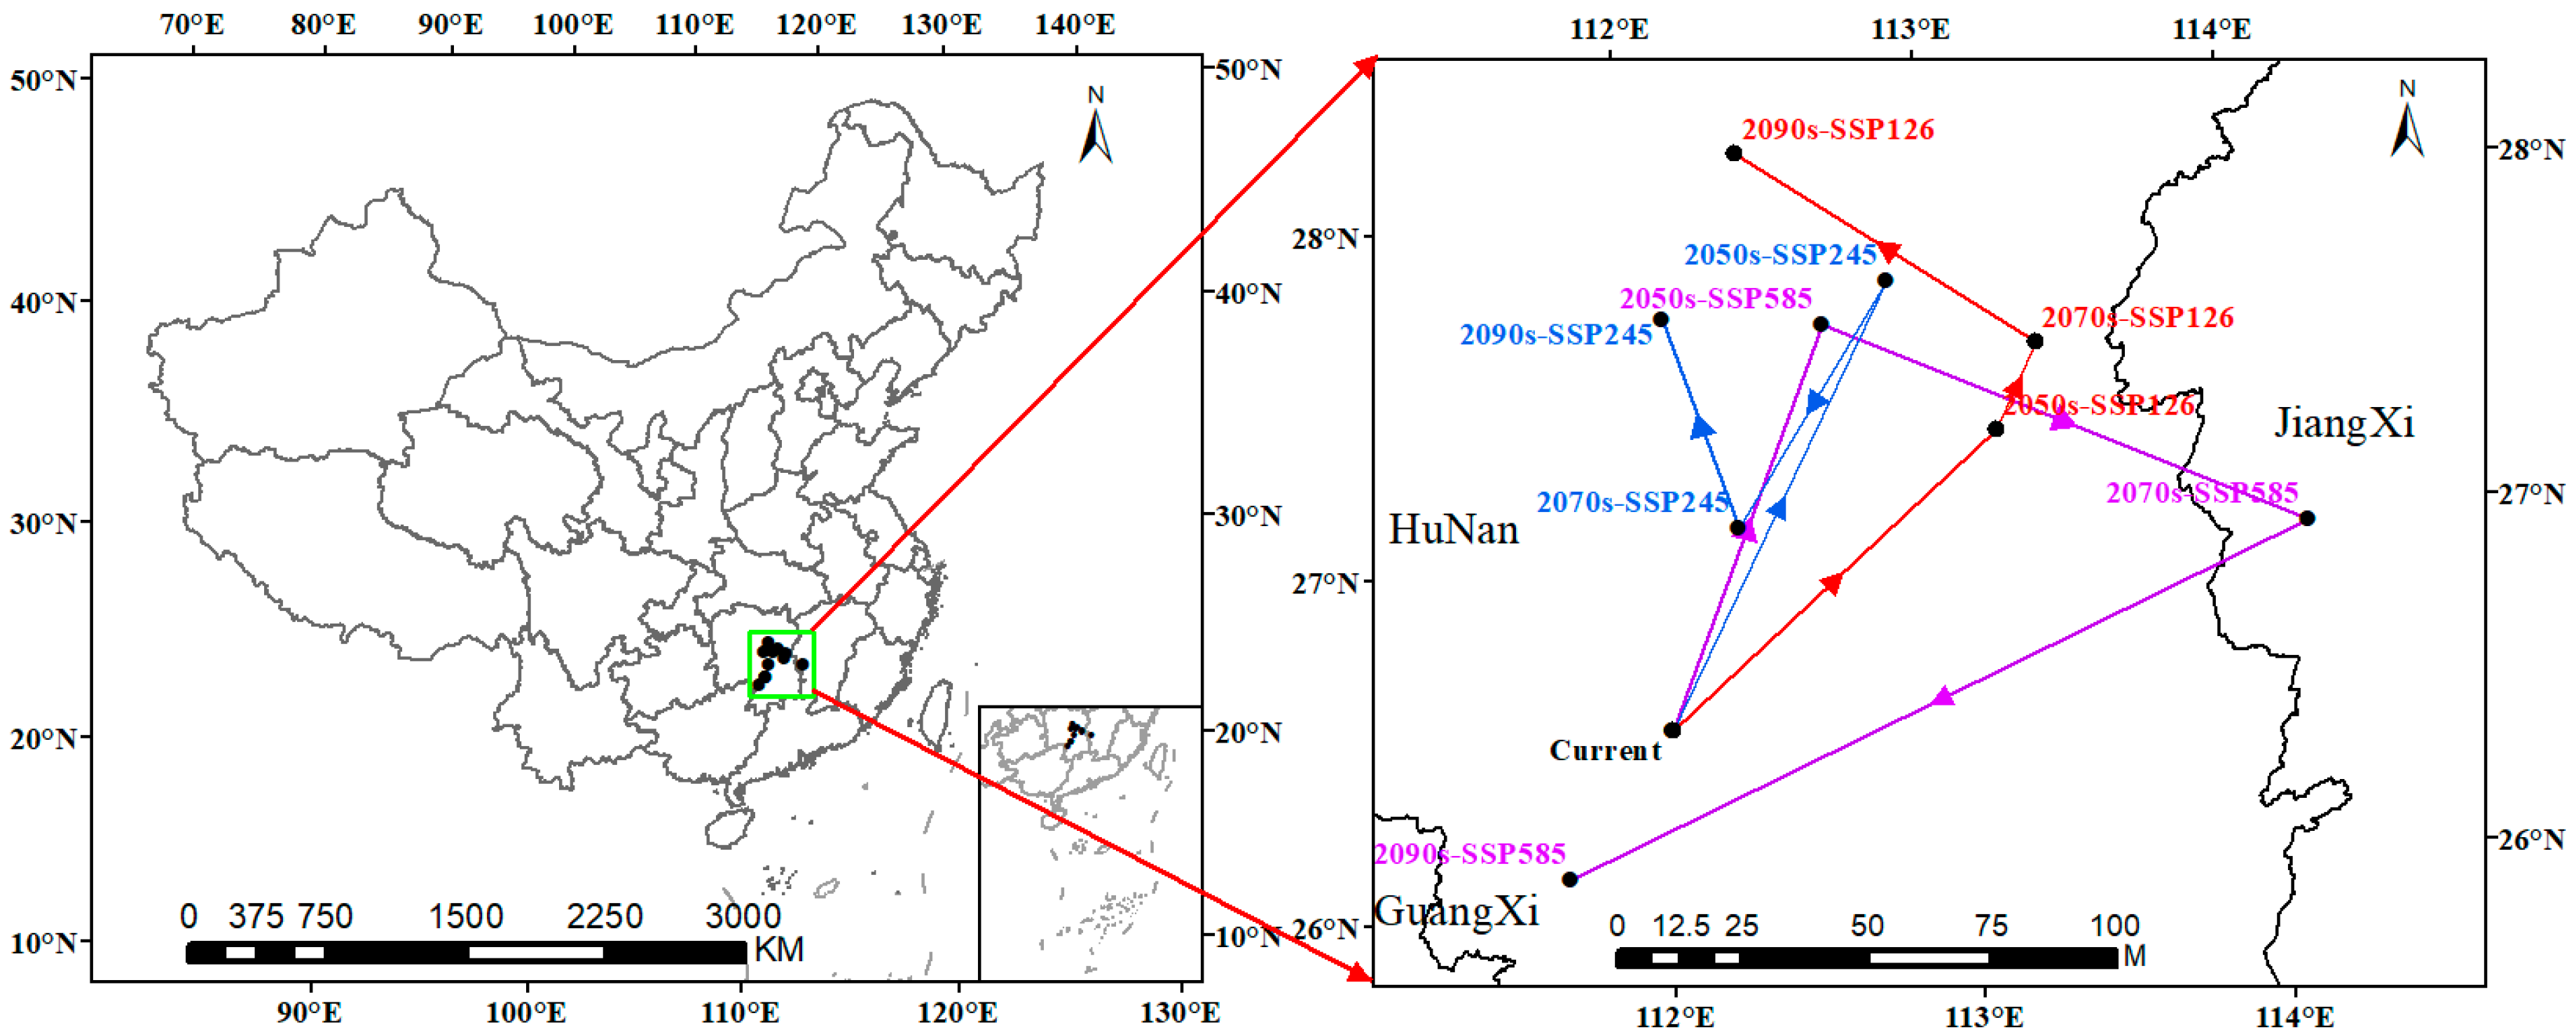
In terms of spatial patterns, the centroid of suitable habitats for
T. arguta exhibited varying shifts across all emission pathways (SSP126, SSP245, SSP585). Under the low-emission SSP126 scenario, the centroid moved steadily northeastward (
Figure 8). Under the SSP245 scenario, the centroid generally shifted northward but fluctuated in multiple directions throughout the migration process. Under the SSP585 scenario, the centroid exhibited irregular and frequent directional shifts, reflecting increased climatic instability.
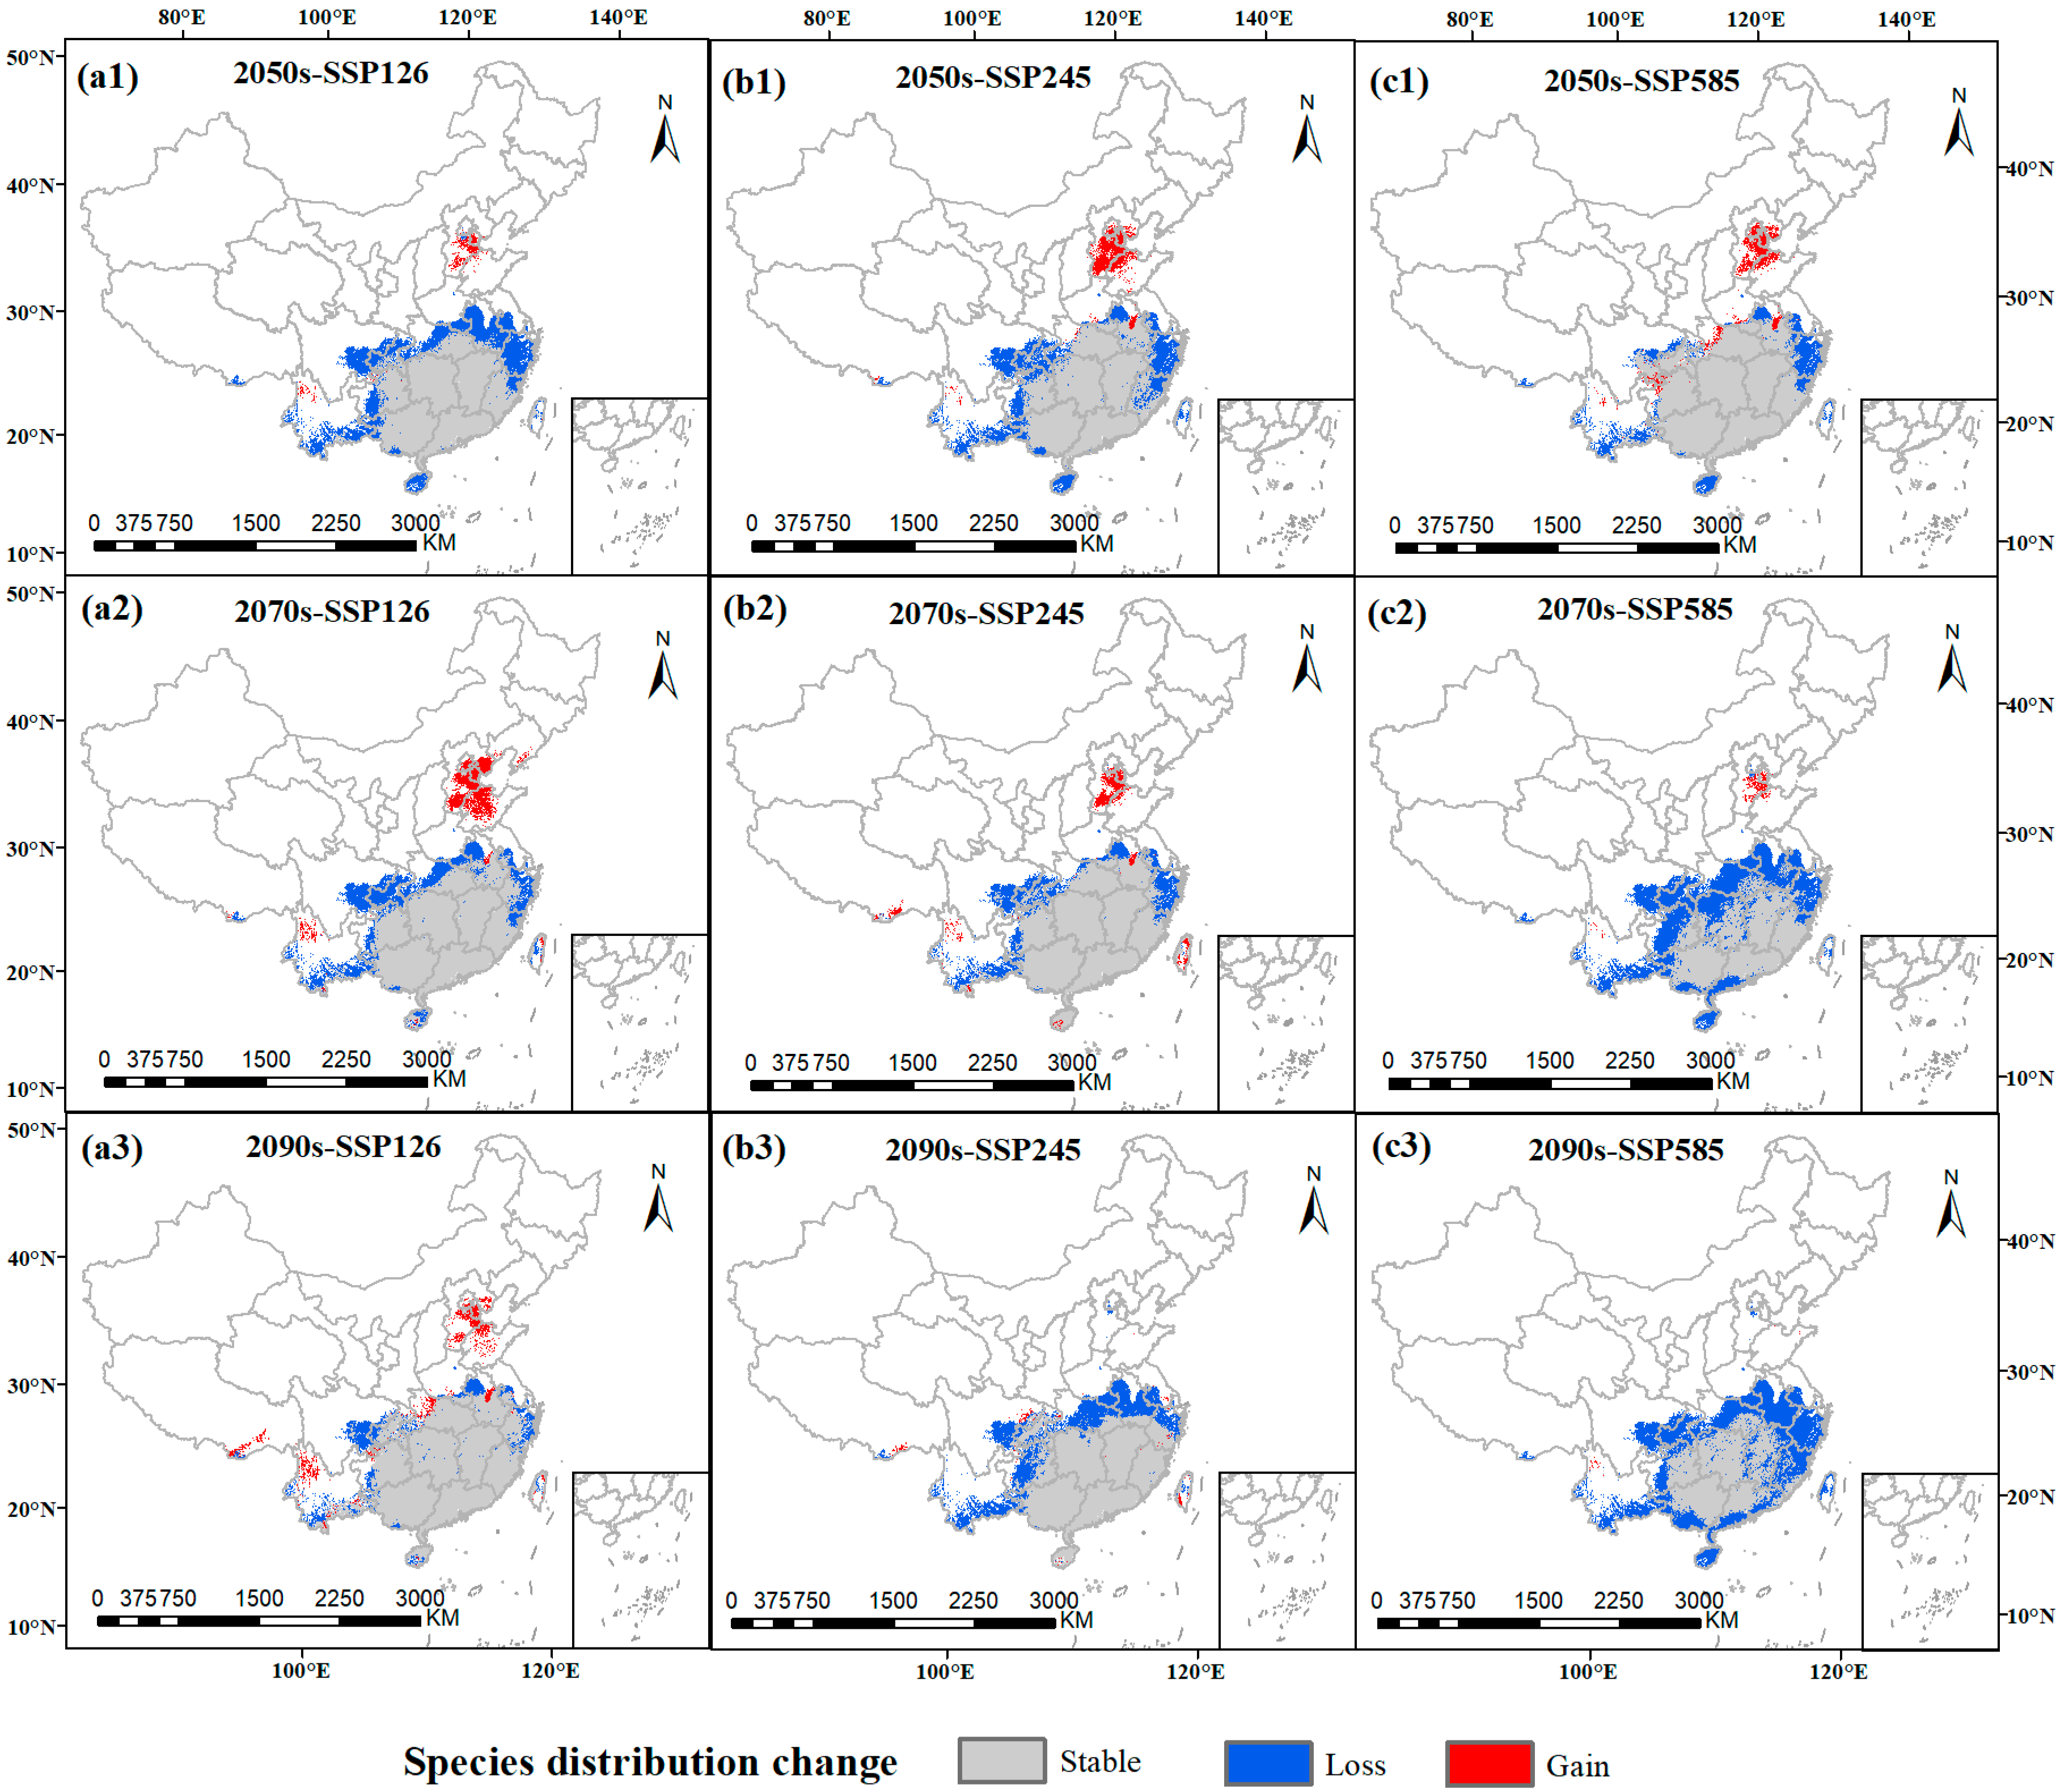
Figure 9 illustrates the spatial changes in the suitable habitat of
T. arguta. Under the SSP126 scenario, suitable habitats remain generally stable and habitat loss is limited, while newly gained suitable habitats are mainly concentrated in northern, higher-latitude regions. Under the SSP245 scenario, habitat loss increases compared to SSP126, while the newly gained suitable areas decrease. Under the SSP585 scenario, habitat loss is most pronounced, with widespread losses across southern regions.
3.5. Content Determination Results
The contents of ligustroflavone and rhoifolin in
T. arguta samples were experimentally determined. Both contents complied with the specified standards of the current Chinese Pharmacopoeia (2025 edition) [
4], making these indicators applicable for the regionalization of quality suitability of
T. arguta. HPLC chromatograms of the mixed standard and samples are shown in the
Supporting Information.
3.6. Quality Suitability Regionalization Analysis
To investigate the relationships between the contents of flavonoid components (ligustroflavone and rhoifolin) and environmental factors, we first conducted a preliminary screening of 50 continuous environmental factors. Given the limited sample size (n = 40), a conservative strategy was adopted to prevent overfitting: we first calculated the simple correlation coefficient between each environmental factor and the target component, retaining those with |r| > 0.3 and p < 0.05 for subsequent multiple regression analysis. Subsequently, the stepwise regression method was employed in SPSS v20 to construct the most parsimonious linear model from the preselected factors. The results identified the mean diurnal temperature range (bio2) as the key environmental factor influencing ligustroflavone content, while soil sand content (trhsl) was the critical factor for rhoifolin content. Both regression equations were statistically significant, enabling the prediction of the contents of the two indicator components using these models.
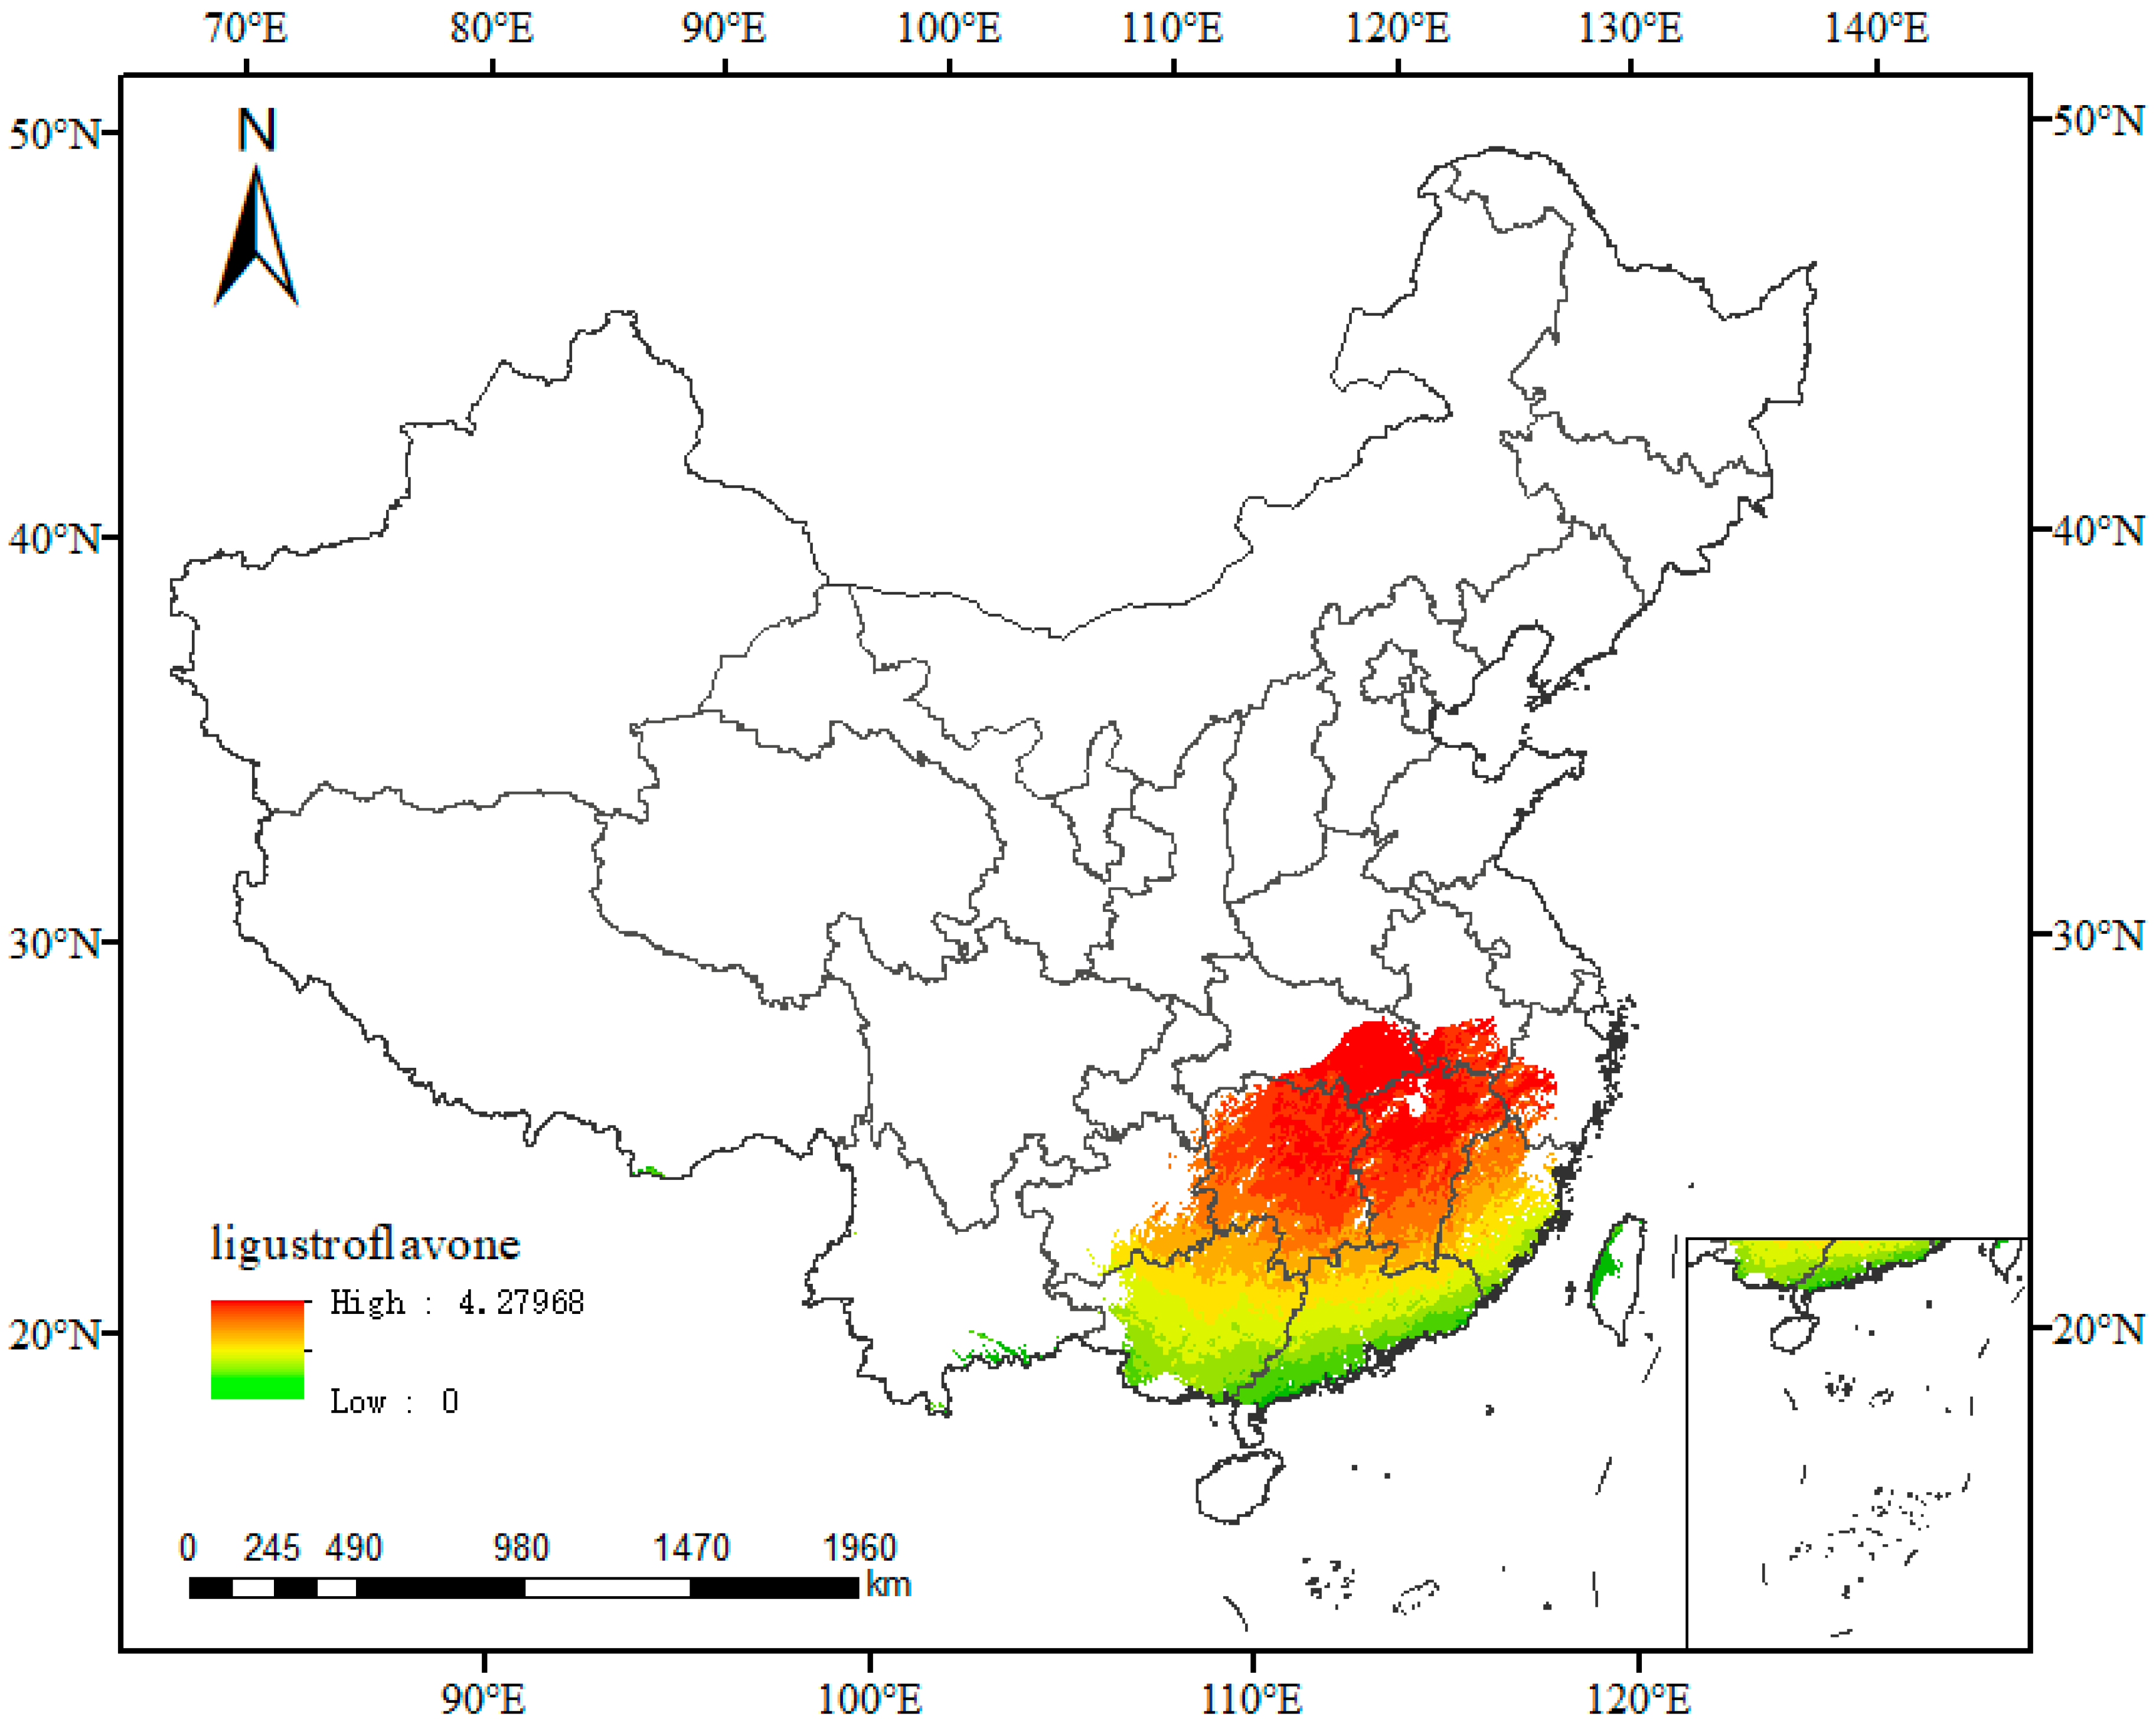
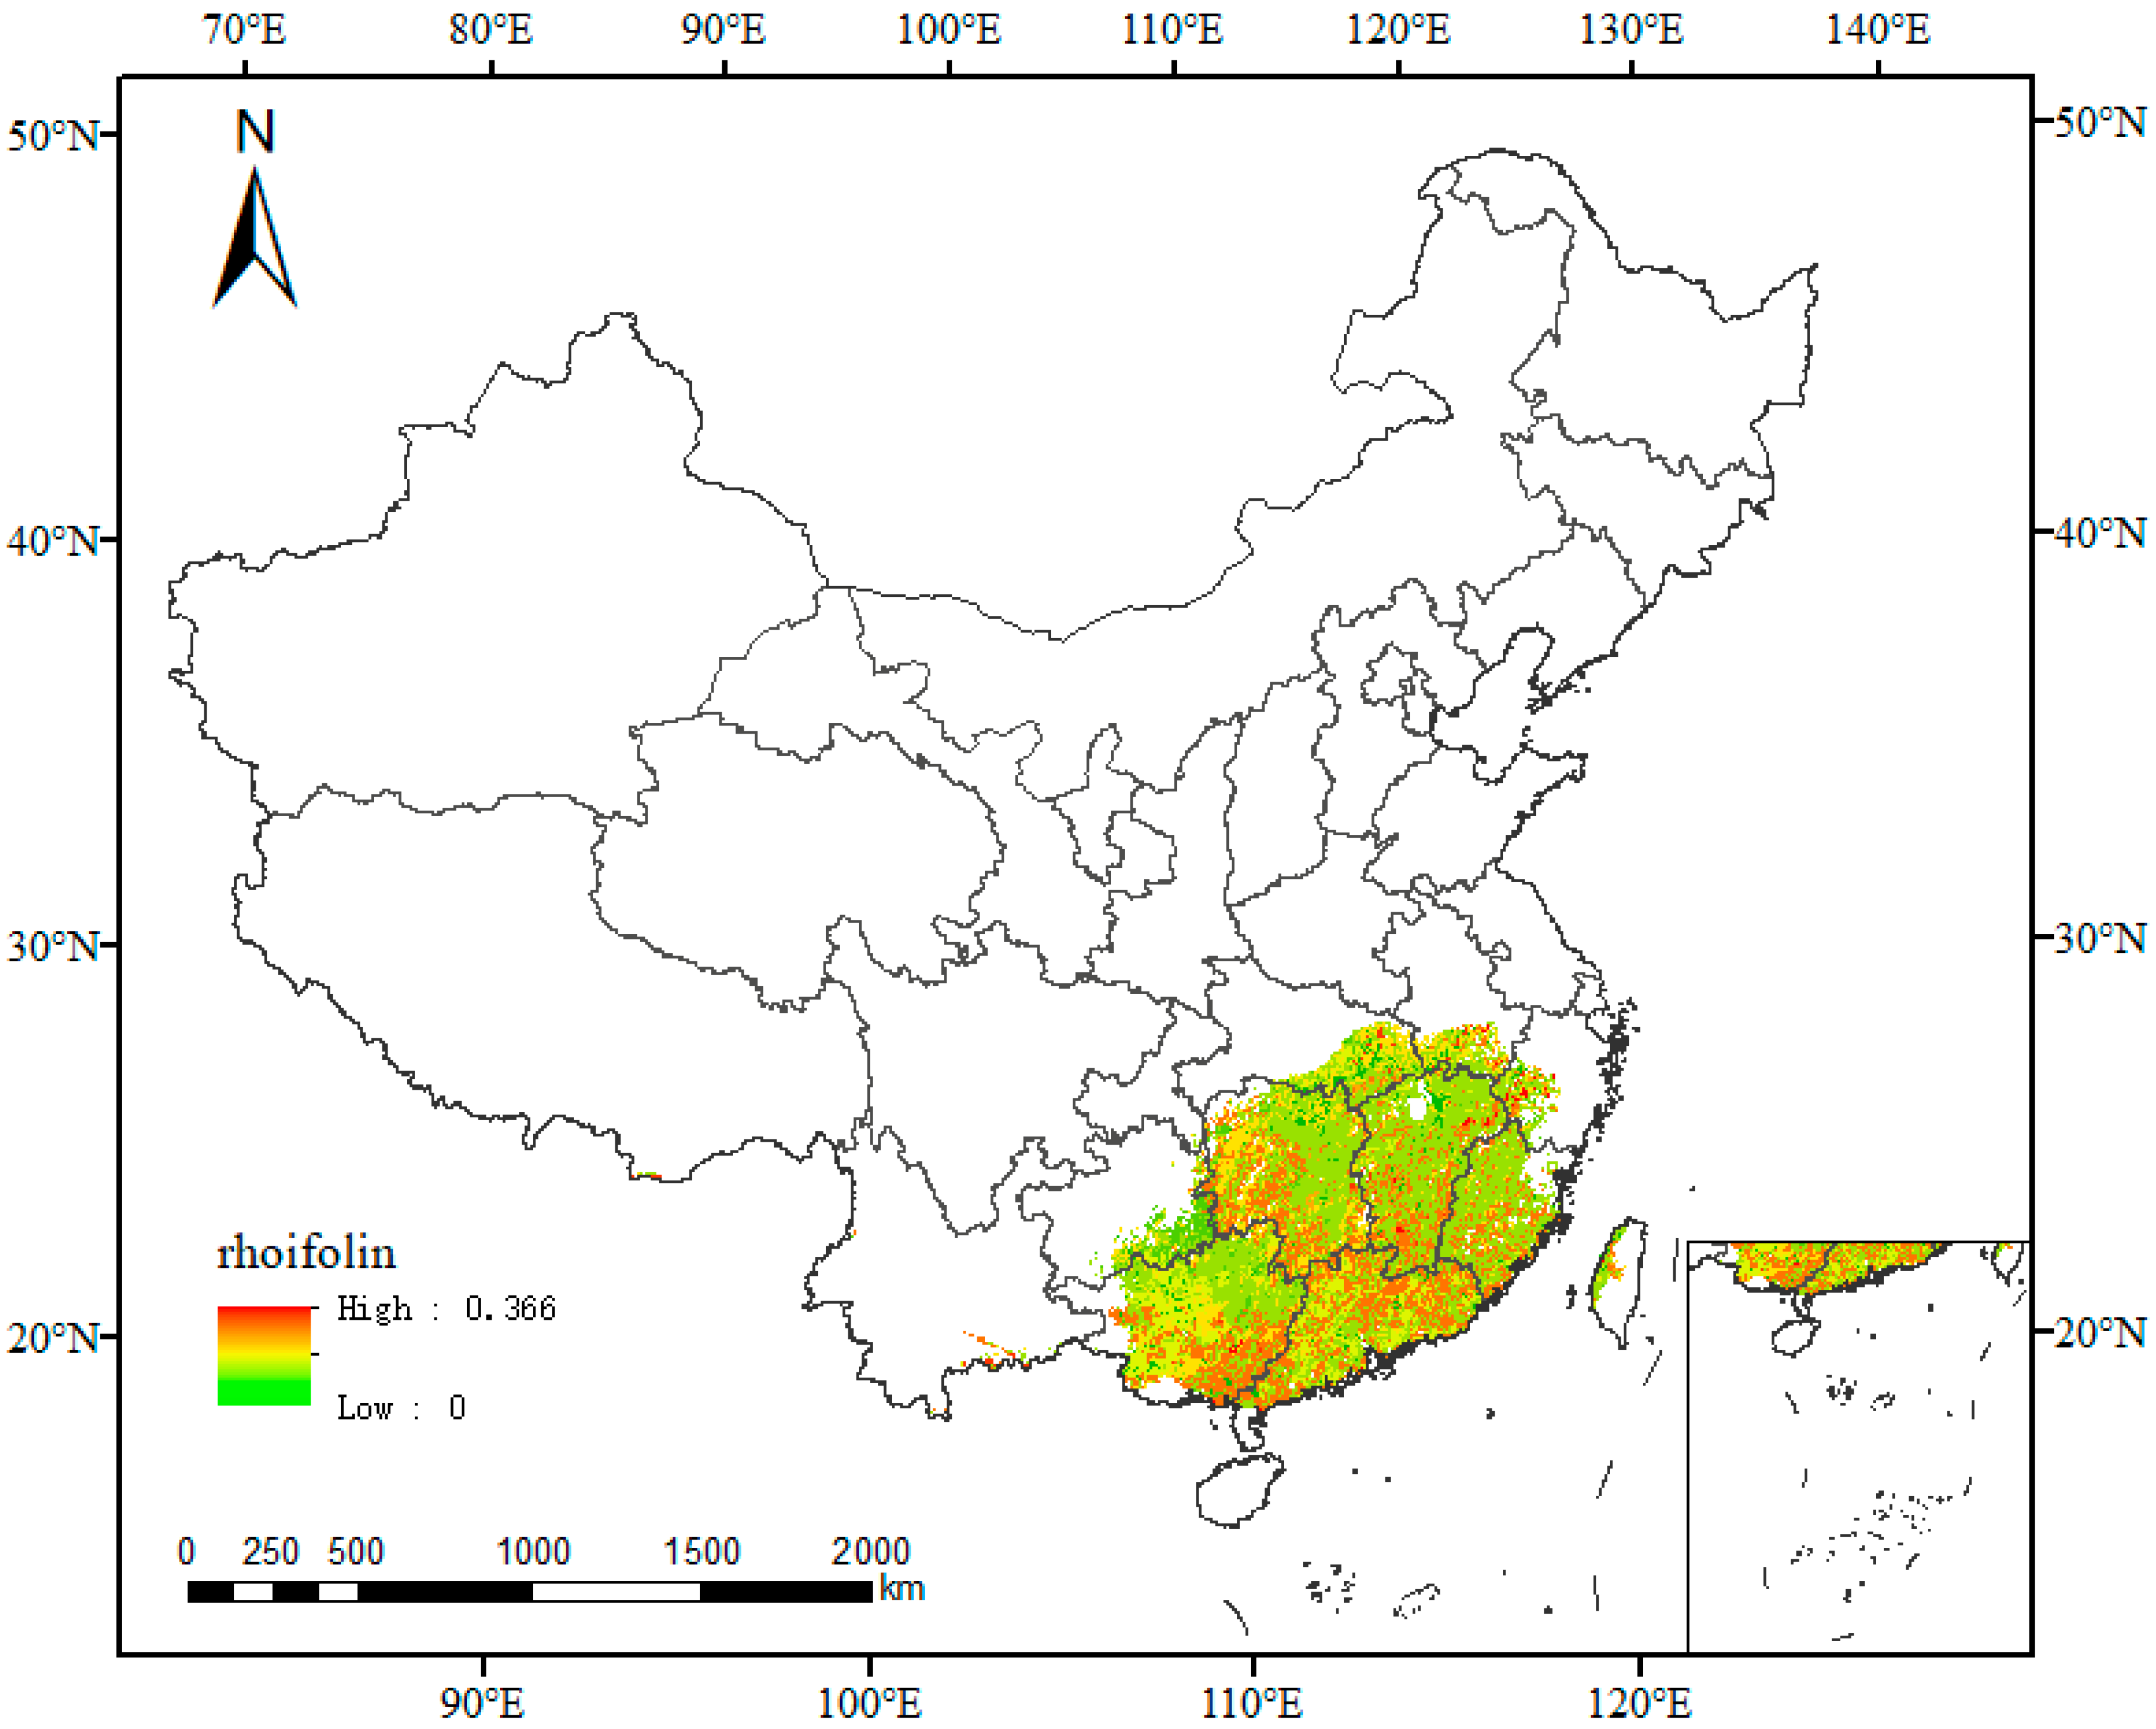
Using the spatial analysis function in ArcGIS v.10.7, the distributions of the two indicator components were estimated and mapped (
Figure 10 and
Figure 11). As shown in the figure, both ligustroflavone and rhoifolin contents were relatively high in the suitable regions. The content of rhoifolin showed no clear spatial pattern, whereas ligustroflavone was higher in Jiangxi Province.
4. Discussion
4.1. Model Accuracy
This study represents the first application of the MaxEnt model to assess the potentially suitable areas of
T. arguta under global climate change conditions. The MaxEnt model can avoid misjudgment or misinterpretation in species distribution predictions [
28]. Widely used in research such as early warning of invasion risk for alien species and prediction of suitable areas, this model has been applied to species including
Leonurus japonicus Houtt. [
26],
Parnassia wightiana Wall. ex Wight & Arn. [
50],
Zanthoxylum bungeanum Maxim. [
24], and
Solanum muricatum [
49]. In this work, we optimized MaxEnt model parameters using R by constructing 1240 candidate models with diverse parameter combinations and conducting systematic performance evaluations, ultimately selecting the optimal model. The final model demonstrated very high accuracy and strong generalization ability, with an average AUC of 0.974 (high predictive accuracy), omission rate of 0.061 (strong generalization), and TSS of 0.8346 (excellent discrimination), further validated by an average CBI of 0.8574 (excellent suitability-distribution match) and Smoothed Boyce Index of 0.6793 (good correlation), collectively indicating excellent reliability and stability for
T. arguta distribution prediction.
4.2. Current Suitable Area Analysis
Under current conditions, the highly suitable areas for T. arguta are primarily distributed across most regions of central and southern Jiangxi Province, the main range of Guangdong Province (excluding a few southern areas), northwestern to central Guangxi Zhuang Autonomous Region, western Fujian Province, and southern Hunan Province. This distribution pattern is highly consistent with the actual range recorded in the Flora of China, further validating the reliability and accuracy of the prediction model used in this study. Among all environmental variables, the distribution of T. arguta is primarily influenced by precipitation and temperature. Its optimal growing environment requires: annual precipitation of 1500–2000 mm (peak value: 1750 mm), precipitation in the warmest quarter of 600–900 mm, precipitation in April of 175–250 mm, and precipitation in September of 100–160 mm. It also requires an annual mean temperature of 20–30 °C (optimal range > 22.5 °C) and average temperature in September > 26 °C (optimal range: 28–32 °C). These findings indicate that T. arguta is a “moderate precipitation–high temperature” species, struggling to survive under conditions of excessive or insufficient precipitation and low temperatures. This provides critical site-selection criteria for resource conservation and the artificial cultivation of the species.
4.3. Changes in Suitable Habitats
Under future climate scenarios, the total suitable area of T. arguta is projected to contract by varying degrees compared to the current baseline, indicating that future climate change poses widespread threats to the species’ survival. This finding is crucial for decision-makers to understand the potential impacts of climate change on the distribution of T. arguta in China. In the high-emission scenario (SSP585), the total suitable area is projected to decrease by 61.30% by the 2090s, while the high-suitability zone is projected to decline by 98.83%—indicating an elevated risk of species extinction. In contrast, the SSP126 scenario forecasts more moderate reductions of 15.02% and 65.50% in total and high-suitability areas, respectively. These findings highlight that while greenhouse gas mitigation efforts are vital, they may not fully offset habitat loss amplified by climate variability, underscoring the urgent need for comprehensive conservation strategies.
The centroid of suitable habitats for
T. arguta generally shifts northward under the SSP126 and SSP245 scenarios by the 2090s. This shift is likely driven by climate warming, which pushes the species to seek cooler habitats at higher latitudes [
51]. Conversely, under the SSP585 scenario, centroid shifts become irregular and frequent, reflecting heightened climatic instability. This demonstrates that emission intensity critically shapes migration dynamics: lower emissions yield predictable, medium-scale range shifts, whereas higher emissions increase spatial uncertainty. To mitigate climate-driven habitat fragmentation, we recommend establishing nature reserves in key high-suitability areas—including central and southern Jiangxi, major parts of Guangdong, northwestern to central Guangxi, western Fujian, and southern Hunan—to effectively conserve
T. arguta under changing climatic conditions. The findings provide a critical reference for the synergistic conservation of “climate-biodiversity” in medicinal plant resources, particularly highlighting the urgency of prioritizing the protection of current high suitability zones under the SSP585 scenario.
4.4. Quality Zonation Analysis
Results from the quality suitability zoning analysis indicated that the national distribution of ligustroflavone and rhoifolin is significantly influenced by two key environmental variables: mean diurnal temperature range (bio2) and soil sand content (trhsl). The content of ligustroflavone is positively correlated with the mean diurnal temperature range. This relationship may arise because a larger diurnal temperature range enhances the conversion of photosynthetic products to secondary metabolites, thereby increasing flavonoid glycoside content. Similar findings have also been reported in the other literature. For example, Liu (2019) found that greater diurnal temperature fluctuations elevate starch, total phenol, and total flavonoid contents in Astragalus membranaceus and Codonopsis pilosula [
52]; Xu (2020) similarly reported that chlorogenic acid (CA) and senkyunolide I (SI) contents are positively correlated with the monthly mean diurnal temperature range [
30]. In addition, the content of rhoifolin is positively correlated with soil sand content. This association may be linked to moderate soil sand content, which promotes flavonoid glycoside accumulation under drought stress. For instance, Su (2012) observed that increased soil sand content induces drought stress in Sedum lineare [
53]; Sun (2023) further demonstrated that soil sand content is significantly positively correlated with apigenin, isoorientin, and other flavonoid compounds [
54]. The content of ligustroflavone and rhoifolin in
T. arguta leaves varied across habitats. While these differences may be influenced by temperature, precipitation, and soil nutrients, further controlled experiments are needed to confirm causal relationships.
4.5. Limitations and Prospects
The main limitations of this study are summarized as follows: First, climate projections inherently carry uncertainties because they are based on climate models and future emission scenarios. These uncertainties arise from model differences, assumption biases, parameter errors, and natural variability, making it difficult to fully capture real climate evolution. Second, this study used the BCC-CSM2-MR Model to predict suitable growth areas of T. arguta. While it performs well for China’s climate, the model has limitations. One future research direction is to incorporate multiple GCMs to reduce potential errors. Third, although assuming static soil and topographic data over the 100-year projection period is a common practice in similar studies, this approach has limitations. It overlooks changes caused by land-use alterations and natural processes—such as soil erosion, landslides, and sea-level rise—that can significantly affect soil characteristics and terrain features. Fourth, this study did not incorporate land-use/cover change data, which may influence model accuracy in areas undergoing rapid human modification. Future research should integrate spatially explicit land-use scenarios to provide more realistic habitat projections under combined climate and land-use pressures. Additionally, this study focused on climate, soil, topography, and vegetation type variables but did not consider other factors like species interactions and human activities. Including these could improve model accuracy and better reflect ecosystem complexity. Furthermore, assuming unlimited dispersal ignores real barriers, likely overestimates species occupancy, underestimates extinction risks, and represents an upper bound rather than precise distribution predictions. In addition, we acknowledge that sampling biases in GBIF records, which are concentrated in accessible or well-studied areas, may cause models to overestimate suitability there and underestimate it in under-sampled regions, affecting projection accuracy. Finally, in the quality–suitability zoning, there is a potential risk of overfitting due to the limited sample size. Although the samples were collected under practical conditions and are representative, increasing the sample size would improve data diversity and better capture the spatial relationships between environmental factors and quality, enhancing the accuracy and practical value of the zoning. In future research, we will address these shortcomings to gain a more comprehensive understanding of the impacts of climate change on the suitable areas of T. arguta and the relationships between environmental factors and quality. This will support more informed decision-making in TCM resource management and ecosystem conservation.
This study provides critical insights into the potential distribution of T. arguta under climate change, fills a key knowledge gap in research on suitable habitat prediction, conducts quality analysis, and offers scientific support for the planning of traditional Chinese medicine (TCM) cultivation.