Article

Change in Potential Suitable Areas and Carbon Sequestration Potential of Robinia pseudoacacia Plantations in the “Ω”-Shaped Bend of the Yellow River Under Climate Change

1
College of Environmental Science and Engineering, Liaoning Technical University, Fuxin 123000, China
2
Inner Mongolia Research Institute of China, University of Mining and Technology (Beijing), Ordos 017000, China
3
Inner Mongolia Shendong Tianlong Group Co., Ltd., Ordos 017000, China
*
Author to whom correspondence should be addressed.
Forests 2026, 17(3), 317; https://doi.org/10.3390/f17030317
Submission received: 7 January 2026 / Revised: 17 February 2026 / Accepted: 18 February 2026 / Published: 3 March 2026

Abstract

Robinia pseudoacacia is a major tree species for soil and water conservation afforestation in the “Three-North” Region, with crucial ecological improvement and carbon sequestration functions. This study aimed to investigate the dynamics of suitable areas and carbon storage of R. pseudoacacia plantations under different future climate scenarios, further reveal the changing trend of their carbon sequestration potential, and provide a scientific basis for the rational layout and sustainable management of R. pseudoacacia plantations in the “Ω”-shaped bend of the Yellow River. Based on the MaxEnt model, we predicted the potential suitable distribution of R. pseudoacacia under future climate change scenarios, identified the potentially threatened geographical distribution regions and area changes in R. pseudoacacia, and clarified the limiting factors affecting the potential geographical distribution of R. pseudoacacia plantations by analyzing the contribution rates and permutation importance of comprehensive environmental variables. Combined with the InVEST model, we estimated and analyzed the spatial distribution of carbon storage in R. pseudoacacia plantations in the 2090s. The results showed that the minimum temperature of the coldest month was the main environmental factor affecting the distribution of potential suitable areas of R. pseudoacacia plantations, with a contribution rate of 46.98%, followed by annual precipitation. Under current climatic conditions, the potential suitable areas of R. pseudoacacia plantations were mainly distributed in the Loess Plateau, Hetao Plain, Ordos Plateau, Kubuqi Desert, and northern Mu Us Sandy Land. The highly suitable areas were mainly concentrated in the south-central part of the Loess Plateau, accounting for approximately 22.81% of the total area of the “Ω”-shaped bend of the Yellow River. Under future climate change, the moderately and highly suitable areas tended to shift northwestward. Under the four future climate scenarios, the carbon storage and carbon density of R. pseudoacacia plantations showed a trend of first increasing and then decreasing; by 2100, the carbon storage reached the maximum under the SSP370 scenario, and the areas with medium-to-high carbon storage first expanded and then contracted, mainly concentrated in the Ordos Plateau and Loess Plateau.

1. Introduction

Against the backdrop of ongoing global warming, forest ecosystems play an increasingly critical role in maintaining carbon cycle stability and mitigating the greenhouse effect [1]. Estimating forest carbon storage and carbon sink potential has become a cornerstone of global forest carbon sink research [2]. Current studies have demonstrated that climatic conditions are key determinants of species distribution and vegetation patterns, regulating the dynamic processes of vegetation carbon sequestration [3]. Although the area of natural forests in China is approximately four times that of artificial plantations—with both showing an overall upward trend in carbon storage—the overall carbon sequestration capacity of artificial plantations has now approached that of natural forests [4]. With increasing stand age and continuous improvements in management practices, the carbon storage of artificial plantations tends to increase, and their carbon sink function will be further enhanced.
Accurate assessment of forest carbon storage is an important part of global change research, mainly including plot survey methods, remote sensing estimation, and model simulation. Among these, plot inventory methods include the biomass method [5], volume method [6], micro-meteorological method [7], and biomass expansion factor method based on volume and biomass methods [8]. In practical application, different methods exhibit obvious scale dependence: plot inventory methods can accurately characterize the spatial pattern of carbon storage at the local scale through direct measurement of components such as biomass carbon and soil carbon in specific stands [9]; remote sensing estimation realizes carbon storage calculation from regional to global scales by extracting structural parameters such as forest coverage and canopy height [10,11]; in addition, many studies use survey data combined with carbon processes to estimate forest ecosystem carbon storage [12]. Such studies can dynamically estimate forest ecosystem carbon processes and carbon storage from a mechanistic perspective, but rough estimates based on empirical averages and conversion coefficients have large differences and unreliability. Meanwhile, species diversity, tree density, stand age, and disturbance levels all greatly affect the distribution pattern of forest carbon storage components [13], which will further hinder the estimation of forest carbon storage [14]. The InVEST model has the characteristics of convenient data acquisition, high quantitative estimation performance, clear visualization of prediction processes and results, and strong simulation capabilities [15,16]. The model aims to simulate and predict changes in carbon storage under different land use scenarios, realizing the spatialization of quantitative assessment of ecosystem service function values. It has been widely used in ecosystem carbon storage estimation and ecosystem service value assessment [17,18,19,20]. Currently, most studies based on the InVEST model focus on spatiotemporal evolution and habitat research: Deng et al. [21] analyzed the spatiotemporal evolution of water conservation and soil conservation functions in regional river basins; Zhang et al. [22] predicted landscape ecological risks and habitat quality in the Yellow River Basin; Ma et al. [23] simulated multi-scenario land use changes and assessed carbon storage on the southern bank of Dianchi Lake based on the PLUS-InVEST model. The MaxEnt model is a species distribution model developed based on the principle of maximum entropy, which can estimate the distribution probability of species according to different environmental constraints. Due to its solid theoretical foundation, robust predictive performance, and easy interpretation in ecological significance, this model has been widely applied and validated in ecology, bio-geography, and related fields [24].
R. pseudoacacia has a strong carbon sequestration capacity and significant ecological protection functions, making it an important tree species in China’s artificial plantation system. Native to North America, this species was introduced to Qingdao in the early 20th century and has since been widely planted in many parts of China, especially in the Loess Plateau ecological restoration projects, playing an important role in enhancing regional carbon sink capacity [25]. However, under the combined impacts of climate change and irrational human interference, inappropriate afforestation planning in some regions has led to imbalanced stand structures of R. pseudoacacia plantations, degraded ecosystem functions, and widespread phenomena such as dieback and even contiguous mortality [26]. Over the years, scholars have conducted in-depth research on R. pseudoacacia plantations, covering aspects such as soil and water conservation benefits, community structure characteristics, environmental impact mechanisms, and biomass and carbon storage estimation of existing stands [27,28]. However, there is still a lack of systematic research and predictions on how climate change affects the distribution of potential suitable areas and the dynamics of carbon storage of R. pseudoacacia plantations. Therefore, based on the climate data of four typical concentration pathway scenarios from the CMIP6 project, this study combined the MaxEnt model and the InVEST model to simulate the changing trends of suitable areas of R. pseudoacacia plantations under current and future conditions, identify the main environmental factors limiting their distribution, and analyze the changes in carbon storage and carbon sequestration potential of R. pseudoacacia plantations in the “Ω”-shaped bend of the Yellow River, aiming to provide theoretical reference for the spatial layout optimization and sustainable management of regional plantations.

2. Theoretical Framework

Based on ecological theories, this study systematically elaborates on the responses of potential suitable areas and carbon storage of R. pseudoacacia plantations to climate change. The theories run through the entire research process, including the formulation of research hypotheses, model construction, result analysis, and strategy development.
Firstly, the research on species distribution niche theory is based on the Grinnellian niche concept [29,30,31], which posits that the geographical distribution of species is mainly limited by large-scale abiotic conditions such as climate [32,33]. This theory supports the application of species distribution models. In this study, environmental factors such as climate, soil, geography, and drought were selected to predict the current distribution of R. pseudoacacia plantations, and the environmental factors limiting their distribution were screened through quantitative analysis. The future potential suitable area distribution can be predicted based on environmental factors and known geographical locations of the species.
Secondly, forest ecosystems play a key role in regulating climate by storing and sequestering greenhouse gases such as carbon dioxide (CO2) in the atmosphere [34]. The core of the InVEST model is to map carbon storage based on LULC data. Each LULC type corresponds to carbon densities in four carbon pools. Based on data on above-ground biomass, below-ground biomass, soil, and dead organic matter carbon densities, the model calculates carbon storage values in current and future LULC scenarios to quantify the carbon storage of species in the future, and the generated image output shows the carbon storage per pixel [35,36,37]. In this study, LULC data under future climate change were obtained using the MaxEnt model, and combined with carbon density data of four main carbon pools to predict the changing trend of carbon sequestration potential of R. pseudoacacia plantations under future climate and estimate their carbon storage.
Finally, this study adopts the “driver-response” model of climate impact [38], which assumes that the predicted changes in macro-environmental driver factors directly trigger spatial responses in species suitability distribution. This causal framework constructs our entire analytical method, from model prediction to the assessment of range changes, suitability, and carbon sequestration capacity.
Overall, these theories shape our central hypothesis: future climate change will become the main environmental driving factor, causing the distribution of R. pseudoacacia plantations to exceed their current climate tolerance limits, thereby leading to the shift in their suitable areas and changes in carbon storage and carbon sequestration potential.

3. Materials and Methods

3.1. Study Area Overview

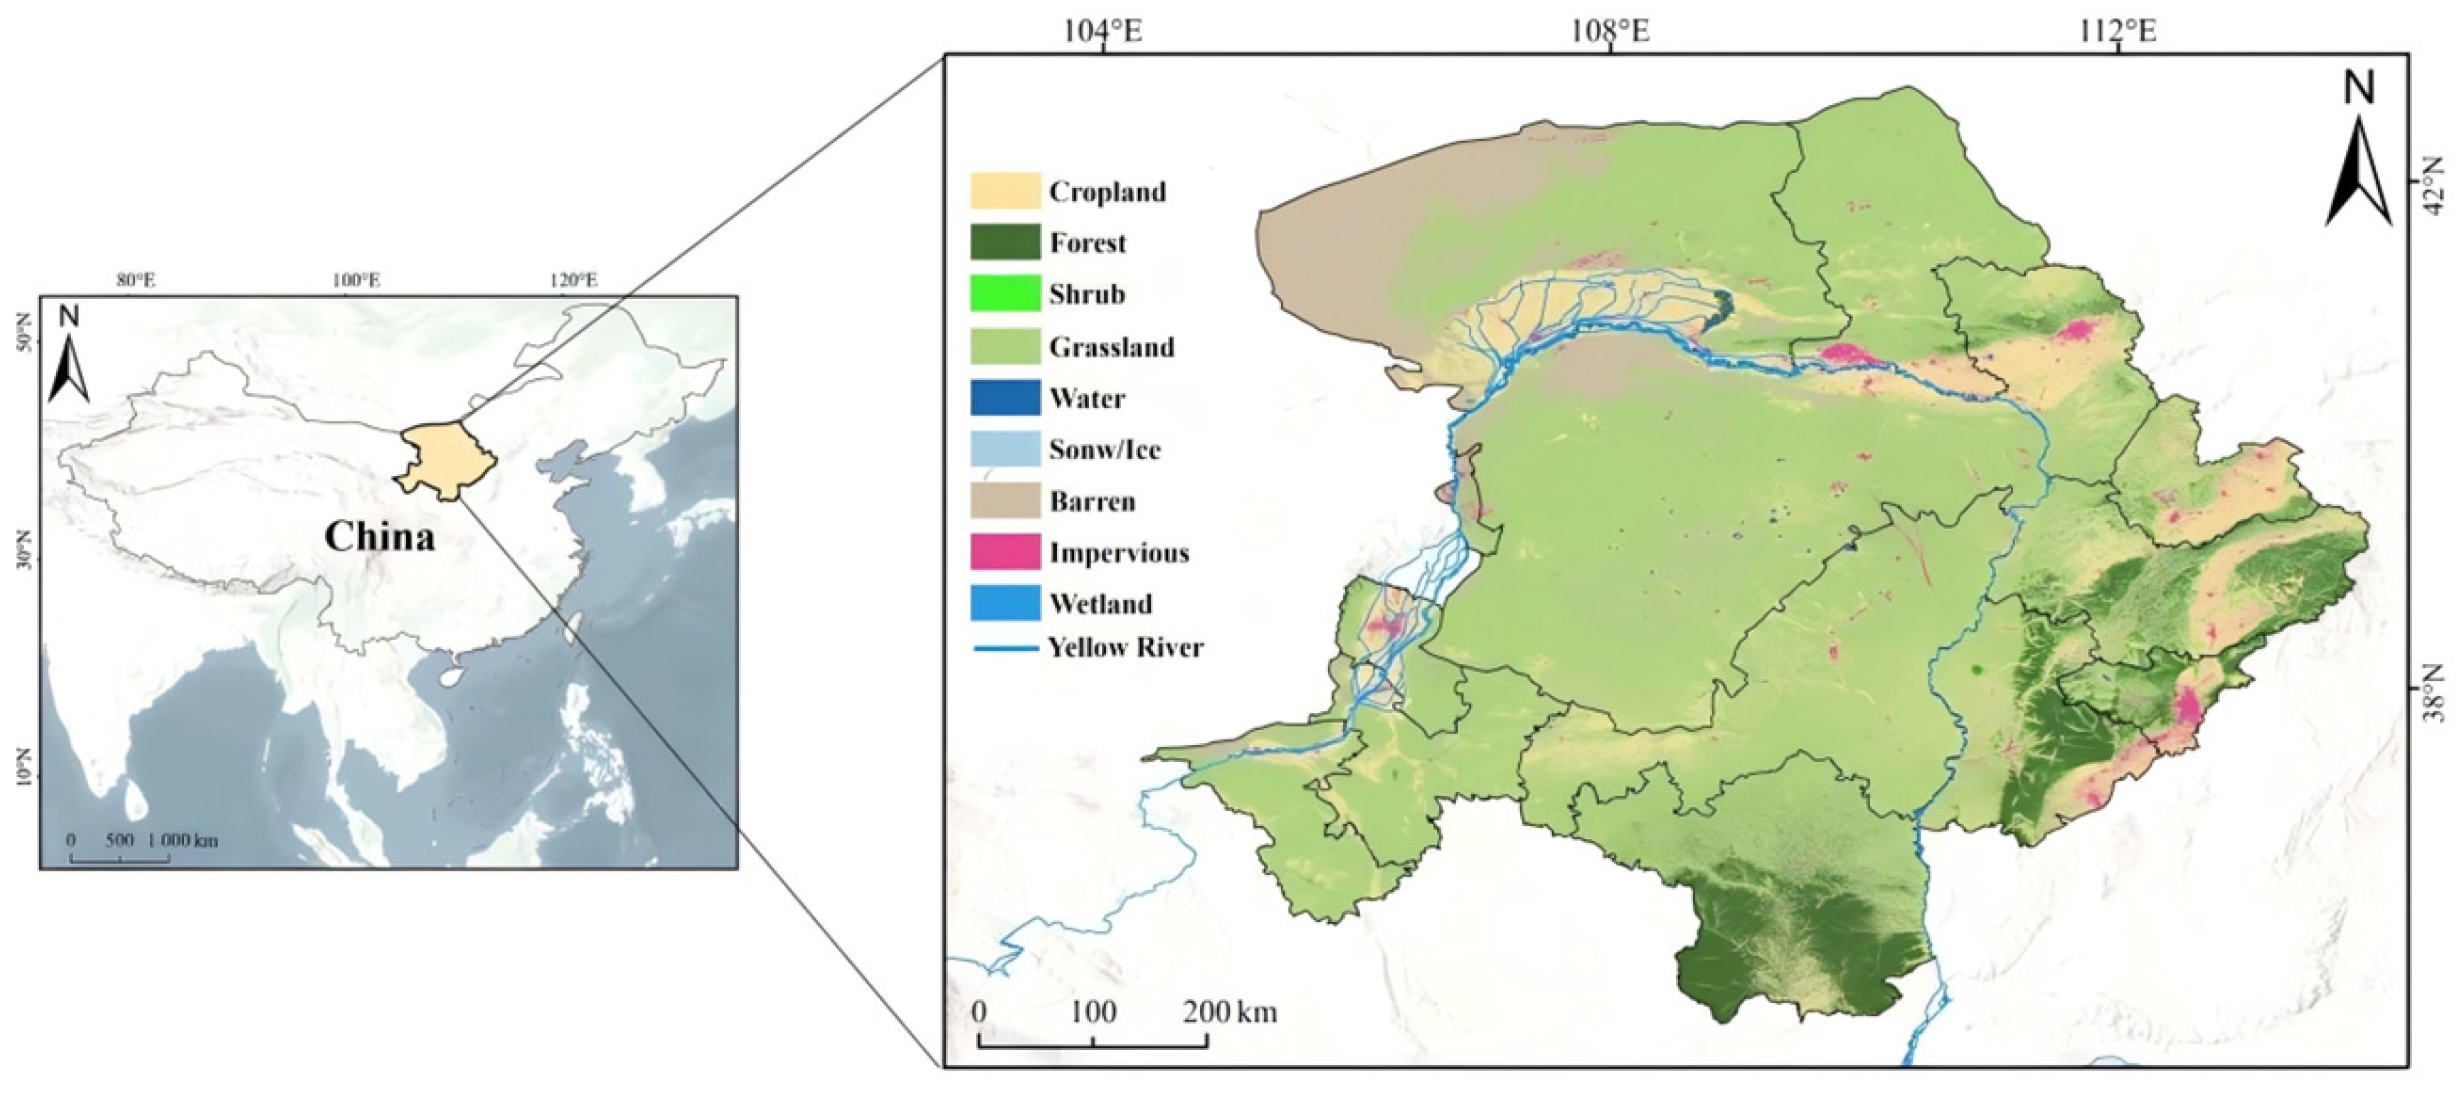
The study area is the “Ω”-shaped bend of the Yellow River (Figure 1). It is located in the core section of the Yellow River Basin, with boundaries defined according to the characteristics of the river basin’s water system. Covering a total area of 386,000 km2, the study area stretches south to the Baiyu Mountains on the northern edge of the Loess Plateau, extends westward to the Helan Mountain-Liupan Mountain ecological barrier, borders the Yinshan steppe-desert zone to the north, and reaches the Guancen Mountain branch of the northern Lüliang Mountains to the east. Situated at the transition zone between three major ecological units—the Qinghai–Tibet Plateau alpine region, the Loess Hilly Region, and the Inner Mongolia Plateau grassland region—the area has an altitude ranging from 307 to 3547 m. It is predominantly characterized by an arid to semi-arid climate, with an average annual temperature of 5.5–8.7 °C, annual precipitation of 170–490 mm, over 10 sandstorm days per year, and more than 20 blowing sand days annually. In terms of geo-morphological composition, the region has three typical characteristics: firstly, it is one of the world’s most intact continuous loess accumulation zones, with loess covering an area of approximately 270,000 km2 and a typical thickness of 100–200 m, forming classic land-forms such as tablelands (yuan), ridges (liang), and mounds (mao); secondly, it encompasses the entire Kubuqi Desert and Mu Us Sandy Land, as well as parts of the Ulan Buh Desert and Tengger Desert, thus serving as a key control area for wind-sand activities and land desertification in the Yellow River Basin; as a core zone for ecological protection and high-quality development of the Yellow River Basin, it acts as a strategic region for the construction of the “Three-North” Shelterbelt System and an important part of the Beijing-Tianjin Sand Source Control Area [39].

3.2. Species Distribution Data

Distribution data for R. pseudoacacia plantations were primarily sourced from the Global Biodiversity Information Facility (GBIF Occurrence Download. Available online: https://www.gbif.org/citation-guidelines (accessed on 18 October 2025), the Chinese Virtual Herbarium (CVH, http://www.cvh.ac.cn/), and the National Specimen Information Infrastructure (NSII, http://www.nsii.org.cn/2017/home.php, accessed on 22 October 2025), spanning the period 1970–2024. We used ENMTools software 1.1.4 to filter the distribution data, setting a spatial deduplication threshold of 1 km—meaning only one occurrence record is retained per 1 km × 1 km grid—to minimize the impact of spatial auto-correlation on model predictions [34]. Additionally, redundant records with adjacent occurrence points <5 km apart were excluded to ensure spatially balanced sampling. Ultimately, 358 valid distribution records were refined and used for analyzing the geographical distribution of R. pseudoacacia plantations.

3.3. Environmental Factors

To comprehensively characterize the relationship between the distribution of R. pseudoacacia suitable areas and environmental conditions, eight sets of variables were selected for model implementation: climatic factors, topographic factors, soil factors, drought factors, surface solar radiation, vegetation types, the Normalized Difference Vegetation Index, and human footprint (Table 1), with a spatial resolution of 30 arc-seconds. Both current and future climate data (2010s–2090s) were downloaded from WorldClim (http://www.worldclim.org (accessed on 18 October 2025)). Future climate projections were derived from the Beijing Climate Center Climate System Model (BCC-CSM2-MR) as part of CMIP6 (accessed on 18 October 2025), encompassing four SSP scenarios: SSP126, SSP245, SSP370, and SSP585. These scenarios are defined as follows [35]: SSP126: A sustainable development pathway limiting warming to ≤2 °C, reflecting the combined effects of low vulnerability, low mitigation pressure, and low radiative forcing; SSP245: A moderate development pathway capping warming at ≤3 °C, corresponding to a combination of medium social vulnerability and medium radiative forcing; SSP370: A regional development pathway restricting warming to ≤4.1 °C, characterized by high social vulnerability and relatively high anthropogenic radiative forcing; SSP585: A conventional development pathway with warming limited to ≤5 °C, representing a high-forcing scenario. Slope and aspect data were extracted using ArcGIS spatial analysis tools. Soil factor data were obtained from the National Cryosphere Desert Data Center (NCDC, http://www.ncdc.ac.cn (accessed on 18 October 2025)). Surface solar radiation data were retrieved from the National Tibetan Plateau Data Center (https://data.tpdc.ac.cn/login (accessed on 18 October 2025)). Vegetation type and NDVI data were acquired from the Resource and Environmental Science Data Center (https://www.resdc.cn/Default.aspx (accessed on 18 October 2025)). The human footprint data layer—indicating human activity intensity—was sourced from the Center for International Earth Science Information Network (CIESIN, http://cesin.org (accessed on 18 October 2025)). Basemap data for the “Ω”-shaped bend of the Yellow River were downloaded from the National Catalog Service for Geographic Information (www.webmap.cn (accessed on 18 October 2025)).

3.4. MaxEnt Model Construction and Evaluation

3.4.1. Environmental Factor Selection

Environmental factors constraining the spatial distribution of R. pseudoacacia were comprehensively assessed using contribution rates and permutation importance from the MaxEnt model, with subsequent factor selection integrated with multicollinearity tests [38]. As presented in Table 2, the cumulative contribution rate of nine key factors exceeded 98.0%, namely minimum temperature of the coldest month (bio6), annual precipitation (bio12), elevation (elev), temperature seasonality (bio4), surface soil base saturation (t-bs), surface solar radiation (srad), surface soil organic carbon density (t-oc), soil reference depth (ref_depth), and soil drainage class (t-drainage). For model development, soil factors were treated as static parameters and combined with climatic factors to construct models for future climate scenarios.

3.4.2. MaxEnt Model Operation and Evaluation

The Maximum Entropy modeling algorithm (MaxEnt, version 3.4.4) was selected for this study due to its proven efficacy with presence-only species occurrence data [40]. The processed distribution and environmental datasets were imported into MaxEnt software, with response curves generated for model calibration. Specifically, 75% of the occurrence points were designated as the training data set, and the remaining 25% as the random test subset; the “Random seed” option was enabled, and the number of replicates was set to 10; in the advanced settings panel, the “Write plot data” option was checked to facilitate subsequent mapping and statistical analysis, while all other parameters were retained at their default values for model execution. The jackknife test was employed to quantify the relative importance of each environmental variable to the model [41]. The predictive accuracy of the model was evaluated using the Area Under the Receiver Operating Characteristic Curve and the True Skill Statistic [42]. AUC values range from 0 to 1, with established performance thresholds: 0.5–0.6 (failed), 0.6–0.7 (poor), 0.7–0.8 (moderate), 0.8–0.9 (good), and 0.9–1.0 (excellent); the closer the value is to 1, the higher the predictive accuracy of the model. TSS ranges from −1 to +1, with values exceeding 0.8 indicating excellent performance [43].
Ecological suitability zoning maps for R. pseudoacacia plantations were derived from the MaxEnt modeling outputs. Using the Jenks Natural Breaks Classification Method in ArcGIS 10.8, suitability values were categorized into four levels: Level I (0%–20%) as unsuitable areas, Level II (20%–40%) as low-suitability areas, Level III (40%–60%) as moderate-suitability areas, and Level IV (60%–100%) as high-suitability areas. The area of each suitability zone was calculated using the reclassification and feature-to-polygon tools in ArcGIS 10.8.

3.5. InVEST Model

Carbon Storage Estimation Using the InVEST Model

Carbon storage is largely determined by four carbon pools: above-ground biomass, below-ground biomass, soil organic matter, and dead organic matter [44]. The InVEST Carbon Storage and Sequestration Model aggregates carbon stocks within these pools based on LULC maps and classifications. Above-ground biomass encompasses all active above-soil plant components, such as bark, trunks, branches and leaves, while below-ground biomass refers to the living root systems of above-ground vegetation. Soil organic matter, the organic component of soil, constitutes the largest terrestrial carbon pool. Dead organic matter includes surface litter, as well as downed and standing deadwood. By integrating LULC classification maps with the carbon storage capacity of each pool, the model quantifies the net carbon storage over time within the study region and the market value of carbon sequestered in residual stocks. The formulas for calculating carbon storage are as follows:
C i = C a b o v e + C b e l o w + C s o i l + C d e a d
where i represents land use/cover type; C i represents total carbon density per unit area of the i-th land use/cover type (t·hm−2);   C a b o v e represents above-ground carbon density (t·hm−2); C b e l o w represents belowground carbon density (t·hm−2); C s o i l represents soil organic carbon density (t·hm−2); C d e a d represents dead organic matter carbon density (t·hm−2).
C total = Σ i n ( C i × A i )
where C total represents the total carbon storage in the study region; n represents the total number of land use/cover types; A i represents the area of the i-th land use/cover type.
C - = C total A total
where C - represents average carbon density; C total represents total carbon storage in the study region; A total represents the total area of all land use/cover types in the study region. The carbon density database was developed using published literature. Keyword searches for “carbon storage” and “carbon density” were performed in the Web of Science and China National Knowledge Infrastructure databases, respectively, with only field survey-derived data included to ensure reliability. The above-ground, below-ground, soil, and dead organic matter carbon densities in the “Ω”-shaped bend of the Yellow River were calculated using established quantitative statistical relationships [45] between above-ground and below-ground carbon storage, as presented in Table 3.

4. Results and Analysis

4.1. Model Accuracy Evaluation

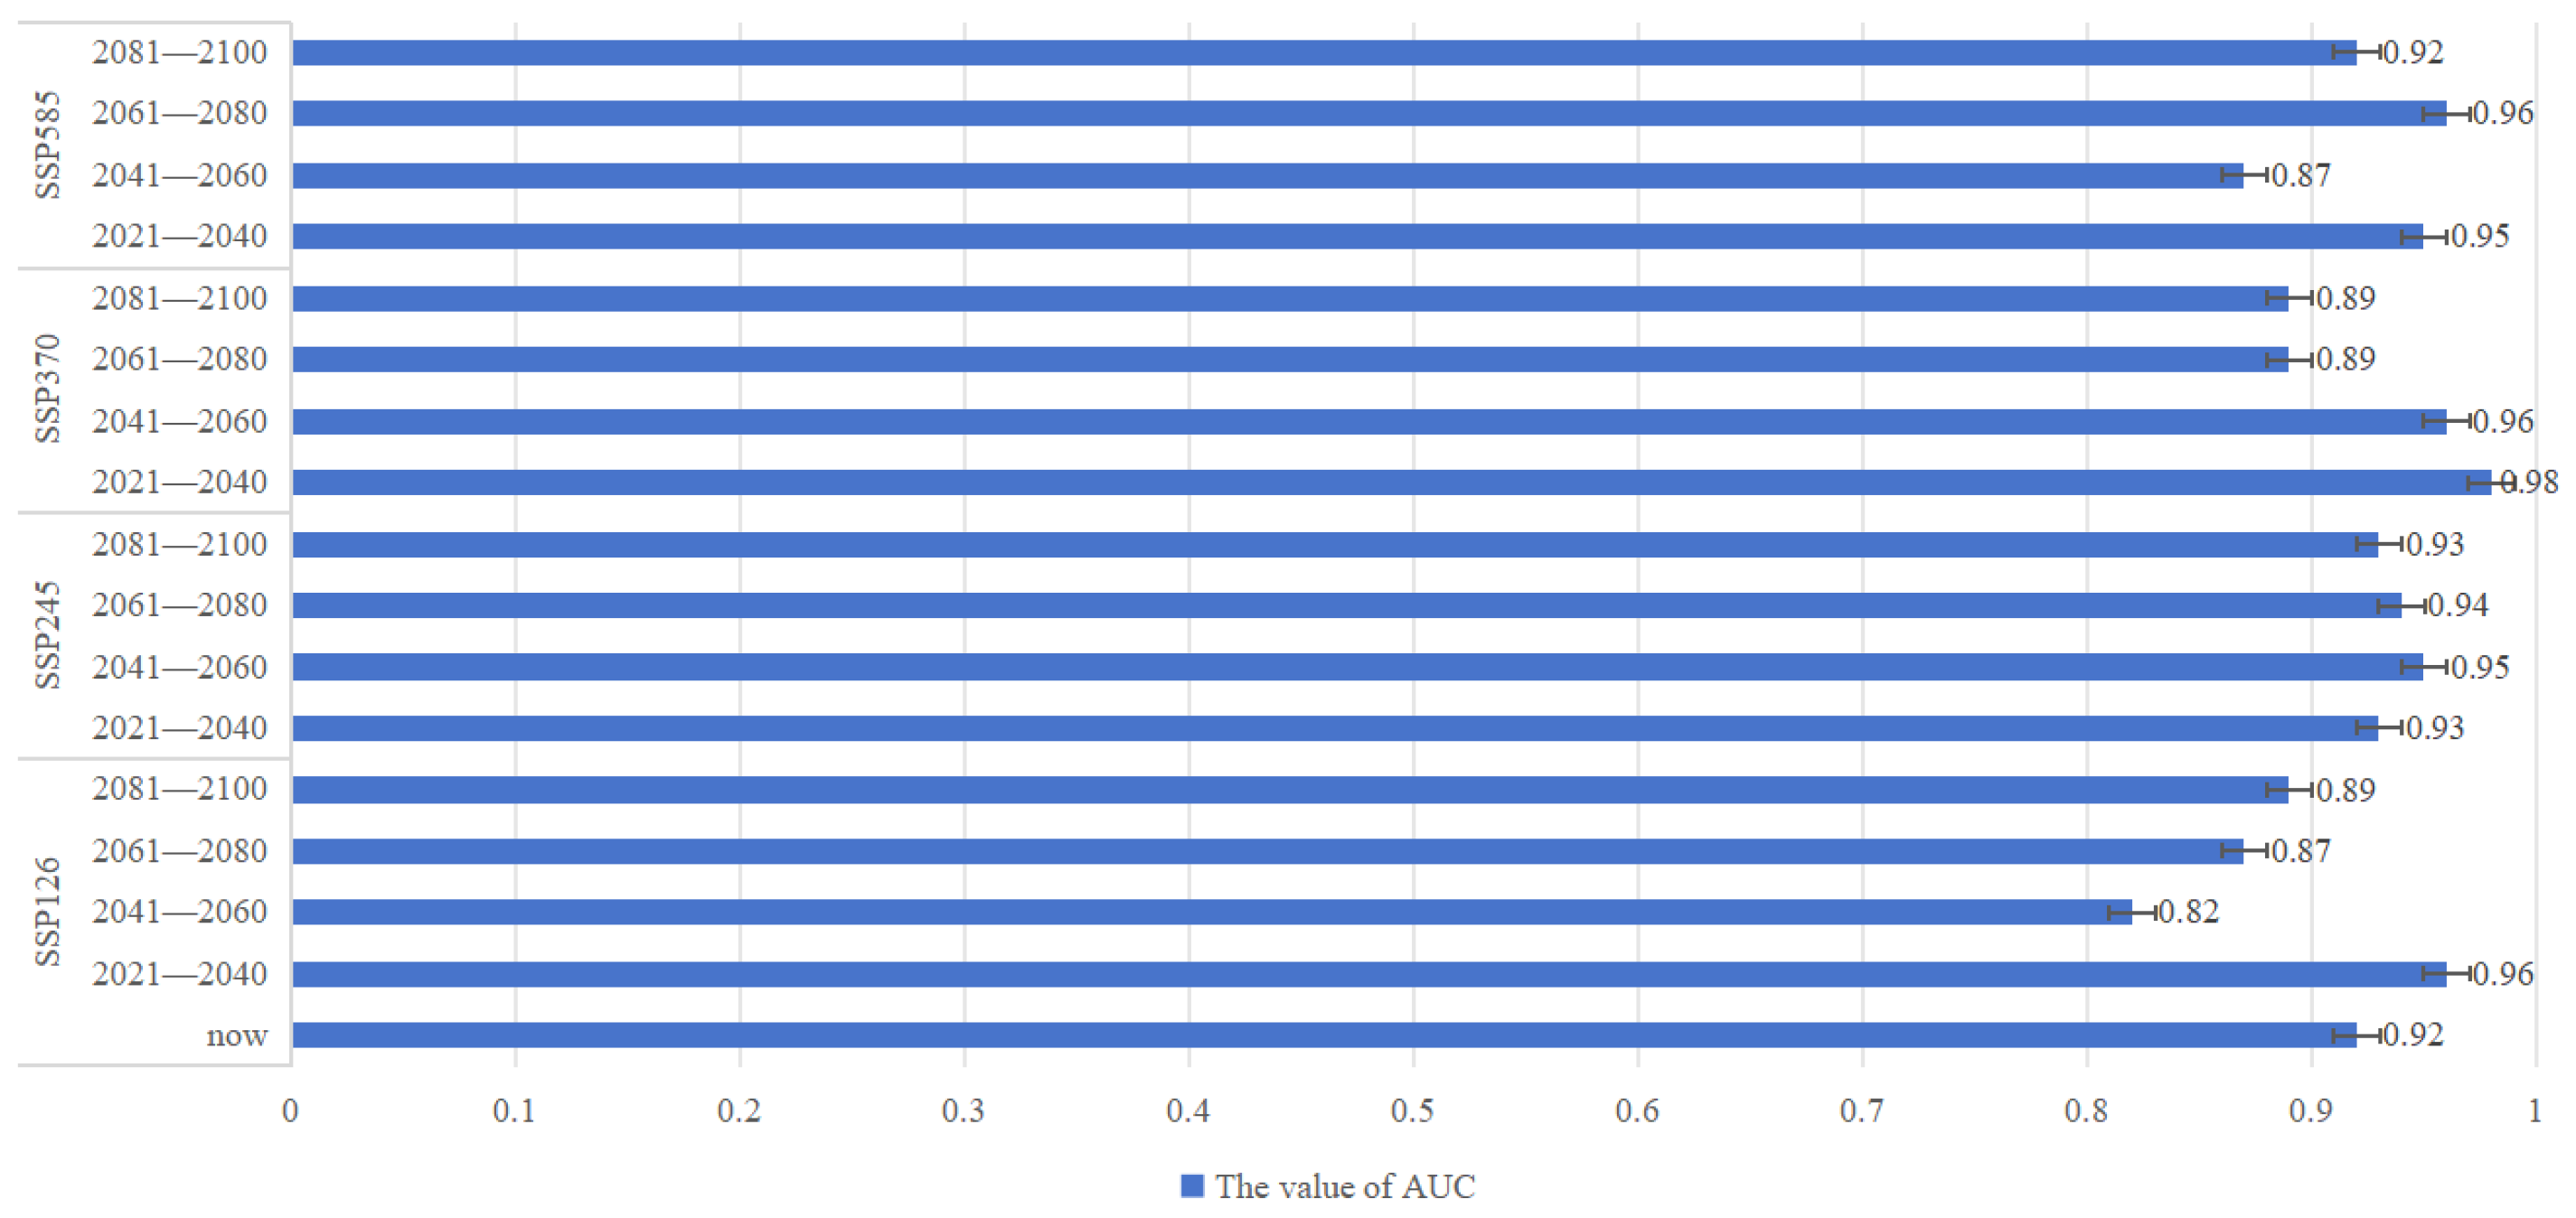
MaxEnt simulations were conducted based on current climatic conditions at R. pseudoacacia occurrence sites. Under current climate scenarios, the AUC value of the training data set for the ROC curve was 0.85; across all four future climate scenarios, the AUC values predicted by the MaxEnt model exceeded 0.91 (Figure 2). These findings demonstrate that the MaxEnt model achieves high accuracy in simulating the potential geographical distribution of R. pseudoacacia in the “Ω”-shaped bend of the Yellow River.

4.2. Potential Suitable Area Distribution of R. pseudoacacia Plantations in the “Ω”-Shaped Bend of the Yellow River Under Future Emission Scenarios

Compared with current climatic conditions, the total suitable area of R. pseudoacacia plantations exhibited a trend of first increasing and then decreasing under the four future emission scenarios (Table 4). The maximum expansion in total suitable area was observed under the SSP245 scenario, while the area of unsuitable habitats showed a gradual decline under the SSP370 scenario. Under the SSP126 scenario, the total suitable area increased by 53,534.01 km2 in 2061–2080 compared to 2021–2040. In 2081–2100 relative to 2021–2040, the low-suitability area expanded by 49,840.25 km2, whereas the increases in high- and moderate-suitability areas were negligible; Under the SSP245 scenario: The total suitable area decreased by 7001.34 km2 in 2081–2100 compared to 2021–2040, with no significant changes in the areas of high-, moderate-, and low-suitability habitats; Under the SSP370 scenario: The total suitable area declined by 1249.19 km2 in 2081–2100 relative to 2021–2040. Specifically, the high- and moderate-suitability areas decreased by 5530.08 km2 and 8009.35 km2, respectively, while the low-suitability area increased by 12,290.24 km2. Under the SSP585 scenario, the total suitable area decreased by 10,528.19 km2 in 2081–2100 compared to 2021–2040. Notably, the high- and moderate-suitability areas reduced by 25,492.10 km2 and 6458.90 km2, respectively, while the low-suitability area increased by 21,422.81 km2.

4.3. Potential Suitable Area Distribution of R. pseudoacacia Plantations Under Current and Future Emission Scenarios

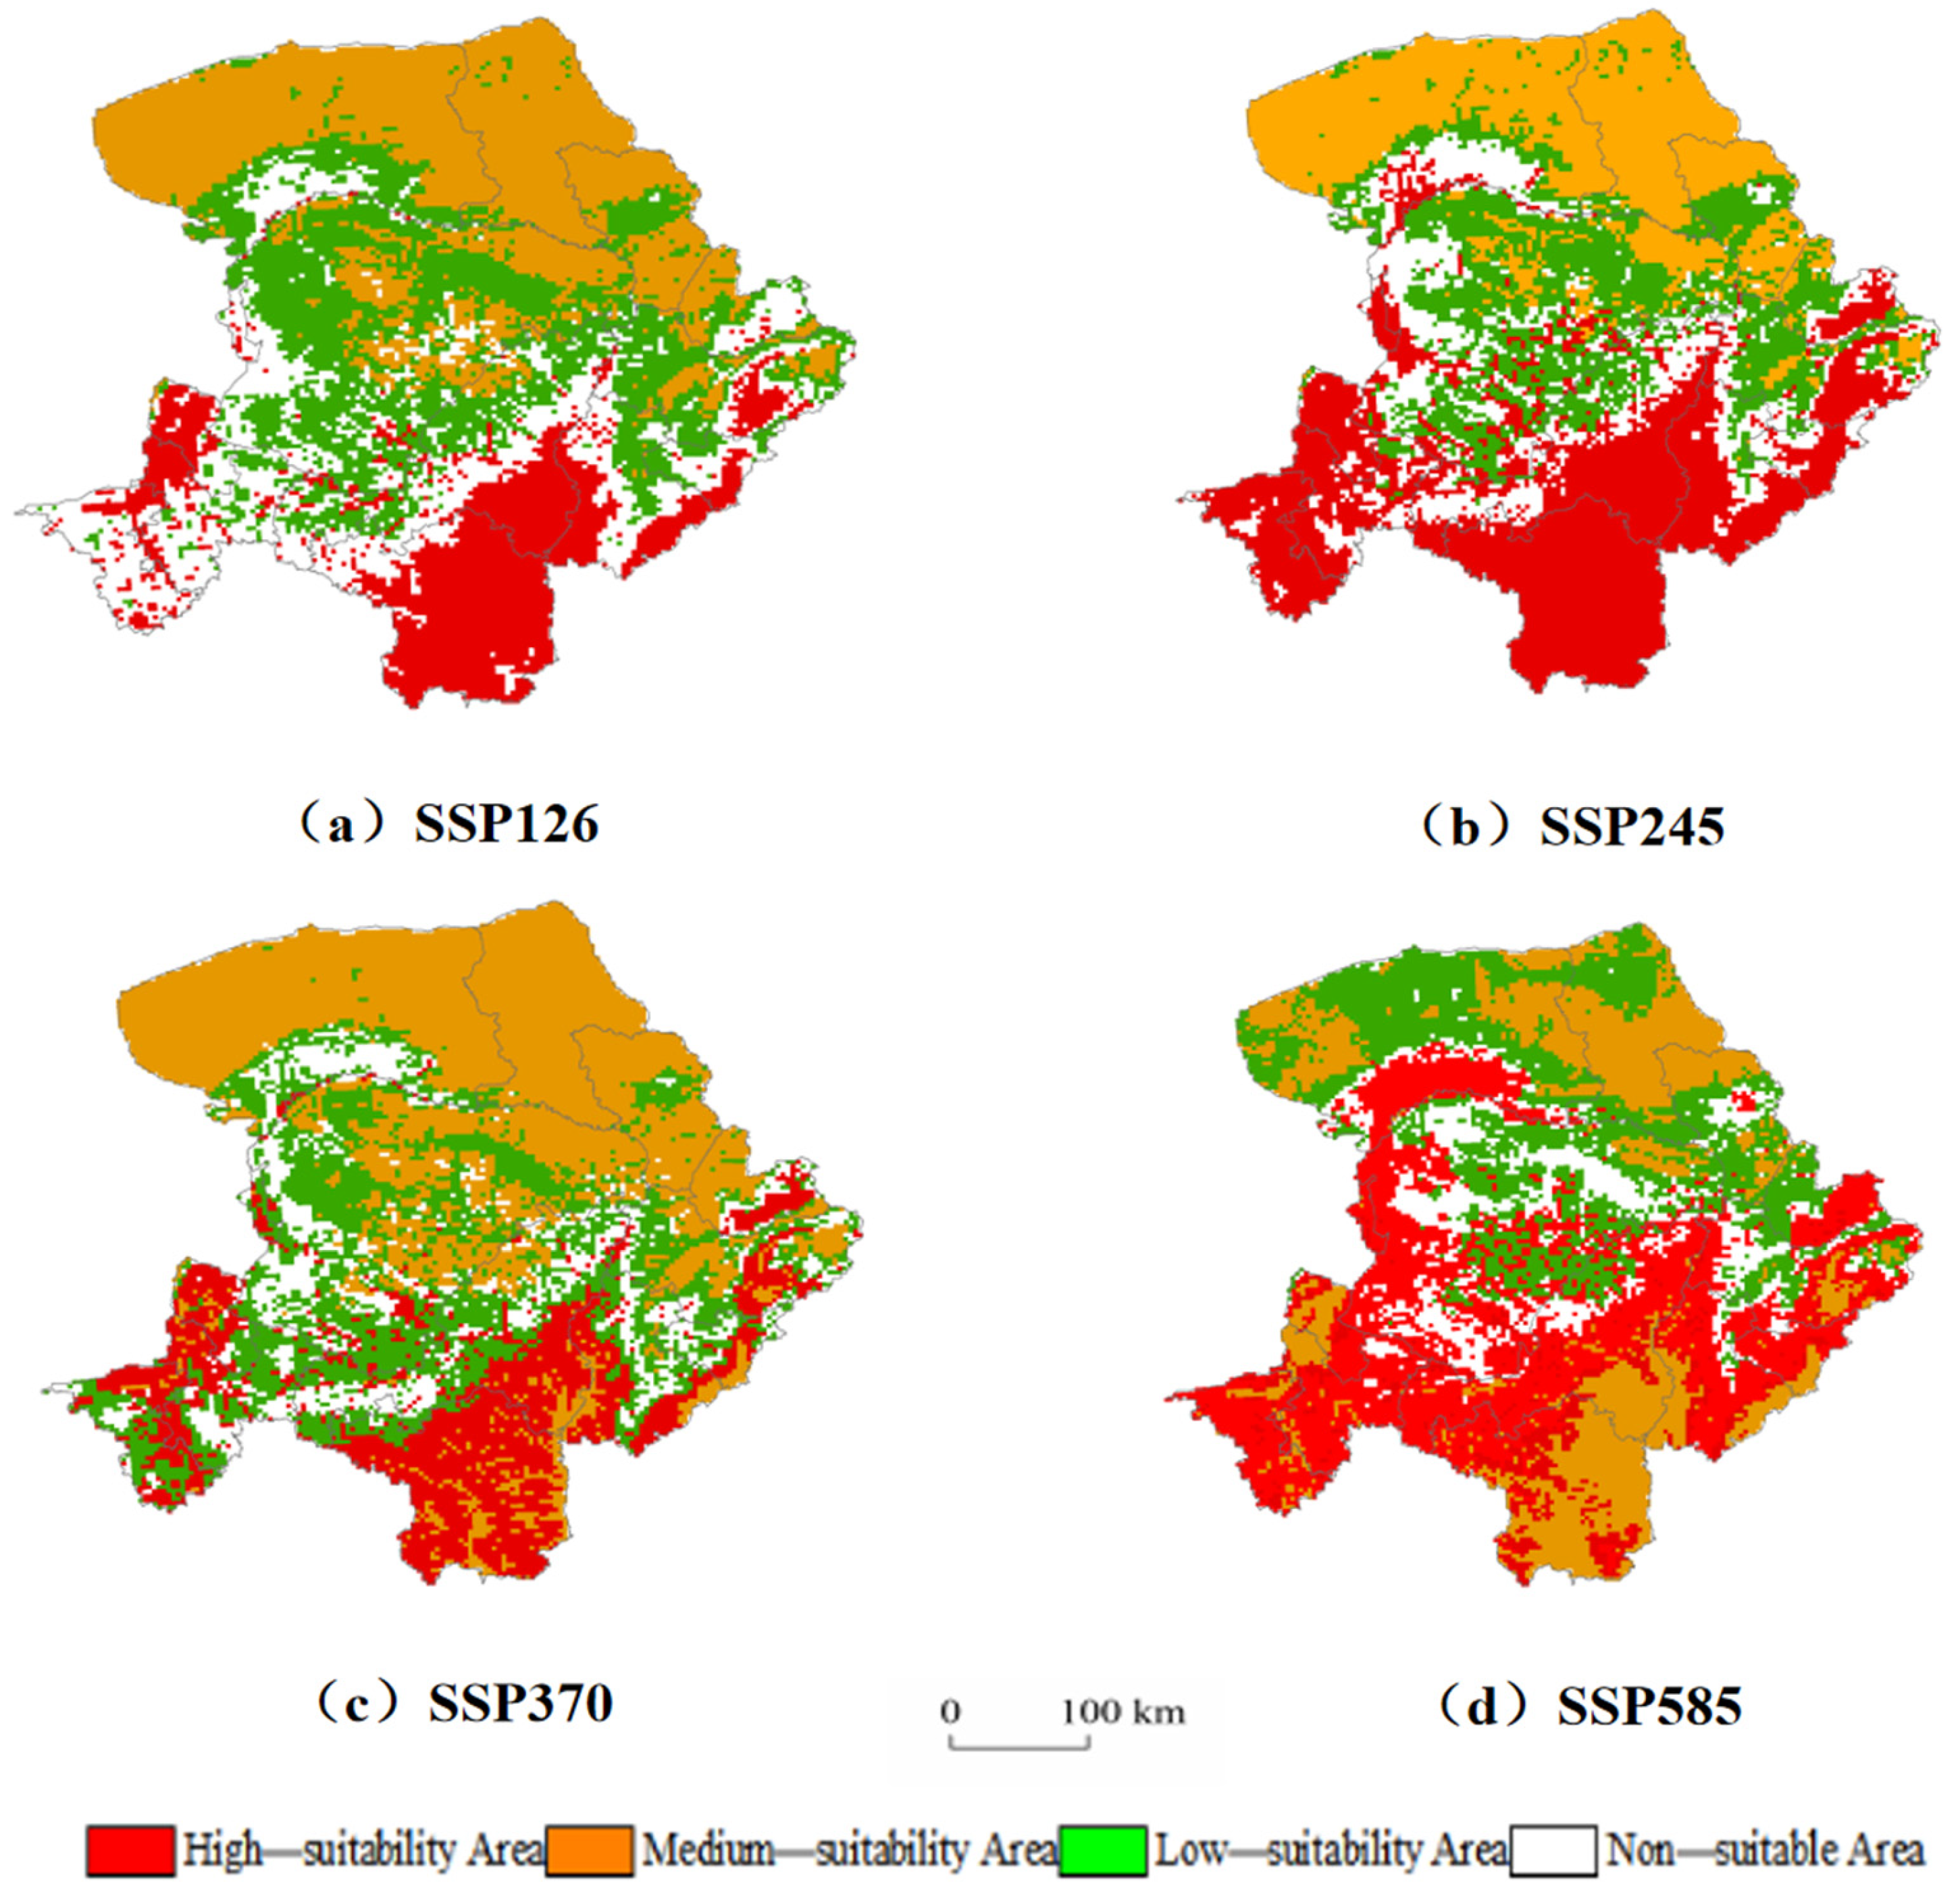
Under current climatic conditions, potential suitable areas of R. pseudoacacia plantations in the “Ω”-shaped bend of the Yellow River were primarily distributed across the Loess Plateau, Hetao Plain, Ordos Plateau, Kubuqi Desert, and northern Mu Us Sandy Land (Figure 3). The total suitable area amounted to 260,809.86 km2, accounting for ~68.96% of the entire “Ω”-shaped bend region. The high-suitability area covered 86,679.93 km2, approximately 22.81% of the study area, and was mainly concentrated in Shaanxi Province, southern Shanxi Province, and northwestern Ningxia Hui Autonomous Region. The moderate-suitability area spanned 67,748.99 km2, 17.78% of the study area, with a predominant distribution in the Inner Mongolia Autonomous Region. The low-suitability area totaled 106,380.94 km2, representing 2.65% of China’s total land area; in addition to its distribution in the Inner Mongolia Autonomous Region, scattered patches were observed along the border between Inner Mongolia and Shaanxi Province. Under the SSP245 climate scenario, the low-suitability area exhibited a growing trend with a net expansion of 49,605.92 km2, while minimal changes were detected in the high- and moderate-suitability areas. Under the SSP370 scenario, the most pronounced pattern of “quantitative increase coupled with qualitative degradation” was observed in the suitable areas: the high-suitability area—clustered in central Shaanxi Province—showed a shrinking trend with a net reduction of 39,814.95 km2, whereas the moderate- and low-suitability areas expanded correspondingly. Under the SSP585 scenario, both the high- and moderate-suitability areas underwent a shrinking trend and displayed a northwestward shifting tendency.

4.4. Carbon Sequestration Potential of R. pseudoacacia Plantations Under Future

Emission Scenarios

The predicted carbon sequestration potential of R. pseudoacacia plantations in the “Ω”-shaped bend of the Yellow River is presented in Table 5. Under all four future emission scenarios, both total carbon storage and mean carbon density of R. pseudoacacia plantations exhibited a trend of initial increase followed by subsequent decrease. By 2100, the maximum total carbon storage reached 26.13 Tg and the average carbon density 51.28 t·hm−2 under the SSP370 scenario, representing increments of 8.14 t·hm−2 and 19.08 t·hm−2 relative to current values, respectively. In contrast, the minimum total carbon storage and Average carbon density were 15.11 Tg and 29.17 t·hm−2, respectively, under the SSP585 scenario. Specifically, under the SSP126 scenario, total carbon storage peaked at 18.48 Tg during 2061–2080; while under the SSP585 scenario, the average carbon density reached its maximum of 38.90 t·hm−2 in 2021–2040. Overall, both the annual total carbon storage and mean carbon density followed a consistent pattern of first increasing and then decreasing across all future scenarios. This indicates that the carbon sink capacity of R. pseudoacacia in the study region will gradually enhance before weakening over time.

4.5. Spatial Heterogeneity of Carbon Storage Under Different Emission Scenarios in the 2090s

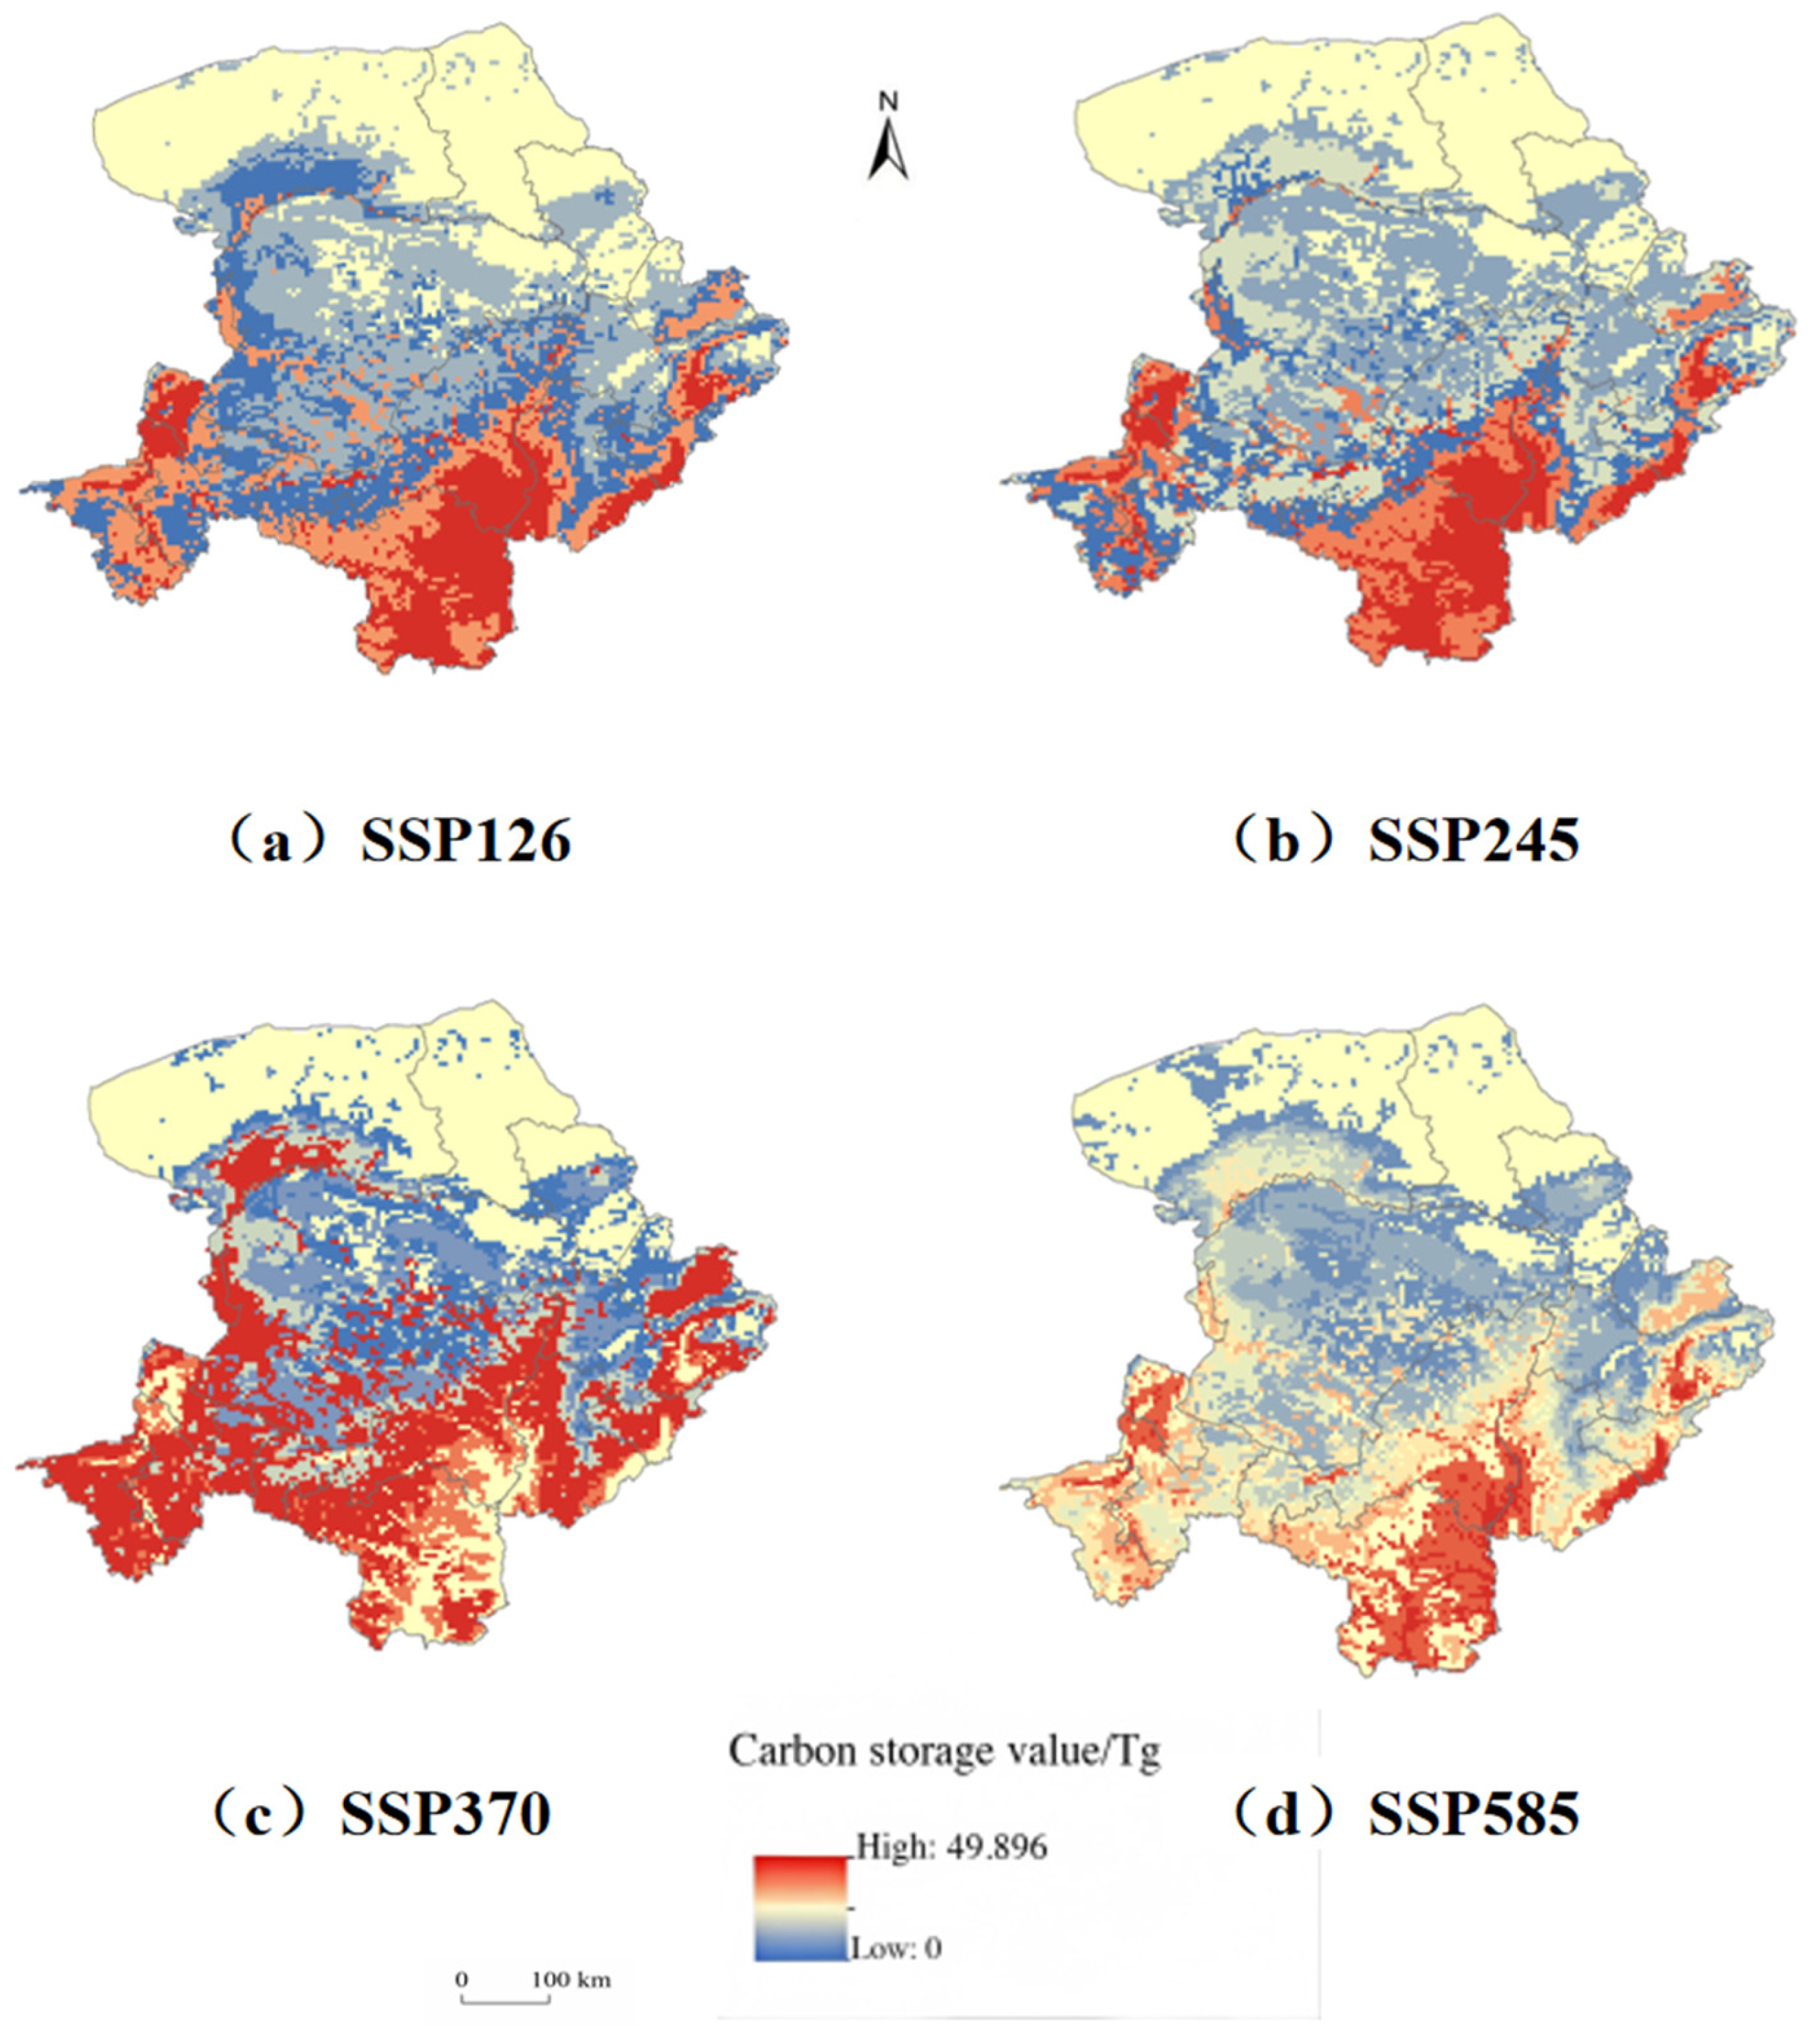
As depicted in the spatial distribution of carbon storage across the four emission scenarios in the 2090s (Figure 4), substantial discrepancies were observed in the carbon storage (Tg) of R. pseudoacacia plantations among different forcing scenarios, with marked spatial heterogeneity evident across the study region. Under the SSP126 scenario, high carbon storage was predominantly concentrated in the southern Loess Plateau, Ningxia Plain, and southwestern Lüliang Mountains within the “Ω”-shaped bend of the Yellow River. Moderate carbon storage was mainly distributed in the Ordos Plateau, Hetao Plain, and Kubuqi Desert. Under both the SSP370 and SSP585 scenarios, high carbon storage was primarily clustered in the Loess Plateau, Ningxia Plain, and adjacent areas of the Lüliang Mountains, exhibiting a distinct northwestward shifting tendency. Notably, a decreasing trend in carbon storage was further confirmed under the SSP585 scenario. In summary, regions with medium-to-high carbon storage displayed pronounced spatial aggregation under the SSP126 and SSP245 scenarios, whereas these high-value regions underwent a distinct northwestward migration under the SSP370 scenario.

5. Discussion

5.1. Impacts of Climate Change on Suitable Areas of R. pseudoacacia

The MaxEnt model analysis in this study showed that ten environmental factors, including the minimum temperature of the coldest month, annual precipitation, elevation, and temperature seasonality, are the main environmental factors affecting the distribution of R. pseudoacacia plantations. Among them, the minimum temperature of the coldest month is the key environmental variable restricting the potential distribution of R. pseudoacacia, and the cumulative contribution rate of temperature-related environmental factors exceeds 56%. This result is consistent with the research result of Gao Wanting [46], and is also consistent with the biological characteristics of R. pseudoacacia that prefers warmth and tolerates cold, whose distribution is often limited by extreme low temperatures [47]. The contribution rate of precipitation factors is 21.82%, which is second only to temperature in importance, indicating that water is another key limiting factor for its distribution. Future climate warming, especially the increase in winter temperature, is expected to improve the thermal conditions in high-latitude and high-altitude areas [48]. At the same time, temperature increase may exacerbate evapotranspiration and cause water stress [49]. Although R. pseudoacacia has a certain degree of drought adaptability and can cope with stress by adjusting the depth of water use, its normal physiological activities still require suitable hydrothermal conditions [50,51]. From a physiological perspective, temperature and precipitation jointly define the growth of R. pseudoacacia: excessively low temperature will cause freezing damage and inhibit growth; while excessively high temperature accompanied by insufficient water may lead to plant stomatal closure and then “carbon starvation” [52], both of which can cause R. pseudoacacia plantations to lose some suitable areas. This study found that the suitable area in the western part of the Yellow River’s “Ω”-shaped bend changed under the SSP370 climate scenario, which may be due to the limited increase in precipitation under the SSP370 climate scenario and the reduction in highly suitable areas caused by the warm and dry trend.

5.2. Changes in Suitable Area of R. pseudoacacia Plantations Under Climate Change

This study predicts that the total suitable area of R. pseudoacacia plantations will show a trend of first increasing and then decreasing under different emission scenarios, and the highly suitable areas will shift northwestward. Mu Sha et al. [53] found through research on the spatial changes in the frequency of compound extreme events under different scenarios that the frequency of compound heavy precipitation and high temperature decreases from southeast to northwest. The frequency of compound extreme events occurring in the northwest region is lower than that in the reference period, while the annual average precipitation in the southeast region decreases, but extreme precipitation increases. The increasing frequency and intensity of extreme climates exert greater pressure on terrestrial vegetation productivity, which may lead to the northwestward shift in the highly suitable areas of R. pseudoacacia plantations in the “Ω”-shaped bend of the Yellow River.
In addition, changes in the suitable area of R. pseudoacacia plantations may be related to soil factors. Currently, studies [54] have shown that the soil erosion resistance of R. pseudoacacia plantations is the strongest when the stand age is about 33 years under current climate conditions [55]. With the increase in stand age, the soil aggregate structure may change, weakening its erosion resistance. The above factors may have an impact on the suitable area range of R. pseudoacacia plantations. Based on the aforementioned findings of this study, we put forward targeted management recommendations for R. pseudoacacia plantations in the “Ω”-shaped bend of the Yellow River. Firstly, in the Loess Plateau area of the “Ω”-shaped bend of the Yellow River, which remains stable under multiple future scenarios, priority should be given to strengthening protection by enhancing the existing protected area network and maintaining habitat connectivity to promote natural gene flow [56]. Secondly, our research results show that with climate change, the highly suitable areas of R. pseudoacacia plantations in the Loess Plateau area are at risk of contraction. We can implement strategies, such as thinning to reduce water competition pressure or selecting more drought-tolerant species.

5.3. Changes in Carbon Storage of R. pseudoacacia Plantations Under Climate Change

The future changes in carbon storage of R. pseudoacacia plantations show significant climate scenario dependence. Under medium and low emission scenarios such as SSP245, carbon storage will reach its peak by 2100, which may be due to the change in suitable areas of R. pseudoacacia plantations, and the areas with medium and high carbon storage are stably distributed in areas with good hydrothermal conditions such as the Loess Plateau in the “Ω”-shaped bend of the Yellow River. Under the SSP370 climate scenario, carbon storage shows an increasing trend, and the areas with medium and high carbon storage show a pattern of shifting to the northwest. This spatial change may be consistent with the predicted trend of the suitable area of R. pseudoacacia shifting to the northwest under this scenario, and may also benefit from the improved hydrothermal conditions caused by the future “warm and wet” trend in the northwest region, which jointly promotes the vegetation productivity and carbon storage changes in potential new forest areas. Studies have found [57] that future temperatures and precipitation in the northwest region will increase significantly. The warm and wet trend in the northwest region can improve regional hydrothermal conditions and water cycle mechanisms, increase vegetation net primary productivity, and then realize the increasing trend of vegetation carbon storage in the northwest region [58]. In contrast, the southern and eastern parts of the study area may face more frequent compound extreme climate events, such as the superposition of high temperature and heavy precipitation in the future, leading to serious carbon storage loss in the Loess Plateau area. The future spatial pattern of the carbon sink function of R. pseudoacacia plantations may be jointly determined by regional temperature and precipitation changes. In addition, carbon storage results show that the spatial change of carbon storage is not fully coupled with the change in suitable areas. Under the SSP585 climate scenario, the suitable area of the “Ω”-shaped bend of the Yellow River increases, but its carbon storage shows a decreasing trend, which may be related to the growth environment of R. pseudoacacia plantations. Currently, studies have shown [59] that with the increase in stand density of R. pseudoacacia plantations, the negative impact caused by stand density will restrict its carbon storage. In this regard, we can appropriately regulate the stand density to provide a better environment for vegetation growth, thereby increasing the carbon storage of R. pseudoacacia plantations.

5.4. Model Uncertainties and Research Limitations

Although the MaxEnt and InVEST models used in this study have robust predictive performance with an average AUC exceeding 0.91, there are still certain uncertainties in the results. Firstly, the MaxEnt model fails to fully consider biological interactions, seed dispersal limitations, and the potential adaptive evolution of R. pseudoacacia plantations. Secondly, the InVEST model’s estimation of carbon storage relies on unified land use type carbon density parameters, which fail to reflect the spatial heterogeneity caused by differences in stand age, site conditions, and management measures. Soil factors are set as static in this study, ignoring the feedback process of the soil carbon pool itself under climate change. Future research needs to combine dynamic soil models to more comprehensively assess the long-term impact of climate change on the carbon sink function of R. pseudoacacia plantations.

6. Conclusions

The main environmental factors affecting the distribution of R. pseudoacacia forests, in descending order of contribution, are the minimum temperature of the coldest month, annual precipitation, elevation, temperature seasonality, annual mean solar radiation, and soil-related factors, which are the key factors limiting the distribution of potential suitable areas of R. pseudoacacia. The cumulative contribution rate of temperature-related factors exceeds 56%.
Under current climatic conditions, the potential suitable areas of R. pseudoacacia in the “Ω”-shaped bend of the Yellow River are mainly distributed in the Loess Plateau, Hetao Plain, Ordos Plateau, Kubuqi Desert, and northern Mu Us Sandy Land. Highly suitable areas are mainly distributed in Shaanxi Province, southern Shanxi Province, and northwestern Ningxia Hui Autonomous Region, accounting for approximately 22.81% of the total area of the “Ω”-shaped bend of the Yellow River. Under the SSP370 climate scenario, highly suitable areas are clustered in central Shaanxi Province and show a shrinking trend, while the areas of moderately and lowly suitable areas increase. Under the SSP585 climate scenario, both highly and moderately suitable areas tend to shift northwestward.
Under the four future climate scenarios, the carbon storage and carbon density of R. pseudoacacia forests show dynamic changes. By 2100, the carbon storage reaches the maximum under the SSP370 scenario. Under the SSP585 scenario, the annual carbon sink shows a decreasing trend; under the SSP126 and SSP245 scenarios, the annual carbon sink shows a trend of first decreasing and then increasing. Overall, under future climate scenarios, the areas with medium and high carbon storage are concentrated in the southern Loess Plateau and Ningxia Plain of the “Ω”-shaped bend of the Yellow River.

Author Contributions

Writing—Original Draft, Methodology, Formal Analysis, Data Curation, Conceptualization: Q.S.; Data Management, Validation, Writing—Review & Editing: J.Z.; Methodology, Formal Analysis: J.Z.; Software, Investigation: D.W.; Investigation, Formal Analysis: Q.S.; Investigation: J.T.; Writing—Original Draft: W.X. and J.G.; Writing—Review & Editing, Conceptualization, Project Administration, Supervision, Validation, Methodology: D.W. All authors have read and agreed to the published version of the manuscript.

Funding

This research was supported by the Major Project of “Jiebang Guashuai” for Science and Technology Breakthrough in Ordos City (Grants. JBGS2024010) and the National Key Research and Development Program of China (Grants. 2024YFD1501104).

Data Availability Statement

Data are available from the corresponding author upon reasonable request.

Conflicts of Interest

Author Wei Xie and Jianjun Guo were employed by the company Inner Mongolia Shendong Tianlong Group Co., Ltd. The remaining authors declare that the research was conducted in the absence of any commercial or financial relationships that could be construed as a potential conflict of interest.

References

  1. Sun, Y.; Chen, Y. Stand density mediates carbon flow pathway strategies in R. pseudoacacia forests: Implications from δ13C signatures. Catena 2025, 261, 109564. [Google Scholar] [CrossRef]
  2. Zhao, J.; Hu, H.; Wang, J.L. Forest carbon reserve calculation and comprehensive economic value evaluation: A forest management model integrating the biomass expansion factor method and total forest value. Int. J. Environ. Res. Public Health 2022, 19, 15925. [Google Scholar] [CrossRef] [PubMed]
  3. Lang, M.H.; Zhang, R.S.; Fan, S.H. Carbon sink capacity of Pinus sylvestris var. mongolica plantations on the southern edge of the Horqin Sandy Land and their responses to climatic factors. J. Soil Water Conserv. 2024, 38, 236–245. (In Chinese) [Google Scholar]
  4. Li, L.; Zayiti, A.; He, X.M. Evaluation of stand structure, carbon sequestration, oxygen release function, and carbon sink value of three artificial shrub species along the Tarim Desert Highway. Forests 2023, 14, 2137. [Google Scholar]
  5. Pang, L.D.; Pang, W.L.; Liu, G.D. Spatiotemporal characteristics and multi-scenario prediction of carbon storage in the Greater Khingan Mountains of Inner Mongolia. J. Arid. Land Resour. Environ. 2025, 39, 110–120. (In Chinese) [Google Scholar] [CrossRef]
  6. Fang, J.Y.; Guo, Z.D.; Piao, S.L.; Chen, A.P. Estimation of terrestrial vegetation carbon sinks in China from 1981 to 2000. Sci. China Ser. D Earth Sci. 2007, 37, 804–812. (In Chinese) [Google Scholar]
  7. Liu, Y.C.; Gao, X.L.; Fu, C.; Yu, G.Y.; Liu, Z.Y. Estimation of carbon sequestration potential of Chinese forests based on forest inventory data. Acta Ecol. Sin. 2019, 39, 4002–4010. (In Chinese) [Google Scholar]
  8. Piao, S.L.; He, Y.; Wang, X.H.; Qiao, Y.J.; Hu, M.T. Estimation of terrestrial ecosystem carbon sinks in China: Methods, progress, and prospects. Sci. China Earth Sci. 2022, 52, 1010–1020. (In Chinese) [Google Scholar]
  9. Wang, X.K.; Feng, Z.W.; Ouyang, Z.Y. Plant carbon storage and carbon density of forest ecosystems in China. Chin. J. Appl. Ecol. 2001, 12, 13–16. (In Chinese) [Google Scholar]
  10. Wang, X.R.; Lei, L.; Zeng, L.X.; Tang, W.P.; Cui, H.X.; Xiao, W.F. Short-term effects of thinning on soil labile organic carbon in Pinus massoniana forests. Chin. J. Ecol. 2021, 40, 1049–1061. (In Chinese) [Google Scholar]
  11. Fan, W.J.; Peng, N.J.; Cao, B.; Feng, H.P.; Li, Y. Progress in high spatial resolution vegetation quantitative remote sensing. J. Remote Sens. 2025, 29, 1365–1387. (In Chinese) [Google Scholar]
  12. Lü, H.; Peng, C.L.; Wu, H.L.; Li, P.H.; Hu, J.D.; He, Y.J.; Liu, Y.; Li, Q.Y. A review of estimation methods for carbon storage in different carbon pools of forest ecosystems. Hunan For. Sci. Technol. 2022, 49, 90–98. (In Chinese) [Google Scholar]
  13. Cai, H.S.; Shu, Q.T.; Li, Z.Y.; He, H.L.; Ma, S.Y.; Tan, C.G.; Wei, R. Progress in remote sensing estimation of forest carbon storage based on the GEE platform. World For. Res. 2025; in press. (In Chinese) [Google Scholar]
  14. Hu, H.B.; Liu, J.X.; Ding, D.X.; Mao, F.J. A review of forest carbon sequestration measurement methods. J. Cent. South Univ. For. Technol. 2024, 44, 58–69. (In Chinese) [Google Scholar]
  15. Pan, Y.; Li, Y.Z.; Wu, Y.; Liu, Q.F.; Sun, Y.; Zhu, W.C. Estimation of forest aboveground biomass based on multi-source remote sensing and analysis of spatial scale effects. For. Eng. 2025; in press. (In Chinese) [Google Scholar]
  16. Hooftman, A.D.; Ziv, G.; Evans, M.P.; Bullock, M.J. Validation of the InVEST nutrient retention model across Europe with attribution of model errors. Environ. Model. Softw. 2025, 193, 106657. [Google Scholar] [CrossRef]
  17. Wang, Y.; Yu, F.D.; Zhang, Y.; Xian, H.X.; Yan, H.Q.; Mao, D.H. Multi-scenario simulation of landscape pattern and carbon storage changes in the black soil region of Northeast China based on the PLUS-InVEST model. Ecol. Environ. Sci. 2025; in press. (In Chinese) [Google Scholar]
  18. Lai, Y.Y.; Tong, J.W.; Chen, Z.P.; Luo, Z.J. Spatiotemporal evolution and multi-scenario simulation of carbon storage in Pingxiang City, Jiangxi Province based on the PLUS-InVEST model. Bull. Soil Water Conserv. 2025; in press. (In Chinese) [Google Scholar]
  19. Peng, Q.Q.; Aji, D.; Li, P.P.; Hu, C.Q.; Kang, J.J. Spatiotemporal evolution and prediction of carbon storage in the Kaidu River Basin based on the PLUS-InVEST model. Huanjing Kexue (Environ. Sci.) 2025, 46, 7758–7768. (In Chinese) [Google Scholar]
  20. Cao, M.; Xin, Z. Modified InVEST model for spatiotemporal variations of water conservation and its driving factors in the southwestern alpine canyon region of China (1990–2020). Environ. Sustain. Indic. 2025, 28, 101034. [Google Scholar] [CrossRef]
  21. Deng, Y.Z.; Chen, G.K.; Huang, Y.; Guo, Q.K.; Li, H.H. Spatiotemporal evolution and trade-off synergy of water conservation and soil conservation functions in the Erhai Lake Basin. J. Soil Water Conserv. 2025; in press. (In Chinese) [Google Scholar]
  22. Zhang, Y.; Zhang, S.J.; Lü, T.; He, H.D. Coupling and synergy between landscape ecological risk and habitat quality in the Yellow River Basin (Inner Mongolia section). Ecol. Environ. Sci. 2025, 34, 1841–1852. (In Chinese) [Google Scholar]
  23. Ma, P.X.; Dao, C.J.; Du, L.P.; Xiao, Y.N.; Huang, Z.K. Multi-scenario simulation of land use change and carbon storage assessment on the southern bank of Dianchi Lake based on the PLUS-InVEST model. J. Agro-Environ. Sci. 2025; in press. (In Chinese) [Google Scholar]
  24. Zhong, W.; Wei, X.; Yu, Y. Predicting potential suitable areas of national key protected Orchidaceae species in Heilongjiang Province using MaxEnt models. Ecol. Front. 2026, 46, 18–28. [Google Scholar] [CrossRef]
  25. Ma, Y.L.; Han, L.; Wang, N.N.; Ma, J.; Wang, Y.; Ma, S.J. Changes in potential suitable areas and carbon sequestration potential of R. pseudoacacia plantations under climate change scenarios. J. Soil Water Conserv. 2025, 39, 260–268. (In Chinese) [Google Scholar]
  26. Li, Z.S.; Chen, W.L.; Jiao, L. Responses of radial growth of healthy and declining R. pseudoacacia forests to climate on the Loess Plateau. Acta Ecol. Sin. 2024, 44, 757–769. (In Chinese) [Google Scholar]
  27. Lü, D.X.; Geng, X.Q.; Cui, Z.Y. Nutrient use characteristics and stand quality of R. pseudoacacia with different stand ages in the Loess Hilly Region. J. Beijing For. Univ. 2023, 45, 90–99. (In Chinese) [Google Scholar]
  28. Liu, L.; Yu, B.W.; Wang, X.P.; Xue, L.P.; Han, G.Z. Growth characteristics and biomass of artificial R. pseudoacacia forests in the Loess Hilly and Gully Region. Soil Water Conserv. China 2023, 19–22. (In Chinese) [Google Scholar]
  29. Soberón, J.; Peterson, A.T. What is the shape of the fundamental Grinnellian niche? Theor. Ecol. 2020, 13, 105–115. [Google Scholar] [CrossRef]
  30. Sales, L.P.; Hayward, M.W.; Loyola, R. What do you mean by “niche”? Modern ecological theories are not coherent on rhetoric about the niche concept. Acta Oecologica 2021, 110, 103701. [Google Scholar] [CrossRef]
  31. Grinnell, J. The niche-relationships of the California thrasher. Auk 1917, 34, 427–433. [Google Scholar] [CrossRef]
  32. Grinnell, J. The origin and distribution of the chestnut-backed chickadee. Auk 1904, 21, 364–382. [Google Scholar] [CrossRef]
  33. Zhou, H.C.; Huo, L.M.; Guan, Y.L. Carbon cycle economy: Connotation, practice, and its profound impact on carbon neutrality. Ecol. Econ. 2021, 37, 13–26. (In Chinese) [Google Scholar]
  34. Zhang, X.X.; Du, H.; Li, W.P.; Wu, X.P.; Wei, W.B.; Wang, N.; Wang, R.X.; Bian, Y.J.; Dou, Y.x.; Wang, Z.Y. Spatiotemporal evolution and influencing factors of water conservation in the Yellow River Basin based on the InVEST model. Acta Ecol. Sin. 2025, 45, 12324–12336. (In Chinese) [Google Scholar]
  35. Chen, Y. Analysis of habitat quality in China based on the InVEST model. China Resour. Compr. Util. 2025, 43, 110–112. (In Chinese) [Google Scholar]
  36. Yang, H.X.; He, H.; Liu, B.; Cao, Y.F.; He, J.K. Multi-scenario simulation of land use and carbon storage assessment in arid areas of northwest China based on the PLUS-InVEST-Geodetector model. Environ. Sci. 2025; in press. (In Chinese) [Google Scholar]
  37. Hou, J.K.; Chen, J.J.; Zhang, K.Q.; Zhou, G.Q.; You, H.T.; Han, X.W. Spatiotemporal variation characteristics of carbon storage in the source region of the Yellow River based on InVEST and GeoSoS-FLUS models and their responses to different future scenarios. Environ. Sci. 2022, 43, 5253–5262. (In Chinese) [Google Scholar]
  38. Nordling, K.; Fahrenbach, N.L.S.; Samset, B.H. Climate variability can outweigh the influence of climate mean changes for extreme precipitation under global warming. Atmos. Chem. Phys. 2025, 25, 1659–1684. [Google Scholar] [CrossRef]
  39. Shi, Q.Q.; Wang, D.L.; Zhao, X.L.; Xie, W.; Guo, J.J. Prediction of suitable tree species distribution patterns in the “Ω”-shaped bend of the Yellow River based on the MaxEnt model. J. Soil Water Conserv. 2025; in press. (In Chinese) [Google Scholar]
  40. Wang, Y.H.; Tan, D.; Han, L.Y.; Li, D.H.; Wang, X.; Lv, G.Y.; Lin, J.J. A review of climate change research in the Yellow River Basin. J. Desert Res. 2021, 41, 235–246. (In Chinese) [Google Scholar]
  41. Anderson RPA framework for using niche models to estimate impacts of climate change on species distributions. Ann. New York Acad. Sci. 2013, 1297, 8–28. [CrossRef] [PubMed]
  42. Kushwaha, S.P.S.; Saran, S.; Xu, J.C.; Roy, P.S. Maxent modeling for predicting the potential distribution of medicinal plant Adhatoda L. in Lesser Himalayan foothills. Ecol. Eng. 2013, 51, 83–87. [Google Scholar] [CrossRef]
  43. Jiang, Z.Y.; Zhang, Y.X.; Su, Q.T. MaxEnt modeling for predicting the potential geographical distribution of Camellia oleifera Abel under climate change. Forests 2025, 16, 1026. [Google Scholar] [CrossRef]
  44. Zanini, M.; Pellis, G.; Burrascano, S. Soil organic carbon sequestration during secondary forest succession in a Mediterranean area. J. For. Res. 2025, 36, 157–167. [Google Scholar] [CrossRef]
  45. Meng, Y.; Bai, J.; Gou, R.; Liu, Z.X.; Zhang, J.Y. Relationships between above- and below-ground carbon stocks in mangrove forests facilitate better estimation of total mangrove blue carbon. Carbon Balance Manag. 2021, 16, 14. [Google Scholar] [CrossRef]
  46. Dang, C.Y.; Ma, L.; Cui, Y.S.; Zou, C.L. Transpiration characteristics of typical plants in R. pseudoacacia forests in the western Shanxi Loess Region and their environmental responses. Res. Soil Water Conserv. 2024, 31, 243–251. (In Chinese) [Google Scholar]
  47. Gao, W.T.; Hu, X.C.; Sun, S.J.; Zang, J.S.; Meng, P.; Cai, J.F. Prediction of the spatial distribution of R. pseudoacacia in China under future climate change based on an optimized MaxEnt model. Sci. Silvae Sin. 2025, 61, 104–116. (In Chinese) [Google Scholar]
  48. Zhang, Y.W.; Wang, J.Y.; Shi, M.C.; Yang, M.; Liu, D.Y.; Wang, Z.P.; Wen, Z.M. Spatiotemporal evolution characteristics and driving factors of vegetation coverage in different climatic zones of China (1982–2022). Environ. Sci. 2025; in press. (In Chinese) [Google Scholar]
  49. Wang, B.; Chen, L.X.; Wu, Y.M. Effects of environmental and physiological factors on stem sap flow of R. pseudoacacia plantations in the western Shanxi Loess Region under drought stress. J. Beijing For. Univ. 2024, 46, 127–140. (In Chinese) [Google Scholar]
  50. Zeng, H.; Chen, F.; Zhu, Q. The interplay between phosphorus nutrition and abiotic stresses in plants. J. Genet. Genom. 2025, 52, 1507–1523. [Google Scholar] [CrossRef] [PubMed]
  51. Li, Y.; Ma, S.; Xu, W.D.; Ma, X.X.; Liu, Z.Y.; Peng, F.; Chang, Y.Q. Spatiotemporal characteristics of drought and its impacts on vegetation coverage changes in the three northeastern provinces of China. Acta Ecol. Sin. 2026, 1–23. (In Chinese) [Google Scholar]
  52. Zhao, G.H.; Cui, X.Y.; Wang, Z.; Jing, H.L.; Fan, B.G. Prediction of potential suitable distribution areas for Ziziphus jujuba var. spinosa in China under climate change. Sci. Silvae Sin. 2021, 57, 158–168. (In Chinese) [Google Scholar]
  53. Mu, S. Spatiotemporal Changes and Future Projections of Compound Extreme Events in China Based on CMIP6. Master’s Thesis, Central China Normal University, Wuhan, China, 2023. (In Chinese) [Google Scholar]
  54. Zhang, M.Q.; Wang, D.M.; Wang, Y.H.; Yun, Y.H.; Zhang, Y.Y.; Wang, Y.; Zhang, P.; Li, Z.X.; Liu, Y.L. Influencing factors and their responses of soil organic matter content in R. pseudoacacia plantations on the Loess Plateau. Acta Ecol. Sin. 2024, 44, 11206–11219. (In Chinese) [Google Scholar]
  55. Zhao, G.; Cui, X.; Sun, J.; Li, T.; Wang, Q.I.; Ye, X.; Fan, B. Analysis of the distribution pattern of Chinese Ziziphus jujuba under climate change based on optimized biomod2 and MaxEnt models. Ecological Indicators 2021, 132, 108256. [Google Scholar] [CrossRef]
  56. Han, J.D.; Bi, H.X.; Zhao, D.Y.; Lin, D.D.; Lu, S.H. Effects of stand age of R. pseudoacacia plantations on soil aggregate stability and soil erodibility. Res. Soil Water Conserv. 2025, 32, 1–10. (In Chinese) [Google Scholar]
  57. Tong, L.J.; Liu, Y.Y.; Wang, Q. Spatiotemporal changes of net primary productivity of vegetation in northwest China and its driving factors. Res. Soil Water Conserv. 2019, 26, 367–374. (In Chinese) [Google Scholar]
  58. Shan, J.A.; Zhu, R.; Yin, Z.L.; Yang, H.Q.; Zhang, W. Spatiotemporal changes of drought in northwest China based on CMIP6 models. J. Arid. Zone Res. 2024, 41, 717–729. (In Chinese) [Google Scholar]
  59. Li, F.M. Analysis of Carbon Density Distribution Pattern and Influencing Factors of R. pseudoacacia Plantations in the Caijiachuan Watershed. Master’s Thesis, Shanxi Agricultural University, Taigu, China, 2024. (In Chinese) [Google Scholar]
Figure 1. Land use of the Yellow River’s “Ω”-shaped bend. This map is compiled based on the standard map GS (2016) 2923 from the National Natural Resources Standard Map Service, with no modifications made to the base map boundaries. The same applies to all subsequent figures.
Forests 17 00317 g001
Figure 2. AUC values in different climate scenarios and periods. Figure 2 presents the AUC values across different emission scenarios and periods, obtained via the jackknife test of the MaxEnt model.
Forests 17 00317 g002
Figure 3. Changes in the potential suitable distribution of R. pseudoacacia plantations under different climate change scenarios (2021–2100). Figure 3 illustrates the changes in the potential suitable distribution of R. pseudoacacia plantations under different climate change scenarios from 2021 to 2100, derived from the MaxEnt model.
Forests 17 00317 g003
Figure 4. Spatial distribution of carbon storage in R. pseudoacacia plantations under different climate change scenarios (2100). Figure 4 depicts the spatial distribution of carbon storage in R. pseudoacacia plantations under different climate change scenarios by 2100, derived from the InVEST models.
Forests 17 00317 g004
Table 1. Environmental Factors.
TypeFieldDescription and UnitTypeFieldDescription and Unit
mate factorbio1Annual mean temperature (°C)Soil Factorst—cec—soilSoil cation exchange content (cmol/kg)
bio2Mean monthly diurnal temperature range (°C)t—CaSO4Soil sulfate content (% weight)
bio3Isothermalityt—CaCO3Soil carbonate content
(% weight)
bio4Temperature seasonalityt—bsSoil base saturation (%)
bio5Maximum temperature of the warmest month (°C)I—grave Soil gravel content (% vol.)
bio6Minimum temperature of the coldest month (°C)t—ocSoil organic carbon content
(% weight)
bio7Annual temperature range (°C)1—ph—H0 Soil pH (-log(H+))
bio8Mean temperature of the wettest quarter (°C)t—ref—bulkSoil bulk density (kg/dm3)
bio9Mean temperature of the driest quarter (°C)t—sandSand content (% wt.)
bio10Mean temperature of the warmest quarter (°C)t—siltSilt content (% wt.)
bio11Mean temperature of the coldest quarter (°C)t—tebSoil exchangeable bases (cmol/kg)
bio12Annual mean precipitation (mm)t—drainageSoil drainage class
bio13Precipitation of the wettest month (mm)topographic factoraspect Aspect
bio14Precipitation of the driest month (mm)elev Elevation (m)
bio15Precipitation seasonality (coefficient of variation)slope Slope (°)
bio16Precipitation of the wettest quarter (mm)drought factoraiAridity index (%)
bio17Precipitation of the driest quarter (mm)et0 Potential evapotranspiration (ET0, mm)
bio18Precipitation of the warmest quarter (mm)other factorssrad Surface solar radiation (W/m2)
bio19Precipitation of the coldest quarter (mm)veg Vegetation type
soil factorst—espSoil exchangeable sodium percentage (ESP, %)ndvi Normalized Difference Vegetation Index (NDVI)
t—clayClay content
(mass fraction, %wt)
hfp Human footprint
t—cee—soilCation exchange capacity (CEC, cmol/kg)
Table 2. Contribution of environmental factors. The data in Table 2 represent the contribution rates of environmental factors selected based on the contribution rates and permutation importance from the MaxEnt model, combined with multicollinearity tests.
Environmental FactorsContribution
(%)
Environmental Factor FileEnvironmental Factors Contribution
(%)
Environmental Factor File
Minimum temperature of the coldest month46.98bio6Annual mean surface solar radiation1.77t-srad
Annual precipitation21.82bio_12Soil reference depth1.13t-ref_depth
Elevation14.14elevSoil drainage class0.86t-drainage
Temperature seasonality9.24bio-4Subsoil cation exchange capacity0.72t_cec_soi
Surface soil base saturation2.90t-bsSurface soil organic carbon density0.41t_oc
Table 3. Carbon density of land use types in the Yellow River’s “Ω”-shaped bend (t·hm−2). The data in Table 3 represent the carbon densities of different land use types in the Yellow River’s “Ω”-shaped bend, calculated based on big data and quantitative statistical relationships.
Land Use TypeAbove-Ground Vegetation Carbon DensityBelow-Ground Vegetation Carbon DensitySoil Carbon DensityDead Organic Matter Carbon Density
Cultivated land15.3461.4884.30.69
Forest land33.1097.39140.51.49
Grassland31.1076.1693.70.53
Shrubland3.292.0075.20
Wetland4.510147.20
Water body0.10000
Construction land1.8423.475.10
Table 4. Suitable area of R. pseudoacacia plantations in different climate scenarios and periods (km2). The data in Table 4 present the respective suitable areas of R. pseudoacacia plantations across different emission scenarios and periods, derived from the MaxEnt model and ArcGIS.
Emission ScenariosPeriodsHigh—Suitability AreaMedium—Suitability AreaLow—Suitability AreaNon—Suitable AreaSuitable Area
SSP1262021–204086,679.9367,748.99106,380.94117,647.61260,809.86
2041–206086,715.9867,852.08153,248.8170,641.61307,816.87
2061–208086,678.1967,892.87159,772.8164,115.62314,343.87
2081–210086,429.6768,176.9156,221.1967,632.71310,827.76
SSP245 2021–204084,397.7868,398.12155,968.8669,696.71308,764.76
2041–206082,986.5668,678.87149,300.3377,496.71300,965.76
2061–208080,267.9167,945.28154,213.1975,735.17302,426.38
2081–210080,187.2968,076.87153,499.2676,701.05301,763.42
SSP3702021–204040,864.98102,527.21156,472.9878,600.35299,865.17
2041–206033,536.74114,562.98153,775.8976,590.86301,875.61
2061–208038,252.13102,876.76158,761.9878,569.61299,890.87
2081–210035,334.994,517.86168,763.2279,852.49298,615.98
SSP5852021–204038,476.3287,645.91169,548.8682,798.38295,671.09
2041–206012,709.8786,751.54189,715.3589,293.71289,176.76
2061–208016,375.6985,164.09186,354.0990,577.60 287,893.87
2081–210012,984.2281,187.01190,971.6793,329.57285,142.90
Table 5. Carbon sink potential of R. pseudoacacia forests under different climate change scenarios (2021–2100). Table 5 presents the carbon sequestration potential of R. pseudoacacia under different emission scenarios from 2021 to 2100, derived from the InVEST model.
Emission ScenariosPeriodsCarbon Storage (Tg)Average Carbon Density
(t·hm−2)
SSP1262021–204017.8133.12
2041–206016.9230.28
2061–208018.4835.12
2081–210017.9932.20
SSP2452021–204019.3042.87
2041–206019.7343.91
2061–208021.3140.28
2081–210024.9344.98
SSP3702021–204023.8145.28
2041–206023.1844.29
2061–208024.1149.29
2081–210026.1351.28
SSP5852021–204017.2838.90
2041–206016.2935.01
2061–208015.1132.40
2081–210015.6229.17
Disclaimer/Publisher’s Note: The statements, opinions and data contained in all publications are solely those of the individual author(s) and contributor(s) and not of MDPI and/or the editor(s). MDPI and/or the editor(s) disclaim responsibility for any injury to people or property resulting from any ideas, methods, instructions or products referred to in the content.