Abstract
Extreme weather events are increasing in frequency and intensity, posing a threat to forest ecosystems and eliciting forest-pest outbreaks. In the southern Italian Alps, a dramatic windthrow called Vaia occurred in October 2018, shifting populations of the European spruce bark beetle (Ips typographus) from an endemic to an epidemic phase. Remote-sensing methods are often employed to detect areas affected by disturbances, such as forest-pest outbreaks, over large regions. In this study, a random forest model on the Sentinel-2 images acquired over the south-eastern Alps in 2021 and 2022 was used to detect the outbreak spots. The automatic classification model was tested and validated by exploiting ground data collected through a survey conducted in 2021 and 2022 in both healthy and infested spots, characterized by variable sizes and degrees of infestation. The model correctly identified the forest conditions (healthy or infested) with an overall accuracy of 72% for 2022 and 58% for 2021. These results highlight the possibility of locating I. typographus outbreaks, even in small spots (between 5 and 50 trees) or spots intermixed with healthy trees. The prompt detection of areas with a higher frequency of outbreaks could be a useful tool to integrate field surveys and select forest areas in which to concentrate management operations.
1. Introduction
Forests are a critically important component of the global terrestrial carbon cycle and must play a part in the climate-change battle. Yet, climate change is threatening forest ecosystems globally [1]. Extreme weather events are increasing in frequency and intensity, although their link to climate change is still debated [2]. Extreme weather determines new stresses for forests [3,4,5] and creates favorable conditions for pest infestations. Among the most aggressive forest pests, bark beetles (Coleoptera: Curculionidae, Scolytinae) play a major role in affecting the survival of European conifer forests [6,7,8]. Bark beetles rely on debilitated trees to breed, so events such as intense and prolonged droughts or strong windthrows create conditions suitable for their outbreaks [9,10,11,12]. The dramatic windthrow that occurred at the end of 2018 in the southern Italian Alps (the “Vaia” storm), shifted alpine populations of the European spruce bark beetle (Ips typographus L.) from an endemic to an epidemic phase, eliciting an impressive infestation affecting most of the Norway spruce forests (Picea abies Karsten) occurring in Italy [13]. Ips typographus is one of the most important forest pests in Europe, able to respond very quickly to the great abundance of suitable hosts available after weather extremes [6]. Bark beetle tree colonizations begin with the attack of males on the host trees, which then attract more beetles and females by emitting aggregation pheromones. The insects breed under the bark and females lay their eggs in maternal galleries, which run longitudinally beneath the bark [10]. The larvae then develop by drilling larval galleries and feeding on the phloem, interrupting the water and nutrient flow in the tree. In forests in the south-eastern Alps, two to three generations per year can occur, mainly depending on the temperature levels, which can affect the bark beetle’s physiology [8]. The development of beetles beneath the bark can last up to eight weeks, while adults can leave the attacked trees and move to other hosts within five weeks of the colonization [14]. Under endemic conditions, this beetle attacks only weak or newly dead trees. However, extreme events can increase suitable breeding material and drastically increase the abundance of the beetle population, switching to an epidemic phase, and thus making it also able to colonize and damage healthy stands [9,15]. After storms, I. typographus colonization occurs first in broken and windthrown trees and then spreads onto neighboring healthy trees. During the epidemic phase the older infestation spots expand, the distance between different infestation spots shortens, and the spreading speed is higher as the population abundance increases [16].
Obtaining reliable information on the distribution and severity of bark-beetle infestations following windstorms or major forest disturbances is the first step in efficiently containing the problem [17,18,19]. This type of data is of fundamental importance in providing a rapid assessment of the overall economic and environmental damage, and designing better management strategies focused on those forest areas more exposed to infestations. Current actions to control I. typographus outbreaks, and assess damage, include trapping and salvage (harvesting of windthrown timber and freshly attacked trees) [10,20]. On-time salvage logging and debarking of infested trees are the most useful methods for reducing the bark beetle population and limiting outbreak expansion, but the logistics for these actions can be time- and cost-consuming and difficult to realize, as the windthrown areas that prompt the pest’s outbreaks can be located in not-easily accessible sites [20].
Remote sensing (RS) techniques have proved to be an effective tool to map forest disturbances [21] and their consequences [22], such as damage caused by windstorms [23,24] or forest pests [25,26,27,28,29], over various spatial scales. The feeding of I. typographus larvae on the phloem and the consequent interruption of water and nutrient flow in the trees causes gradual alteration in the spectral characteristics and color of the attacked trees’ crowns [28,30,31]. Infested trees are therefore characterized by an intense color change of the crown, shifting from a green to a red phase (early colonization), then a brown phase (late colonization), and finally a gray phase (old colonization).
Several studies have investigated the possibility of detecting trees infested by bark beetles at the single-tree level, using hyperspectral and multispectral images acquired by UAVs (unmanned aerial vehicles), such as aircraft or drones [32,33,34,35,36]. These studies have employed various machine-learning approaches and classification models, such as the k-nearest neighbor (k-NN) and random forest (RF) models, to assess the possibility of detecting stress due to bark beetle infestation, obtaining overall accuracies from 55% [34] to 90% [32]. Although airborne sensors are widely used to monitor bark beetle outbreaks, these approaches are limited by different factors, such as the costs associated with imagery acquisition and the possibility of having a long time-series of images available for the same areas of interest [37], which would be useful to monitor development of the outbreaks over time.
The limited spatial scale that can be covered with these approaches is another limitation, especially in cases where the outbreaks are largely distributed over vast regions, such as in the case of the post-Vaia outbreaks in the southern Italian Alps, In these cases, RS methods that employ satellite imagery can provide useful information on outbreak occurrences in larger areas. Multiple satellite missions provide data globally, with a wide range of spectral and spatial resolutions, and with a high revisit time [37,38,39,40]. In addition, the amount of remote-sensing information freely available for researchers and other users has greatly increased in the past few years [41]. Satellite imagery, such as Sentinel-2 or Landsat open access collections, provide multispectral images that can be used to analyze the variation of the land surface over time using a temporal series of images. These analyses allow the automatic mapping of forest changes, promptly [42] and at country level [43]. In particular, the Sentinel-2 mission of the Copernicus program of the European Space Agency (ESA) provides surface reflection data with 10–60 m spatial resolution and revisit times of 2–3 days at mid-latitudes, making it often chosen to analyze and monitor surface changes [23,30,43].
Various researchers have focused on the use of Sentinel-2 multispectral images to detect and monitor bark beetle outbreaks, at different degrees of symptom severity, with overall accuracies between 65% and 95%. Kranjčić et al. [38] performed a semi-automatic classification on Sentinel-2 images acquired on a single date in Croatia, exploiting only the visible and near-infrared spectral bands (B2, B3, B4, and B8), while other authors focused on time-series analysis of Sentinel-2 imagery. Fernandez-Carrillo et al. [25] employed Sentinel-2 imagery to perform a multi-temporal change-detection method to map infestation spots at different infestation stages, at 10 m spatial resolution, in the Czech Republic. The authors used various indices that represented the vitality and stress status of the vegetation to distinguish between healthy and disturbed areas, obtaining accuracies that increased with the severity of the infestation symptoms. Dalponte et al. [28] proposed a method that combined individual tree-crown analyses integrating Lidar data with Sentinel-2 data to detect bark-beetle infestations at the single-tree level. They focused on a relatively small area of about 10 ha and performed a class-weighted support vector machine (wSVM) classifier to detect bark-beetle attacks, feeding it with a selection of vegetational indices. Nardi et al. [40] performed a time-series analysis on images acquired in the spring of 2018 and spring of 2019 over a vast area in France. They performed a supervised classification and calculated the inter-annual variation of three spectral indices (normalized red index, normalized difference vegetation index, and normalized burn ratio), validating the satellite detection of bark beetle infestations with high-resolution aerial survey data. Candotti et al. [14] focused on the early symptoms of bark-beetle infestations, performing a supervised classification to assign each pixel to “healthy”, “stressed”, or “red-attack” classes of interest. The authors compared four machine-learning methods (RF, k-NN, SVM, and artificial neural networks (ANNs)), obtaining overall accuracies over 80%. For monitoring and detection of bark beetle infestations, RS methods, especially if relying on satellite imagery, are known to be most effective for rather large infestation spots still in the red or brown phase of infestation [13,19,28,30,44]. However, the infestation spots occurring in a forest can have heterogeneous characteristics, for both the density of attacked trees (from single or sparse attacked trees to large spots without healthy trees) and for the stage of infestation. Spots may include only attacked trees in the same phase, or intermixed trees in different phases [44,45]. An example of this heterogeneity is shown in Figure 1.
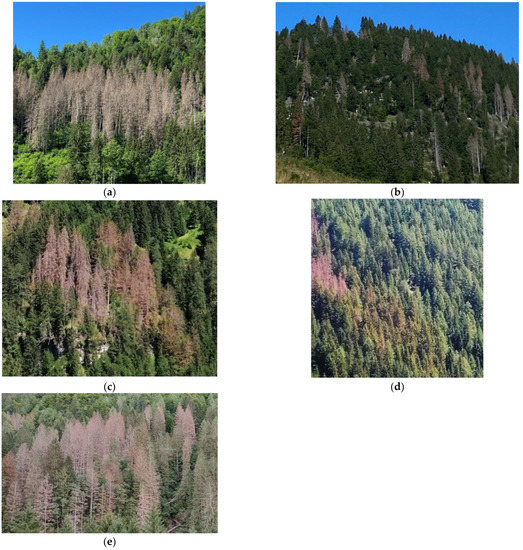
Figure 1.
Examples of the variability of infestation spots’ features: (a) homogeneous spot with only infested trees at the same infestation stage; (b) sparse small groups of infested trees among healthy trees; (c,d) coexistence of different infestation stages (early and advanced stages) in the same spot; and (e) mixed forest condition, with healthy trees among the infested trees in the spot.
Prompt and efficient large-scale detection of hotspots with different features (such as spots of smaller sizes, and at different infestation stages) carried out using the freely available satellite imagery, is needed to better manage I. typographus outbreaks.
In this respect, this study aimed to validate an automatic classification model created to detect and map forest areas with a high probability of I. typographus infestation occurrence, even if the infestation spots are small or contain trees at different infestation phases, performing a time-series analysis of Sentinel-2 free imagery referring to the years 2021 and 2022. The model was tested and validated by ground truth points collected during the initial epidemic phase of the outbreak in healthy and infested stands of different sizes (small: between 5 and 50 infested trees; medium: between 50 and 200 infested trees; and large: over 200 infested trees) and at different infestation stages, occurring in the south-eastern Alps affected by the Vaia storm in 2018.
2. Materials and Methods
2.1. Study Area
The area considered for this study (Figure 2) is located in the northern territories of the Veneto and Friuli-Venezia Giulia regions, in north-eastern Italy. It extends over 6048 km2 (46.033° N 11.834° E–46.630° N 13.018° E) and includes both alpine and pre-alpine regions dominated by conifer stands with a clear prevalence of spruce followed by larch (Larix decidua Miller, at higher elevations) and silver fir (Abies alba Miller). At lower elevations, spruce stands are often mixed with beech (Fagus sylvatica L.). The whole area was affected by the Vaia storm at the end of October 2018. The predominant spruce stands are generally monospecific reforestations or natural mountain forests [17], characterized by even-aged mature trees (50 to 100 years old) and a high tree density (about 350 trees per ha).
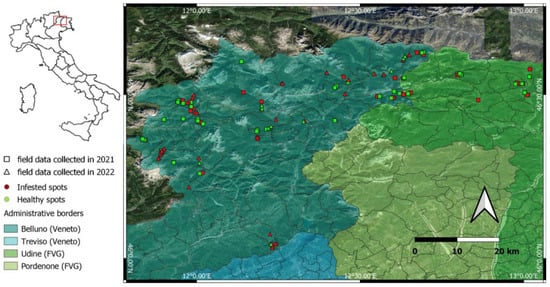
Figure 2.
Position of the survey spots in the Veneto and Friuli-Venezia Giulia regions in NE Italy, recorded in the field in 2021 (square dots) and 2022 (triangle dots) with details of the infestation (red dots) and healthy (green dots) spots.
2.2. Ground Reference Data
Ground truth validation points were taken in the field using the ArcGIS Survey123 app (Esri, www.esri.com/en-us/home accessed on 12 July 2021, license granted by ESRI through the University of Padua). This app is a useful tool that allows the collection of GNSS positions and data of interest in the field, which can be automatically available on the cloud for visualization and data manipulation (https://survey123.arcgis.com, accessed on 12 July 2021). For this study, infested and non-infested (healthy) portions of forests were recorded through field surveys conducted during both summer (August) and fall (October) 2021 and summer 2022 (July and August). The infested spots were defined as forest portions of at least 100 m2 with groups of trees recently infested by I. typographus (avoiding spots with single-infested trees among healthy trees). Only groups of at least five adjacent infested trees were considered and reported as infestation spots, as four/five trees are enough to cover a 100 m2 surface. The healthy spots were chosen as forest portions of at least 100 m2 completely free of infested trees, which were located at least 20 m from the nearest infested spot. The average GPS horizontal precision was 4.8 m. Considering that the highest resolution allowed by Sentinel-2 images is 10 m, this precision was considered acceptable. Each survey spot was characterized with auxiliary information, including date of field record, aspect, condition of the trees (green and healthy, green but with infestation symptoms on the bark, red or brown crown, gray or bare crown), and size of the infestation spots.
A total of 194 survey spots were identified in the field, of which 23 infested spots were eliminated from the dataset because they were considered too small for this study (smaller than 100 m2) or too heterogeneous (single-infested trees amongst healthy stands). After selection, a total of 171 spots were considered (95 in 2021 and 76 in 2022), 114 infested (67% of the total) and 57 healthy (33%) (Figure 2). Because it was not always possible to find accessible and completely uninfested spots occurring near the surveyed infested spots, the number of the latter exceeded that of healthy spots in the dataset. The field surveys were conducted according to the life history of the insects, reporting colonization stages, i.e., the symptoms of the infestation spots. Both the definitions of infestation stages and spots’ sizes applied to infestation spots, not to single trees. So, for example, a ground survey point registered as a small spot in the green phase would consist of a group of trees (between 5 and 50 trees) that were all in the green phase of infestation. Of the total number of infested spots, 70% (the majority of which were recorded in 2022) were small (between 5 and 50 infested trees), followed by 21% that were medium (between 50 and 200 trees) and 9% that were large (more than 200 trees). As for the different phases of infestation, represented by the color of the tree crown, 35% of infested trees were in the gray phase, 40% were in the red phase, 10% was in the green phase, and 15% in mixed phase condition (i.e., infestation spots with trees in both the green and red phase, or in the red and gray phase). Details on the percentages of different infestation stages that were reported in 2021 and 2022 are summarized in Table 1, and examples of infestation spots are shown in Figure 3. The classification model (see below) was trained separately with the field data collected in 2021 (95 spots; 60 infested and 35 healthy) and data collected in 2022 (76 spots; 54 infested and 22 healthy), to evaluate the capability of the model to detect and identify infested and healthy spots in the two years. The survey spots were then used to evaluate the reliability of the classification model (Section 2.5) in detecting and identifying infested and healthy spots in 2021 and 2022.

Table 1.
Percentages of healthy spots and infested spots, divided by infestation stage, reHorted for 2021 and 2022.
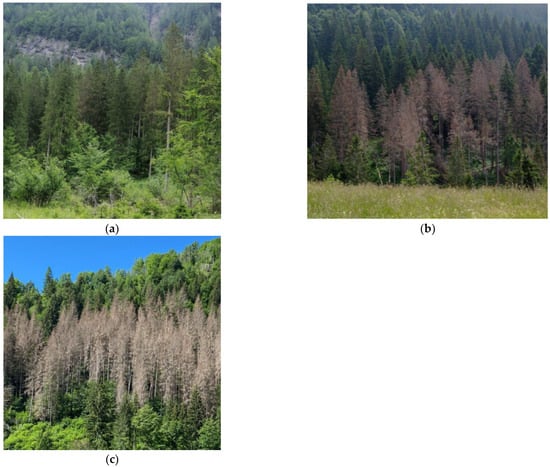
Figure 3.
Examples of infestation spots in the three different stages of infestation, from the earliest to the latest, as were considered in this study: (a) green phase, (b) red phase, and (c) gray phase.
2.3. Sentinel-2 Data and Predictors Calculation
The Sentinel-2 mission provides support for monitoring of the Earth’s surface changes. The Sentinel-2 Multispectral Instrument (MSI) provides 14 spectral bands, of which the visible (blue—B2, green—B3, and red—B4) and near-infrared (NIR—B8) bands are available at 10 m resolution [43]. The elementary units of the Sentinel-2 products are 100 × 100 km2 ortho-images in UTM/WGS84 projection, which contain all the possible spectral bands; the updated images are freely available on Google Earth Engine (GEE, https://earthengine.google.com, accessed on 23 February 2023), and downloadable from scihub, the Copernicus Open Access, Hub (https://developers.google.com/earth-engine/datasets/catalog/COPERNICUS_S2_SR, accessed on 23 February 2023).
The Sentinel-2 cloud probability of the images is created using a gradient boost base algorithm and informs on the probability that each pixel is covered by clouds. In this study, pixels were considered cloudy, and hence discarded, when the probability was higher than 65%.
For this study, we used Sentinel-2 images with a cloud coverage percentage lower than 50%, belonging to the T32TQS tile, and acquired between 1 September 2020 and 30 September 2022. The resulting number of images was 75. Images acquired between 1 September 2020 and 30 September 2021 were used for the year of analysis 2021 while images acquired between 1 September 2021 and 30 September 2022 were used for the year of analysis 2022.
The time-series analysis consisted of the analysis of images acquired on different dates (in a year or multiple years), to detect changes in the land surface—caused by the infestation damage in our study—and distinguish them from changes due to other environmental factors, such as the natural behavior of light reflectance during the year. Since many of the reference infestation spots were small, we found that 20 m spatial resolution bands could decrease the accuracy, so they were excluded from the analysis. For each image, we selected bands with 10 m spatial resolution (blue, green, red, and NIR) and we further calculated two additional spectral indices, both useful to assess vegetation greenness and stress level: the normalized difference vegetation index (NDVI) and the enhanced vegetation index (EVI) [46]. These indices are defined in Equations (1) and (2), respectively. As a result, we obtained a set of 6 predictors for each of the 75 images.
where G = 2.5, L is a soil adjustment factor (L = 1), and C1 and C2 are coefficients used to correct aerosol scattering in the red band by the use of the blue band (C1 = 6.0 and C2 = 7.5) [41].
2.4. Harmonic Trend Functions and Medoid Composite Processing
For each pixel, and for each of the six predictors in our images, we calculated the four coefficients that need to be multiplied for the four harmonic function parameters (i.e., constant, sin, cosine, and time) to identify the pixel harmonic trend (Figure 4). For each pixel harmonic trend function, we further calculated the amplitude, phase, and root mean square error (RMSE). For more details on harmonic function parameter calculation, refer to Shumway and Stoffer [47].
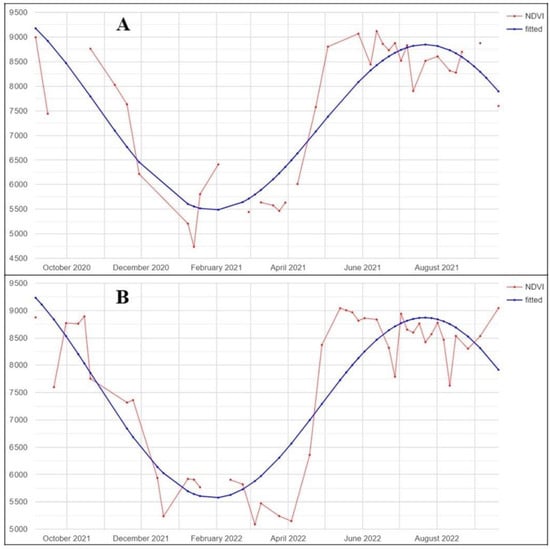
Figure 4.
Example of NDVI pixel time-series (red) and the corresponding fitted harmonic function (blue), for the years of analysis 2021 (A) and 2022 (B).
We also calculated seasonal cloud-free composites by using the medoid approach [48]. The objective of medoid composite processing is to populate the final image composite with the pixels with surface reflectance values as similar as possible to the median calculated considering the whole image collection. Accordingly, for each season, we compared the pixel surface reflectance values of each band to the median bands’ spectral values of that pixel in all images acquired in that season. Then, the bands’ spectral values from the pixel closest to that median value (using Euclidean spectral distance) were chosen. The study was conducted by comparing remote-sensing data with reference data acquired over two years. Thus, two different remote-sensing predictor sets were constructed, one in 2021 and one in 2022 (Table 2).
Table 2.
Summary of the time windows used to calculate predictors for 2021 and 2022 reference years.
2.5. Automatic Mapping
To automatically identify infested forests, we used the random forest (RF) model [49]. RF is an ensemble of decision trees that learns through a supervised approach and produces multiple models that are aggregated, using a bootstrap aggregating procedure, to produce the result. The models are built using different training subsets, generated by bootstrapping, which are used to build the ‘forest’. RF can reduce the output variance and the overfitting problem of other machine-learning approaches, improving model stability and accuracy [49]. In this study, we used a Google Earth Engine implementation of the RF algorithm. The number of input predictors resulting from the harmonic function and seasonal medoid composites calculation was 93, the number of trees was set at 500, and for the remaining RF hyperparameters, we used default RF values as detailed in the documentation (https://developers.google.com/earth-engine/apidocs/ee-classifier-smilerandomforest, accessed on 23 February 2023). Indeed, tuning of hyperparameters and variables selection slightly changes the performance in the case of RF [24,50], which is one of the reasons why RF is often exploited [51].
RF predicts probabilities that are then converted into classes, depending on the study. Herein, the pixels were considered disturbed (i.e., infested) when the probability of infestation was greater than 50%, which is what RF does by default.
To avoid overfitting, one of the most useful methods is k-fold cross-validation (k-fold CV [50]) that splits the training set into K number of subsets, called folds [24]. When k is equal to the number of samples in the reference dataset this method is called leave-one-out (LOO). Using LOO CV, the model was iteratively trained on data from all the points except one, which was instead used to apply the model and finally construct a confusion matrix [52]. Thus, the performance of the model was evaluated on never-seen-before data.
The models and accuracy assessment were implemented for both 2021 and 2022 using the respective predictors (Table 2). Both models were then applied across the whole study area to predict infestation spots in 2021 and 2022. To assess the accuracy of our models we calculated the following accuracy metrics for the model [53]: (i) the overall accuracy (OA), which refers to the proportion of reference sites that were correctly classified by the model, (ii) the omission errors (omissions), which refer to reference sites that were not included (omitted) in the correct class by the model (false negatives for a certain class), (iii) the commission errors (commissions), which refer to reference sites incorrectly included in a class by the model (false positives for a certain class), (iv) the producer’s accuracy (PA), which represents the probability that a certain land cover or feature on the ground is correctly classified on the map, and (v) the consumer’s accuracy (CA), which represents the probability that a certain class predicted on the map will represent a land cover or feature actually present on the ground. PA is based on the reference sites and is calculated as 100%-omissions (number of correctly classified reference sites divided by the total number of reference sites for that class), while CA is based on the classified sites and is calculated as 100%-commissions (the number of correct classifications for a particular class divided by the number of total classifications for that class).
Finally, the 93 harmonic and medoid predictors used were studied to define their contribution to increasing the accuracy of the model. To do so, the variables’ importance was assessed in terms of the Gini index (GI). The greater the GI of a specific variable, the greater the contribution of that variable to increasing the performance of the model. The importance of the variables, according to the GI, is shown in Figure 5.
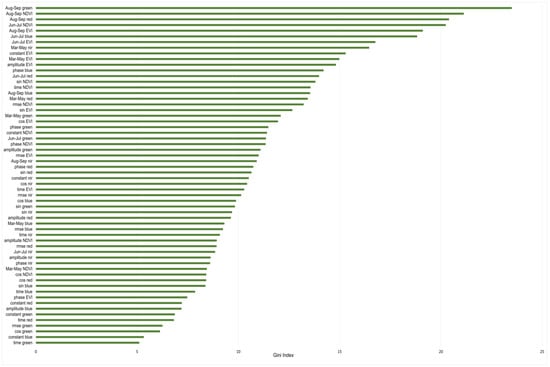
Figure 5.
Rank of importance of the predictors used in the RF model, according to their GI.
3. Results
The probability of infestation was calculated for the whole study area. A predicted map of the probability of infestation, for the year 2022, over the areas covered by spruce can be seen in Figure 6.
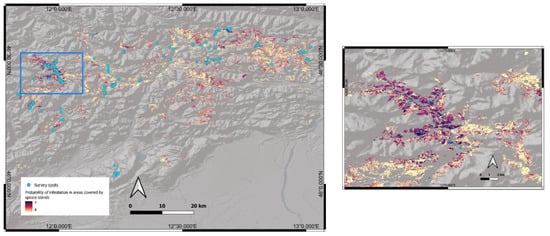
Figure 6.
Predicted map of the probability of infestation, for the year 2022, extracted from the model and applied on spruce-covered areas (forest cover data from the Veneto Region geoportal, https://idt2.regione.veneto.it/idt/webgis/viewer?webgisId=147, accessed on 9 January 2023), with a detail on the right.
For the 95 survey spots of 2021, omissions were 22%, commissions were 36%, and the overall accuracy was 59%. For the 76 survey spots in 2022, omissions were 11%, commissions were 23%, and the overall accuracy was 74%. For 2021 the PA was 78% for the infested spots and 26% for the healthy ones, while the CA was 64% and 41%, respectively. For 2022 the PA was 89% for the infested spots and 36% for the healthy ones, while the CA was 77% and 57%, respectively, for the two spot types. The producer and consumer accuracies were lower for 2021 compared to 2022. In both cases, the PA and CA were lower for the healthy spots. The confusion matrices that resulted from the RF model and the accuracy results, for both reference years, are shown in Table 3.
Table 3.
Confusion matrices and summary of the accuracy metrics that resulted from the RF model, for 2021 (top) and 2022 (bottom).
4. Discussion
The increasing occurrence and intensity of extreme disturbances pose a serious threat to forests, eliciting further stress factors such as pest outbreaks. Rapid gathering of information about the occurrence and distribution of bark beetle outbreaks is fundamental for providing a reliable assessment of the related overall environmental and economic issues and better design management strategies to contain the damage. RS methods have proven to be time- and cost-efficient tools for the detection of forest disturbances distribution and occurrence [13,18,24,28,31]. In this work, an analysis of multitemporal and seasonal composites of Sentinel-2 predictors was conducted, and an automatic classification model was applied to predict the occurrence of Ips typographus infestation spots, giving an overall accuracy of 74% and 59% in 2022 and 2021, respectively. The model was validated with ground truth points collected during field surveys in forests of the north-eastern Italian regions of Veneto and Friuli-Venezia Giulia.
The time-series spectral profiles highlighted by the harmonic functions of the predictors considered in our work (Figure 4) are consistent with previous studies [54,55], with a higher Sentinel-2 cloudless imagery availability in spring and summer and also higher values of photosynthetic activity due to the vegetative phenological phase. For the year 2021, the proportion of infested ground points (63%) was lower than in 2022 (71%). Similarly, the accuracy was lower for 2021, suggesting that our model commits more errors in the infested class. The differences between the number of spot types for both years also reflects on the PA and CA, which were always higher for the infested spots (PA of 78% for 2021 and 89% for 2022, and CA of 64% for 2021 and 77% for 2022), confirming that lower accuracy was reached in the infested class.
The infestation spots occurring in the forest can have heterogeneous characteristics, both for the variable density of infested trees and the coexistence of different stages of infestation (Figure 1). Of the total infested spots, 35% were in the gray phase, 44% were in the red and brown phase, and 21% were in the green phase (see Table 1). This source of variability can reduce the accuracy of the classification model, as the spots with moderate damage are more difficult to detect. Moreover, two mixed classes (green–brown and brown–gray spots) were also registered in 2021, increasing the level of variability for the infested spots. This could lead to a higher error of the classification and could thus be a reason for the lower OA of 2021 with respect to that of 2022. Stratifying the analysis for different stages of infestation could be interesting. However, in this study, we did not have enough data to do so (60 infested spots for 2021 and 54 infested spots for 2022), so we left the attempt to future studies.
Of the infested spots, 70% were small (between 5 and 50 infested trees), followed by 21% that were medium (between 50 and 200 trees) and 9% that were large (more than 200 trees). Previous studies that applied time-series analysis on Sentinel-2 imagery at 10-20 m spatial resolution to detect I. typographus outbreaks, focused on medium to large infestation spots with homogeneous infestation conditions. Nardi et al. [40] considered infestation spots to be only those with a surface area greater than 0.1 ha, mapping the infestation occurrences with a 1 km grid resolution. Fernandez-Carrillo et al. [25] used records of salvage-cutting and clear-cuts, together with a forest stand map derived from a forest management plan, as information on damage occurrence for the ground truth dataset. These data considered the occurrence of damage in the given stand in which their ground truth point fell, so the model was validated with information representing the mean healthy conditions of the whole stand, and not on the damage occurrence at the actual position of the ground truth point, as we did in our study. Indeed, while these authors obtained overall accuracies of over 90% for the infested (damaged) class, they were focusing their analysis on regions in which infestations were already widespread.
Fernandez-Carrillo et al. [25] obtained higher accuracies for the class of the most severely damaged forest, with respect to the non-damaged class (healthy) and for the moderate and minor damaged classes. This is also supported by Yang [30], who performed a time-series analysis of Sentinel-2 imagery on small areas (20 × 20 km and 8 × 4 km) in Sweden. The author applied a maximum likelihood classification method (MLC) and an RF classification method, considering various vegetation indices as variables and obtaining 89% and 85% total accuracy, respectively, for the gray phase class (the most severe form of damage of bark beetle infestations). For the green phase (moderate damage class) the accuracies were lower and inconsistent, ranging from 50% to 88%. Candotti et al. [14] also conducted a time-series analysis on Sentinel-2 images collected with a monthly time step for the summer period (July to September) in the years 2017 to 2020 over a vast area in Friuli-Venezia Giulia (Italy). The authors assigned forest cover classes to each pixel and compared four machine-learning methods (RF, k-NN, SVM, and ANN). As reference, they employed orthophotos provided by the Regional Infrastructure of Environmental and Territorial Data and used reference polygons of 30 × 30 m (3 × 3 pixels) to train and test the models. They obtained overall accuracies over 80%, with higher false positives for the “stressed” class, meaning that not all the pixels classified as “stressed” developed more severe infestation symptoms (commission errors between 10% and 20%). Indeed, marginal areas, forest areas with moderate damage, different stressors than bark beetles’ colonization, or even low tree density can create confusion in the classification, causing more false positives (commission errors). As stated by [25]: “the overall metrics tend to be lower in those products where complex intermediate classes are more frequent than extremes that are easier to identify”.
Despite the more complex situations and intermediate classes (moderate and minor damaged forest) that were the focus of our study, for 2022 we obtained accuracies (commissions errors = 23%) similar to those obtained by Nardi et al. [40] (24.10% commission error for the infestation class) and Fernandez-Carrillo et al. [25] (a mean commission error of 20% for the minor and the moderate damage class). In terms of PA and CA, we obtained results (PA of 78% and 89% for the infested class in 2021 and 2022, respectively; CA of 64% and 77% for the infested class in 2021 and 2022, respectively), comparable to those of Dalponte et al. [28] for the early stages of infestation and moderate severity of symptoms. The authors obtained PA of 75.0% for the healthy class (CA of 69.5%), 77.0% for the early stage of infestation (CA of 75.3%) and 85.9% for the late stage of infestation (CA of 87.1%) for their classification map of bark beetles’ infestation at the single-tree level. This confirms that the 10 × 10 m resolution of the Sentinel-2 imagery can contain the spectral information of more than one tree crown, making it more difficult to obtain information on moderate infestation damages on smaller spots.
The results we obtained are similar to those obtained by Abdullah et al. [31] on I. typographus infestations in the Bavarian Forest National Park (Germany), who focused on the detection of green-phase infested trees using Sentinel-2 imagery at a 20 m pixel resolution and plots of 30 × 30 m as ground truth points. The authors obtained a 67% accuracy, calculated by dividing the total number of correctly matched pixels by the total number of ground truth pixels. This also validates our results (showing a higher accuracy) in the ability to highlight areas that are affected by European spruce bark beetle attack, even in smaller spots with moderate or mixed damage conditions.
As a result, our finding suggests that remote sensing and Sentinel-2 imagery, in particular, can also support the monitoring at the early stage of infestations, when a very small percentage of trees are damaged. On the other hand, remote-sensing-derived products are subject to multiple classification errors, and more detailed analysis in the field is needed. However, the maps presented herein can be used to select areas in which to focus the field analysis, decreasing the associated effort and cost. Parisi et al. [56] employed a time-series of Sentinel-2 images to monitor biodiversity in a forest environment, using similar predictors to those used in this study, and they faced the same limitations. Indeed, while satellite data cannot completely replace field surveys, they can be used at different spatial and temporal scales to overcome fieldwork limitations.
The infestation spots considered in this study were selected, among those easily accessible and easily localized, having characteristics as homogeneous as possible (every infestation spot resulting with red crowns at the end of summer) and trying to avoid single trees or spots smaller than 100 m2, as stated in Section 2.2. It is possible, however, that some of these factors affected the accuracy of the model, especially because of the presence of healthy trees within the pixels containing the infestation spots. The mismatch between number of reference spots in the infested and healthy classes (63% infested and 37% healthy spots for 2021, 71% infested and 29% healthy spots for 2022) could also have affected the accuracy. Further efforts should be made to gather a more balanced reference dataset. According to Dalponte et al. [18], Giannetti et al. [23], and Vaglio Laurin et al. [57], other factors to consider are the location of the spots, especially if distributed along steep slopes, on north-exposed faces, or on the forest edges near roads and open areas. In addition, there is the possibility that some of the spots that were infested in 2021 could have been clear-cut during 2022, changing the land surface condition in the images’ time-series from infested trees to bare soil and therefore affecting the quality of the 2022 map [22]. Moreover, all the studies mentioned considered a smaller study area than ours (over 600 ha study area) and had access to a more extensive reference data, usually from high resolution aerial photos. In fact, another limitation of our study could be the limited sample of ground survey points used for training and validation, although they were collected on a vast area. This could be addressed in further research by employing more people on the territory and for a longer period of time, to create a bigger reference dataset. This could also allow specific analyses to be conducted for the detection of different stages of infestation, thus providing further helpful information for forest management. To improve this method of detection of pest outbreaks by RS, the acquisition of further and updated auxiliary data about land cover and forest management practices should be considered. This type of data, often recorded by forest operators and public bodies, can be a valuable source for the validation of the results of RS applications [54]. Precise information about forest categories, the occurrence of different kinds of disturbances, vegetation, and management practices, such as harvest data, could be really helpful in reducing the noise due to mixed and inhomogeneous conditions and thus increasing the accuracy of the model. Indeed, all of the studies mentioned above used supervised classification methods or updated land-cover auxiliary data to mask the areas not covered by spruce, so that they could better define their areas of interest and avoid false positives [14,25,28,30,31,40]. In our case, a similar and reliable land-cover dataset was not available to define the spruce-covered forest areas. So, the creation of such a solid auxiliary database would be a decisive gain, providing additional information needed for the development of methods exploiting RS data for monitoring bark beetle outbreaks [27,58].
The integration of imagery with a higher spatial resolution, such as that acquired by aircraft or drones, could also increase the detection accuracy, especially if focused on those areas that are more difficult to access in the field and those for which the satellite imagery misses information (e.g., north-exposed shadowed areas), or in which there are infestation spots with a low density of infested trees. This could also compensate for the limited possibility of collecting a large number of ground survey points evenly on a vast area.
5. Conclusions
On-site surveys to monitor and collect data on infestation spots’ occurrence and features constitute a valuable and precise source of information, but they are also time- and cost-consuming, and difficult to conduct extensively on large areas. RS methods provide objectives and time-efficient measures of forest structure, health, and management that can be used to support and integrate field-survey information on large regions, reducing efforts and costs related to field operations [19,25]. This study confirms that Sentinel-2 imagery can support the identification of infestation hotspots even when having heterogeneous characteristics and variable conditions of damage, and consequently guide the selection of areas in which to concentrate field work or, more in general, more detailed monitoring, thus helping management and salvage operations [29]. While Sentinel-2 data alone are not sufficient for comprehensive mapping of single damaged trees, the methodology proposed herein can be considered a valuable tool for the forest operators involved in the field monitoring and management of outbreaks, to identify infestation spots or, vice versa, areas where infestation is very unlikely. Although we did not achieve high accuracy, the infestation maps produced by exploiting the introduced approach represent a useful tool for managing forests and promptly reacting in the case of infestation. First, infestation maps can be updated yearly, which is definitely a main requirement to comprehensively monitor forest health status. Second, the maps provided information for entire areas of interest, while ground data can be acquired only for small samples, due to the costs and efforts associated with field surveys. Although single pixel accuracy can be low, looking at the map over a large area is helpful in assessing the general situation of the forest and the progress of the infestation, and also in making comparisons with maps produced for previous years. Therefore, this implementation of RS data has important implications for monitoring forest disturbances due to insect outbreaks, increasing the amount of information acquired and decreasing the level of effort required by in-field operators.
The herein proposed methodology could be improved by obtaining a solid and updated auxiliary dataset about land cover and forest management practices of the areas of interest. Further studies that integrate both satellite and UAV imagery should be considered, to improve the detection accuracy. Future studies should also question and determine which are the main factors that drive the bark beetle expansion, especially after extreme events, focusing on forest composition and stand densities [17]. Considering these factors could help to understand the population dynamics after major disturbances in large areas, allowing us to better classify and manage areas requiring prompt interventions, and promptly apply the most suitable silvicultural practices to minimize further damage by bark beetle outbreaks.
Author Contributions
Conceptualization, A.B. (Aurora Bozzini) and S.F.; methodology, A.B. (Aurora Bozzini) and S.F.; software and validation, S.F.; formal analysis, S.F.; investigation, A.B. (Aurora Bozzini); data curation, A.B. (Aurora Bozzini); writing—original draft preparation, A.B. (Aurora Bozzini); writing—review and editing, S.F., G.C., A.B. (Andrea Battisti) and M.F.; visualization, A.B. (Aurora Bozzini); supervision, G.C., A.B. (Andrea Battisti) and M.F.; funding acquisition, A.B. (Andrea Battisti) and M.F. All authors have read and agreed to the published version of the manuscript.
Funding
This research was carried out within a grant of the Regione del Veneto Servizi Fitosanitari and a grant from DAFNAE DOR UNIPD. The work is framed within the Agritech National Research Center that received funding from the European Union Next-GenerationEU (Piano Nazionale di Ripresa e Resilienza (PNRR)—Missione 4 Componente 2, Investimento 1.4–D.D. 1032 17 June 2022, CN00000022). This manuscript reflects only the authors’ views and opinions; neither the European Union nor the European Commission can be considered responsible for them.
Data Availability Statement
Sentinel-2 data is open access and was assessed using Google Earth Engine: https://developers.google.com/earth-engine/datasets/catalog/COPERNICUS_S2_SR_HARMONIZED, accessed on 23 February 2023. More information is available at the following link: https://developers.google.com/earth-engine/datasets/catalog/COPERNICUS_S2_SR, accessed on 23 February 2023.
Acknowledgments
We thank Alison Garside for linguistic proofreading the manuscript.
Conflicts of Interest
The authors declare no conflict of interest. The funders had no role in the design of the study; in the collection, analyses, or interpretation of data; in the writing of the manuscript; or in the decision to publish the results.
References
- Pureswaran, D.S.; Roques, A.; Battisti, A. Forest insects and climate change. Curr. For. Rep. 2018, 4, 35–50. [Google Scholar] [CrossRef]
- Diffenbaugh, N.S.; Singh, D.; Mankin, J.S.; Horton, D.E.; Swain, D.L.; Touma, D.; Charland, A.; Liu, Y.; Haugen, M.; Tsiang, M.; et al. Quantifying the influence of global warming on unprecedented extreme climate events. Proc. Natl. Acad. Sci. USA 2017, 114, 4881–4886. [Google Scholar] [CrossRef] [PubMed]
- Fischer, E.M.; Knutti, R. Anthropogenic contribution to global occurrence of heavy-precipitation and high-temperature extremes. Nat. Clim. Chang. 2015, 5, 560–564. [Google Scholar] [CrossRef]
- Van Oldenborgh, G.J.; Van Der Wiel, K.; Sebastian, A.; Singh, R.; Arrighi, J.; Otto, F.; Haustein, K.; Li, S.; Vecchi, G.; Cullen, H. Corrigendum: Attribution of extreme rainfall from Hurricane Harvey, August 2017. Environ. Res. Lett. 2018, 13, 019501. [Google Scholar] [CrossRef]
- Diffenbaugh, N.S. Verification of extreme event attribution: Using out-of-sample observations to assess changes in probabilities of unprecedented events. Sci. Adv. 2020, 6, 2368. [Google Scholar] [CrossRef]
- Faccoli, M. Effect of weather on Ips typographus (Coleoptera Curculionidae) phenology, voltinism, and associated spruce mortality in the Southeastern Alps. Environ. Entomol. 2009, 38, 307–316. [Google Scholar] [CrossRef]
- Jakus, R.; Zajíčkova, L.; Cudlín, P.; Blaženec, M.; Turčani, M.; Ježík, M.; Lieutier, F.; Schlyter, F. Landscape-scale Ips typographus attack dynamics: From monitoring plots to GIS-based disturbance models. iForest 2011, 4, 256–261. [Google Scholar] [CrossRef]
- Marini, L.; Ayres, M.P.; Battisti, A.; Faccoli, M. Climate affects severity and altitudinal distribution of outbreaks in an eruptive bark beetle. Clim. Chang. 2012, 115, 327–341. [Google Scholar] [CrossRef]
- Wichmann, L.; Ravn, H.P. The spread of Ips typographus (L.) (Coleoptera, Scolytidae) attacks following heavy windthrow in Denmark, analysed using GIS. For. Ecol. Manag. 2011, 148, 31–39. [Google Scholar] [CrossRef]
- Wermelinger, B. Ecology and management of the spruce bark beetle Ips typographus—A review of recent research. For. Ecol. Manag. 2004, 202, 67–82. [Google Scholar] [CrossRef]
- Soukhovolsky, V.; Kovalev, A.; Tarasova, O.; Modlinger, R.; Křenová, Z.; Mezei, P.; Škvarenina, J.; Rožnovský, J.; Korolyova, N.; Majdák, A.; et al. Wind damage and temperature effect on tree mortality caused by Ips typographus L.: Phase transition model. Forests 2022, 13, 180. [Google Scholar] [CrossRef]
- Trubin, A.; Mezei, P.; Zabihi, K.; Surový, P.; Jakuš, R. Northernmost European spruce bark beetle Ips typographus outbreak: Modelling tree mortality using remote sensing and climate data. For. Ecol. Manag. 2022, 505, 119829. [Google Scholar] [CrossRef]
- Nardi, D.; Finozzi, V.; Battisti, A. Massive windfalls boost an ongoing spruce bark beetle outbreak in the Southern Alps. Ital. J. For. Mt. Environ. 2022, 77, 23–34. [Google Scholar] [CrossRef]
- Candotti, A.; De Giglio, M.; Dubbini, M.; Tomelleri, E. A Sentinel-2 based multi-temporal monitoring framework for wind and bark beetle detection and damage mapping. Remote Sens. 2022, 14, 6105. [Google Scholar] [CrossRef]
- Jakuš, R.; Edwards-Jonášová, M.; Cudlín, P.; Blaženec, M.; Ježík, M.; Havlíček, F.; Moravec, I. Characteristics of Norway spruce trees (Picea abies) surviving a spruce bark beetle (Ips typographus L.) outbreak. Trees 2011, 25, 965–973. [Google Scholar] [CrossRef]
- Mezei, P.; Grodzki, W.; Blaženec, M.; Škvarenina, J.; Brandýsová, V.; Jakuš, R. Host and site factors affecting tree mortality caused by the spruce bark beetle (Ips typographus) in mountainous conditions. For. Ecol. Manag. 2014, 331, 196–207. [Google Scholar] [CrossRef]
- Faccoli, M.; Bernardinelli, I. Composition and elevation of spruce forests affect susceptibility to bark beetle attacks: Implications for forest management. Forests 2014, 5, 88–102. [Google Scholar] [CrossRef]
- Dalponte, M.; Marzini, S.; Solano-Correa, Y.T.; Tonon, G.; Vescovo, L.; Gianelle, D. Mapping forest windthrows using high spatial resolution multispectral satellite images. Int. J. Appl. Earth Obs. Geoinf. 2020, 93, 102206. [Google Scholar] [CrossRef]
- Bárta, V.; Hanuš, J.; Dobrovolný, L.; Homolová, L. Comparison of field survey and remote sensing techniques for detection of bark beetle-infested trees. For. Ecol. Manag. 2022, 506, 119984. [Google Scholar] [CrossRef]
- Abdullah, H.J. Remote Sensing of European Spruce (Ips typographus, L.) Bark Beetle Green Attack. Ph.D. Thesis, University of Twente, Enschede, The Netherlands, 2019. [Google Scholar] [CrossRef]
- Francini, S.; McRoberts, R.E.; Giannetti, F.; Marchetti, M.; Scarascia Mugnozza, G.; Chirici, G. The Three Indices Three Dimensions (3I3D) algorithm: A new method for forest disturbance mapping and area estimation based on optical remotely sensed imagery. Int. J. Remote Sens. 2021, 42, 4693–4711. [Google Scholar] [CrossRef]
- Cavalli, A.; Francini, S.; Cecili, G.; Cocozza, C.; Congedo, L.; Falanga, V.; Spadoni, G.L.; Maesano, M.; Munafò, M.; Chirici, G.; et al. Afforestation monitoring through automatic analysis of 36-years Landsat Best Available Composites. iForest 2022, 15, 220–228. [Google Scholar] [CrossRef]
- Giannetti, F.; Pecchi, M.; Travaglini, D.; Francini, S.; D’Amico, G.; Vangi, E.; Cocozza, C.; Chirici, G. Estimating VAIA windstorm damaged forest area in Italy using time series Sentinel-2 imagery and continuous change detection algorithms. Forests 2021, 12, 680. [Google Scholar] [CrossRef]
- Vaglio Laurin, G.; Puletti, N.; Tattoni, C.; Ferrara, C.; Pirotti, F. Estimated biomass loss caused by the Vaia windthrow in Northern Italy: Evaluation of active and passive remote sensing options. Remote Sens. 2021, 13, 4924. [Google Scholar] [CrossRef]
- Fernandez-Carrillo, A.; Patočka, Z.; Dobrovolný, L.; Franco-Nieto, A.; Revilla-Romero, B. Monitoring bark beetle forest damage in Central Europe. A remote sensing approach validated with field data. Remote Sens. 2020, 12, 3634. [Google Scholar] [CrossRef]
- Gomez, D.F.; Ritger, H.M.W.; Pearce, C.; Eickwort, J.; Hulcr, J. Ability of remote sensing systems to detect bark beetle spots in the Southeastern US. Forests 2020, 11, 1167. [Google Scholar] [CrossRef]
- Hammarlund, P.E. Detecting Spruce Bark Beetle Infestations with Satellite Imagery. Master’s Thesis, KTH Royal Institute of Technology, Stockholm, Sweden, 2020. [Google Scholar]
- Dalponte, M.; Tatiana Solano-Correa, Y.; Frizzera, L.; Gianelle, D. Mapping a European spruce bark beetle outbreak using Sentinel-2 remote sensing data. Remote Sens. 2022, 14, 3135. [Google Scholar] [CrossRef]
- Parisi, F.; Francini, S.; Borghi, C.; Chirici, G. An open and georeferenced dataset of forest structural attributes and microhabitats in central and southern Apennines (Italy). Data Brief 2022, 43, 108445. [Google Scholar] [CrossRef]
- Yang, S. Detecting Bark Beetle Damage with Sentinel-2 Multi-Temporal Data in Sweden. Master’s Thesis, Lund University, Lund, Sweden, 2019. [Google Scholar]
- Abdullah, H.; Skidmore, A.K.; Darvishzadeh, R.; Heurich, M. Sentinel-2 accurately maps green-attack stage of European spruce bark beetle (Ips typographus, L.) compared with Landsat-8. Remote Sens. Ecol. Conserv. 2018, 5, 87–106. [Google Scholar] [CrossRef]
- Näsi, R.; Honkavaara, E.; Lyytikäinen-Saarenmaa, P.; Blomqvist, M.; Litkey, P.; Hakala, T.; Viljanen, N.; Kantola, T.; Tanhuanpää, T.; Holopainen, M. Using UAV-based photogrammetry and hyperspectral imaging for mapping bark beetle damage at tree-level. Remote Sens. 2015, 7, 15467–15493. [Google Scholar] [CrossRef]
- Klouček, T.; Komárek, J.; Surový, P.; Hrach, K.; Janata, P.; Vašíček, B. The use of UAV mounted sensors for precise detection of bark beetle infestation. Remote Sens. 2019, 11, 1561. [Google Scholar] [CrossRef]
- Honkavaara, E.; Näsi, R.; Oliveira, R.; Viljanen, N.; Suomalainen, J.; Khoramshahi, E.; Hakala, T.; Nevalainen, O.; Markelin, L.; Vuorinen, M.; et al. Using multitemporal hyper- and multispectral UAV imaging for detecting bark beetle infestation on Norway spruce. Int. Arch. Photogramm. Remote Sens. 2020, 43, 429–434. [Google Scholar] [CrossRef]
- Näsi, R.; Honkavaara, E.; Blomqvist, M.; Lyytikäinen-Saarenmaa, P.; Hakala, T.; Viljanen, N.; Kantola, T.; Holopainen, M. Remote sensing of bark beetle damage in urban forests at individual tree level using a novel hyperspectral camera from UAV and aircraft. Urban For. Urban Green. 2018, 30, 72–83. [Google Scholar] [CrossRef]
- Turkulainen, E. Comparison of Deep Neural Networks in Classification of Spruce Trees Damaged by the Bark Beetle Using UAS RGB, Multi- and Hyperspectral Imagery. Master’s Thesis, Aalto University, Espoo, Finland, 2023. [Google Scholar]
- Havašová, M.; Bucha, T.; Ferenčík, J.; Jakuš, R. Applicability of a vegetation indices-based method to map bark beetle outbreaks in the High Tatra Mountains. Ann. For. Res. 2015, 58, 295–310. [Google Scholar] [CrossRef]
- Kranjčić, N.; Rezo, M. Satellite-based hyperspectral imaging and cartographic visualization of bark beetle forest damage for the city of Čabar. Teh. Glas. 2018, 12, 39–43. [Google Scholar] [CrossRef]
- Spruce, J.P.; Hicke, J.A.; Hargrove, W.W.; Grulke, N.E.; Meddens, A.J.H. Use of MODIS NDVI products to map tree mortality levels in forests affected by mountain pine beetle outbreaks. Forests 2019, 10, 811. [Google Scholar] [CrossRef]
- Nardi, D.; Jactel, H.; Pagot, E.; Samalens, J.-C.; Marini, L. Drought and stand susceptibility to attacks by the European spruce bark beetle: A remote sensing approach. Agric. For. Entomol. 2022, 25, 119–129. [Google Scholar] [CrossRef]
- Francini, S.; D’amico, G.; Vangi, E.; Borghi, C.; Chirici, G. Integrating GEDI and Landsat: Spaceborne Lidar and four decades of optical imagery for the analysis of forest disturbances and biomass changes in Italy. Sensors 2022, 22, 2015. [Google Scholar] [CrossRef]
- Francini, S.; McRoberts, R.E.; Giannetti, F.; Mencucci, M.; Marchetti, M.; Scarascia Mugnozza, G.; Chirici, G. Near-real time forest change detection using PlanetScope imagery. Eur. J. Remote Sens. 2020, 53, 233–244. [Google Scholar] [CrossRef]
- Francini, S.; McRoberts, R.E.; D’Amico, G.; Coops, N.C.; Hermosilla, T.; White, J.C.; Wulder, M.A.; Marchetti, M.; Scarascia Mugnozza, G.; Chirici, G. An open science and open data approach for the statistically robust estimation of forest disturbance areas. Int. J. Appl. Earth Obs. Geoinf. 2022, 106, 102663. [Google Scholar] [CrossRef]
- Huo, L.; Persson, H.J.; Lindberg, E. Early detection of forest stress from European spruce bark beetle attack, and a new vegetation index: Normalized distance red & SWIR (NDRS). Remote Sens. Environ. 2021, 255, 112240. [Google Scholar] [CrossRef]
- Abdullah, H.J.; Skidmore, A.K.; Darvishzadeh, R.; Heurich, M. Timing of red-edge and shortwave infrared reflectance critical for early stress detection induced by bark beetle (Ips typographus, L.) attack. Int. J. Appl. Earth Obs. Geoinf. 2019, 82, 101900. [Google Scholar] [CrossRef]
- Matsushita, B.; Yang, W.; Chen, J.; Onda, Y.; Qiu, G. Sensitivity of the Enhanced Vegetation Index (EVI) and Normalized Difference Vegetation Index (NDVI) to topographic effects: A case study in high-density cypress forest. Sensors 2007, 7, 2636–2651. [Google Scholar] [CrossRef] [PubMed]
- Shumway, R.H.; Stoffer, D.S. Spectral analysis and filtering. In Time Series Analysis and Its Applications, 4th ed.; DeVeaux, R., Fienberg, S.E., Olkin, I., Eds.; Springer Texts in Statistics; Springer: Cham, Switzerland, 2017; pp. 194–211. [Google Scholar] [CrossRef]
- Kennedy, R.E.; Yang, Z.; Gorelick, N.; Braaten, J.; Cavalcante, L.; Cohen, W.B.; Healey, S. Implementation of the LandTrendr algorithm on Google Earth Engine. Remote Sens. 2018, 10, 691. [Google Scholar] [CrossRef]
- Breiman, L. Random forests. Mach. Learn. 2001, 45, 5–32. [Google Scholar] [CrossRef]
- Hawryło, P.; Francini, S.; Chirici, G.; Giannetti, F.; Parkitna, K.; Krok, G.; Mitelsztedt, K.; Lisańczuk, M.; Stereńczak, K.; Ciesielski, M.; et al. The use of remotely sensed data and Polish NFI Plots for prediction of growing stock volume using different predictive methods. Remote Sens. 2020, 12, 3331. [Google Scholar] [CrossRef]
- Hermosilla, T.; Bastyr, A.; Coops, N.C.; White, J.C.; Wulder, M.A. Mapping the presence and distribution of tree species in Canada’s forested ecosystems. Remote Sens. Environ. 2023, 282, 113276. [Google Scholar] [CrossRef]
- D’Amico, G.; Francini, S.; Giannetti, F.; Vangi, E.; Travaglini, D.; Chianucci, F.; Mattioli, W.; Grotti, M.; Puletti, N.; Corona, P.; et al. A deep learning approach for automatic mapping of poplar plantations using Sentinel-2 imagery. GISci. Remote Sens. 2021, 58, 1352–1368. [Google Scholar] [CrossRef]
- Francini, S.; Chirici, G. A Sentinel-2 derived dataset of forest disturbances occurred in Italy between 2017 and 2020. Data Brief 2022, 42, 108297. [Google Scholar] [CrossRef]
- Lastovicka, J.; Svec, P.; Paluba, D.; Kobliuk, N.; Svoboda, J.; Hladky, R.; Stych, P. Sentinel-2 data in an evaluation of the impact of the disturbances on forest vegetation. Remote Sens. 2020, 12, 1914. [Google Scholar] [CrossRef]
- Löw, M.; Koukal, T. Phenology modelling and forest disturbance mapping with Sentinel-2 time series in Austria. Remote Sens. 2020, 12, 4191. [Google Scholar] [CrossRef]
- Parisi, F.; Vangi, E.; Francini, S.; D’Amico, G.; Chirici, G.; Marchetti, M.; Lombardi, F.; Travaglini, D.; Ravera, S.; De Santis, E.; et al. Sentinel-2 time series analysis for monitoring multi-taxon biodiversity in mountain beech forests. Front. For. Glob. Chang. 2023, 6, 1020477. [Google Scholar] [CrossRef]
- Vaglio Laurin, G.; Francini, S.; Luti, T.; Chirici, G.; Pirotti, F.; Papale, D. Satellite open data to monitor forest damage caused by extreme climate-induced events: A case study of the Vaia storm in Northern Italy. Forestry 2021, 94, 407–416. [Google Scholar] [CrossRef]
- Rodman, K.C.; Andrus, R.A.; Butkiewicz, C.L.; Chapman, T.B.; Gill, N.S.; Harvey, B.J.; Kulakowski, D.; Tutland, N.J.; Veblen, T.T.; Hart, S.J. Effects of bark beetle outbreaks on forest landscape pattern in the Southern Rocky Mountains, U.S.A. Remote Sens. 2021, 13, 1089. [Google Scholar] [CrossRef]
Disclaimer/Publisher’s Note: The statements, opinions and data contained in all publications are solely those of the individual author(s) and contributor(s) and not of MDPI and/or the editor(s). MDPI and/or the editor(s) disclaim responsibility for any injury to people or property resulting from any ideas, methods, instructions or products referred to in the content. |
© 2023 by the authors. Licensee MDPI, Basel, Switzerland. This article is an open access article distributed under the terms and conditions of the Creative Commons Attribution (CC BY) license (https://creativecommons.org/licenses/by/4.0/).