Article

Low Population Differentiation but High Phenotypic Plasticity of European Beech in Germany

1
Forest Genetics and Forest Tree Breeding, Faculty for Forest Sciences and Forest Ecology, University of Goettingen, Büsgenweg 2, 37077 Göttingen, Germany
2
University of Kassel, Mönchebergstraße 19, 34109 Kassel, Germany
3
Center for Integrated Breeding Research (CiBreed), University of Goettingen, 37073 Göttingen, Germany
*
Author to whom correspondence should be addressed.
Forests 2020, 11(12), 1354; https://doi.org/10.3390/f11121354
Submission received: 20 November 2020 / Revised: 11 December 2020 / Accepted: 16 December 2020 / Published: 18 December 2020

Abstract

:
Drought is increasingly impairing the vitality of European beech (Fagus sylvatica L.) in several regions of its distribution range. In times of climate change, adaptive traits such as plant phenology and frost tolerance are also becoming more important. Adaptive patterns of European beech seem to be complex, as contrasting results regarding the relative effect of phenotypic plasticity and genetic variation in trait variation have been reported. Here, we used a large translocation experiment comprising more than 15,500 seedlings in three regions of Germany to investigate local adaptation and phenotypic plasticity in beech. We found low population differentiation regarding plant survival, and plant height increment, but high phenotypic plasticity for these traits. Survival showed a positive correlation with temperature variables and a less pronounced and negative correlation with precipitation-related variables. This suggests a predominant effect of temperature and growing degree days on the survival of beech seedlings under moderate drought stress. The high phenotypic plasticity may help beech to cope with changing environmental conditions, albeit increasing drought stress may make adaptive changes necessary in the long term.

1. Introduction

The earth’s surface temperature has increased since the industrial revolution and a further temperature increase is predicted [1]. Changing climatic conditions have different effects on forests and can affect the duration of the vegetation period, productivity and vitality of trees [2,3]. For the prediction of species ranges under rapidly changing climatic conditions, knowledge of tolerance and adaptive capacity of populations is needed [4].
European beech (Fagus sylvatica L.) is one of the most important deciduous forest tree species in Central Europe. Due to climate change, growth reduction in this species has already been detected even in the center of its distribution range [5]. Since fall 2018, an increasing dieback of beech (mainly older trees) has been observed in some parts of Germany [6]. Drought stress seems to be an important factor negatively affecting European beech. For instance, Gennaretti et al. [7] recently showed that drought has a larger impact on beech productivity compared to heat stress. In general, beech is considered to be more drought sensitive than other tree species such as Acer pseudoplatanus L., A. platanoides L., Quercus petraea (Matt.) Liebl. or Tilia cordata Mill [8,9,10]. Nevertheless, other traits such as plant phenology or frost resistance are also considered as relevant traits for climate change-related adaptation in trees including beech [11,12,13].
Trees are usually adapted to their local environments [14,15]. For European beech, however, contrasting results regarding its local adaptation were reported. For instance, higher frost tolerance of European beech from colder climates was found compared to populations from warmer climates [16]. In another study, Hofmann et al. [17] did not find a relationship between frost tolerance and climatic conditions of the populations. Both studies investigated populations from a wide range of the distribution area. Similar results were found for drought tolerance. While some studies found indications for drought adaptation in beech when investigating populations from a wide range of the distribution area, but also on a regional scale in Germany [18,19,20,21], other studies did not find such a relationship for populations in Germany [22,23,24]. Possible explanations for these differences may be the use of different traits or study designs to investigate frost or drought stress tolerance or, potentially, an overriding effect of phenotypic plasticity, but this remains open.
Besides local adaptation, phenotypic plasticity may also play a major role in climate change-related adaptation. Phenotypic plasticity may allow populations to cope with changing environmental conditions until adaptive genetic variation is restored [25,26,27]. Further, phenotypic plasticity needs to be considered when making predictions about the future performance of populations [28]. Only when phenotypic plasticity is similar among populations (i.e., population–environment interactions are missing), predictions about their performance under future environmental conditions based on trait differences among populations in one or few environments are reliable [28]. Based on a meta-analysis, Matesanz and Ramírez-Valiente [28] found that population–environment interactions were significant for at least one functional trait in the vast majority of studies investigating plant species including trees. Nevertheless, the authors also found that population–environment interactions are often not calculated in studies. For European beech, high phenotypic plasticity was reported for traits such as embolism resistance [29], bud burst timing [30,31] or response to water stress [32]. A recent study suggested that phenotypic plasticity seems to play an even more important role for European beech compared to local adaptation in response to climate change [33].
Taken together, there are still many open questions regarding patterns of adaptation in European beech. Common garden experiments are powerful approaches to investigate adaptation and phenotypic plasticity in tree species [14,34]. Here, we used a large translocation experiment to investigate local adaptation in European beech seedlings in three widely separated regions in Germany. The performance of beech seedlings originating from six different populations within the regions was assessed by analyzing plant survival and plant height increment over 3 years. Biomass or growth rate are often used as surrogates for plant fitness, and especially the size of juvenile trees may be a good predictor of future fitness (viability selection is common for seedlings and hence large plant size is favorable) [35]. In general, the juvenile stage is of major importance for the regeneration of forests and can determine the genetic composition of future stands [12,36]. Due to the climatic differences prevailing in the three regions, we hypothesize that local beech populations are better adapted and show a better performance compared to non-local populations. We further hypothesize that phenotypic plasticity can be detected expressed as different plant height increments of the populations in the three regions. The specific objectives of the study were: (I) To test whether populations show local adaptation, (II) to identify potential population–environment interactions, and to (III) find environmental variables that influence the performance of the beech seedlings in the three regions.

2. Materials and Methods

2.1. Plant Material and Study Design

Seedlings of European beech populations growing at three widely separated regions in Germany were investigated [37,38]. The populations are part of the “Biodiversity Exploratories” project (https://www.biodiversity-exploratories.de/, accessed on 17 December 2020), in which a large number of field plots are jointly investigated by different working groups [39]. The three regions Schorfheide-Chorin (SEW), Hainich-Dün (HEW), and Schwäbische Alb (AEW) are located in northeast, central and southwest Germany, respectively, with ca. 300 km distance between SEW/HEW and AEW/HEW and ca. 600 km distance between SEW and AEW (Figure 1). Within each of these regions, two populations were selected for beechnut collection (in AEW: populations A5 and A8, in HEW: H6 and H10, in SEW: S5 and S9). Thus, in total 6 populations were sampled, of which three are managed (S5, H6 and A5) and three are unmanaged populations (S9, H10 and A8) [38]. Beechnuts were collected in 2011 and germinated in a greenhouse of the department Forest Genetics and Forest Tree Breeding, University of Göttingen, as described in Müller et al. [37]. For two populations (H10 and A5), seeds collected in 2009 were also available and were germinated together with the seeds from 2011. These populations are named H10_09 and A5_09 in the following. In total, 15,930 seedlings were planted out in the three regions for the establishment of a reciprocal translocation experiment in September/October 2012. In each region, 20 plots (19 plots in AEW) were established within a radius of ca. 15 km (SEW), 20.5 km (HEW), and 10 km (AEW). The translocation experiment followed a design as described in Müller et al. [37] for the HEW region. Briefly, in each plot (within a fenced area), 36 individuals per population were planted out in four randomly placed repetitions of nine individuals, leading to a completely randomized design within plots. The plots had a size of ca. 2 × 3 m. Ground vegetation (if any) was removed before planting and during field visits for phenotypic observations. For the A5_09 population, there were not enough seedlings available. Therefore, only 10 plots per region contained seedlings of this population.
Monthly climate data for each plot for the observation period of the experiment (September 2012 to November 2015) was obtained from the Biodiversity Exploratories Instrumentation Project [40]. In total, 24 temperature- and precipitation-related climate variables such as air temperature, soil temperature, soil moisture, and precipitation were used. A full list of climate variables can be found in Table S1. For all climate variables, the means for the observation period of the experiment were calculated. The SEW region revealed the highest monthly mean temperature and lowest monthly mean precipitation (9.5 °C and 42.9 mm, respectively), followed by HEW (7.9 °C and 50.8 mm), and AEW (7.7 °C and 84.2 mm) (Figure 2a,b). For 6 climate variables (precipitation, soil moisture at 10 cm below surface, air temperature 10 cm above surface within the ground vegetation layer, air temperature at 2 m above ground, vapor pressure, and relative air humidity at 2 m above ground), mean values for the vegetation period (April to September in each year) were additionally calculated. A principal component analysis (PCA) based on all climate variables was conducted to reduce the redundancy of the data set and to obtain principal components (PCs). The PCA was conducted using the prcomp function in R v.3.6.3 [41] and visualized using the ggfortify v.0.4.10 R package [42]. In total, 4 plots in the SEW region had to be omitted in the analysis, due to missing data.

2.2. Measurement of Plant Height and Recording of Plant Survival

Plant height of all seedlings was measured in the translocation experiment in all three regions before planting as well as in fall 2014 and 2015. In the HEW region, additional height measurements were conducted in fall 2013 and March 2018. Height was measured to 0.5 cm accuracy from the ground to the beginning of the terminal bud. Seedlings with damaged terminal shoots were excluded from the analysis. Plant increment was calculated by subtracting seedling height at planting from seedling height in 2015 (for HEW also for 2018). Plant survival in the translocation experiment was recorded in all regions in early summer of 2013, 2014, and 2015.

2.3. Data Analysis

Differences in plant height increment from planting to 2015 among provenances were tested for each region with linear mixed effect models using the lmer function in the lme4 v.1.1-21 R package [44]. In the model, plant height increment was the response variable, populations the fixed effects, and plots and population–plot interactions were random variables (increment~population + (1|plot) + (1|population:plot)). Model performance was evaluated based on diagnostic plots of residuals. Pairwise differences in plant height increment of the provenances were determined using the glht function of the multcomp v.1.4-12 R package [45] with a false discovery rate (FDR) threshold of 0.05. Plant height for each year and region was analyzed accordingly, but since it was strongly correlated with plant height increment (ρ = 0.9, p < 0.0001) the results are only shown in Figure S1. Differences in plant height before planting as well as interactions between regions and populations regarding plant height increment (population–environment interactions) were tested using an ANOVA within R v.3.6.3 [41]. Diagnostic plots of residuals were used to evaluate model performance. Pairwise differences were determined using the glht function described above. Differences in plant height increment over all populations among the three regions (SEW, HEW, and AEW) were determined using the lmer and glht functions described above. In the model, plant height increment was the response variable, region the fixed effect, and plots the random variable (increment~region + (1|Plot)). The coefficient of variation (CV) was calculated for plant height increment of each population within each region using the goeveg v.0.4.2 R package [46]. Differences in CV among populations and regions were tested using a Kruskal-Wallis test with multiple comparisons implemented in the pgirmess v.1.6.9 R package [47]. Differences in plant survival of the populations were tested for each region and year using generalized mixed effects models. For this, the glmer function of the lme4 v.1.1-21 R package [44] was applied (survival~population + (1|plot) + (1|population:plot)). Model performance was evaluated based on residual plots generated with the DHARMa v.0.2.7 R package [48]. Pairwise differences in plant survival were determined with the glht function as described above. A similar approach was used to determine differences in plant survival over all populations among regions (SEW, HEW, and AEW). In the generalized mixed effects model (glmer function), plant survival was the response variable, region the fixed effect, and plots the random variable (survival~region + (1|plot)). Figures were created with the ggplot2 v.3.3.0 R package [49]. Interactions between regions and populations regarding plant survival (population–environment interactions) were determined with the glm R function (generalized linear model) and a chi-square test implemented in R v.3.6.3. Model performance was evaluated with the DHARMa v.0.2.7 R package [48]. Correlations between plant survival and plant height increment for all plots as well as for plots within regions were tested using Spearman’s rank correlation coefficients with a false discovery rate (FDR) of 0.05 implemented in the psych v.1.9.12.31 R package [50]. The same method was used to test for correlations between climate PCs and plant survival and plant height increment.

3. Results

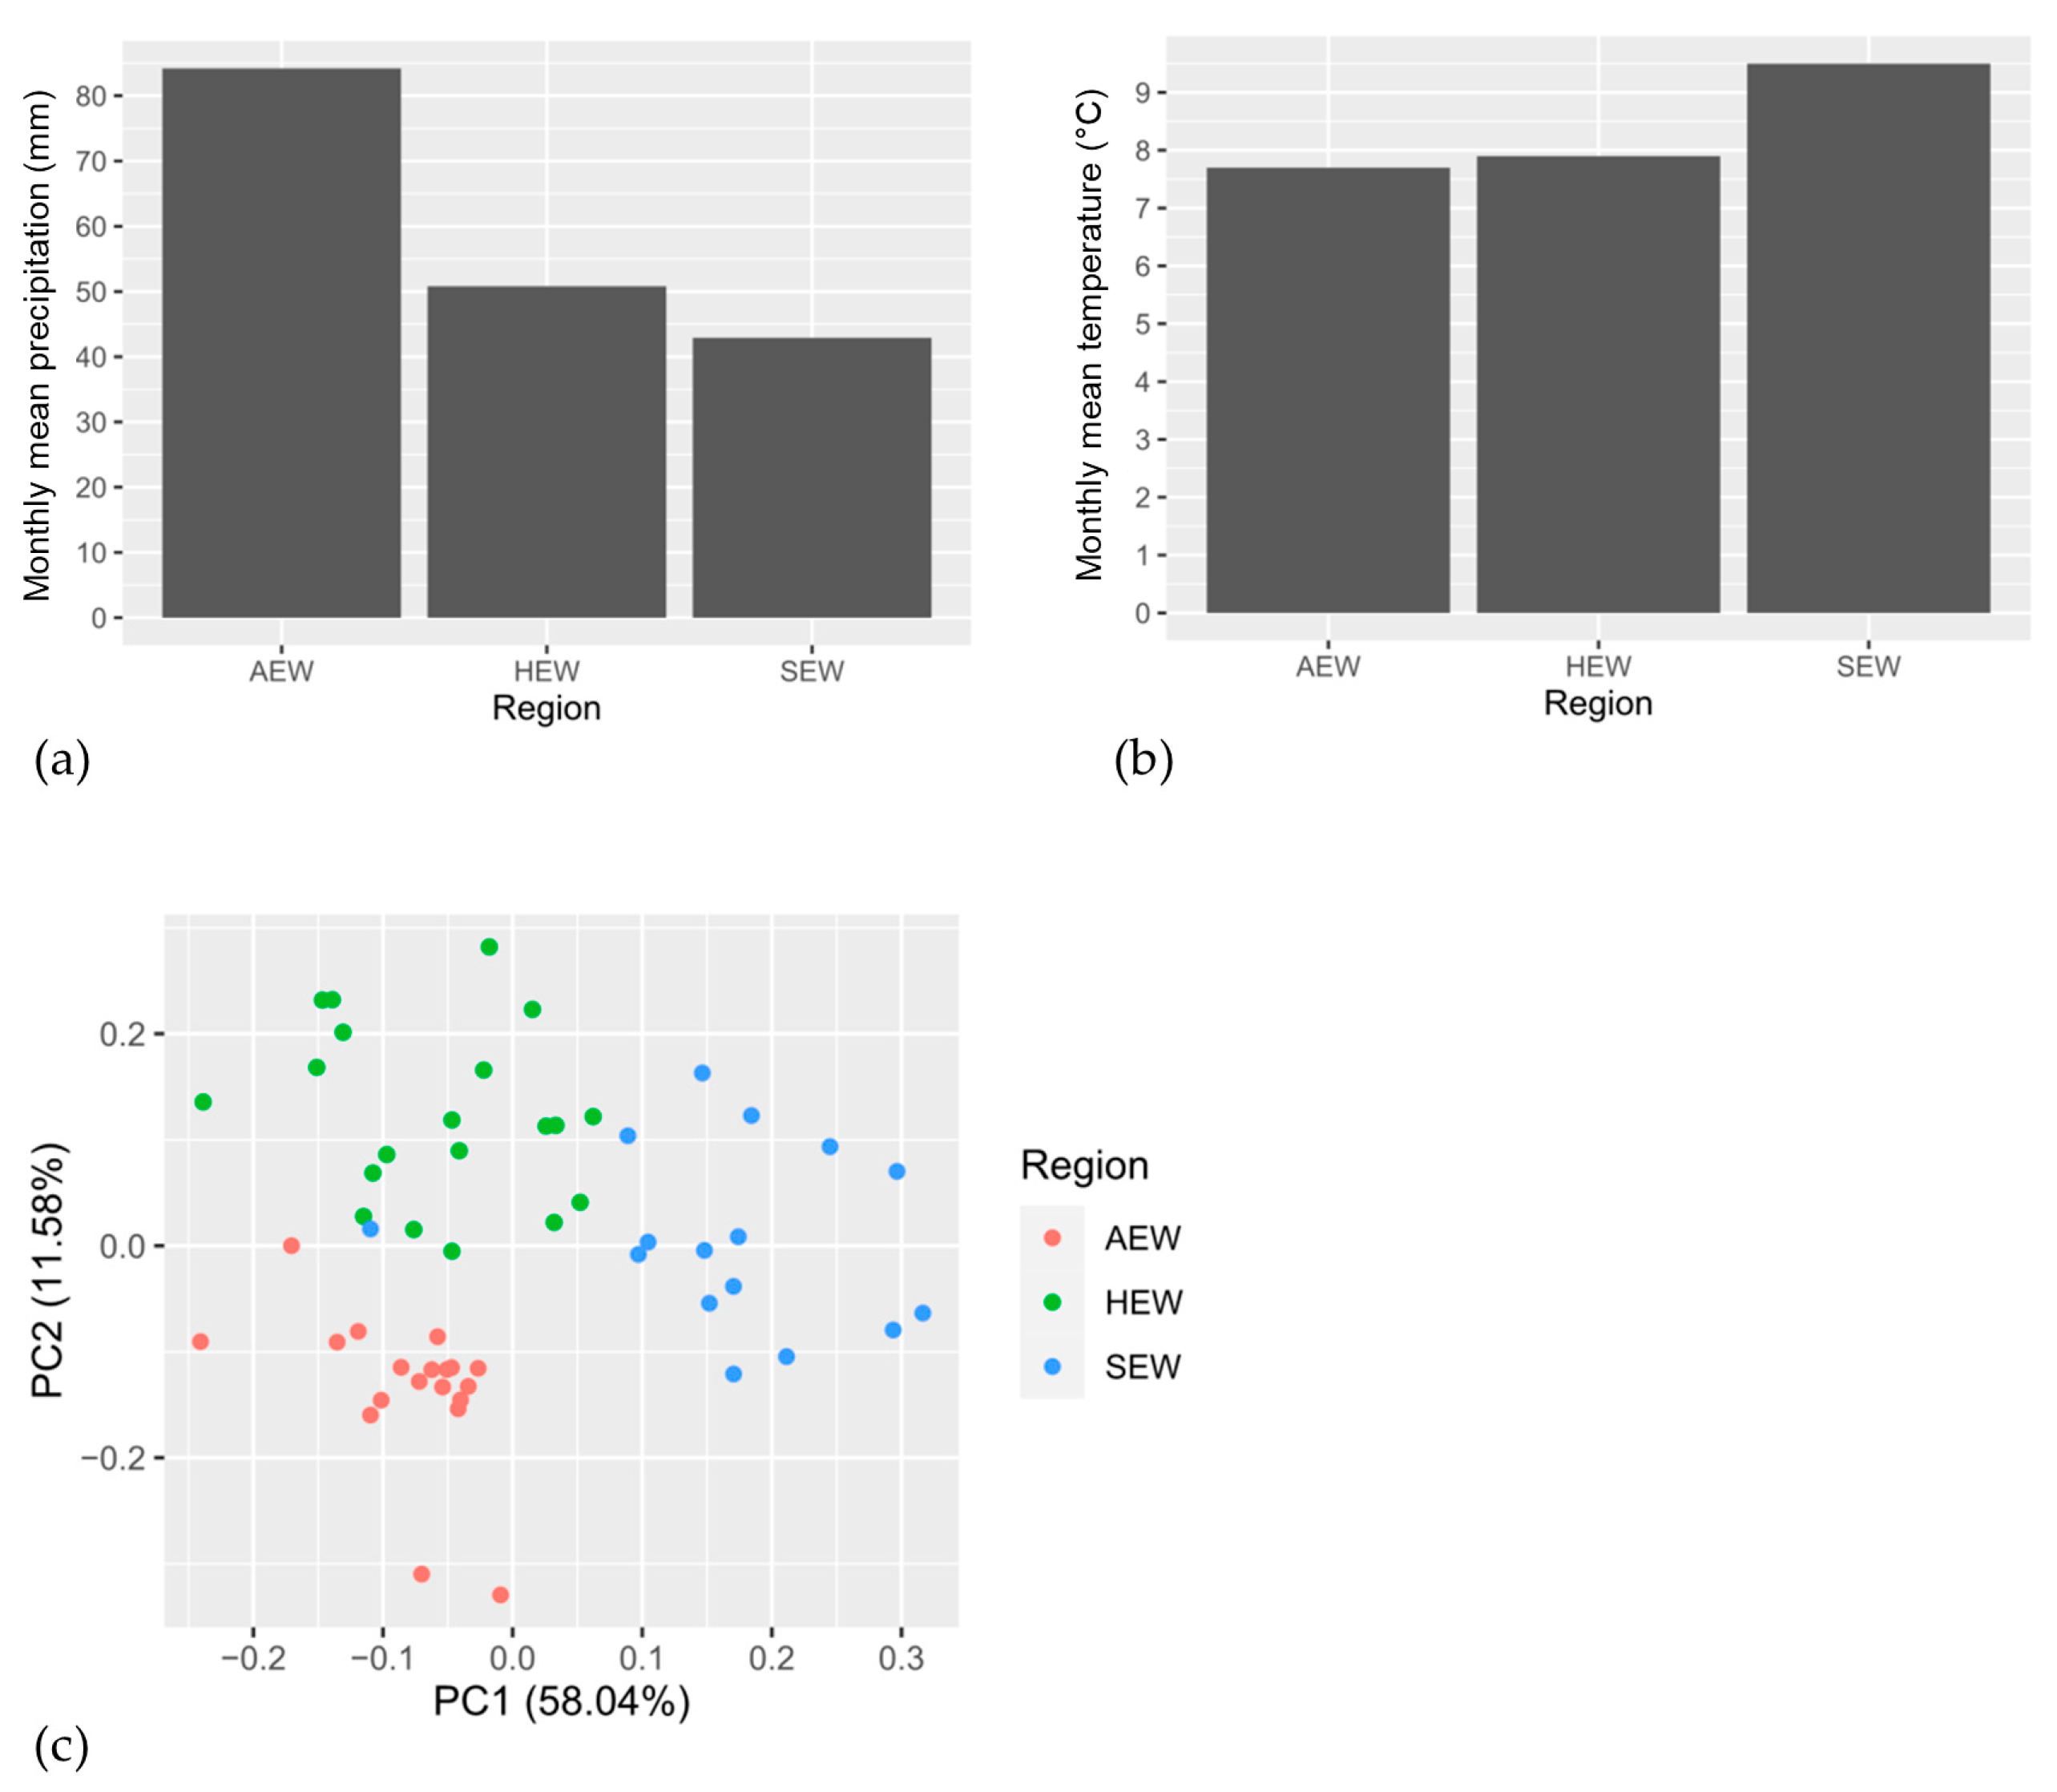
3.1. Climate Variables

The PCA showed that the first three PCs explained 58.04%, 11.58%, and 7.01% of the variance, respectively. PC1 was significantly correlated with several climatic variables, whereby the highest positive correlations were found for temperature-related variables such as air temperature 2 m above ground, vapor pressure, and growing degree days, and moderately negative correlations with precipitation-related climatic variables were found (Table S1). PC2 and PC3 were mainly correlated with climate variables related to more extreme conditions such as maximum and minimum temperature or number of cold days (Table S1). The regions were separated based on the climate data (Figure 2c).

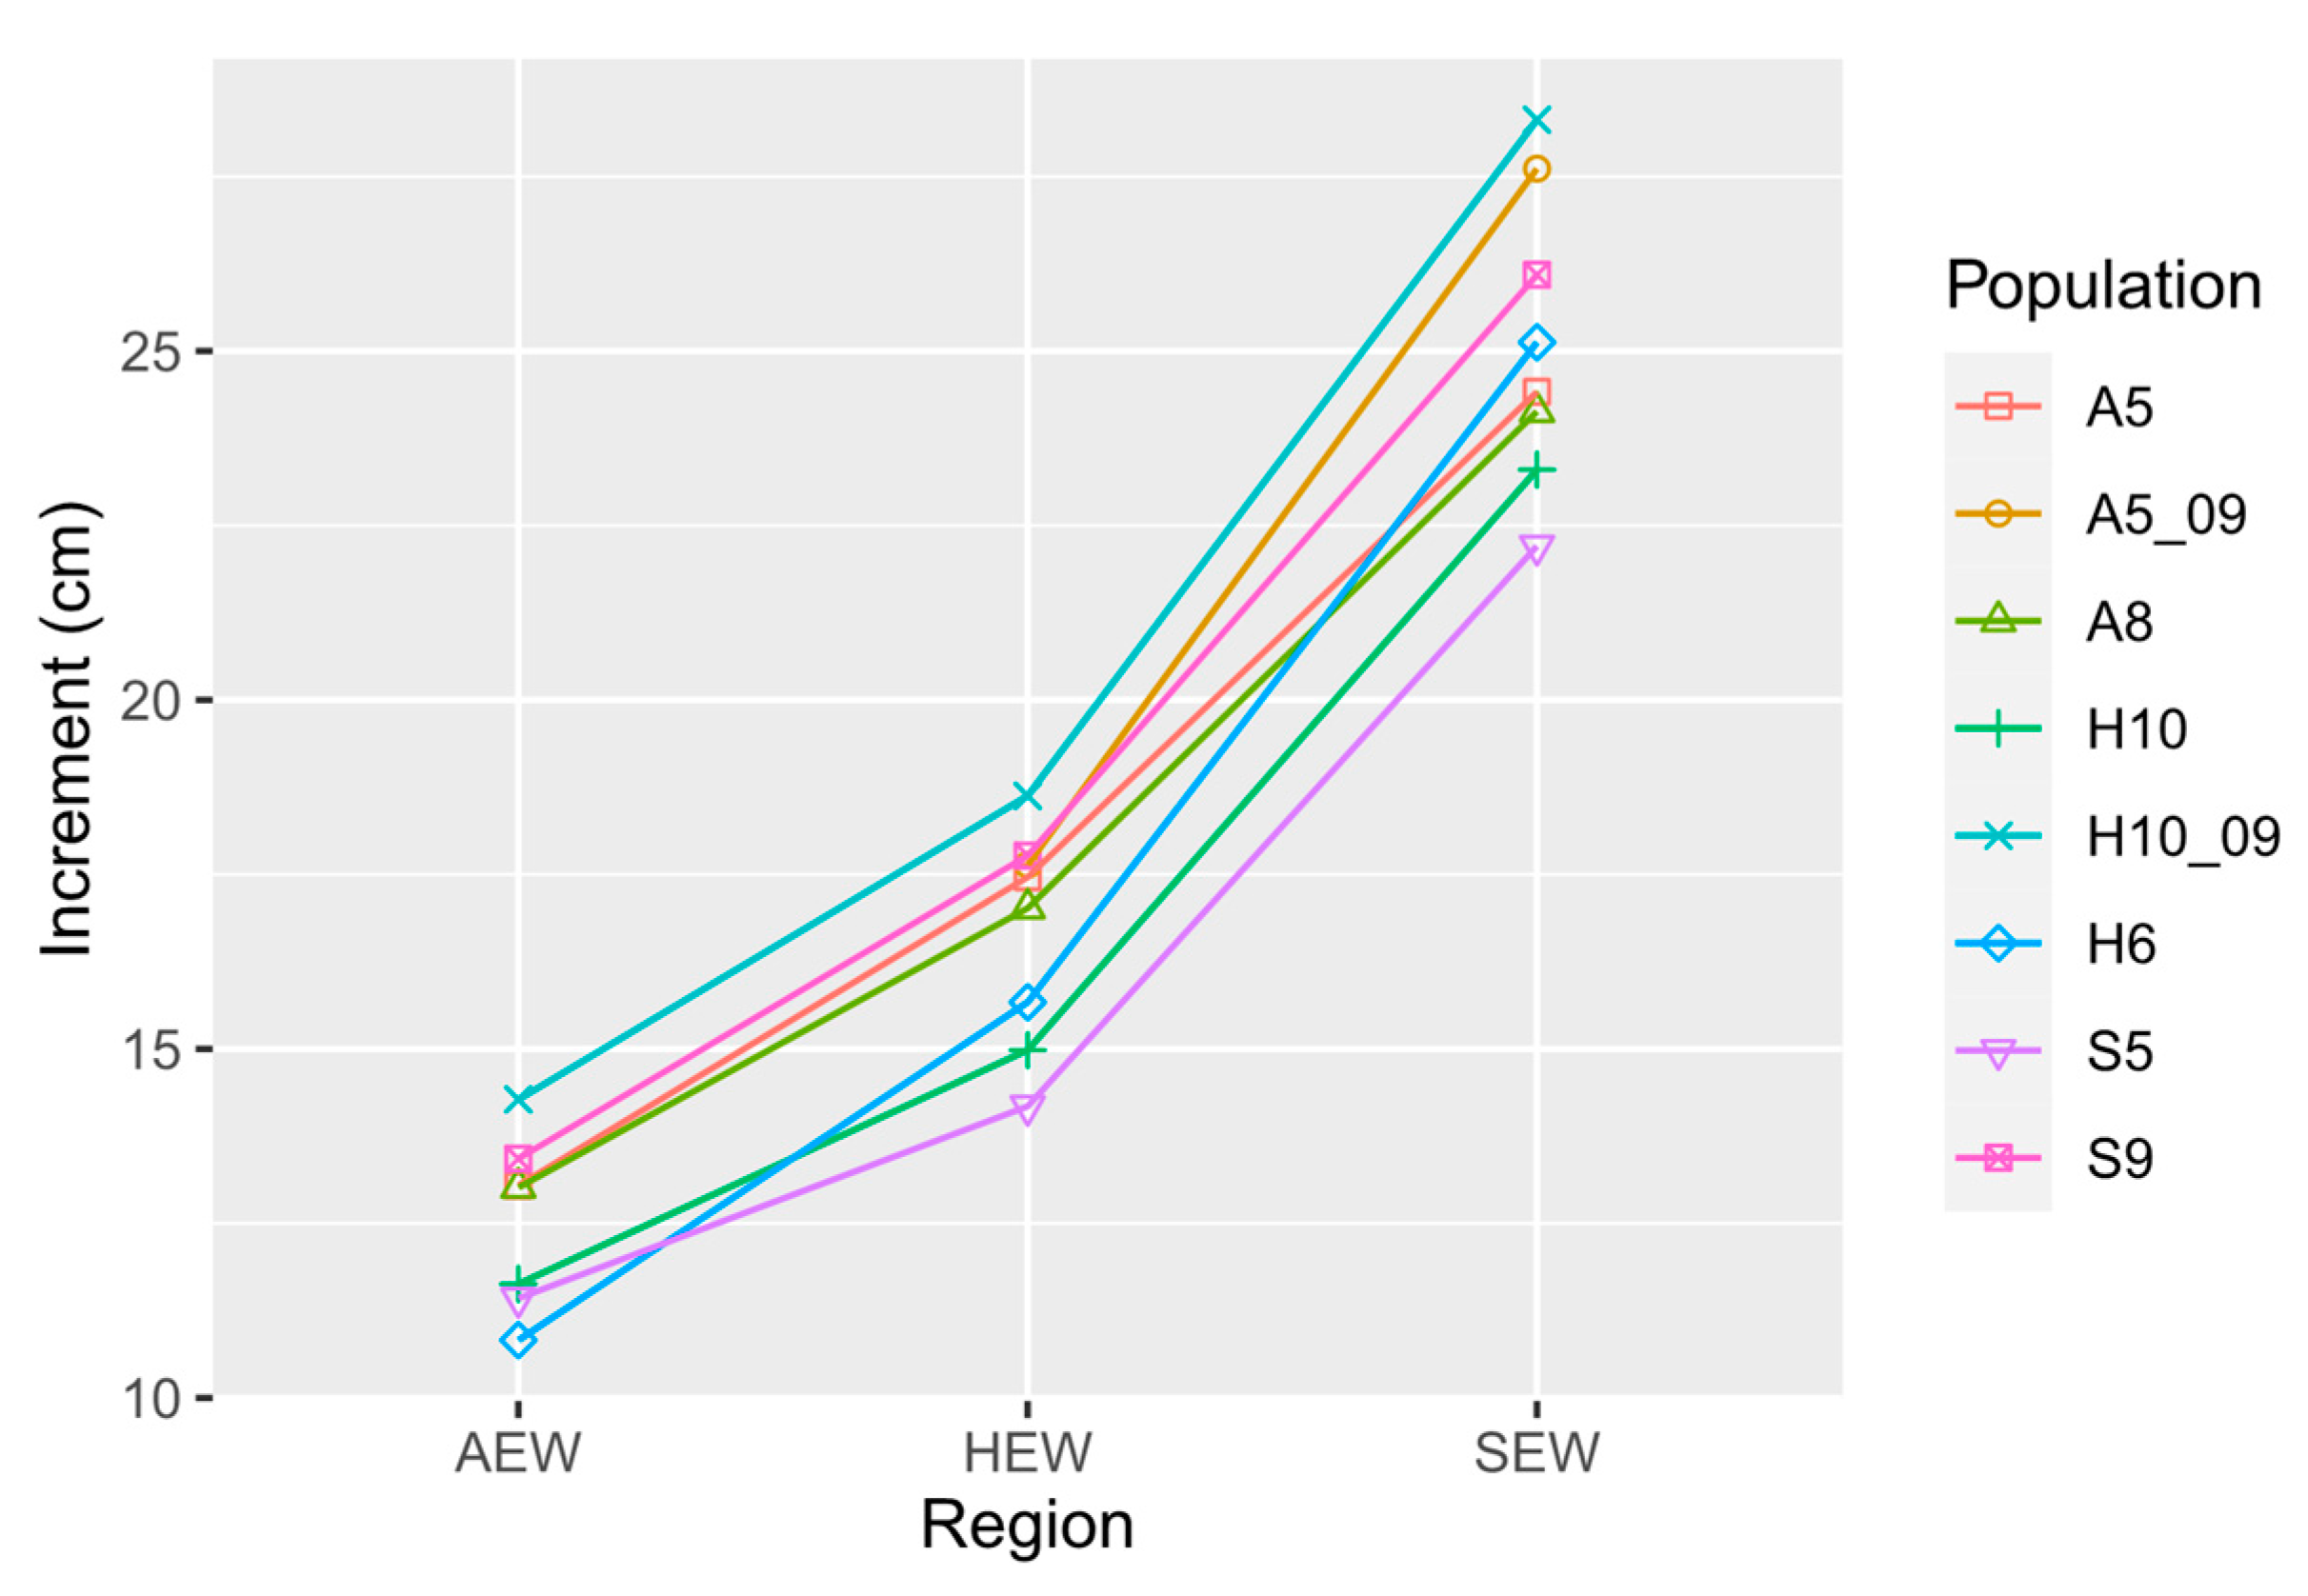
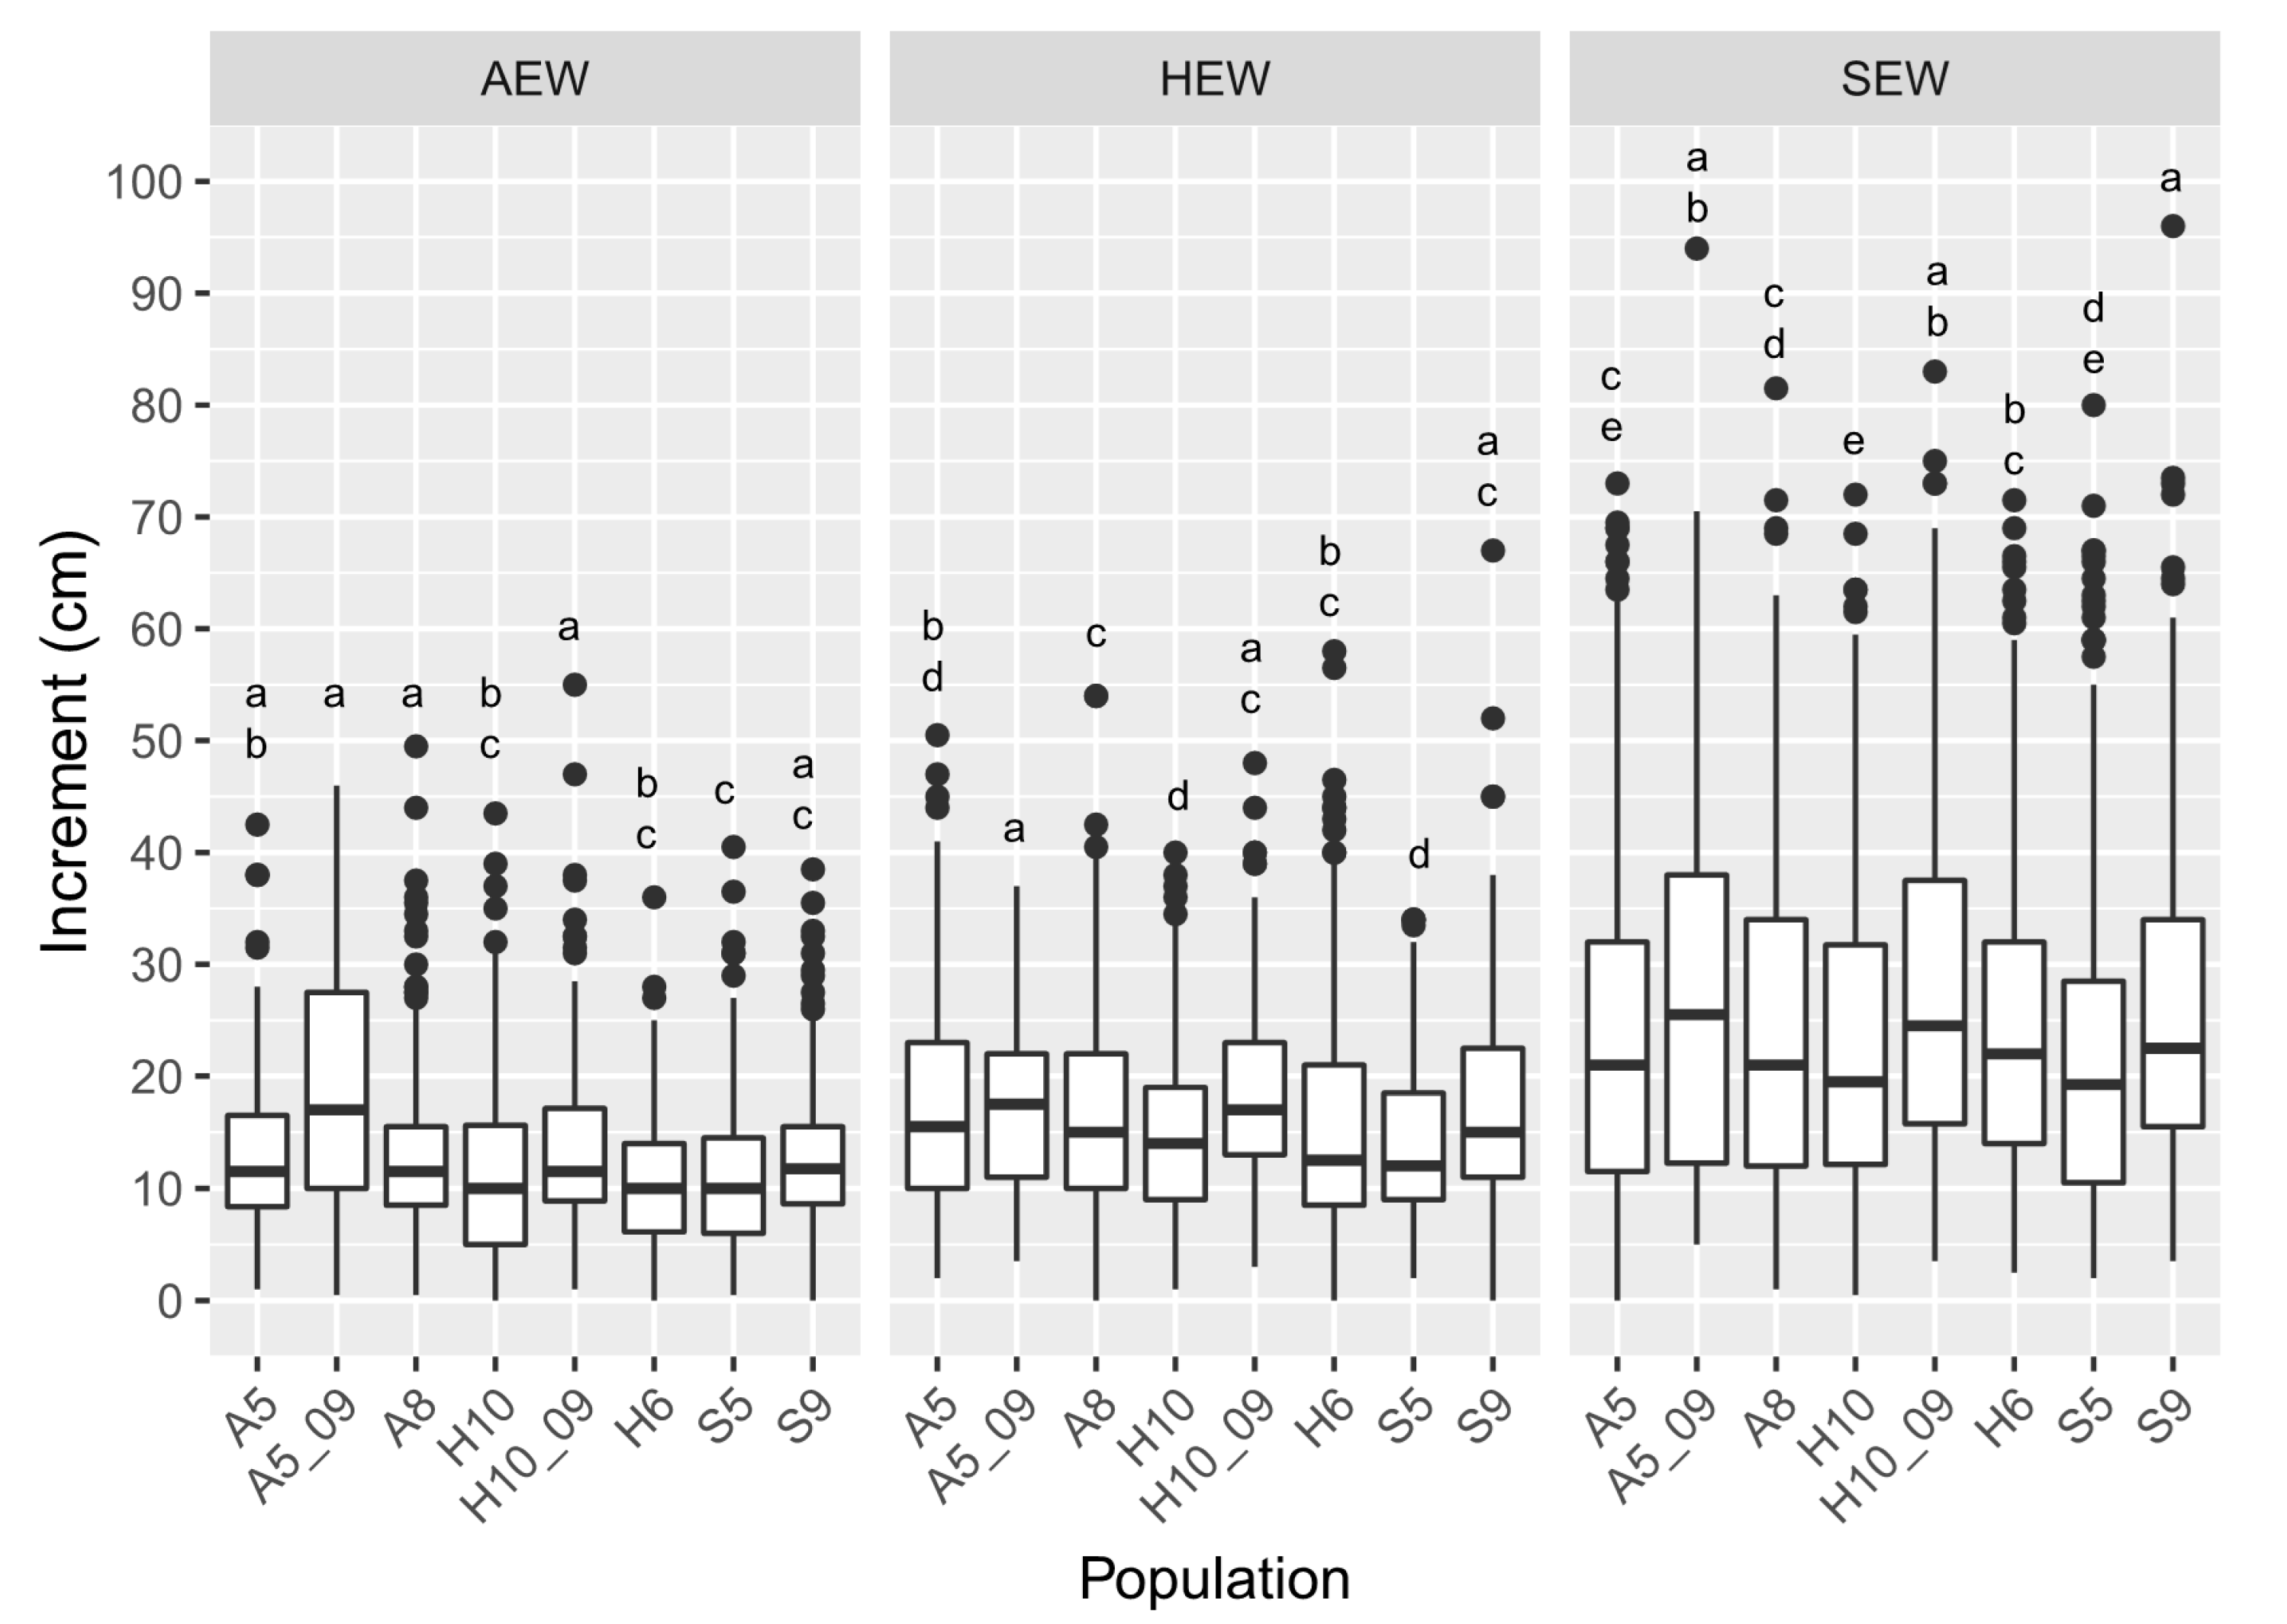
3.2. Plant Height Increment
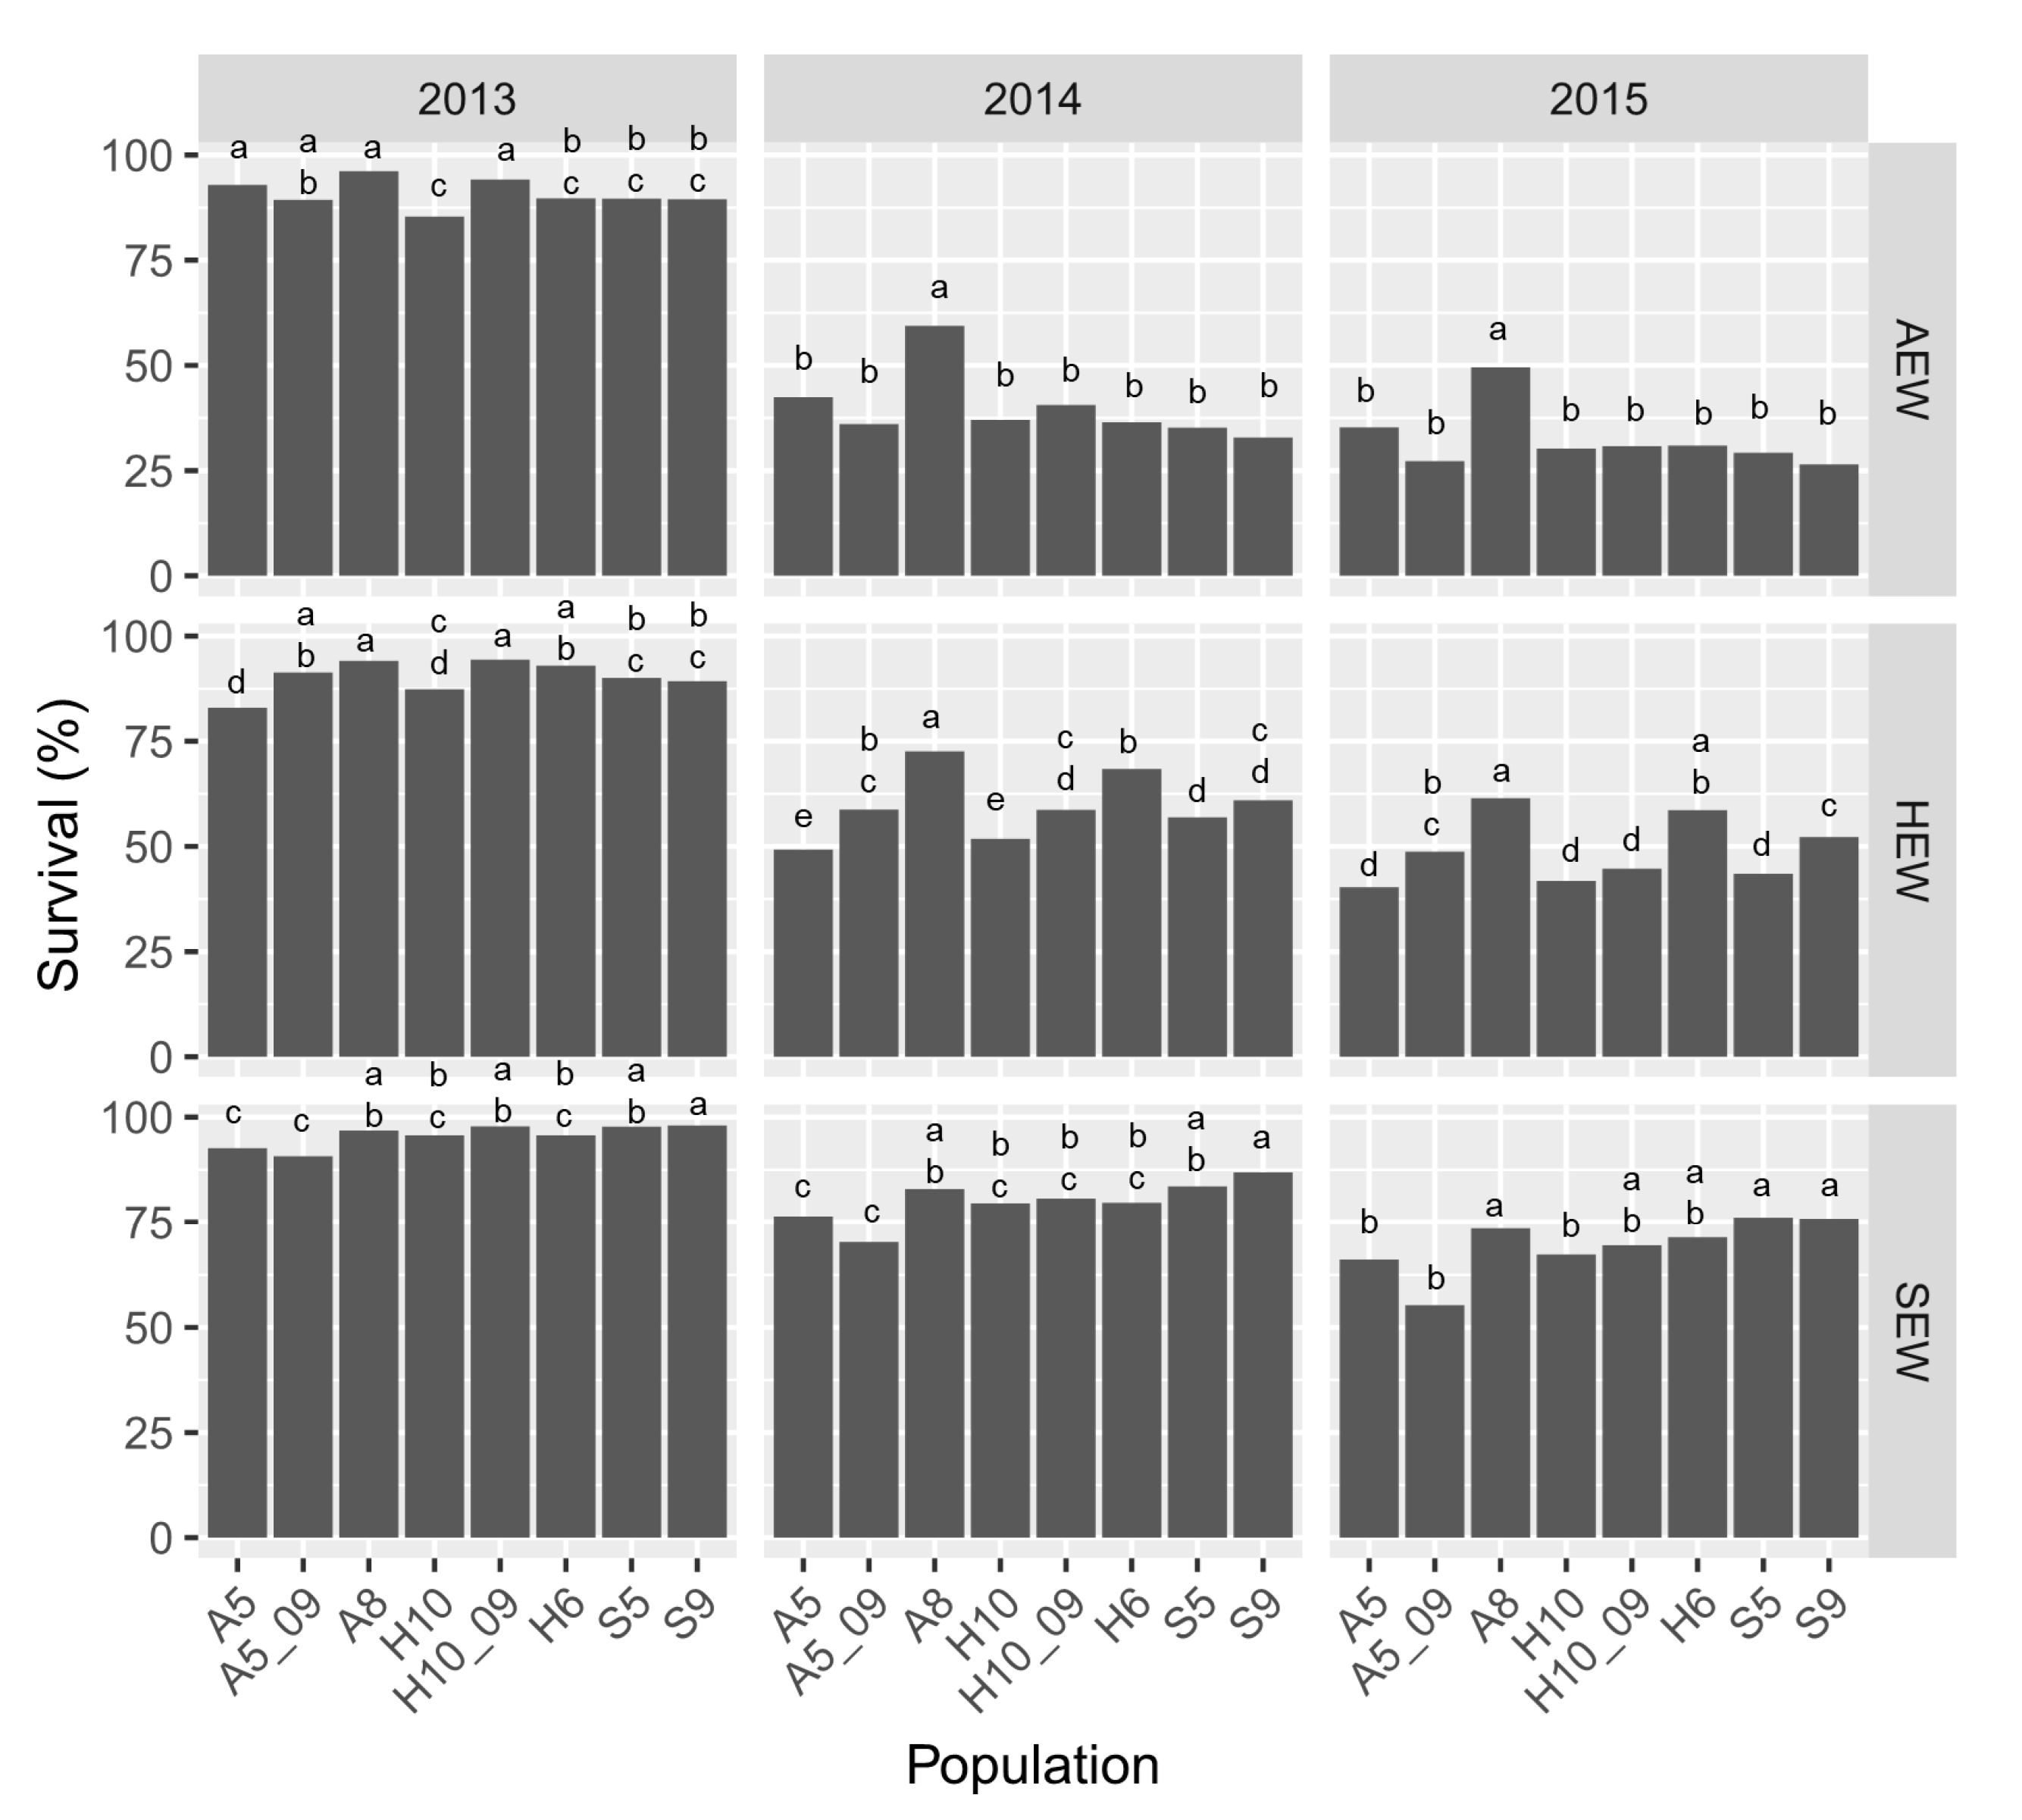
The mean plant height increment over all populations from planting to 2015 was 24.9 cm for the SEW region, 16.7 cm for HEW, and 13.0 cm for the AEW region. Height increment was significantly different between SEW and AEW (p < 0.01) and between SEW and HEW (p < 0.05), but not between HEW and AEW. Observed rank changes regarding plant height increment in the three regions (population–environment interactions) were not significant (p = 0.159) (Figure 3).
The coefficient of variation (CV) was significantly higher in the AEW region (mean: 0.619) and SEW region (mean: 0.613) compared to the HEW region (mean: 0.524) (Table S2). CV was not different between AEW and SEW. In addition, differences among populations within regions were not significant. Mean plant height increment from planting to 2015 ranged from 22.2 cm (S5 population) to 28.3 cm (H10_09 population) in the SEW region, from 14.2 cm (S5 population) to 18.6 cm (H10_09 population) in HEW, and 10.8 cm (H6 population) to 19.1 cm (A5_09 population; note that this value is based on ca. half the sample size of the other populations) in the AEW region (Figure 4). Data were available for height increment from planting to 2018 for the HEW region. There, height increment ranged from 18.6 cm (H10 population) to 24.9 cm (H10_09 population).

3.3. Plant Survival

Plant survival over all populations differed among regions and was 69.4% in SEW, 48.9% in HEW, and 32.5% in AEW in 2015. The differences in survival rates were significant between SEW and AEW as well as between SEW and HEW (p < 0.0001 and p < 0.05, respectively), but not between HEW and AEW. Rank changes of populations were observed for plant survival in the different regions (Figure 5). These population–environment interactions were highly significant (p < 0.0001).
Plant survival also differed among populations within regions (Figure 6). Based on ranks, local populations partly showed higher survival rates, but this trend was not significant. In SEW, survival ranged from 98.0% in the S9 population to 90.7% in the A5_09 population in 2013, from 86.9% (S9 population) to 70.3% (A5_09 population) in 2014, and from 76.1% (S5 population) to 55.3% (A5_09 population) in 2015. In the HEW region, it ranged from 94.4% (H10_09 population) to 83.0% (A5 population) in 2013, from 72.6% (A8 population) to 49.3% (A5 population) in 2014, and from 61.4% (A8 population) to 40.3% (A5 population) in 2015. Plant survival of the populations in the AEW region ranged from 96.8% (A8 population) to 85.4% (H10 population) in 2013, from 59.4% (A8 population) to 32.9% (S9 population) in 2014, and from 49.6% (A8 population) to 26.4% (S9 population) in 2015.

3.4. Correlation Analyses

Over all plots, plant survival was positively correlated with climate PC1 (ρ = 0.47) and plant height increment (ρ = 0.70). No correlations were found between climate PCs and plant height increment. Within regions, plant survival was positively correlated with plant increment (ρ = 0.77) in SEW and in HEW (ρ = 0.78). In the AEW region, no significant correlations were detected between plant survival and plant height increment.

4. Discussion

We investigated adaptive patterns of European beech in a large translocation experiment located in three widely separated regions in Germany. We found low population differentiation for plant survival and height increment, and no advantage of local populations. Instead, we found high phenotypic plasticity of the populations. This might help beech to cope with changing environmental conditions, at least in the short term.

4.1. Lack of Local Adaptation

Only low differences in plant height increment and plant survival were detected among populations within the three study regions located in northeast, middle, and southwest Germany. Populations growing in their local environments did not show a better performance (i.e., higher plant increment, higher survival) compared to non-local populations. Looking only at ranks (Figure 5 and Figure 6), there is a tendency of higher survival of local populations. Nevertheless, these differences are not significant and population A8 shows a high survival in all three regions. This lack of clear patterns of local adaptation was unexpected considering the large differences in environmental conditions prevailing in the three study regions. Nevertheless, a lack of adaptation to drought has previously been found in beech populations from the same study regions [23]. In addition, in a previous study no clear adaptive patterns related to geography were found by analyzing bud burst timing of the same populations as in the present study in the part of the translocation experiment located in the HEW region [37]. Populations originating from different regions partly showed more similar mean bud burst timing than populations from the same region. For European beech, phenotypic plasticity was found to contribute more to trait variation than local adaptation [33], and hence, phenotypic plasticity (see below) might be more important than local adaptation in several regions. European beech shows a strong “natural” dominance in Central Europe, making it highly competitive against other tree species, and it can grow on a variety of different sites [51,52]. This may be partly due to high phenotypic plasticity, potentially leading to lower selective pressure for beech compared to other tree species, and hence, lower population differentiation in adaptive traits.

4.2. Phenotypic Plasticity

Phenotypic plasticity was detected for the analyzed populations, since plant survival and plant height increment differed among the three regions. Only between the AEW and HEW region were the differences not significant. Further, we were also interested in variation within populations, since high within population variation might help populations to adapt to changing environmental conditions [53]. The highest variation within populations measured as coefficient of variation (CV) for plant height increment was detected in the AEW and SEW regions. Nevertheless, CV was not different among populations within regions. Survival rates and plant height increment in the translocation experiment increased along the geographic gradient from the AEW to the SEW region. These results were unexpected, since the performance of drought sensitive beech should have been most constrained in the comparably dry SEW region. A recent study, however, found a surprisingly high tolerance of beech saplings to drought [54]. To investigate the influence of environmental conditions on the performance of the seedlings in the translocation experiment, we obtained climatic variables of the plots over the observation period of the experiment. We found that plant survival was positively correlated with the first climatic principle component (PC1). In contrast to PC2 and PC3, which were mainly correlated with climate variables related to more extreme conditions such as maximum and minimum temperature, PC1 was mainly positively correlated with temperature-related variables such as air temperature at 2 m above ground, vapor pressure, and growing degree days (ρ = 0.94–0.96), and moderately negatively correlated with precipitation-related climatic variables (Table S1). Higher absolute correlation coefficients for temperature-related variables suggest a predominant effect of temperature on survival under moderate drought stress. Correlation analyses between survival and single environmental variables also revealed positive correlations with the temperature-related variables mentioned before (ρ = 0.40–0.41) and a negative correlation with precipitation-related variables (e.g., mean monthly precipitation (ρ = −0.39) and soil moisture at 10 cm below surface (ρ = −0.41); data not shown).
Plant survival was positively correlated with plant height increment. Thus, higher plant growth may lead to better plant survival. Nevertheless, this may just be an effect of the study design, since plant survival and plant height increment showed similar trends along the geographic gradient. Therefore, we also conducted correlation analyses within regions. Plant survival was positively correlated with plant increment in SEW and HEW, but not in AEW. Thus, in the SEW and HEW regions plant growth may have a positive effect on plant survival, while it may not be favorable under the (harsher) conditions in AEW. Nevertheless, based on our study design, a final conclusion remains open.
For two populations (H10 and A5), seedlings raised from seeds collected in 2009 (H10_09 and A5_09) were also planted in the translocation experiment. Thus, a comparison of the performance of seedlings originating from different seed lots was possible. Significant differences were found for plant height increment (H10/H10_09 and A5/A5_09 in SEW and HEW, only H10/H10_09 in AEW). For plant survival, differences were only found for A5/A5_09 in the HEW region. Differences in seedling performance could be due to factors such as maternal effects, epigenetics, or environmental alteration of the mating system [55,56,57]. Moreover, an effect of seed storage cannot be excluded in our study. Genetic variation at nuclear microsatellite markers between seed lots, however, was very low (data not shown). When comparing precipitation and temperature in April/May 2009 and 2011 (flowering time of beech), large differences in precipitation and to a smaller extent in temperature become visible. Thus, mean precipitation in the A5 population was 97.7 mm in 2009 and 47.5 mm in 2011 (mean temperature 11.3 °C in 2009 and 11.7 °C in 2011), and 86.6 mm in 2009 and 20.6 mm in 2011 for the H10 populations (mean temperature 11.6 °C in 2009 and 11.8 °C in 2011). Thus, the warmer and especially dryer conditions in 2011 compared to 2009 may have influenced the properties of the different seed generations. An influence of weather conditions on reproductive processes in trees has been shown in other studies. For instance, Picea abies (L.) H.Karst. seedlings from seed lots of a dry and a warm seed year showed differences in bud set timing [58]. In a clonal seed orchard of Pinus tabuliformis Carr., cool and damp weather significantly improved the reproductive synchrony of clones [59].
Although changes in phenotypic responses to the environment were observed for both traits (different plant height increment and survival in the three regions, i.e., phenotypic plasticity), significant population–environment interactions (populations show differences in plasticity [28]) were only detected for plant survival. Thus, predictions about the survival of the beech populations planted away from their local environment are difficult. Nevertheless, since only minor differences were detected among populations for the investigated traits, this may be of minor importance, at least for the studied populations. One exception was the A8 population. This population showed high survival rates in all regions. Previous studies showed that this population was also genetically more differentiated compared to other investigated populations [38,60], and hence, might have a different genetic background, leading to a better performance.

4.3. Study Limitations

One practical limitation of working with trees is that translocation experiments can only be conducted with juvenile plants. It is known that plant height increment can differ between juvenile stages and that stress resistance increases with ontogeny [61,62]. Thus, adaptive patterns observed in seedlings may not be the same as the ones observed in adult trees. Nevertheless, the seedling stage is the most vulnerable phase in the life of trees and traits like plant height increment are a good predictor for the future fitness of the trees [35,63]. In general, the conditions for the seedlings in the experiment seemed to be quite harsh, as indicated by high mortality rates and low plant size after three years. For the region HEW, data for 2018 was also available, which showed that there was only small plant height increment from 2015 to 2018. This might be influenced by the potential start of competition for space of the seedlings in the experiment. Our study is based on plant height and plant survival, and hence, there might be additional factors influencing the performance of the seedlings that were not investigated (e.g., below-ground biomass). Changing climatic conditions may also lead to altered natural disturbance regimes in forests (e.g., insect-climate interactions) [64]. Lavoie et al. [65] found that smaller seedlings of balsam fir and black spruce were less damaged by spruce budworm compared to larger seedlings. Thus, even though plant height increment of tree seedlings may be a good predictor of future fitness, other factors may interfere with this.

5. Conclusions

The high phenotypic plasticity observed in this study might help beech to cope with changing environmental conditions in the future. Nevertheless, increasing drought stress and observed loss of vitality of beech in the last years might cause higher selective pressure, making adaptive changes and/or different provenance choice necessary in the long term. Planting populations like A8 from the current study, which showed high survival rates in all tested environments, could help to create beech forests that can cope with changing environmental conditions. Nevertheless, long-term experiments (provenance tests) would be needed to give reliable recommendations for provenance choice. Future studies may also take advantage of high-throughput sequencing techniques to identify genome-wide variation within beech. This variation can be associated with environmental variables and adaptive traits to obtain further insights into the genetic basis of the observed patterns. By also analyzing epigenetic variation, its influence on the observed phenotypic plasticity might be further investigated.

Supplementary Materials

The following are available online at https://www.mdpi.com/1999-4907/11/12/1354/s1, Table S1: overview of climate variables and their correlation with environmental principal components (PCs), Table S2: coefficient of variation (CV) of the populations for plant height increment in the different regions, Figure S1: boxplots of plant height for the population (a) SEW, (b) HEW, and (c) AEW in the different years, and (d) interaction plot of mean plant height in 2015 of the different populations in the three study regions (please note that A5_09 was removed from AEW in Figure S1(d), since it is based on approx. half the sample size of the other populations and not significantly different to most populations (see Figure S1(a–c) for details), but would create the impression of superior plant height in the figure). (Populations from the SEW region: S5 and S9; from HEW: H10, H10_09, and H6; from AEW: A5, A5_09, and A8. For the populations H10 and A5, seeds from 2009 were also available for raising seedlings and are named H10_09 and A5_09, respectively).

Author Contributions

Conceptualization, O.G. and R.F.; methodology, M.M., O.G. and R.F.; validation, M.M., T.K., R.F. and O.G.; formal analysis, M.M. and T.K.; investigation, M.M. and T.K.; resources, O.G. and R.F.; data curation, M.M. and T.K.; writing—original draft preparation, M.M.; writing—review and editing, M.M., T.K., O.G. and R.F.; visualization, M.M.; supervision, O.G. and R.F.; project administration, M.M., O.G. and R.F.; funding acquisition, O.G. and R.F. All authors have read and agreed to the published version of the manuscript.

Funding

The work has been funded by the DFG Priority Program 1374 “Infrastructure-Biodiversity-Exploratories” (grant number Fi 569/12-2). We acknowledge support by the Open Access Publication Funds of the Göttingen University.

Data Availability:

Phenotypic data will be made publically available after publication on the Biodiversity Exploratories Information System at https://www.bexis.uni-jena.de/PublicData/PublicData.aspx (IDs: 15509, 27026, and 21326).

Acknowledgments

We thank the late Sarah Seifert for designing and managing the establishment of the translocation experiment. We thank the managers of the three exploratories, Swen Renner, Kirsten Reichel-Jung, Katrin Lorenzen, Juliane Vogt, Martin Gorke, and all former managers, for their work in maintaining the plot and project infrastructure; Simone Pfeiffer and Christiane Fischer for giving support through the central office, Michael Owonibi and Andreas Ostrowski for managing the central data base, and Markus Fischer, Eduard Linsenmair, Dominik Hessenmöller, Daniel Prati, Ingo Schöning, François Buscot, Ernst-Detlef Schulze, Wolfgang W. Weisser and the late Elisabeth Kalko for their role in setting up the Biodiversity Exploratories project. We thank Stephan Wöllauer, Falk Hänsel, Thomas Nauss, and Spaska Forteva for providing the climate data. We thank Alexandra Dolynska, Christine Radler, Gerold Dinkel, Melanie Schmitt, Marco Winkler, Laura Krefft, Natalie Breidenbach, Janosch Henke, Marlon Ohms, Marlene Krause, Theresa Bode, Jörg Hailer, Torben Tomforde, Laura Kilian, and Wolf Hansel for helping us with the field work. The translocation experiment was established in the BEECHADAPT project and administratively continued by Andrea Polle in the ECTOMYC project. Field work permits were issued by the responsible state environmental offices of Baden-Württemberg, Thüringen, and Brandenburg.

Conflicts of Interest

The authors declare no conflict of interest. The funders had no role in the design of the study; in the collection, analyses, or interpretation of data; in the writing of the manuscript, or in the decision to publish the results.

References

  1. IPCC. Climate Change 2014: Synthesis Report. Contribution of Working Groups I, II and III to the Fith Assessment Report of the Intergovernmental Panel on Climate Change; Core Writing Team, Pachauri, R.K., Meyer, L.A., Eds.; IPCC: Geneva, Switzerland, 2014. [Google Scholar]
  2. Menzel, A.; Fabian, P. Growing season extended in Europe. Nature 1999, 397, 659. [Google Scholar] [CrossRef]
  3. Bréda, N.; Huc, R.; Granier, A.; Dreyer, E. Temperate forest trees and stands under severe drought: A review of ecophysiological responses, adaptation processes and long-term consequences. Ann. For. Sci. 2006, 63, 625–644. [Google Scholar] [CrossRef] [Green Version]
  4. Benito Garzón, M.; Robson, T.M.; Hampe, A. ΔTraitSDMs: Species distribution models that account for local adaptation and phenotypic plasticity. New Phytol. 2019, 222, 1757–1765. [Google Scholar] [CrossRef]
  5. Knutzen, F.; Dulamsuren, C.; Meier, I.C.; Leuschner, C. Recent climate warming-related growth decline impairs European beech in the center of its distribution range. Ecosystems 2017, 20, 1494–1511. [Google Scholar] [CrossRef]
  6. NW-FVA. Komplexe Schäden an Rotbuche (Fagus sylvatica) und Auswirkungen des Trockenen und Heißen Sommers 2018 auf Ältere Bestände; Waldschutzinfo Nr. 06/2019; NW-FVA: Göttingen, Germany, 2019. [Google Scholar]
  7. Gennaretti, F.; Ogée, J.; Sainte-Marie, J.; Cuntz, M. Mining ecophysiological responses of European beech ecosystems to drought. Agric. For. Meteorol. 2020, 280, 107780. [Google Scholar] [CrossRef]
  8. Zimmermann, J.; Hauck, M.; Dulamsuren, C.; Leuschner, C. Climate warming-related growth decline affects Fagus sylvatica, but not other broad-leaved tree species in Central European mixed forests. Ecosystems 2015, 18, 560–572. [Google Scholar] [CrossRef]
  9. Aranda, I.; Gil, L.; Pardos, J.A. Water relations and gas exchange in Fagus sylvatica L. and Quercus petraea (Mattuschka) Liebl. in a mixed stand at their southern limit of distribution in Europe. Trees 2000, 14, 344–352. [Google Scholar] [CrossRef]
  10. Köcher, P.; Gebauer, T.; Horna, V.; Leuschner, C. Leaf water status and stem xylem flux in relation to soil drought in five temperate broad-leaved tree species with contrasting water use strategies. Ann. For. Sci. 2009, 66, 101. [Google Scholar] [CrossRef]
  11. Bertin, R.I. Plant phenology and distribution in relation to recent climate change. J. Torrey Bot. Soc. 2008, 135, 126–146. [Google Scholar] [CrossRef] [Green Version]
  12. Kreyling, J.; Thiel, D.; Nagy, L.; Jentsch, A.; Huber, G.; Konnert, M.; Beierkuhnlein, C. Late frost sensitivity of juvenile Fagus sylvatica L. differs between southern Germany and Bulgaria and depends on preceding air temperature. Eur. J. For. Res. 2012, 131, 717–725. [Google Scholar] [CrossRef]
  13. Müller, M.; Gailing, O. Abiotic genetic adaptation in the Fagaceae. Plant Biol. 2019, 21, 783–795. [Google Scholar] [CrossRef]
  14. Aitken, S.N.; Bemmels, J.B. Time to get moving: Assisted gene flow of forest trees. Evol. Appl. 2016, 9, 271–290. [Google Scholar] [CrossRef] [PubMed]
  15. Lind, B.M.; Menon, M.; Bolte, C.E.; Faske, T.M.; Eckert, A.J. The genomics of local adaptation in trees: Are we out of the woods yet? Tree Genet. Genomes 2018, 14, 29. [Google Scholar] [CrossRef]
  16. Kreyling, J.; Buhk, C.; Backhaus, S.; Hallinger, M.; Huber, G.; Huber, L.; Jentsch, A.; Konnert, M.; Thiel, D.; Wilmking, M.; et al. Local adaptations to frost in marginal and central populations of the dominant forest tree Fagus sylvatica L. as affected by temperature and extreme drought in common garden experiments. Ecol. Evol. 2014, 4, 594–605. [Google Scholar] [CrossRef] [PubMed] [Green Version]
  17. Hofmann, M.; Durka, W.; Liesebach, M.; Bruelheide, H. Intraspecific variability in frost hardiness of Fagus sylvatica L. Eur. J. For. Res. 2015, 134, 433–441. [Google Scholar] [CrossRef]
  18. Carsjens, C.; Nguyen Ngoc, Q.; Guzy, J.; Knutzen, F.; Meier, I.C.; Müller, M.; Finkeldey, R.; Leuschner, C.; Polle, A. Intra-specific variations in expression of stress-related genes in beech progenies are stronger than drought-induced responses. Tree Physiol. 2014, 34, 1348–1361. [Google Scholar] [CrossRef] [Green Version]
  19. Rose, L.; Leuschner, C.; Köckemann, B.; Buschmann, H. Are marginal beech (Fagus sylvatica L.) provenances a source for drought tolerant ecotypes? Eur. J. For. Res. 2009, 128, 335–343. [Google Scholar] [CrossRef] [Green Version]
  20. Dounavi, A.; Netzer, F.; Celepirovic, N.; Ivanković, M.; Burger, J.; Figueroa, A.G.; Schön, S.; Simon, J.; Cremer, E.; Fussi, B.; et al. Genetic and physiological differences of European beech provenances (F. sylvatica L.) exposed to drought stress. For. Ecol. Manag. 2016, 361, 226–236. [Google Scholar] [CrossRef]
  21. Varsamis, G.; Papageorgiou, A.C.; Merou, T.; Takos, I.; Malesios, C.; Manolis, A.; Tsiripidis, I.; Gailing, O. Adaptive diversity of beech seedlings under climate change scenarios. Front. Plant Sci. 2019, 9, 1918. [Google Scholar] [CrossRef]
  22. Müller, M.; Finkeldey, R. Genetic and adaptive trait variation in seedlings of European beech provenances from Northern Germany. Silvae Genet. 2016, 65, 65–73. [Google Scholar] [CrossRef] [Green Version]
  23. Baudis, M.; Ellerbrock, R.H.; Felsmann, K.; Gessler, A.; Gimbel, K.; Kayler, Z.; Puhlmann, H.; Ulrich, A.; Weiler, M.; Welk, E.; et al. Intraspecific differences in responses to rainshelter-induced drought and competition of Fagus sylvatica L. across Germany. For. Ecol. Manag. 2014, 330, 283–293. [Google Scholar] [CrossRef]
  24. Knutzen, F.; Meier, I.C.; Leuschner, C. Does reduced precipitation trigger physiological and morphological drought adaptations in European beech (Fagus sylvatica L.)? Comparing provenances across a precipitation gradient. Tree Physiol. 2015, 35, 949–963. [Google Scholar] [CrossRef] [Green Version]
  25. Ghalambor, C.K.; McKay, J.K.; Carroll, S.P.; Reznick, D.N. Adaptive versus non-adaptive phenotypic plasticity and the potential for contemporary adaptation in new environments. Funct. Ecol. 2007, 21, 394–407. [Google Scholar] [CrossRef]
  26. Crispo, E. Modifying effects of phenotypic plasticity on interactions among natural selection, adaptation and gene flow. J. Evol. Biol. 2008, 21, 1460–1469. [Google Scholar] [CrossRef]
  27. Kremer, A.; Potts, B.M.; Delzon, S. Genetic divergence in forest trees: Understanding the consequences of climate change. Funct. Ecol. 2014, 28, 22–36. [Google Scholar] [CrossRef] [Green Version]
  28. Matesanz, S.; Ramírez-Valiente, J.A. A review and meta-analysis of intraspecific differences in phenotypic plasticity: Implications to forecast plant responses to climate change. Glob. Ecol. Biogeogr. 2019, 28, 1682–1694. [Google Scholar] [CrossRef]
  29. Schuldt, B.; Knutzen, F.; Delzon, S.; Jansen, S.; Müller-Haubold, H.; Burlett, R.; Clough, Y.; Leuschner, C. How adaptable is the hydraulic system of European beech in the face of climate change-related precipitation reduction? New Phytol. 2016, 210, 443–458. [Google Scholar] [CrossRef] [Green Version]
  30. Schüler, S.; Liesebach, M. Latitudinal population transfer reduces temperature sum requirements for bud burst of European beech. Plant Ecol. 2015, 216, 111–122. [Google Scholar] [CrossRef]
  31. Vitasse, Y.; Bresson, C.C.; Kremer, A.; Michalet, R.; Delzon, S. Quantifying phenological plasticity to temperature in two temperate tree species. Funct. Ecol. 2010, 24, 1211–1218. [Google Scholar] [CrossRef]
  32. Aranda, I.; Bahamonde, H.A.; Sanchez-Gomez, D. Intra-population variability in the drought response of a beech (Fagus sylvatica L.) population in the southwest of Europe. Tree Physiol. 2017, 37, 938–949. [Google Scholar] [CrossRef]
  33. Gárate-Escamilla, H.; Hampe, A.; Vizcaíno-Palomar, N.; Robson, T.M.; Benito Garzón, M. Range-wide variation in local adaptation and phenotypic plasticity of fitness-related traits in Fagus sylvatica and their implications under climate change. Glob. Ecol. Biogeogr. 2019, 28, 1336–1350. [Google Scholar] [CrossRef] [Green Version]
  34. Liu, Y.; El-Kassaby, Y.A. Phenotypic plasticity of natural Populus trichocarpa populations in response to temporally environmental change in a common garden. BMC Evol. Biol. 2019, 19, 231. [Google Scholar] [CrossRef] [PubMed]
  35. Younginger, B.S.; Sirová, D.; Cruzan, M.B.; Ballhorn, D.J. Is biomass a reliable estimate of plant fitness? Appl. Plant Sci. 2017, 5, 1600094. [Google Scholar] [CrossRef] [PubMed]
  36. Ratnam, W.; Rajora, O.P.; Finkeldey, R.; Aravanopoulos, F.; Bouvet, J.-M.; Vaillancourt, R.E.; Kanashiro, M.; Fady, B.; Tomita, M.; Vinson, C. Genetic effects of forest management practices: Global synthesis and perspectives. For. Ecol. Manag. 2014, 333, 52–65. [Google Scholar] [CrossRef] [Green Version]
  37. Müller, M.; Seifert, S.; Finkeldey, R. Comparison and confirmation of SNP-bud burst associations in European beech populations in Germany. Tree Genet. Genomes 2017, 13, 59. [Google Scholar] [CrossRef]
  38. Rajendra, K.C.; Seifert, S.; Prinz, K.; Gailing, O.; Finkeldey, R. Subtle human impacts on neutral genetic diversity and spatial patterns of genetic variation in European beech (Fagus sylvatica). For. Ecol. Manag. 2014, 319, 138–149. [Google Scholar] [CrossRef]
  39. Fischer, M.; Bossdorf, O.; Gockel, S.; Hänsel, F.; Hemp, A.; Hessenmöller, D.; Korte, G.; Nieschulze, J.; Pfeiffer, S.; Prati, D.; et al. Implementing large-scale and long-term functional biodiversity research: The Biodiversity Exploratories. Basic Appl. Ecol. 2010, 11, 473–485. [Google Scholar] [CrossRef]
  40. Wöllauer, S.; Hänsel, F.; Nauss, T.; Forteva, S. Climate Data—Time Series Web Interface v1.0.19. Biodiversity Exploratories Information System. DatasetId=19007:2020. Available online: https://www.bexis.uni-jena.de (accessed on 7 April 2020).
  41. R Core Team. R: A Language and Environment for Statistical Computing. Available online: http://www.R-project.org/ (accessed on 7 April 2020).
  42. Tang, Y.; Horikoshi, M.; Wenxuan, L. ggfortify: Unified interface to visualize statistical result of popular R packages. R J. 2016, 8, 478–489. [Google Scholar] [CrossRef] [Green Version]
  43. Shorthouse, D. SimpleMappr, an Online Tool to Produce Publication-Quality Point Maps. Available online: http://www.simplemappr.net (accessed on 10 December 2020).
  44. Bates, D.; Mächler, M.; Bolker, B.; Walker, S. Fitting linear mixed-effects models using lme4. J. Stat. Softw. 2015, 67, 1–48. [Google Scholar] [CrossRef]
  45. Hothorn, T.; Bretz, F.; Westfall, P. Simultaneous inference in general parametric models. Biom. J. 2008, 50, 346–363. [Google Scholar] [CrossRef] [Green Version]
  46. Goral, F.; Schellenberg, J. Goeveg: Functions for Community Data and Ordinations. R Package Version 0.4.2. Available online: https://CRAN.R-project.org/package=goeveg (accessed on 7 April 2020).
  47. Giraudoux, P. Pgirmess: Data Analysis in Ecology. R Package Version 1.6.7. Available online: https://CRAN.R-project.org/package=pgirmess (accessed on 7 April 2020).
  48. Hartig, F. DHARMa: Residual Diagnostics for Hierarchical (Multi-Level/Mixed) Regression Models. R Package Version 0.2.7. Available online: https://CRAN.R-project.org/package=DHARMa (accessed on 7 April 2020).
  49. Wickham, H. Ggplot2: Elegant Graphics for Data Analysis; Springer: New York, NY, USA, 2016. [Google Scholar]
  50. Revelle, W. Psych: Procedures for Personality and Psychological Research. Version = 1.9.12. Available online: https://CRAN.R-project.org/package=psych (accessed on 7 April 2020).
  51. Bolte, A.; Czajkowski, T.; Kompa, T. The north-eastern distribution range of European beech a review. Forestry 2007, 80, 413–429. [Google Scholar] [CrossRef]
  52. Röhrig, E.; Bartsch, N.; von Lüpke, B. Waldbau auf Ökologischer Grundlage; Ulmer: Stuttgart, Germany, 2006; Volume 7, p. 479. [Google Scholar]
  53. Kapeller, S.; Dieckmann, U.; Schueler, S. Varying selection differential throughout the climatic range of Norway spruce in Central Europe. Evol. Appl. 2017, 10, 25–38. [Google Scholar] [CrossRef] [PubMed] [Green Version]
  54. Beloiu, M.; Stahlmann, R.; Beierkuhnlein, C. High recovery of saplings after severe drought in temperate deciduous forests. Forests 2020, 11, 546. [Google Scholar] [CrossRef]
  55. Konnert, M.; Behm, A. Genetische Strukturen einer Saatgutpartie—Einflussfaktoren und Einflussmöglichkeiten. Beitr. Forstwirtsch. Landsch. 1999, 33, 152–156. [Google Scholar]
  56. Bose, A.K.; Moser, B.; Rigling, A.; Lehmann, M.M.; Milcu, A.; Peter, M.; Rellstab, C.; Wohlgemuth, T.; Gessler, A. Memory of environmental conditions across generations affects the acclimation potential of scots pine. Plant Cell Environ. 2020, 43, 1288–1299. [Google Scholar] [CrossRef]
  57. Bräutigam, K.; Vining, K.J.; Lafon-Placette, C.; Fossdal, C.G.; Mirouze, M.; Marcos, J.G.; Fluch, S.; Fraga, M.F.; Guevara, M.A.; Abarca, D.; et al. Epigenetic regulation of adaptive responses of forest tree species to the environment. Ecol. Evol. 2013, 3, 399–415. [Google Scholar] [CrossRef]
  58. Kohmann, K.; Johnsen, Ø. The timing of bud set in seedlings of Picea abies from seed crops of a cool versus a warm spring and summer. Silvae Genet. 1994, 43, 329–333. [Google Scholar]
  59. Li, W.; Wang, X.; Li, Y. Stability in and correlation between factors influencing genetic quality of seed lots in seed orchard of Pinus tabuliformis Carr. over a 12-year span. PLoS ONE 2011, 6, e23544. [Google Scholar] [CrossRef] [Green Version]
  60. Müller, M.; Cuervo-Alarcon, L.; Gailing, O.; Rajendra, R.; Chhetri, M.; Seifert, S.; Arend, M.; Krutovsky, K.; Finkeldey, R. Genetic variation of European beech populations and their progeny from northeast Germany to southwest Switzerland. Forests 2018, 9, 469. [Google Scholar] [CrossRef] [Green Version]
  61. Liesebach, M. Wachstum und phänotypische Variation von sechs Herkünften der Rot-Buche (Fagus sylvatica L.) an einem Standort in Schleswig-Holstein. Appl. Agric. For. Res. 2012, 62, 179–192. [Google Scholar]
  62. Niinemets, Ü. Responses of forest trees to single and multiple environmental stresses from seedlings to mature plants: Past stress history, stress interactions, tolerance and acclimation. For. Ecol. Manag. 2010, 260, 1623–1639. [Google Scholar] [CrossRef]
  63. Gray, L.K.; Gylander, T.; Mbogga, M.S.; Chen, P.Y.; Hamann, A. Assisted migration to address climate change: Recommendations for aspen reforestation in western Canada. Ecol. Appl. 2011, 21, 1591–1603. [Google Scholar] [CrossRef] [PubMed]
  64. Navarro, L.; Morin, H.; Bergeron, Y.; Girona, M.M. Changes in spatiotemporal patterns of 20th century spruce budworm outbreaks in eastern Canadian boreal forests. Front. Plant Sci. 2018, 9. [Google Scholar] [CrossRef] [PubMed] [Green Version]
  65. Lavoie, J.; Montoro Girona, M.; Morin, H. Vulnerability of conifer regeneration to spruce budworm outbreaks in the eastern Canadian boreal forest. Forests 2019, 10, 850. [Google Scholar] [CrossRef] [Green Version]
Figure 1. Map of the three study regions in Germany with information on the number of plots within regions. The map was created with SimpleMappr [43].
Forests 11 01354 g001
Figure 2. Monthly mean precipitation (a) and monthly mean temperature (b) over all plots for the observation period of the experiment (September 2012 to November 2015), and (c) separation of the experimental plots of the three analyzed regions based on a PCA of climate data for the observation period of the experiment.
Forests 11 01354 g002
Figure 3. Interaction plot of mean plant height increment in 2015 of the different populations in the three study regions (please note that A5_09 was removed from AEW in the figure, since it is based on approx. half the sample size of the other populations and not significantly different to most populations (see Figure 4 for details), but would create the impression of superior plant height increment in the figure). (Populations from the SEW region: S5 and S9; from HEW: H10, H10_09, and H6; from AEW: A5, A5_09, and A8. For the populations H10 and A5, seeds from 2009 were also available for raising seedlings and are named H10_09 and A5_09, respectively).
Forests 11 01354 g003
Figure 4. Boxplots of plant height increment from planting (2012) to 2015 for the populations in the three study regions. Different letters indicate significant differences among populations. (Populations from the SEW region: S5 and S9; from HEW: H10, H10_09, and H6; from AEW: A5, A5_09, and A8. For the populations H10 and A5, seeds from 2009 were also available for raising seedlings and are named H10_09 and A5_09, respectively).
Forests 11 01354 g004
Figure 5. Interaction plot of mean plant survival in 2015 of the different populations in the three study regions. (Populations from the SEW region: S5 and S9; from HEW: H10, H10_09, and H6; from AEW: A5, A5_09, and A8. For the populations H10 and A5, seeds from 2009 were also available for raising seedlings and are named H10_09 and A5_09, respectively).
Forests 11 01354 g005
Figure 6. Survival rate of the different populations from 2013 to 2015 in the regions. Different letters indicate significant differences among populations. (Populations from the SEW region: S5 and S9; from HEW: H10, H10_09, and H6; from AEW: A5, A5_09, and A8. For the populations H10 and A5, seeds from 2009 were also available for raising seedlings and are named H10_09 and A5_09, respectively).
Forests 11 01354 g006
Publisher’s Note: MDPI stays neutral with regard to jurisdictional claims in published maps and institutional affiliations.

