Article

Economic Valuation of Carbon Storage and Sequestration in Retezat National Park, Romania

by
Robert-George Pache
,
Ioan Vasile Abrudan
and
Mihai-Daniel Niță
*
Faculty of Silviculture and Forest Engineering, Transilvania University of Brașov, 500036 Brașov, Romania
*
Author to whom correspondence should be addressed.
Forests 2021, 12(1), 43; https://doi.org/10.3390/f12010043
Submission received: 28 November 2020 / Revised: 27 December 2020 / Accepted: 29 December 2020 / Published: 30 December 2020

Abstract

:
Carbon storage and sequestration is one of the most important services provided by forest ecosystems, the most powerful tools for climate change mitigation and adaptation. Its value is not always captured and appreciated at a fair level, with people taking for granted these benefits provided by the ecosystems. Our first objective was to evaluate the amount of carbon storage and sequestration within a specific area—Retezat National Park (RNP), Romania, in a specific timeframe, using mainly the data from forest management plans. The second objective was to estimate the economic value of the carbon sequestered by the ecosystems within the national park. Based on the carbon market price, we calculated the monetary value of the sequestered carbon. The third objective was to cross-validate the model using mobile terrestrial LiDAR scanner 3D mapping technology in several field plots. Our results reveal comparable stocks of carbon with the ones modelled based on the forest management plans, enabling us to use these plans as an accurate source of information. The present study underlines that the financial effort for the management of the ecosystems which provide these services can be sustained by implementing financial mechanisms aiming to direct ecosystem services values into the management of these ecosystems.

1. Introduction

Forests include the most important carbon pool within the terrestrial ecosystems [1,2], playing a substantial role in the climate change mitigation process [3]. They also need to adapt to these changes to be able to provide efficient ecosystem services for human wellbeing [4].
Biodiversity loss, land degradation, pollution, resource depletion, and climate change have intensified in recent decades and have reached an unprecedented level in human history [5]. Despite all the agreements and targets assumed at the European and global levels, the sustainable use of resources and the ecological reconstruction of degraded areas have not reached the extent necessary to achieve these targets. On the contrary, the natural capital loss has reached an irreversible threshold, with enormous costs to society [6]. Urgent measures are being taken in this regard. Recently, the focus on forests and biological diversity associated with these ecosystems has moved up on the agenda of European policy makers due to the release of documents such as the European Green Deal, the 2030 Climate Target Plan, the EU Biodiversity Strategy for 2030, and the targets on carbon neutrality by 2050. The big question arising from these documents is: should we set aside forests or sustainable forest management? The EU Biodiversity Strategy for 2030 provides that a minimum of 10% of the EU territory must be strictly protected [7], while the bioeconomy relies on sustainable biomass [8], forestry being one of the main sources. The big challenge in the next decades will be to balance biodiversity conservation, aiming to maintain or to improve the conservation status of species and habitats, with the sustainable forest management that produces, on the one hand, the renewable materials much needed in the bioeconomy sector, and on the other, plenty of ecosystem services for human wellbeing. Part of these services will be lost by non-intervention (e.g., provisioning services through timber and non-timber products) and others will be gained (e.g., regulating services through sediment retention, water regulation, and cultural services through recreation). The necessary attention must be paid to the possible shift of pressure on forest resources from Europe to other parts of the planet.
Through an efficient way of storing carbon, sustainable forest management is considered one of the most cost-effective climate change mitigation solutions in forestry [3]. In the coming years, the targets on emission reduction will increase, leading to the necessity of a functional and stable carbon market that should become the main source of financing for the forest owners that voluntarily apply specific management that allows carbon storage and sequestration. Meanwhile, the valuation of carbon storage and sequestration methodologies must be refined and ready to be used in practice.
The various strategies that can be used in the fight against climate change, such as carbon sink, energy efficiency, renewable energy, reducing emissions from burning fossil fuels, etc., must be monetarily assessed to prioritize the implementation based on cost-effectiveness. Sustainable forest management is a cost-effective climate change mitigation solution with a series of other environmental, social, and economic co-benefits [3].
Plenty of studies have focused on estimating carbon stock, using satellite products [9,10], national forest inventory [11,12,13], specific field data collection [14] or mixed data sources [15]. Studies on the monetary valuation of forest carbon storage and sequestration have been conducted to date [16,17,18], but not to the same extent as the first ones; there is still a lot to do in this field.
The monetary valuation of forest ecosystem services is important because it attaches a price on nature [19]; therefore, the results of the valuation are more tangible and easier to interpret compared with less tangible ecosystem services (e.g., aesthetic, spiritual, biological regulation). This facilitates the process of raising awareness on the need to sustainably manage forest ecosystems. The valuation can also act as a guiding tool for public policy makers or private decision-makers involved in the climate change field [20]. The policy reforms related to the increasing of the EU’s climate ambition for 2030 and 2050 will help to ensure effective carbon pricing throughout the economy [21].
In terms of sequestered carbon estimation, previous studies reported in the literature [22,23,24,25] have focused on different approaches, most of them unstandardized, without independent cross-validation in the field. The InVEST software platform offers a standardized procedure by using open models to evaluate ecosystem services and tradeoffs in a geospatial environment [26]. This approach makes it easier to integrate objective cross-validation such as terrestrial LiDAR scanning technology.
Our overarching goal was to quantify and validate the valuation process through which the amount of both carbon stock and carbon sequestered is calculated and monetized by combining multiple techniques based on GIS and the terrestrial scanning and monetary valuation method showing the market value of the sequestered carbon in a specific time frame and area of interest. Our specific goals were to adapt an InVEST model to forested areas where management plans are available, to validate the method of estimating carbon stored using Terrestrial Laser Scanner technology in field inventory plots, and to propose a monetary valuation of carbon storage and sequestration for ecosystem services.

2. Materials and Methods

2.1. Study Area

Our study area was in the Retezat National Park, the first national park established in Romania and one of the richest in biodiversity. It is located in the southwestern part of Romania, in the western part of the Southern Carpathians, comprising most of the Retezat-Godeanu Massif, but also a portion of the Tarcu Mountains (Figure 1). The area is designated also as the MAB UNESCO Biosphere Reserve, a site of community importance (ROSCI0217 Retezat) and a special protection area (ROSPA0084 Retezat Mountains). Retezat is famous for its floristic diversity, housing 1179 species of higher plants. The existence there of more than a third of Romania’s flora is one of the reasons why this territory was declared a national park. Due to its very diverse habitats, natural or slightly modified by human intervention, Retezat is home to a particularly rich fauna, both in terms of the number of species and in terms of the large number of specimens that make up the populations of these species [27].

2.2. Data and Methods

The INVEST model requires a raster with the actual Land Use/Land Cover for each pixel where each unique number represents a different LULC category. Rasters values correspond to the carbon pools table containing land-use code, the carbon stock in the aboveground biomass, belowground biomass, dead organic matter, and soil (see Appendix A). The raster, with a resolution of 30 × 30 m2, was created by merging two matrices: a raster obtained based on the vectors available in the forest management plans and one raster for the rest of the other land uses, up to the national park boundaries, based on PANGAEA product [28].
For the valuation of carbon storage and sequestration ecosystem services, we used the InVEST application, which considers the values of the 4 carbon pools: aboveground biomass, belowground biomass, soil, and dead organic matter [26]. Based on the Land Use/Land Cover maps and the carbon amount in each of the carbon pools, we estimated the amount of carbon stored in a unit area in a 10-year timeframe.
The carbon pools values were determined based on the standing volume from the forest management plans using the provisions of the Guidelines for National Greenhouse Gas Inventories [29], for carbon density in aboveground biomass [30], belowground biomass, and in dead organic matter, and then the carbon density in soil [31].
To validate the estimated carbon based on the InVEST model, we placed 4 test plots in 4 different forest stands in which we used a mobile scanner for a precise determination of the position of each tree, the number of trees, diameter, volume and to derive the carbon stored at tree level. The design of the plot was circular with an area equal to the 30-m pixel size used in the InVEST model.
For mobile scanning, we used GeoSlam Zeb Revo, a portable scanner with a 3D mapping technology, a versatile technology adapted to any environment. The scanning process is based on the GeoSLAM algorithm, simultaneous location, and mapping which facilitates fast, dynamic mapping of the environment without the need for GPS, with a relative accuracy of 1–3 cm. The result was a pointcloud summing 1.5 million points in each plot.
To extract the tree parameters, the point cloud was processed using multiple steps such as off-ground point cloud extraction using cloth simulation filter, tree individualization (segmentation), determination of the characteristics of the tree stand, and each tree using 3D Forest [32].
To derive the total carbon stored by each tree from the validation plot, the following formula was used, and it was derived from unified equations based on the diameter at breast height (DBH) on spruce from previous studies [29,31,33]. This formula was used because spruce was majoritarian in all the validation plots.
Ctree = 5.73 − 2.45 × DBH + 0.316 × DBH2
Using a carbon market price, we estimated the economic value of the sequestered carbon (the avoided social damage of not releasing that ton of carbon into the atmosphere). For monetary evaluation, we used economic data such as price/ton of carbon, market discount rate, and the annual rate of change in the price of carbon (described in Appendix A). We also introduced the analysis of the global carbon price on the voluntary market, which was 3 US $/CO2 e in 2018 [34]. The carbon market has increased in recent years, but not at the level needed for achieving the Paris Agreement temperature goal. The World Bank estimates that an average price of 60 US $/tCO2 e is needed in 2020 to be in line with the achievement of the above-mentioned temperature goal [35].

3. Results

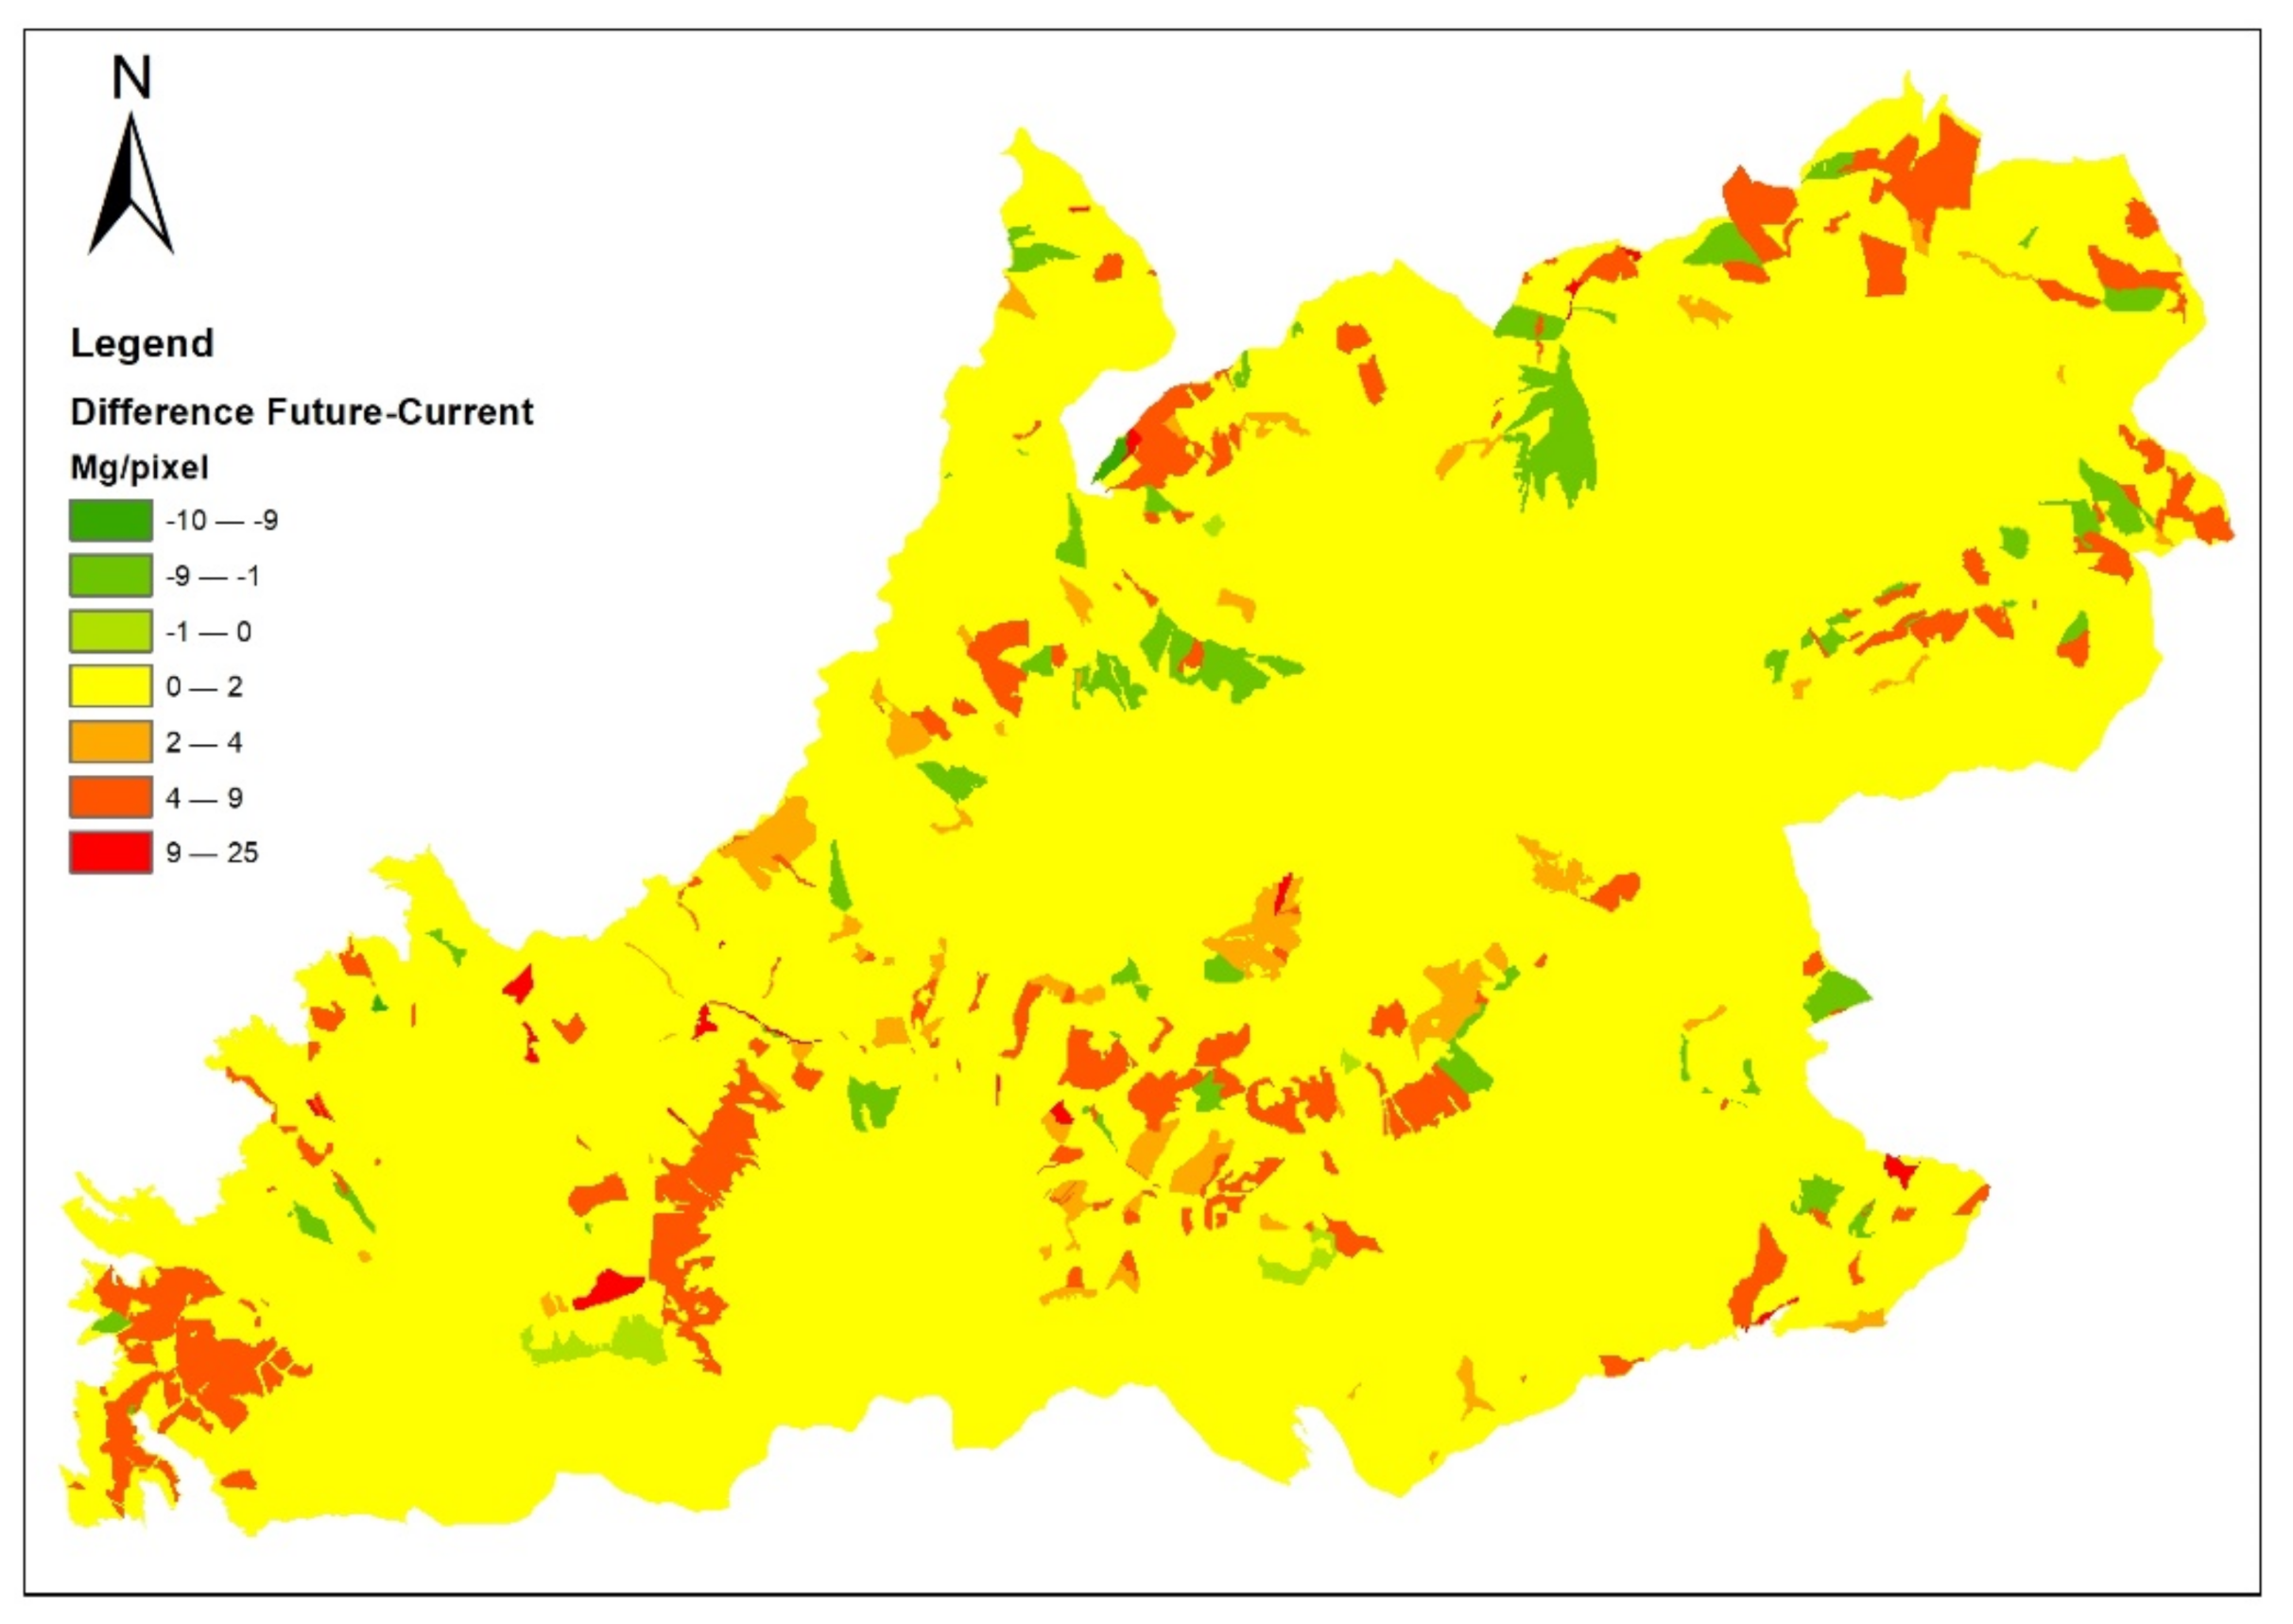
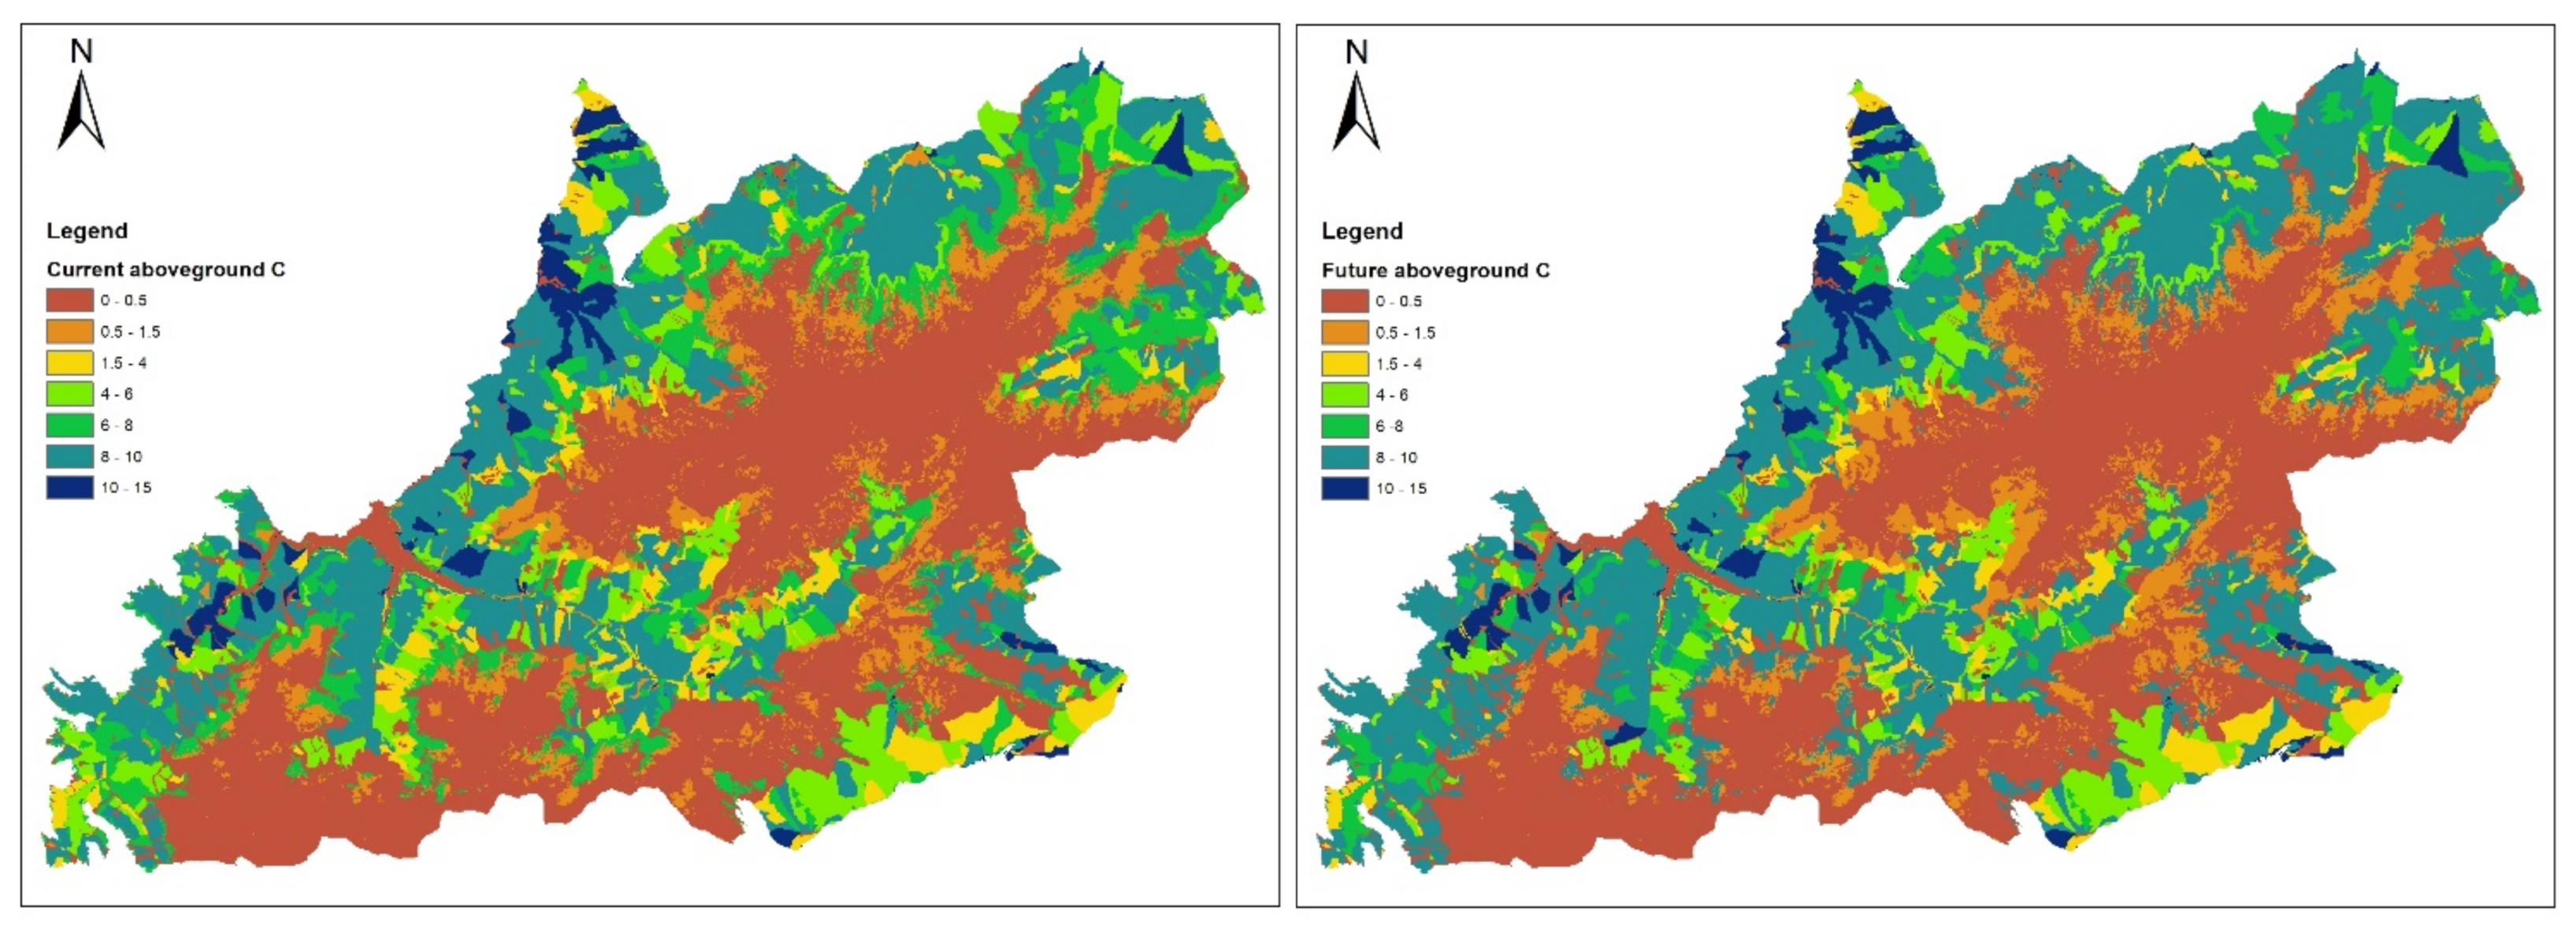
3.1. Carbon Stock and Sequestration in Retezat Mountains Park

The geo-spatial data from the forest management plan enhanced the results extracted with the Carbon model from InVEST. Thus, after running the Carbon model to InVEST, the results were described not only as a summary of all the data calculated by the model (Table 1) but under the format of a geospatial matrix, a raster containing the amount of carbon distributed on a 900 sq.m rectangular pixel (Figure 2).
The carbon storage rasters show the amount of carbon stored in each pixel for the current (2019) (Figure 2a) and future scenario (2029) (Figure 2b). These consist of the sum of all the carbon pools(see Appendix A Figure A1, Figure A2, Figure A3 and Figure A4) required by the model, with a breakdown of carbon in each pool on average of 30% aboveground, 9% belowground, 53% soil and 8% dead organic matter [29].
It can be observed that the pastures and most of the non-forest areas in the national park did not perform as carbon storage, most of them were classified in the lowest category with only 0–2 Mg/pixel. The most important storage amount can be observed in the old forest stands, from an orange to red color. The modeled values maintained the normal trend, and the younger the stands, the smaller the stored amount of carbon (Figure 2).
In terms of sequestered carbon, in Figure 3 it can be observed that the current landscape of Retezat National Park influenced the spatial distribution of the current and future carbon sequestration. The sequestration raster shows the difference in stored carbon between the future and current land cover. In the sequestration raster, some values are negative and others positive. Positive values indicate sequestered carbon and negative values indicate carbon that has been lost. We observed that the highest rate of carbon sequestration was registered in the young stands, and positive rates in stands less than 100 years old. The stand age was classified based on the information within the forest management plan. It can be observed that most of the old forest stands, with ages over 120 years losing carbon in a 10-year timeframe.

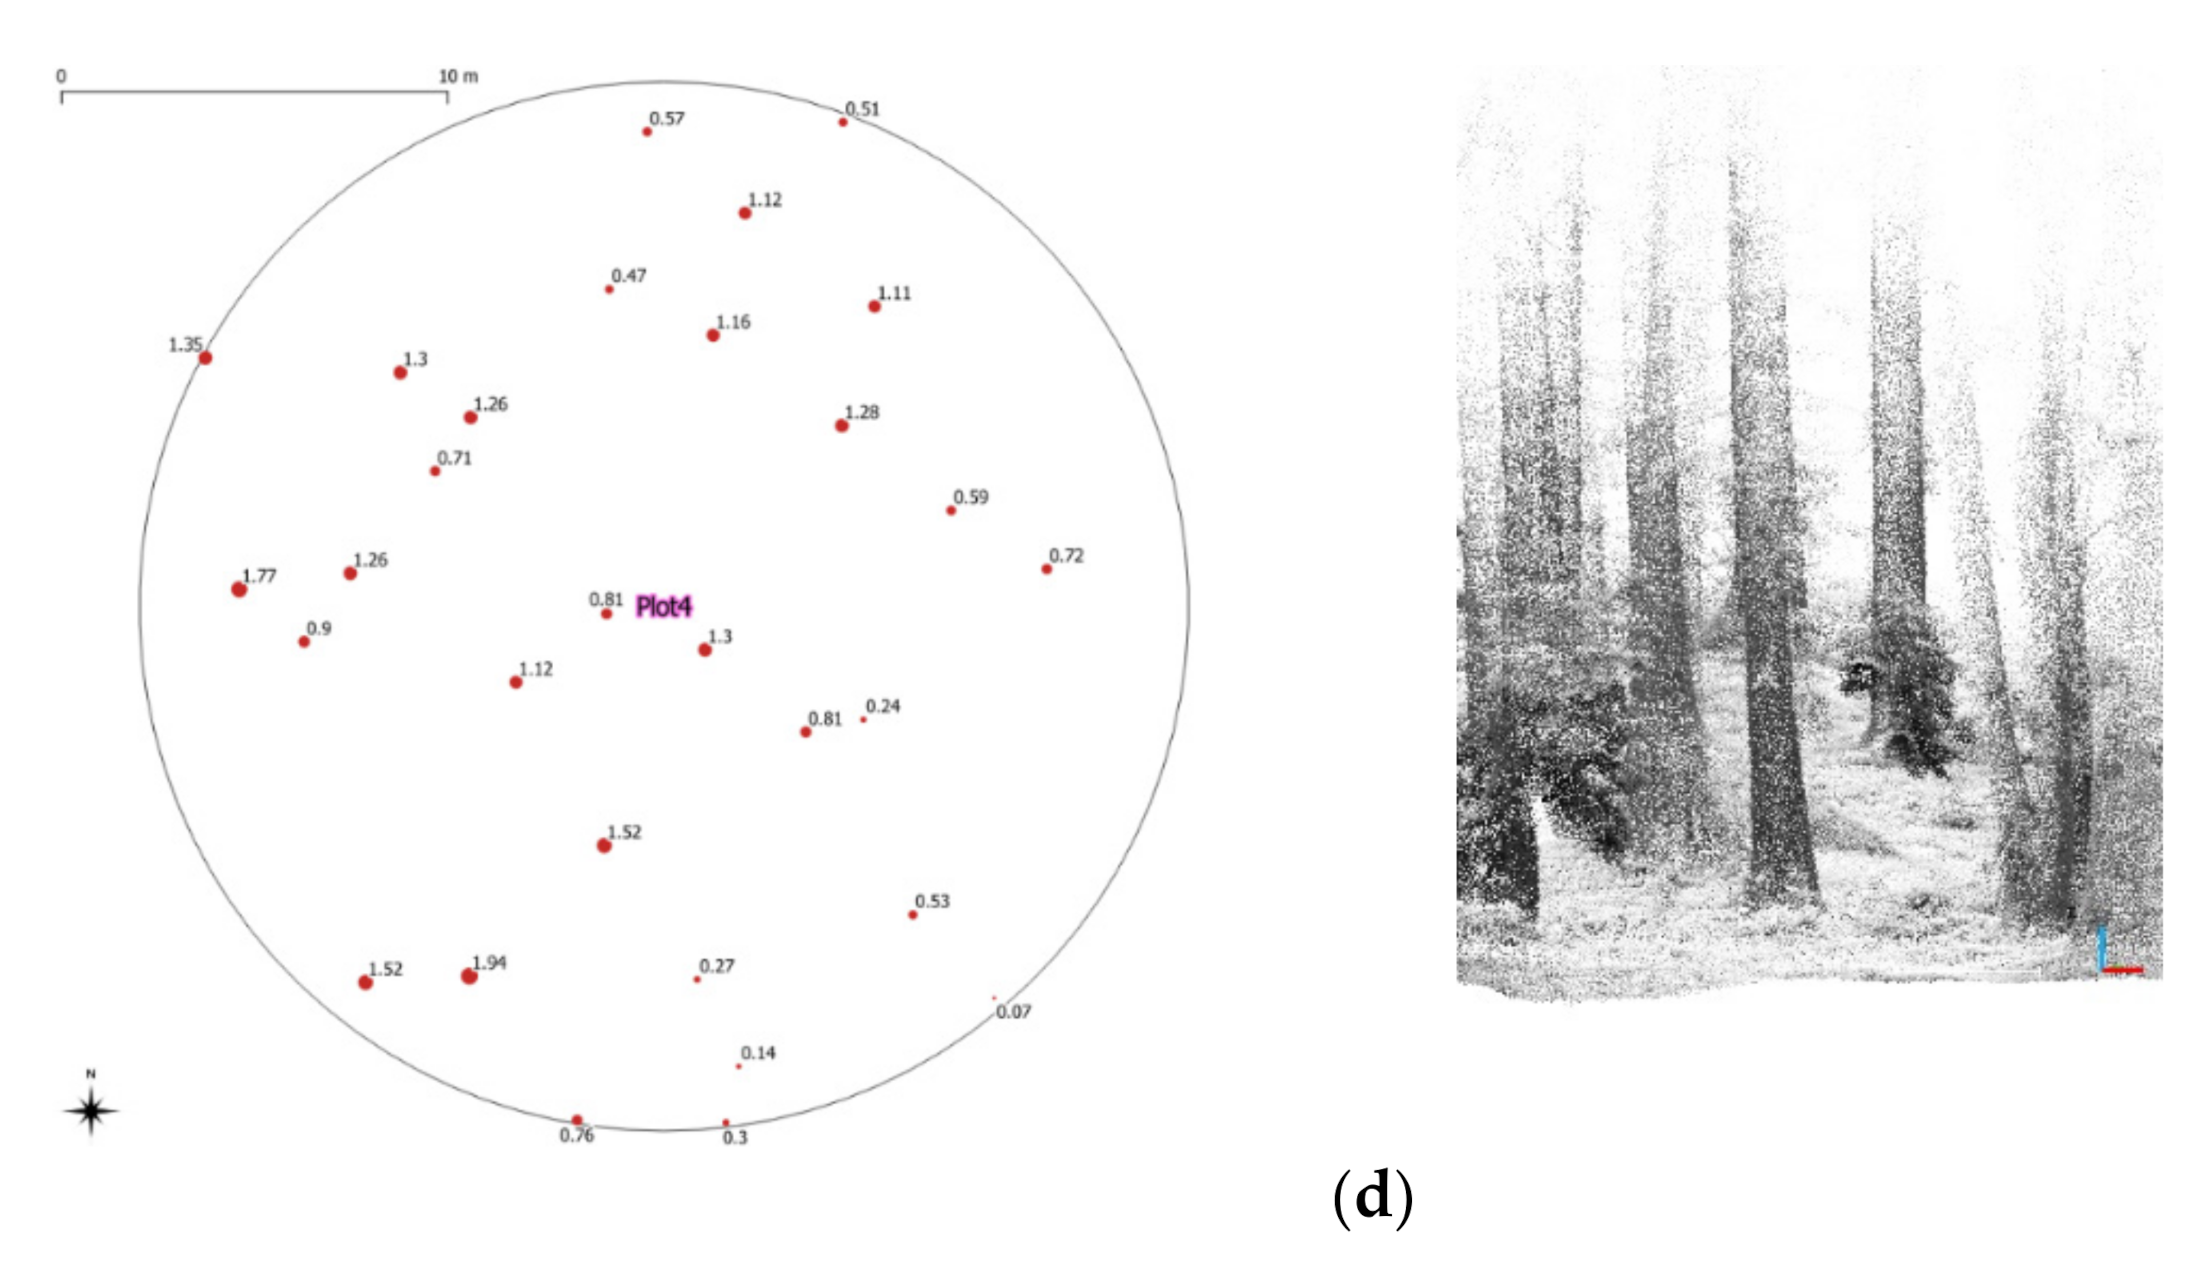
3.2. Estimated Carbon Stored Using Terrestrial Laser Scanner Technology

In the 4 plots, there were sampled 170 trees, and the point cloud’s models contained on average 12,200 points per tree. The carbon stock varies from 6.74 Mg of C (Plot 3), which is the plot with the highest number of trees, to 27.88 Mg of C (Plot 2) and 27.41 Mg of C (Plot 4), which have a significantly lower number of trees but with higher values at mean DBH, 0.58 and 0.55 m, compared to Plot 3. Plot 1 remains at 22.75 Mg of C, with a lower DBH of 0.52 m compared with Plot 2 and Plot 4 (Table 2).
The plot with the highest deviation is Plot 2, with diameter variation from 0.18 to 0.93 m.
When intersected with the InVEST models, the data calibrated with forest management inventory aggregated at the subcompartmental level and the plots hierarchy remained the same. Since the modeled values in the field plots provide only the total sequestered carbon, the comparison was performed on the sum of all the pools.
The plot with the lowest carbon sequestration remained Plot 3, with 6.95 Mg C, overestimating by 3%. The second in line, Plot 1, over-estimated the value of carbon by about 1% to a value of 22.82 Mg C rather than the 22.75 Mg C from the field estimated with TLS. Plot 2 was over-estimated by the InVEST adapted model by 3% from 27.88 Mg C field data. Plot 4 revealed the highest difference between modeled and field data with a value of 29.12 Mg C, and the InVEST model overestimated the field data, 27.41 Mg C, by approximately 6%. Figure 4 shows the tree position, pointcloud sample, and Mg C calculated at tree level for each of the plots in the analysis.

3.3. Monetary Valuation of Carbon Storage and Sequestration

Using the economic data, the simulation generated a raster with the economic value (currency per pixel) of the sequestered carbon in the actual and future scenarios (Figure 5). The total economic value of the carbon sequestration service within Retezat National Park was estimated at 1,706,070.28 US$ per 10 years (2019–2029). This value was calculated based on the 2018 global price of the voluntary carbon market. We also ran the model using the carbon price needed in 2020 for achieving the temperature goal established in the Paris Agreement (60 US $/tCO2 e). The results are twenty times higher than those that resulted from using the price of the voluntary market, showing an immense gap between the actual market and the needed one.
Moreover, the model provides intermediate results in the form of a raster on each carbon pool separately (aboveground, underground, in dead organic matter and the soil up to 90 cm), both for the current year (2019) and for the future scenario (2029) (see Appendix A).
According to the spatial distribution of the economic value of sequestered Carbon, there can be clusters of areas with high values grouped around the young stand with a high capacity of sequestering Carbon.

4. Discussion

Combining cross-technologies to quantify, spatialize, and monetize carbon storage and sequestration proves to be an important tool for stakeholders such as managers, decision-makers, and landowners. This clear representation and use of data and knowledge translate the information to break the boundaries which, in many cases, are blocking the understanding of how important this part of the ecosystem service inside a protected area is.
According to the Romanian Forest Code: “Legal entities and public institutions that benefit, from an economic, ecological or social point of view, from the effects of the protection function of neighboring forests, other than those owned, pay the value of these functions according to the provisions regulated by special law”. To date, due to the complexity of the benefits, a clear mechanism of evaluation and monetization has not been developed; moreover, the forest code stipulates that the budget of forest management units is constituted, among others, by the value of the effects of forest protection functions. In this light, our paper demonstrates the validity and applicability of a valuation process through which the amount of both stored and sequestered carbon is calculated and monetized, by combining multiple techniques based on GIS and terrestrial scanning. The proposed valuation method can be considered by policy makers in their efforts to adopt, by ministerial order, the methodology for the valuation and payment mechanism for forest ecosystem services, which is required by the Forest Code. This type of analysis requires average knowledge of GIS, especially in producing the data input. The InVEST visual interface makes the action of running the model user-friendly in different computational environments.
The InVEST model is a powerful tool in Carbon sequestration studies as it can be calibrated using data from other studies, such as forest management plans. Currently, the EU is preparing the Common Agriculture Policy Strategic Plan for 2021–2029, where payments for climate commitments are envisaged. Through our study, we demonstrated with field data that this adapted model can be successfully and rapidly applied to assess the carbon stored and sequestered by an ecosystem and to monetize the value of this service, for future per hectare payments.
The field data reveal that using forest management plan data provided a reliable calibration of the InVEST model. The differences between model estimation and ground data were from 1% to 6%. Thus, the data in these management plans are accurate and can be utilized in the economic valuation of the sequestered carbon. This will save an important amount of work, time, and of course money for fieldwork aiming to collect forest carbon-related data. However, for the replication of the valuation methodology presented in this paper, especially at the local level, we recommend conducting a terrestrial scanning validation or traditional forest inventory plots.
The payments for ecosystem services related to carbon and sustainable financing mechanisms such as Reduced Emissions from Deforestation and Forest Degradation (REDD+) [36] or woodland Carbon Code [37] need to be considered seriously and supported by the policy makers and the beneficiaries of these services [38]. The payments need to support the management of the ecosystems to provide the services at a level that will enable the climate targets adopted lately at the EU level to be reached.
The successfully proven implementation emphasizes that the model can now be adapted to all forest types in Romania either using national parameters or a locally developed one, and further research needs to be carried out for reliable usage to the entire protected area network nationwide.
The applied model is setting baselines as it assumes that the timber is not extracted within the national park for the analyzed period of 10 years. However, the model can be adjusted in the context in which in the national park, depending on its zoning, exploitation works can be performed. Moreover, it can be applied in any managed forest, with the monetary values of carbon sequestration decreasing, and be partially compensated by the financial gain obtained from the capitalization of the resulting wood mass.
Our combined approach of GIS, mobile terrestrial scanning, and modelling provides a fast, reliable, and standardized tool for estimating and economically evaluating carbon sequestration. We validated a method that can be transformed by decision-makers into a powerful geo-spatial tool to respond in case of major shifts such as windthrows, forest fires, etc. Moreover, spatialization of information can give a fresh and larger perspective on a national strategy on how to implement carbon payment schemes and where to start in terms of prioritization.

5. Conclusions

The information obtained after applying the economic valuation of carbon storage and sequestration services can support the design of voluntary financial mechanisms for the forest landowners who are willing to adopt conservation-oriented management. In Romania, the forest management plan is a valuable source of reliable and standardized information for carbon valuation.
The implementation of forest carbon valuation results may encounter a series of obstacles that must be exceeded. The lack of continuity in the agenda of the political class may lead to giving up the initiatives in this field. Moreover, the assent of local communities and equitable benefit sharing issues are important barriers that need to be addressed before starting the implementation of carbon payment schemes. Deficiencies of carbon markets, uncertain climate effectiveness, and governance issues [39] are additional issues that might be considered.
Achieving the average carbon price needed for forest carbon projects is beneficial mainly to help meet emissions reduction goals. This common ground is needed to create the legal framework and infrastructure required by a functional carbon market, to improve stakeholders’ acceptance, to increase data accuracy [35] and transparency, and to include this topic as a priority in the national political agenda.
An important challenge arises at the European level on harmonizing the biodiversity targets with climate targets, with a direct impact on landowners and managers. This challenge can be overcome by involving in the process the forest management experience, forest research heritage and academia.

Author Contributions

Conceptualization, R.-G.P., M.-D.N. and I.V.A.; methodology, R.-G.P. and M.-D.N.; software, M.-D.N.; validation, R.-G.P. and M.-D.N.; formal analysis, M.-D.N.; investigation, R.-G.P. and M.-D.N.; resources, R.-G.P.; data curation, M.-D.N.; writing—original draft preparation, R.-G.P.; writing—review and editing, R.-G.P., M.-D.N. and I.V.A.; visualization, R.-G.P.; supervision, I.V.A. All authors have read and agreed to the published version of the manuscript.

Funding

This research received no external funding. The APC was funded by Transilvania University of Brasov.

Acknowledgments

The authors would like to thank for access to the forest to National Forest Administration ROMSILVA—Retezat National Park Administration, and for guidance in the field during the collection of data to Forest Design SRL.

Conflicts of Interest

The authors declare no conflict of interest.

Appendix A

Appendix A.1. Land Use Data

For the land use code column, in the case of forests, we have used: the forest types which are stated in the forest management plan (e.g., 1.1. pure spruce forests, 1.2. spruce-fir forests etc.), the stand crown density and the actual forest age. For more accurate results, allowing a better estimation of carbon sequestration, considering the characteristics of each stand, the following coding was used:
3 classes of crown density: 1—from 0–0.3, 2—from 0.4–0.6 and 3—from 0.7–1.
7 age classes—1: 0–20 years, 2: 21–40 years, 3: 41–60 years, 4: 61–80 years, 5: 81–100 years, 6: 101–120 years, 7: >120 years.
For the other land uses and for forested areas without forest management plan (no volume data) we have used the codes specific to LUCAS product, from 1 to 10, respectively: artificial land—code 1; cropland seasonal and perennial—codes 2 and 3; forests (broadleaved, coniferous and mixed)—codes 4, 5 and 6; shrubland—code 7; grassland—code 8; bare land—code 9; water—code 10.

Appendix A.2. Carbon Pools Values

For carbon density in aboveground biomass [Mg/ha], We have used the following equation (Brown, 1997):
Density of aboveground biomass (t/ha) = VOB ∗ WD ∗ FEB, where:
VOB = volume over bark tree bole (m3);
WD = volume-weighted average wood density (1 of oven-dry biomass per m3 green volume);
BEF = biomass expansion factor (ratio of aboveground oven-dry biomass of trees to oven-dry biomass of inventoried volume).
The value of the volume was taken from the forest management plans. For the wood density and the biomass expansion factor we have used the information reported by Romania to European Union and differs depending on the tree species [29].
InVEST use the elementary carbon biomass, comparing to other series of sources, among which is also IPCC, reports units of biomass. To convert biomass metric tons in carbon metric tons we have used a conversion factor ranging from 0.43 to 0.51. These conversion factors, by major forest types and by climate regions, are listed in IPCC [29].
Following the analysis of the existing forest types within the Retezat National Park, we concluded that the corresponding average conversion factor, which can be used in the calculation is 0.49.
Carbon density in the belowground biomass [Mg/ha].
For the forested LULC categories the belowground biomass can be estimated as the root-to-shoot ratio of belowground to aboveground biomass. We used the IPCC values for our ecoregion, considering the forest types within Retezat NP [29]. Thus, the value of the carbon density in the belowground biomass have been calculated by multiplying the value of the root to shoot ratio with the carbon density in the aboveground biomass.
Carbon density in soil [Mg/ha].
This is the largest carbon pool within the forest ecosystem. Its density has been calculated by considering that the carbon stocks in the soil represents about 53% of the total carbon stocks [31].
Carbon density in dead organic matter [Mg/ha].
This value is calculated as a percentage applied to the aboveground biomass carbon density. IPCC presents values of the percentage according to the climatic region and forest type, the average utilized value being 25% from the aboveground biomass [29].
Future LULC (needed for sequestration and valuation): this raster have been obtained by adding 10 years to the forest stands age. In this scenario, some stands have migrated from an age class to another, which led to the changes in the volume of the stands and therefore on the carbon stored amount.
Future year of the LULC (needed for sequestration and valuation): the year described by the map of the future LULC. Within the calculations we have used 2029, the scenario for analysis being 10 years long.
Figure A1. Aboveground C rasters.
Forests 12 00043 g0a1
Figure A2. Belowground C rasters.
Forests 12 00043 g0a2
Figure A3. Dead organic matter C rasters.
Forests 12 00043 g0a3
Figure A4. Soil C rasters.
Forests 12 00043 g0a4

Appendix A.3. Economic Data

-
Price/ton of carbon: the price in the currency per metric ton of elementary carbon (not CO2). According to Ecosystem marketplace—a global platform for the transparency of the information in the field of environment and payments for ecosystem services, the average price on the voluntary market in 2018 was 3 $/tCO2 equivalent [34]. In order to reach the price per tonne of carbon, we multiplied the price per tCO2 equivalent with 3.67 coefficient. We come up with a price of 11 $/tonne of carbon, which enters into analysis.
-
market discount rate, which reflects the preferences of the society for the immediate benefits compared with future benefits, have been estimated at 7%, a value recommended by the US Government for cost-benefit related environment projects.
-
annual rate of change in the price of carbon, a percentage value which adjust the value of the sequestered carbon. After the analysis, we have used 3% as an annual rate of change.

References

  1. Huang, L.; Zhou, M.; Lv, J.; Chen, K. Trends in global research in forest carbon sequestration: A bibliometric analysis. J. Clean. Prod. 2020, 252, 119908. [Google Scholar] [CrossRef]
  2. Karsenty, A.; Blanco, C.; Dufour, T. Forest and Climate Change Instruments Related to the United Nations Framework Convention on Climate Change and Their potential for Sustainable Forest Management in Africa; FAO: Rome, Italy, 2003. [Google Scholar]
  3. Field, C.B.; Barros, V.R.; Dokken, D.J.; Mach, K.J.; Mastrandrea, M.D.; Bilir, T.E.; Chatterjee, M.; Ebi, K.L.; Estrada, Y.O.; Genova, R.C.; et al. (Eds.) Summary for Policymakers. In Climate Change 2014: Mitigation of Climate Change. Contribution of Working Group III to the Fifth Assessment Report of the Intergovernmental Panel on Climate Change; Cambridge University Press: Cambridge, UK; New York, NY, USA, 2014; pp. 1–32. [Google Scholar]
  4. Mery, G.; Katila, P.; Galloway, G.; Alfaro, R.I.; Kanninen, M.; Lobovikov, M.; Varjo, J. Forests and Society–Responding to Global Drivers of Change; IUFRO World Series; IUFRO: Vienna, Austria, 2010; Volume 25, 509p. [Google Scholar]
  5. Díaz, S.; Settele, J.; Brondízio, E.S.; Ngo, H.T.; Guèze, M.; Agard, J.; Arneth, A.; Balvanera, P.; Brauman, K.A.; Butchart, S.H.M.; et al. (Eds.) Summary for Policymakers of the Global Assessment Report on Biodiversity and Ecosystem Services of the Intergovernmental Science-Policy Platform on Biodiversity and Ecosystem Services; IPBES Secretariat: Bonn, Germany, 2019; 56p. [Google Scholar] [CrossRef]
  6. Farley, J. Ecosystem Services: The Economics Debate, Ecosystem Services; Elsevier: Amsterdam, The Netherlands, 2012; Volume 1, pp. 40–49. [Google Scholar] [CrossRef] [Green Version]
  7. EU Biodiversity Strategy for 2030: Communication from the Commission to the European Parliament, the Council, the European Economic and Social Committee and the Committee of the Regions. 2020. Available online: https://eur-lex.europa.eu/legal-content/EN/TXT/DOC/?uri=CELEX:52020DC0380&from=EN (accessed on 16 October 2020).
  8. Scarlat, N.; Dallemand, J.F.; Monforti-Ferrario, F.; Nita, V. The role of biomass and bioenergy in a future bioeconomy: Policies and facts. Environ. Dev. 2015, 15, 3–34. [Google Scholar] [CrossRef]
  9. Olofsson, P.; Kuemmerle, T.; Griffiths, P.; Knorn, J.; Baccini, A.; Gancz, V.; Blujdea, V.; Houghton, R.A.; Abrudan, I.V.; Woodcock, C.E. Carbon implications of forest restitution in post-socialist Romania. Environ. Res. Lett. 2011, 6, 045202. [Google Scholar] [CrossRef]
  10. Abbas, S.; Irteza, S.M.; Shahzad, N. Approaches of Satellite Remote Sensing for the Assessment of Above-Ground Biomass across Tropical Forests: Pan-tropical to National Scales. Remote Sens. 2020, 12, 3351. [Google Scholar] [CrossRef]
  11. Harja, D.; Dewi, S.; Heryawan, F.X.; van Noordwijk, M. Forest Carbon-Stock Estimates Based on National Forest Inventory Data; ALLREDDI Brief 02; World Agroforestry Centre (ICRAF) Southeast Asia Program: Bogor, Indonesia, 2011. [Google Scholar]
  12. Smith, J.E.; Heath, L.S.; Woodbury, P.B. How to estimate forest carbon for large areas from inventory data. J. For. 2004, 102, 25–31. [Google Scholar]
  13. Grüneberg, E.; Schöning, I.; Riek, W.; Ziche, D.; Evers, J. Carbon Stocks and Carbon Stock Changes in German Forest Soils. In Status and Dynamics of Forests in Germany; Wellbrock, N., Bolte, A., Eds.; Springer Nature Switzerland AG: Cham, Switzerland, 2019. [Google Scholar] [CrossRef] [Green Version]
  14. Baral, S.K.; Malla, R.; Ranabhat, S. Above-ground carbon stock assessment in different forest types of Nepal. Banko Janakari 2010, 19, 10–14. [Google Scholar] [CrossRef] [Green Version]
  15. Vicharnakorn, P.; Shrestha, R.; Nagai, M.; Salam, A.; Kiratiprayoon, S. Carbon stock assessment using remote sensing and forest inventory data in Savannakhet, Lao PDR. Remote Sens. 2014, 6, 5452–5479. [Google Scholar] [CrossRef] [Green Version]
  16. Dieter, M.; Elsasser, P. Quantification and Monetary Valuation of Carbon Storage in the Forests of Germany in the Framework of National Accounting; BFH Institute for Economics Working Paper 2002/8; University of Hamburg: Hamburg, Germany, 2002; 64p. [Google Scholar]
  17. Banasiak, A.; Bilmes, L.; Loomis, B. Carbon Sequestration in the U.S. National Parks: A Value beyond Visitation; HKS Working Paper No. RWP15-007; Harvard Kennedy School: Cambridge, MA, USA, 2015. [Google Scholar] [CrossRef] [Green Version]
  18. Kazak, J.; Malczyk, J.; Castro, D.G.; Szewrański, S. Carbon sequestration in forest valuation. Real Estate Manag. Valuat. 2016, 24, 76–86. [Google Scholar] [CrossRef] [Green Version]
  19. Daily, G. Nature’s Services: Societal Dependence on Natural Ecosystems; Island Press: Washington, DC, USA, 1997; p. 392. [Google Scholar] [CrossRef]
  20. Valatin, G. Carbon Valuation in Forestry and Prospects for European Harmonization–European Forest Institute Technical Report 97. 2014. Available online: https://efi.int/sites/default/files/files/publication-bank/2018/tr_97.pdf (accessed on 19 October 2020).
  21. European Green Deal: Communication from the Commission to the European Parliament, the Council, the European Economic and Social Committee and the Committee of the Regions. 2019. Available online: https://eur-lex.europa.eu/legal-content/EN/TXT/DOC/?uri=CELEX:52019DC0640&from=EN (accessed on 15 October 2020).
  22. Popa, B.; Pascu, M.; Nita, D.M.; Borz, S.A.; Codreanu, C. The Value of Forest Ecosystem Services in Romanian Protected Areas–A Comparative Analysis of Management; Series II; Bulletin of the Transilvania University of Brasov. Forestry, Wood Industry, Agricultural Food Engineering, Transilvania University: Brasov, Romania, 2013; Volume 6, p. 53. [Google Scholar]
  23. Suh, S.; Johnson, J.A.; Tambjerg, L.; Sim, S.; Broeckx-Smith, S.; Reyes, W.; Chaplin-Kramer, R. Closing yield gap is crucial to avoid potential surge in global carbon emissions. Global Environ. Chang. 2020, 63, 102100. [Google Scholar] [CrossRef]
  24. Chaplin-Kramer, R.; Sharp, R.P.; Mandle, L.; Sim, S.; Johnson, J.; Butnar, I.; McLachlan, N. Spatial patterns of agricultural expansion determine impacts on biodiversity and carbon storage. Proc. Natl. Acad. Sci. USA 2015, 112, 7402–7407. [Google Scholar] [CrossRef] [PubMed] [Green Version]
  25. Popa, B.; Borz, S.A.; Nita, M.D.; Ioras, F.; Iordache, E.; Borlea, F.; Abrudan, I.V. Forest ecosystem services valuation in different management scenarios: A case study of the Maramures Mountains. Balt. For. 2016, 22, 327–340. [Google Scholar]
  26. Sharp, R.; Douglass, J.; Wolny, S.; Arkema, K.; Bernhardt, J.; Bierbower, W.; Chaumont, N.; Denu, D.; Fisher, D.; Glowinski, K.; et al. VEST 3.8.9.post13+ug.ga74679f User’s Guide; The Natural Capital Project, Stanford University, University of Minnesota, The Nature Conservancy, and World Wildlife Fund, Stanford University: Stanford, CA, USA, 2020. [Google Scholar]
  27. Management Plan of Retezat National Park; Retezat National Park Administration: Hunedoara, Romania, 2013.
  28. Pflugmacher, D.; Rabe, A.; Peters, M.; Hostert, P. Mapping pan-European land cover using Landsat spectral-temporal metrics and the European LUCAS survey. Remote Sens. Environ. 2019, 221, 583–595. [Google Scholar] [CrossRef]
  29. Aalde, H.; Gonzalez, P.; Gytarsky, M.; Krug, T.; Kurz, W.A.; Ogle, S.; Raison, J.; Schoene, D.; Ravindranath, N.H.; Elhassan, N.G.; et al. Guidelines for National Greenhouse Gas Inventories–Intergovernmental Panel on Climate Change Volume 4-Agriculture, Forestry and Other Land Use; Eggleston, H.S., Buendia, L., Miwa, K., Ngara, T., Tanabe, K., Eds.; IGES: Hayama, Japan, 2006; Available online: https://www.ipcc-nggip.iges.or.jp/public/2006gl/pdf/4_Volume4/V4_04_Ch4_Forest_Land.pdf (accessed on 3 October 2020).
  30. Brown, S. Estimating Biomass and Biomass Change of Tropical Forests: A Primer; Report for FAO For. Pap. 1986; FAO Forestry Department: Rome, Italy, 1997; Volume 134, Available online: https://www.researchgate.net/publication/239974368_Estimating_Biomass_and_Biomass_Change_of_Tropical_Forests_A_Primer (accessed on 12 October 2020).
  31. Wellbrock, N.; Grüneberg, E.; Riedel, T.; Polley, H. Carbon stocks in tree biomass and soils of German forests. Cent. Eur. For. J. 2017, 63, 105–112. [Google Scholar] [CrossRef] [Green Version]
  32. 3D FOREST Tool for Processing Point Clouds from Forest Environment. 2020. Available online: www.3DForest.eu (accessed on 16 September 2020).
  33. Mukkonen, P. Generalized allometric volume and biomass equations for some tree species in Europe. Eur. J. For. Res. 2007, 126, 157–166. [Google Scholar] [CrossRef]
  34. Donofrio, S.; Maguire, P.; Merry, W.; Zwick, S. Financing Emissions Reductions for the Future-State of the Voluntary Carbon Markets. 2019. Available online: https://www.ecosystemmarketplace.com/carbon-markets (accessed on 21 October 2020).
  35. World Bank and Ecofys. State and Trends of Carbon Pricing 2018 (May); World Bank: Washington, DC, USA, 2018. [Google Scholar] [CrossRef]
  36. Reducing Emissions from Deforestation and Forest Degradation in Developing Countries (REDD+). 2020. Available online: https://redd.unfccc.int/ (accessed on 10 November 2020).
  37. UK Woodland Carbon Code. 2020. Available online: https://www.woodlandcarboncode.org.uk/ (accessed on 10 November 2020).
  38. Neugarten, R.A.; Langhammer, P.F.; Osipova, E.; Bagstad, K.J.; Bhagabati, N.; Butchart, S.H.M.; Dudley, N.; Elliott, V.; Gerber, L.R.; Gutierrez Arrellano, C.; et al. Tools for Measuring, Modelling, and Valuing Ecosystem Services: Guidance for Key Biodiversity Areas, Natural World Heritage Sites, and Protected Areas; Groves, C., Ed.; IUCN: Gland, Switzerland, 2018; 70p. [Google Scholar] [CrossRef] [Green Version]
  39. St-Laurent, G.P.; Hagerman, S.; Hoberg, G. Barriers to the development of forest carbon offsetting: Insights from British Columbia, Canada. J. Environ. Manag. 2017, 203, 208–217. [Google Scholar] [CrossRef] [PubMed]
Figure 1. Location of the study area.
Forests 12 00043 g001
Figure 2. Carbon storage rasters: (a) carbon stored in the current scenario (2019); (b) carbon stored in the future scenario (2029).
Forests 12 00043 g002
Figure 3. Distribution of sequestered carbon (gain&loss—10 years).
Forests 12 00043 g003
Figure 4. Tree position, pointcloud sample, and Mg C calculated at tree level containing the total carbon stored in aboveground and underground for: (a) Plot 1, (b) Plot 2, (c) Plot 3, (d) Plot 4.
Forests 12 00043 g004aForests 12 00043 g004b
Figure 5. Spatial distribution of the economic value of sequestered Carbon.
Forests 12 00043 g005
Table 1. Summary of data computed by the carbon model.
Modeled DataValueUnit
Total current carbon6,021,295.25Mg of C
Total future carbon6,252,395.13Mg of C
Change in C for future231,099.98Mg of C
Net present value from current to future (3 US $/tCO2e)1,706,070.28USD
Net present value from current to future (60 US $/tCO2e)34,121,405.52USD
Table 2. Descriptive statistics for plots.
Descriptive
Statistics
Plot 1Plot 2Plot 3Plot 4
DBHCarbon kgDBHCarbon kgDBHCarbon kgDBHCarbon kg
Mean0.52784.610.581072.310.1679.350.55913.73
St. Error0.0374.080.04132.960.0117.270.0389.46
Median0.54785.410.621070.410.1220.320.56856.75
St. dev.0.14398.930.21677.950.10159.260.16490.01
Sample Var.0.02159,145.700.04459,621.420.0125,363.720.03240,109.96
Kurtosis1.361.63−0.60−0.595.0611.44−0.38−0.73
Skewness−0.450.78−0.440.282.263.38−0.510.11
Range0.621811.220.752455.520.49818.160.631866.25
Minimum0.1974.210.1866.720.062.270.1973.26
Maximum0.811885.430.932522.240.55820.430.821939.50
Sum15.0422,753.7015.1827,880.0613.426744.7216.5827,411.84
No. of trees2929262685853030
Publisher’s Note: MDPI stays neutral with regard to jurisdictional claims in published maps and institutional affiliations.

