Article

Iterative Models for Early Detection of Invasive Species across Spread Pathways

1
USDA Animal and Plant Health Inspection Service, Fort Collins, CO 80526, USA
2
US Geological Survey, Fort Collins Science Center, Fort Collins, CO 80526, USA
3
USDA Animal and Plant Health Inspection Service, Buzzards Bay, MA 02542, USA
4
USDA Forest Service, Arapaho and Roosevelt National Forests and Pawnee National Grassland, Fort Collins, CO 80526, USA
5
Front Range Data Analytics LLC, Fort Collins, CO 80521, USA
6
Conservation Science Partners, Fort Collins, CO 80524, USA
*
Author to whom correspondence should be addressed.
Forests 2019, 10(2), 108; https://doi.org/10.3390/f10020108
Submission received: 30 November 2018 / Revised: 20 December 2018 / Accepted: 21 December 2018 / Published: 29 January 2019

Abstract

:
Species distribution models can be used to direct early detection of invasive species, if they include proxies for invasion pathways. Due to the dynamic nature of invasion, these models violate assumptions of stationarity across space and time. To compensate for issues of stationarity, we iteratively update regionalized species distribution models annually for European gypsy moth (Lymantria dispar dispar) to target early detection surveys for the USDA APHIS gypsy moth program. We defined regions based on the distances from the invasion spread front where shifts in variable importance occurred and included models for the non-quarantine portion of the state of Maine, a short-range region, an intermediate region, and a long-range region. We considered variables that represented potential gypsy moth movement pathways within each region, including transportation networks, recreational activities, urban characteristics, and household movement data originating from gypsy moth infested areas (U.S. Postal Service address forwarding data). We updated the models annually, linked the models to an early detection survey design, and validated the models for the following year using predicted risk at new positive detection locations. Human-assisted pathways data, such as address forwarding, became increasingly important predictors of gypsy moth detection in the intermediate-range geographic model as more predictor data accumulated over time (relative importance = 5.9%, 17.36%, and 35.76% for 2015, 2016, and 2018, respectively). Receiver operating curves showed increasing performance for iterative annual models (area under the curve (AUC) = 0.63, 0.76, and 0.84 for 2014, 2015, and 2016 models, respectively), and boxplots of predicted risk each year showed increasing accuracy and precision of following year positive detection locations. The inclusion of human-assisted pathway predictors combined with the strategy of iterative modeling brings significant advantages to targeting early detection of invasive species. We present the first published example of iterative species distribution modeling for invasive species in an operational context.

1. Introduction

Effective targeting for early detection of invasive species requires knowledge of an organism’s biology and mechanisms of invasion, as well as the ability to translate that information into an optimized surveillance program [1]. A popular tool for invasive species managers is the use of species distribution models (SDMs) to define the geographic extent over which an invading species may occur [2,3]. Factors that influence realized distributions (e.g., where a species is actually found) may be categorized by the biotic-abiotic-movement (or “BAM”) framework [4]. In practice, researchers most often define distributions by an organism’s potential niche [5], estimated by the range of abiotic variability within which it can survive and reproduce. However, potential distributions may be further limited by biotic interactions that arise from other processes, such as competition [6,7], predation [8], and parasitism [9,10]. The movement component of the BAM diagram describes habitat accessibility through dispersal, such that areas of the predicted niche are within reach of dispersing organisms [11]. For invasive species distribution models (iSDMs), dispersal may be assisted by human movement, which can transport organisms across long distances [12,13,14,15]. The inclusion of dispersal mechanisms or “pathways” within iSDMs may be an effective approach for optimizing early detection programs to areas with high potential for invasion [16,17,18].
Pathways can be defined as the mechanisms or routes by which species arrive at new regions or ecosystems [19]. Invasion success is partially defined by the magnitude and spatio-temporal variability of propagule pressure across invasion pathways [20,21]. Therefore, development of pathway predictors for iSDMs will be most informative when they are proximate to the mechanism of dispersal [2] and include information on origin, destination, and rate of movement per time step [22,23,24,25]. Examples of pathway predictors in iSDMs are sparse and typically involve spatial kernels as dispersal predictors [18,26,27]. Pathways models fitted to large geographic extents are particularly under-represented [28,29], and even fewer examples exist of volume-based pathways predictors [30]. However, there is potential for using such pathway models [31] to guide early detection and rapid response, or EDRR [32]. Pathways data in SDMs not only refines potential distribution to more targeted risk areas, but also more explicitly supports the operational use of SDMs for EDRR by targeting the mechanisms for how invasive species enter an ecosystem [22]. The quantification of major pathways can guide policy programs [33] to target high risk pathways in outreach campaigns designed to prevent human-assisted spread [34].
However, there remain significant challenges [35,36,37] in the development of iSDMs, particularly to target early detection. The process of biological invasion is both spatially and temporally dynamic, which violates assumptions of stationarity in SDMs for invasive species [38]. The assumption of a species in equilibrium with its environment (i.e., temporal stationarity) results in underprediction of risk area [39], especially in earlier stages of the invasion process [38,40]. Spatial stationarity is often violated, especially over large geographic extents, because abiotic/biotic constraints may vary over space [39] or the organism exhibits characteristics of stratified dispersal [41,42]. Predictive models following suggested guidelines [43,44,45] and iterated over time to test hypothetical processes of invasion [46] provide a more informative and adaptive framework for managing species distributions than single model development [47]. Iteratively updating iSDMs improves the detection of new invasion hotspots [48,49], expands predicted geographic distributions [50], and increases the reliability of model predictions [51,52], particularly when paired with a targeted survey design [53]. We apply these principles of handling non-stationarity and iterative modeling to the European gypsy moth (Lymantria dispar dispar Linnaeus 1758) to increase our understanding of its mechanisms for spread and how to increase effectiveness for early detection within operational contexts.
The European gypsy moth is a forest pest accidentally introduced to Medford, Massachusetts, USA. in 1869 that has steadily spread across the north-eastern United States, establishing as far north as Maine, west toward Wisconsin and Minnesota, and as far south as Virginia. Gypsy moth feed on more than 300 species of trees and shrubs, making it a generalist species [54]. This destructive forest pest has impacted forests in invaded areas by reducing mast production [55], quality of timber products [56], affecting native species [57,58], nutrient cycling [59], and human health [60], with an economic impact estimated at >$250 million per year [61]. Because of these impacts, the gypsy moth is a well-studied species with detailed information on population biology [62,63], climate suitability [64,65,66], pathways [67,68,69,70,71], detection [72,73], and optimal management strategies [74,75,76]. Most of the United States is climatically suitable to gypsy moth [77]. The combination of broad climatic suitability and extensive host list means that gypsy moth can potentially establish in most of the United States [78], making early detection of the spread into new areas difficult to target.
However, targeting surveillance to gypsy moth’s pathways for spread may yield efficiency in limited program resources. Gypsy moth naturally disperses by larval ballooning [79]. While male moths can fly, the females are incapable of flight. Dispersal by larval ballooning generally occurs over a distance of 1–3 km [80], but may extend over much greater distances depending on topography and wind [81]. Humans also play a role in transporting the insect [80], because its sticky egg masses may be deposited on most outdoor objects. Bigsby et al. [67] developed an anthropogenic model to estimate the contribution of anthropogenic factors on gypsy moth spread for counties with a historical record of infestation. They found that locations with greater proximity to source populations, higher household income, and higher household consumption of firewood were correlated with a higher likelihood of gypsy moth presence. A second study on anthropogenic pathways for gypsy moth [71] used proxies, such as population density and road accessibility, but it lacked proximate predictors for spread mechanisms. A national model of spread pathways is not likely to be stationary across geographic space, which affects how management actions target different stages of invasion or pathways of spread occurring across the landscape.
Our goal is to develop a species distribution model to support the early detection of European gypsy moth that addresses geographic and temporal variability of spread mechanisms. Our specific objectives are to identify proximate predictors for spread mechanisms, evaluate regional differences in spread, and to demonstrate the utility of iteration. We developed origin-destination data as a predictor for human-assisted spread, developed regionalized models based on geographic changes in predictor strength, and analyzed the value of iterative model development by assessing model performance with following year survey data.

2. Materials and Methods
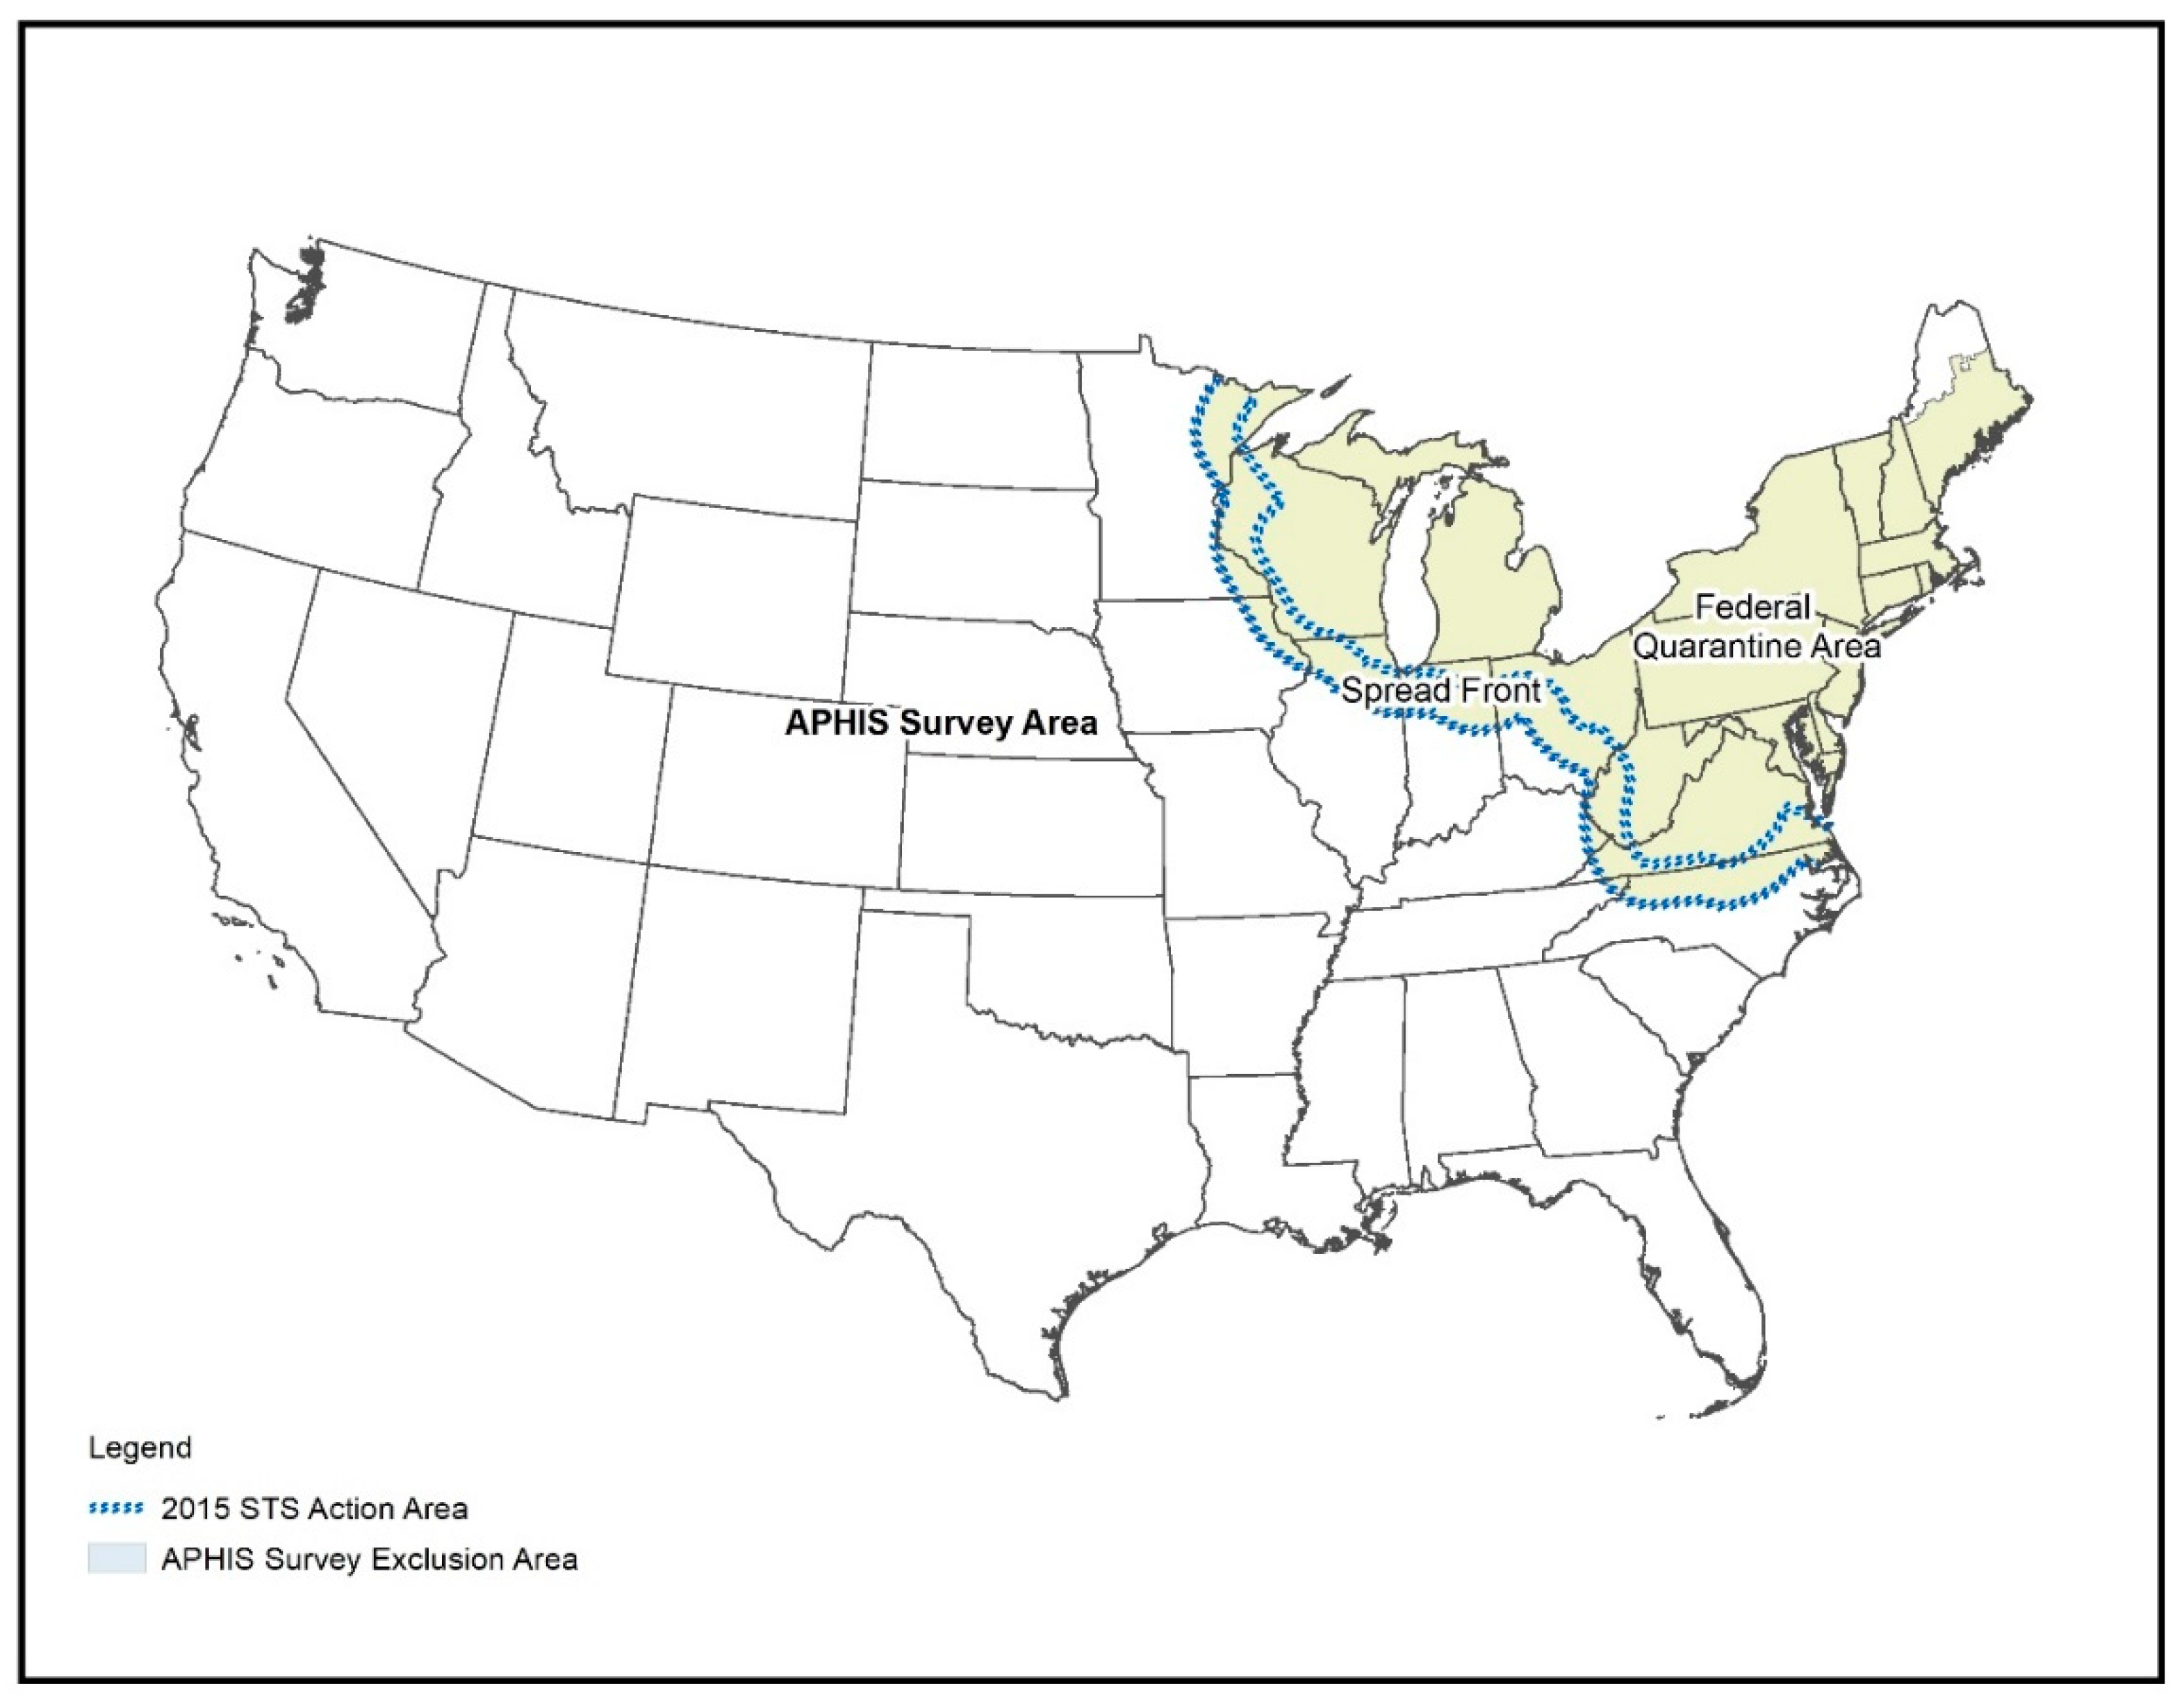
2.1. Study Area

Our study area consisted of the continuous U.S. Within the U.S., 11 states that cover the leading edge of the infestation cooperate with the US Forest Service in the Slow the Spread [82] program to monitor population levels and implement treatment programs to slow the natural spread rate of the gypsy moth. The United States Department of Agriculture (USDA) Animal and Plant Health Inspection Service, Plant Protection, and Quarantine (APHIS-PPQ) similarly coordinates with state departments of agriculture and forestry for detection and eradication efforts of isolated populations outside the Slow the Spread (STS) project area (Figure 1). In addition to operational duties, APHIS has authority to enact and enforce regulatory policy to limit interstate movement of gypsy moth life stages hitchhiking on private or commercial traffic, as well as to designate/terminate domestic quarantines to delineate the areas of general infestation under effect of limited interstate movement (7 C.F.R. §301.45). Nearly 225 million acres are currently under federal quarantine, which are considered generally infested. Therefore, active surveillance does not occur within the quarantine area. All analyses used data from the entire U.S., but final model predictions were masked to exclude the current federal quarantine and active Slow the Spread project zone.

2.2. Survey Data Acquisition and Preparation

The survey and detection data for European gypsy moth were collected from various sources, with the primary sources being the (1) national and state offices of the USDA APHIS-PPQ, (2) the Slow the Spread program, and (3) the National Agricultural Pest Information System (NAPIS). This is the first time that a national survey database has been compiled across data sources for gypsy moth in the U.S., resulting in 1.9 million records spanning the period of 1974–2017. Completeness of data reporting is not consistent over time, and trapping density varied tremendously from state-to-state. Records were tested for spatial quality (removing locations where coordinates did not occur within the recorded county or state) and screened for duplicate records. We also compiled historical gypsy moth eradication treatment polygons from the western U.S. (beyond the Slow the Spread zone), as these treatment areas were indicative of a population that was introduced and then established at a level requiring eradication. Most of these historical treatment areas were not present in the detection database, therefore, exact detection locations were unknown. We converted these polygons to a raster, matching the scale, projection, and snapped extent of a raster template (a 1-km national survey grid). We converted the raster centroid locations to presence point locations, resulting in additional potential presence locations. These locations were spatially thinned in later described steps to algorithmically choose the presence locations for model training. We assume that the benefits of adding potentially unique site characteristics for model training outweigh the cost of adding noise from inexact, but auto-correlated locations.
The response variable varied between presence-absence and count data, and were standardized to presence-absence. We defined ‘presence’ differently based on the region (i.e., short-range or long-range mechanisms). For the short-range geographic model, counts of ≥3 gypsy moths were considered an established, reproducing population (presence) based on a conservative estimate of the number of male moths caught in a trap and relative female mating success [62,83,84,85]. These presence locations were used to estimate distances to next year detections for a spread kernel, which was computed as a rolling average of the five most recent survey years (to capture more recent spread front dynamics). Observations inside treatment polygons within the short-range region were removed for the current and following survey years due to the effects of treatment applications such as mating disruption by the synthetic pheromone disparlure, Bacillus thuringiensis var. kurstaki (Btk), and/or pesticides [86]. The other geographic models included any count >0 as a ‘presence’, because the purpose of early detection is to find moths before they become a reproducing population. Therefore the count data in the intermediate and long-range models do not represent reproducing populations. The short-range geographic model was temporally dynamic, and so was calculated from the prior year’s ‘presence’ locations. Long-range geographic models collapsed data over time, due to the lower number of unique spatial observations.
California did not report absence data; therefore, some assumptions were made to generate background locations. We used a two-step method for creating a survey bias surface on which to base the location of background points: (1) We generated a kernel density surface for the clustering of survey efforts, and (2) applied a fitted function to detections along an accessibility surface to represent survey bias with respect to road/urban center accessibility. Both bias surfaces were standardized, 0–1, and multiplied together to create a combined survey bias surface (Supplementary S1). Due to the inclusion of background data, all absence locations were treated as background, which relaxed assumptions regarding the true detection value of that location.
We analyzed detection data using Moran’s I, then spatially thinned the data within 5-km to reduce spatial autocorrelation between observations [87]. We found that the data thinning process also reduced computation time and errors during numerical fitting. Remaining observations were then snapped and re-projected (Albers equidistant) to our 1-km2 raster template. For the short-range geographic model, data was spatially thinned by year to allow variability in the annual dispersal range. For the intermediate and long-range models, all presence/absence data was collapsed over the historical period.

2.3. Predictor Variables

The selection and development of candidate predictors was based on input from the Interagency Gypsy Moth working group and guidelines from the USDA APHIS gypsy moth program manual [88], which categorizes urban and environmental factors suspected to have an associated risk of gypsy moth introduction. The selected predictors represent different pathways of potential movement for the pest, including proximity to infested areas, directional traffic volume on transportation networks, and household movement. Other predictors include potential point source locations (sawmills, rest stops, campgrounds, etc.) as well as urban predictors (population density, traffic volume, and household income). All predictors (Table 1) were standardized to our raster template in the Alber’s Equidistant projection. Included predictors were identical across model iterations, aside from updating predictors with more recent data. The methods for model regionalization evolved across model iterations (see Supplementary S2).
It has long been recognized that egg masses and other gypsy moth lifestages may hitchhike on household items moving from the generally infested area within the federal quarantine area to other parts of the U.S. [80,89,90,91]. We obtained the number of total address forwarding movements originating from postal zip codes within the federal quarantine area to destination census tracts from the U.S. Postal Service. An address forwarding record is generated when an individual files a change of address form with the U.S. Postal Service when they move their household. Predictor maps of address forwarding data were represented as total counts of movements from the quarantine zone to destination areas. For the 2015 model, this included data between January 2012 and December 2014. Subsequent model iterations added more years of address forwarding data. These aggregate movements served as a proximate measure of propagule pressure from source populations in the northeast to new destinations in the west.

2.4. Model Development

In the 2014 model, we regionalized the study area (non-quarantine areas of the U.S.) based on program management zones: Slow the Spread [92] versus the APHIS survey area (Figure 1), so that we had two regional models: A short range model and a long range model. Beginning with the 2015 model, we regionalized the study area based on changes in the pathway’s importance across space (Supplementary S2). We created regional divisions for model development, including a Maine region (remaining, non-quarantine area), short-range region (0–200 km from the spread front), intermediate region (201–500 km from the spread front), and long-range region (501+ km). We used the Vistrails Software for Assisted Habitat Modeling (SAHM) v3.3.1 module [93] to develop the distribution models for each region (model template available in Supplementary S4). The first model developed for 2014 included five statistical algorithms common in species distribution models: MaxEnt [94,95], Multivariate Adaptive Regression Splines (MARS) [96,97], Generalized Linear Models (GLM) [98], Boosted Regression Trees (BRT) [44,99], and Random Forest (RF) [100,101]. We found that model performance (in terms of AUC), spatial continuity across regional models, and reduced model complexity [102] was best expressed using the MARS algorithm, so we limited future model iterations to MARS only. The MARS model is also robust to moderate levels of collinearity in model predictors [103].
For each regional model (Supplementary S2: Figure S1), we started with all predictors listed in Table 1. We evaluated the set of candidate predictors for collinearity (Pearson or Spearman correlation coefficient ≥0.70) [103]. We dropped predictor variables that explained less variability in a univariate model than the identified collinear variable(s), were not retained in the MARS backward pruning process, or had nonsensical response curves (such as increasing risk with distance from an introduction source location). For example, we dropped “Distance from STS” as a predictor in the long-range regional model because detections along the Pacific coast resulted in a “bump” near the tail of the response curve. We determined that this was not a realistic response of propagule pressure from the spread front and would be explained by other predictors, so we dropped the predictor. The remaining predictors were used as input to the models. We repeated this predictor selection process for every regional model and annual iteration. Each regional model’s variability was assessed with a random 10-fold cross validation.
After initial model fitting, we optimized the model fit via sensitivity analysis of the MARS model complexity parameters: Degree (number of interaction terms) and penalty (cost per freedom of degree). Final models were optimized by selecting parameter settings that maximized the area under the curve (AUC) and percent correctly classified (PCC) with the lowest MARS degree setting. We chose this approach to balance the model accuracy with generalizability across space. Once the models were optimized, we applied the fitted short range model to current year source populations of gypsy moth in order to predict the spread risk for the next survey year. We combined regional models by taking the maximum value from each regional raster, with the exception of the Maine model (other model values were ignored for that region). We assumed that the maximum risk for each cell was defined by the pathways defining that risk. A simple re-visualization of the overlay process confirmed that individual cell values tended to derive from the appropriate regional model. The final model’s performance was assessed by combining the training data sets for all regional models, intersecting them with the final risk map, and running the data through the PresenceAbsence package (v1.1.9) in R (v3.4.3) [104] to generate an overall receiver operating curve. For each regional model, we assessed predictor importance by permutating predictor values between presence and absence data while holding other predictors constant and calculating the resulting change in AUC values.
Prior to survey application, we applied establishment masks (Supplementary S3) to limit introduction risk to areas where gypsy moth would be more likely establish. The final risk surface (masked by host availability, climate suitability, and outside the survey exclusion area) was used as an inclusion probability surface for a survey design tool to allocate spatial locations of next year survey traps.

2.5. Survey Design

The Forest Service Forest Health Assessment and Applied Sciences Team (USFS FHAAST) developed an Invasive Species Sample Design Tool for APHIS [105], using the “Create Spatially Balanced Points” tool in ArcGIS (versions 10.0 and higher). This was designed as a custom ArcGIS toolbox that requires information on the sample area, the probability surface, the number of sample locations to be allocated, and any exclusion areas. Survey locations are stochastically distributed within the sample area (minus any exclusion areas) in a spatially balanced design [106,107], reducing spatial autocorrelation of samples and maximizing information on survey detection within the landscape. The implementation of the sample design tool was optional with state-level operations, but was used by APHIS-PPQ’s national program as one of many criteria to evaluate how national survey funding allocation could be distributed to states according to risk.

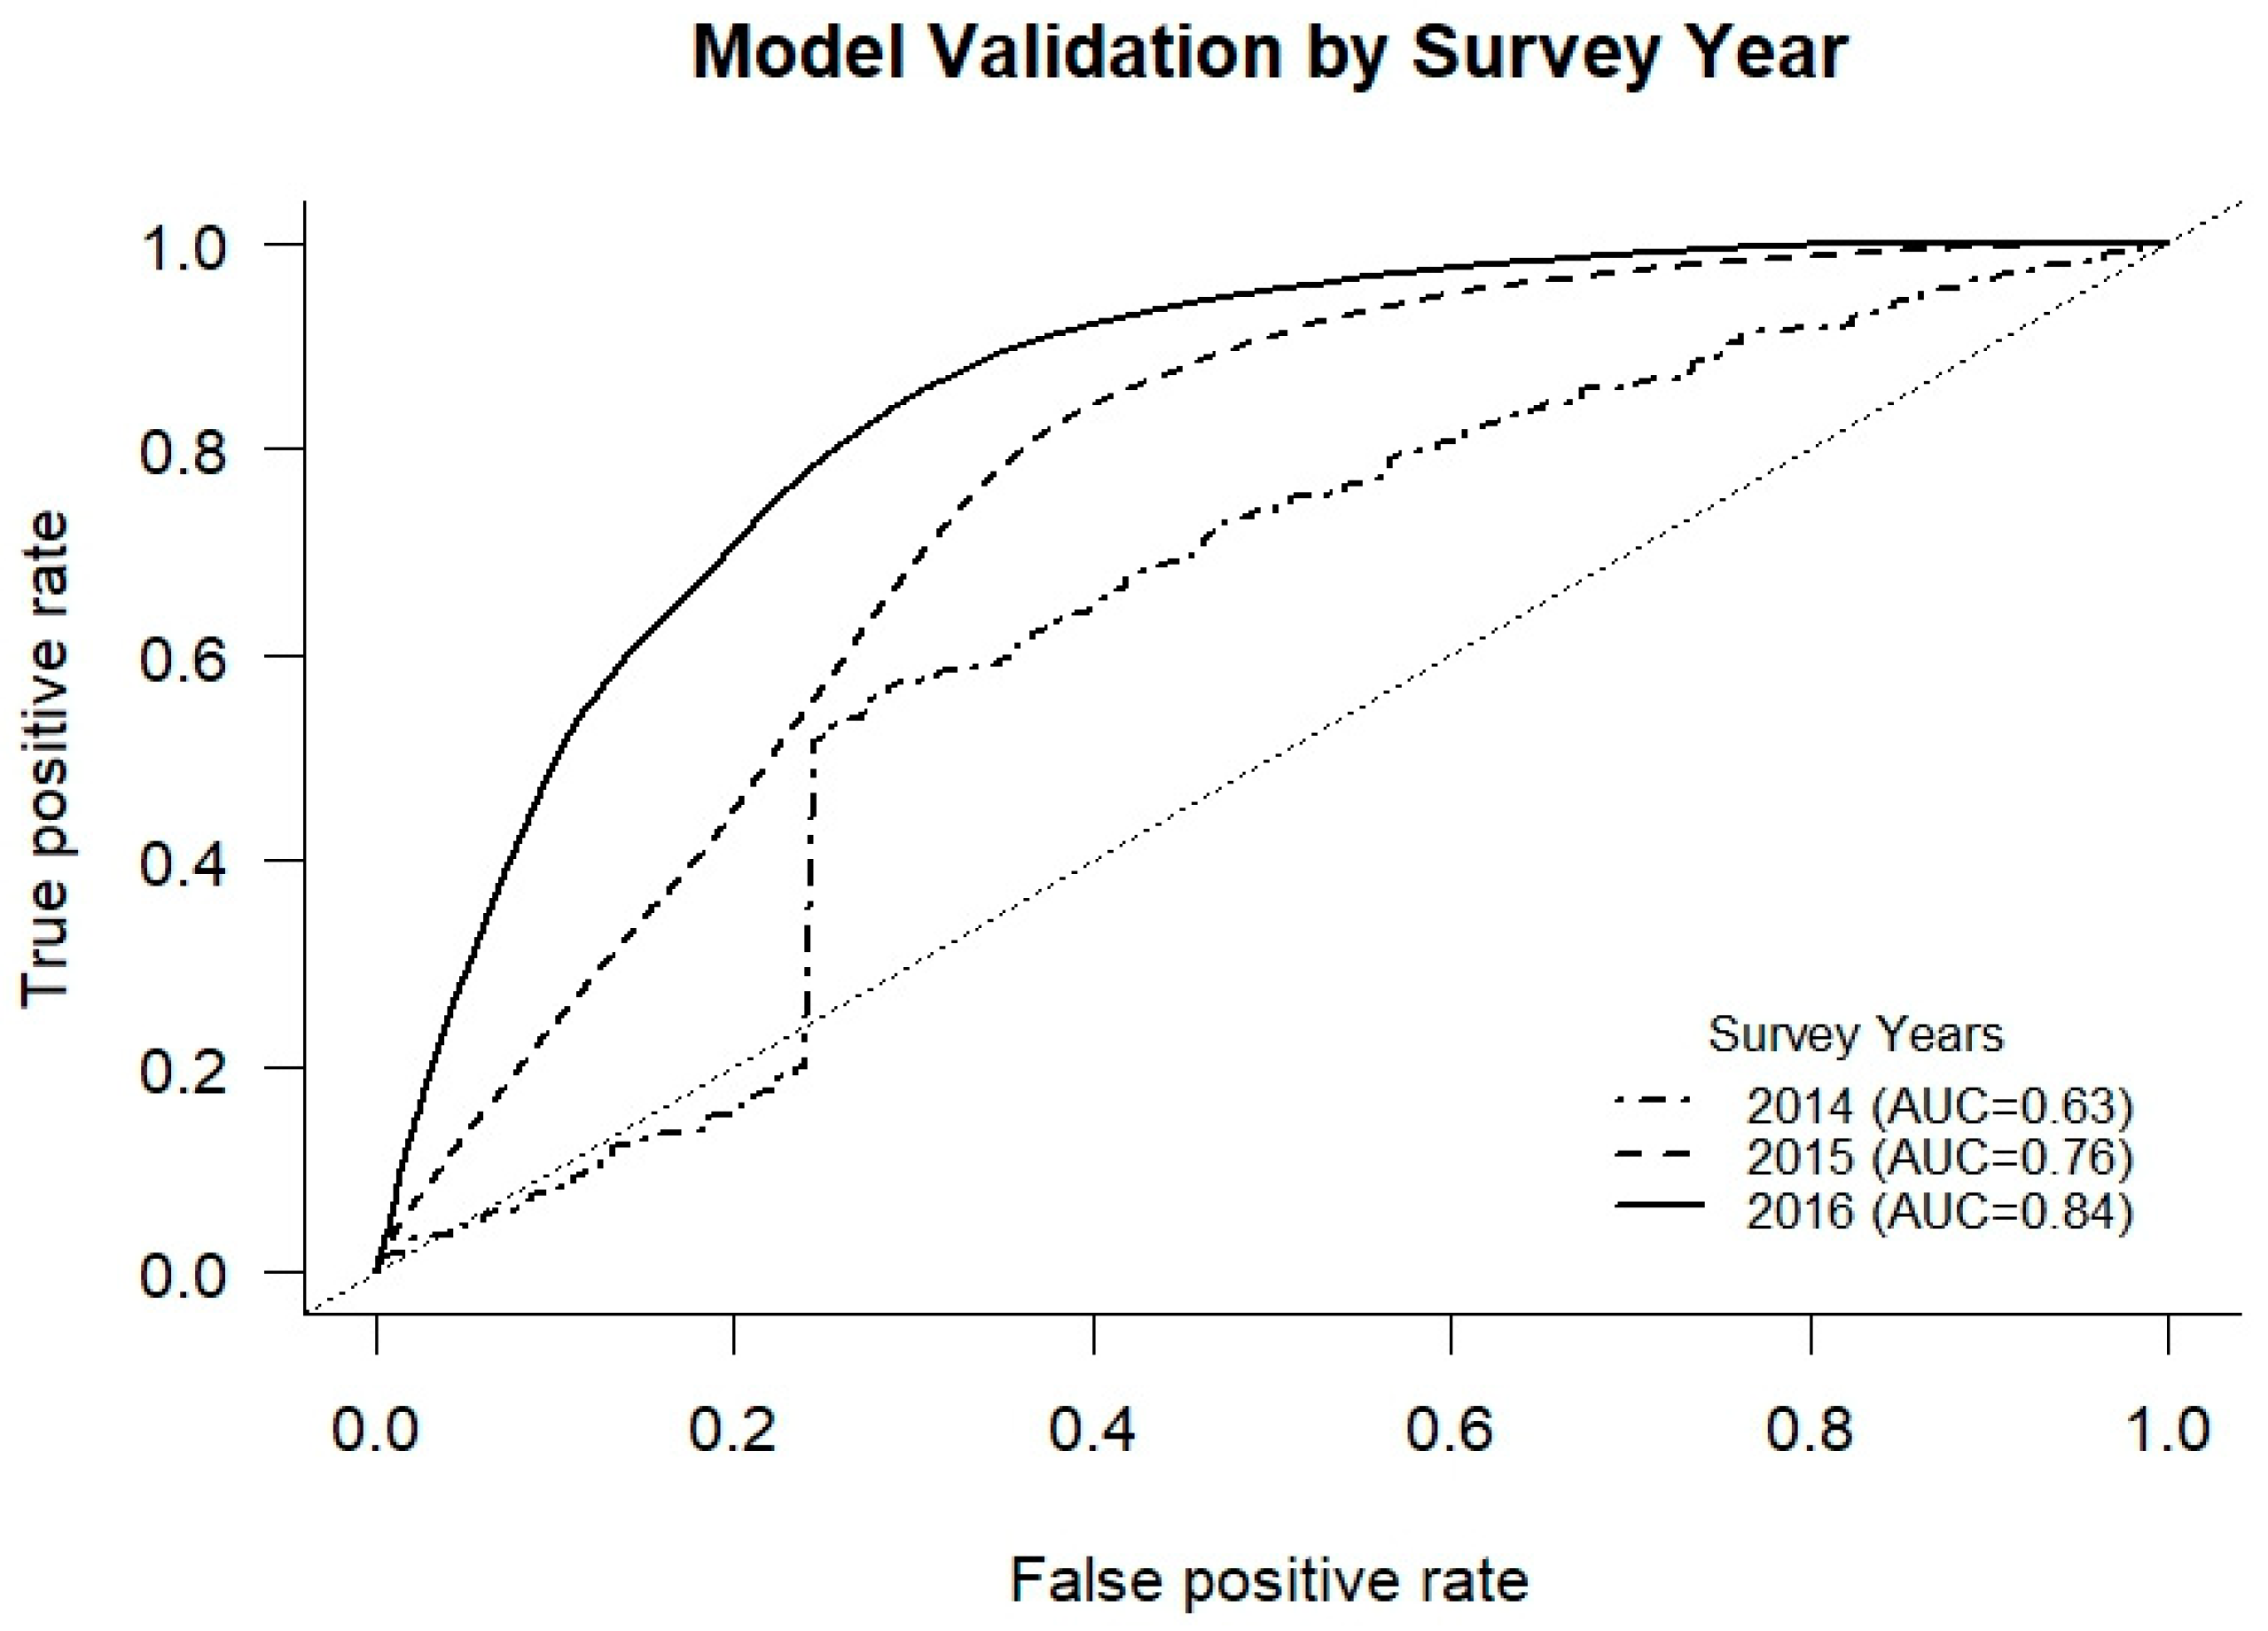
2.6. Model Validation

Gypsy moth detection data on gypsy moth is typically collected from all states at the end of each survey season (approximately October–December), although some states may be late or incomplete in reporting catch data in time for model validation/ next year development. Each survey year’s data were intersected with the predicted risk model developed the prior year (starting with the 2014 model) before application of establishment masks. We evaluated the model performance on continuous risk values because the survey design tool uses a continuous risk surface to allocate sampling effort. Additionally, the gypsy moth program is interested in early detection of this species; therefore, correct prediction of positive survey detections was of primary interest. We generated receiver operating curves as well as boxplots of the predicted risk at positive detection locations by survey year. We compared this information to evaluate the overall model performance over continuous thresholds, and to evaluate the precision and accuracy of model predictions for positive detections over time. New detection data were integrated to the survey detection database and implemented in building the next year’s risk model. Each model development year, we delivered a presentation on the model performance and the newest iteration of model development to the stakeholder community (state-level program managers and pest surveyors) in the spring before survey season.

3. Results

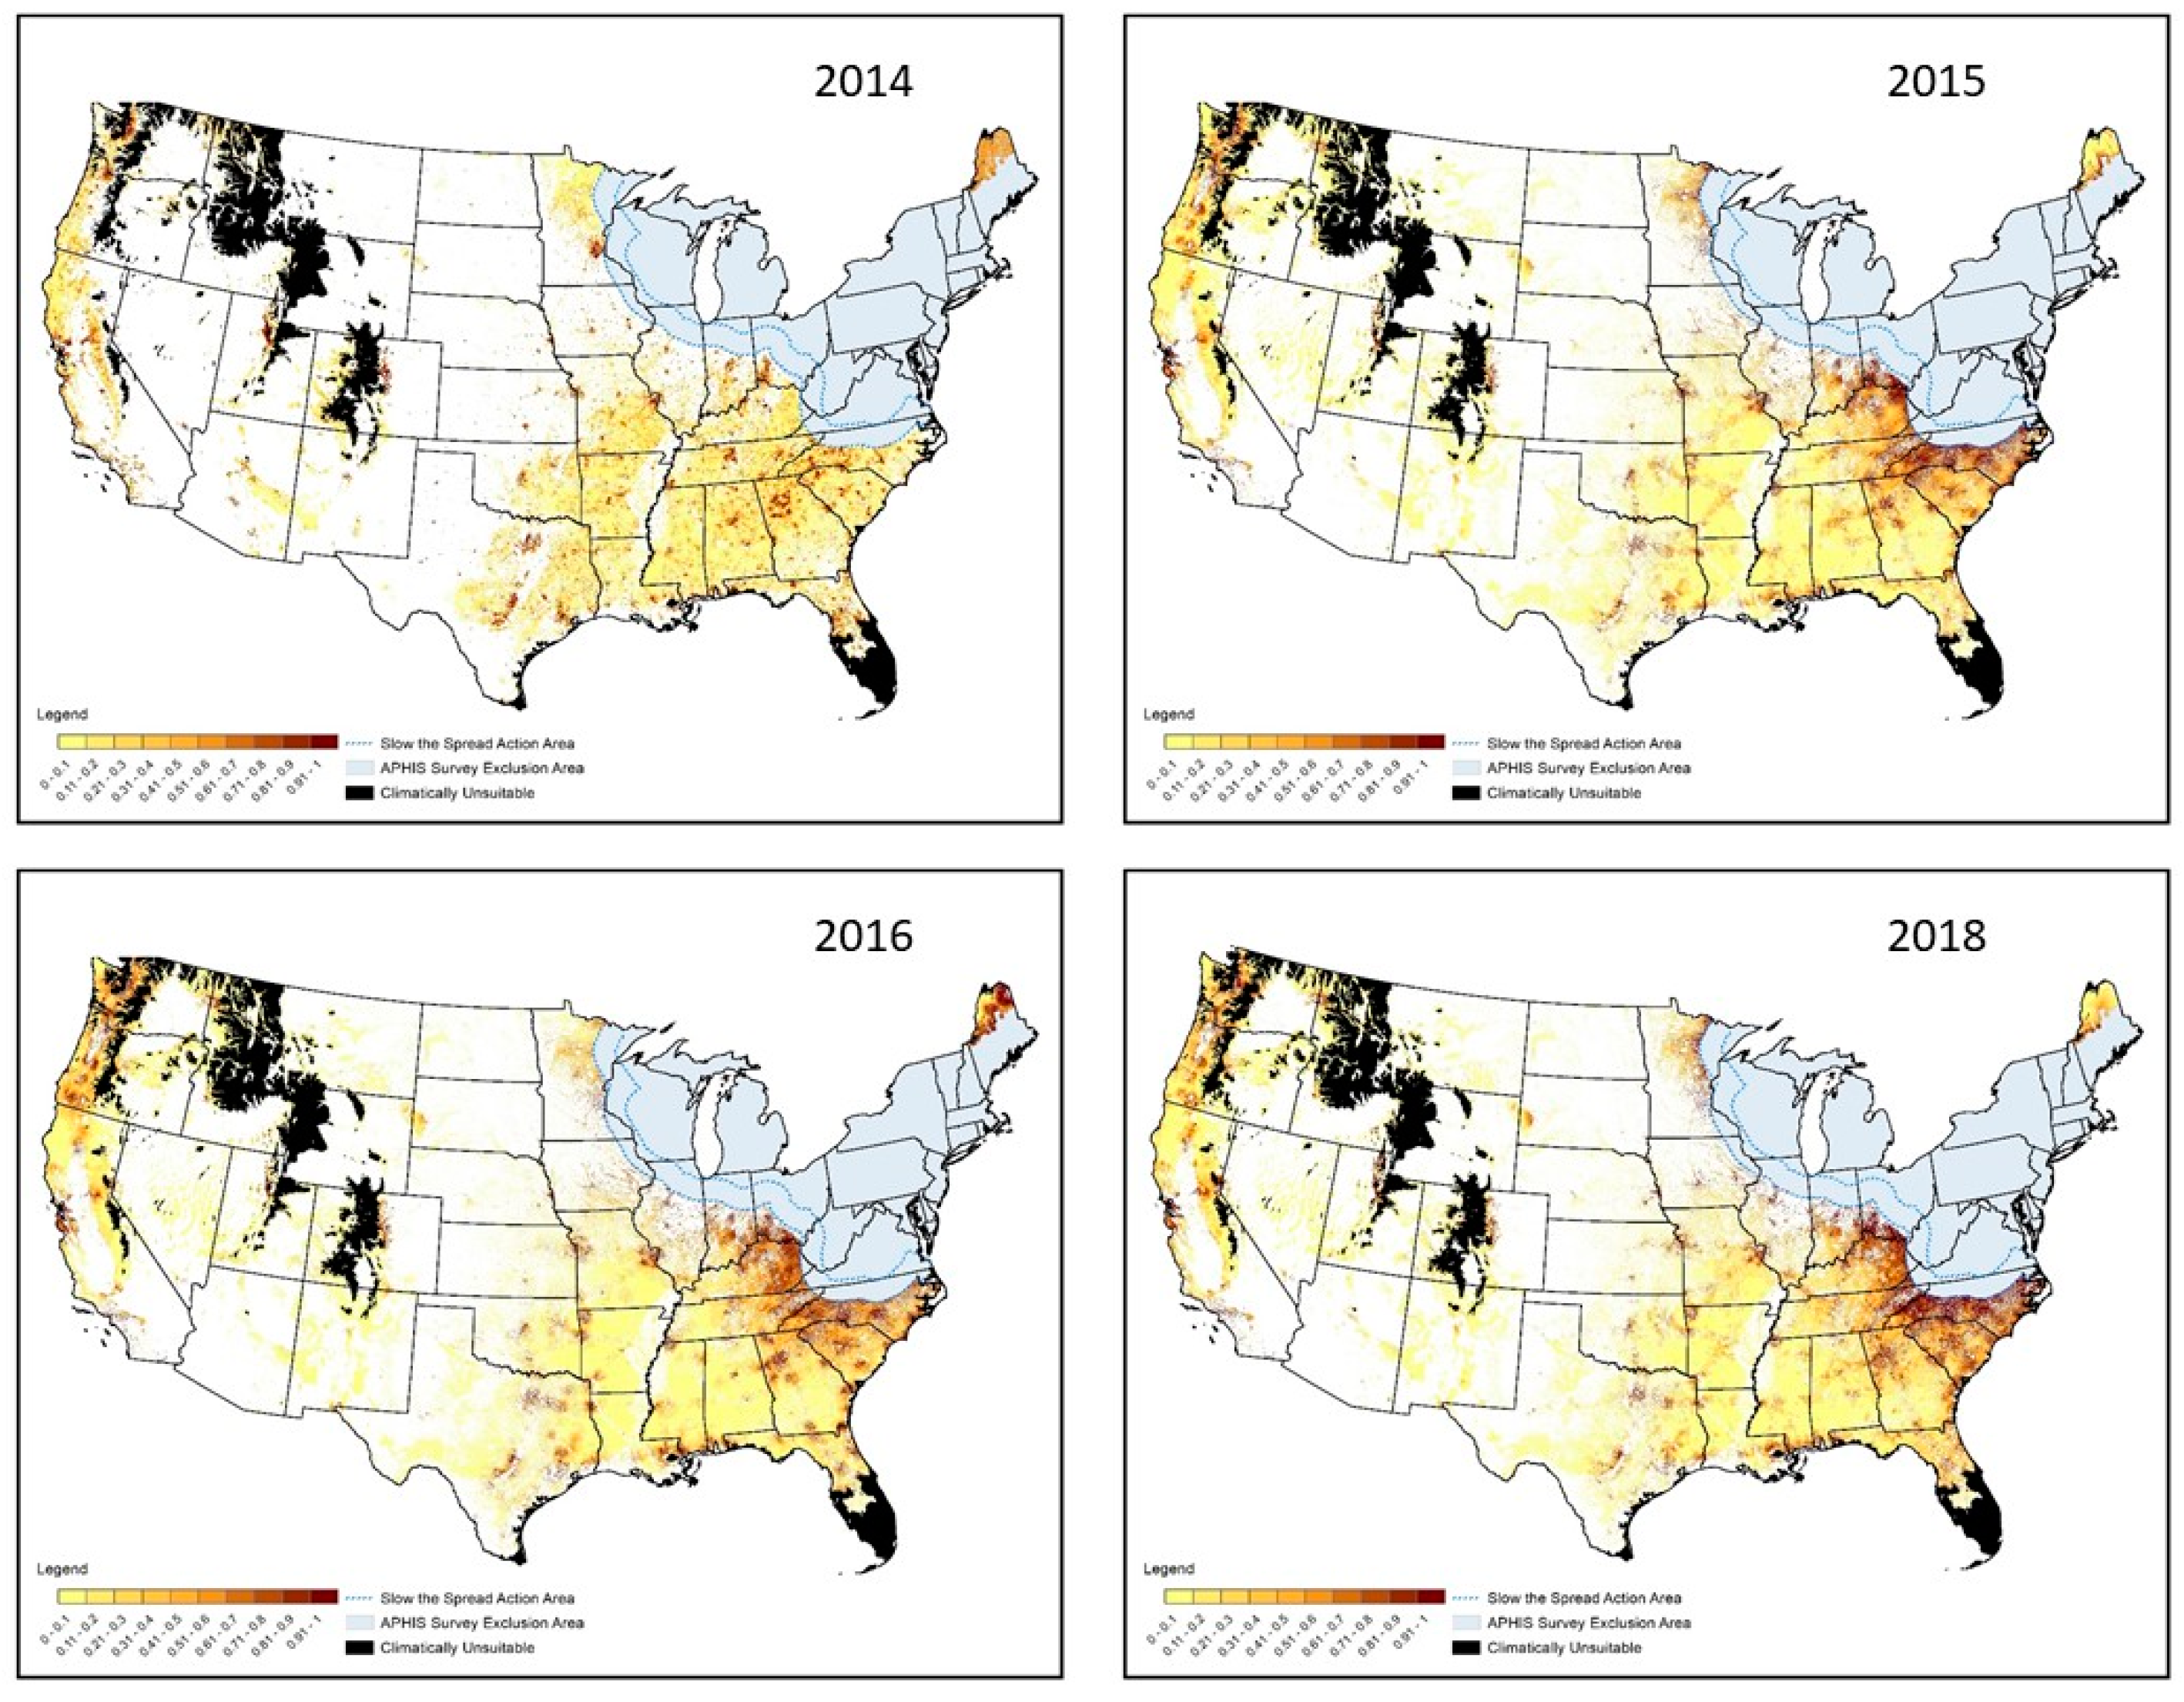
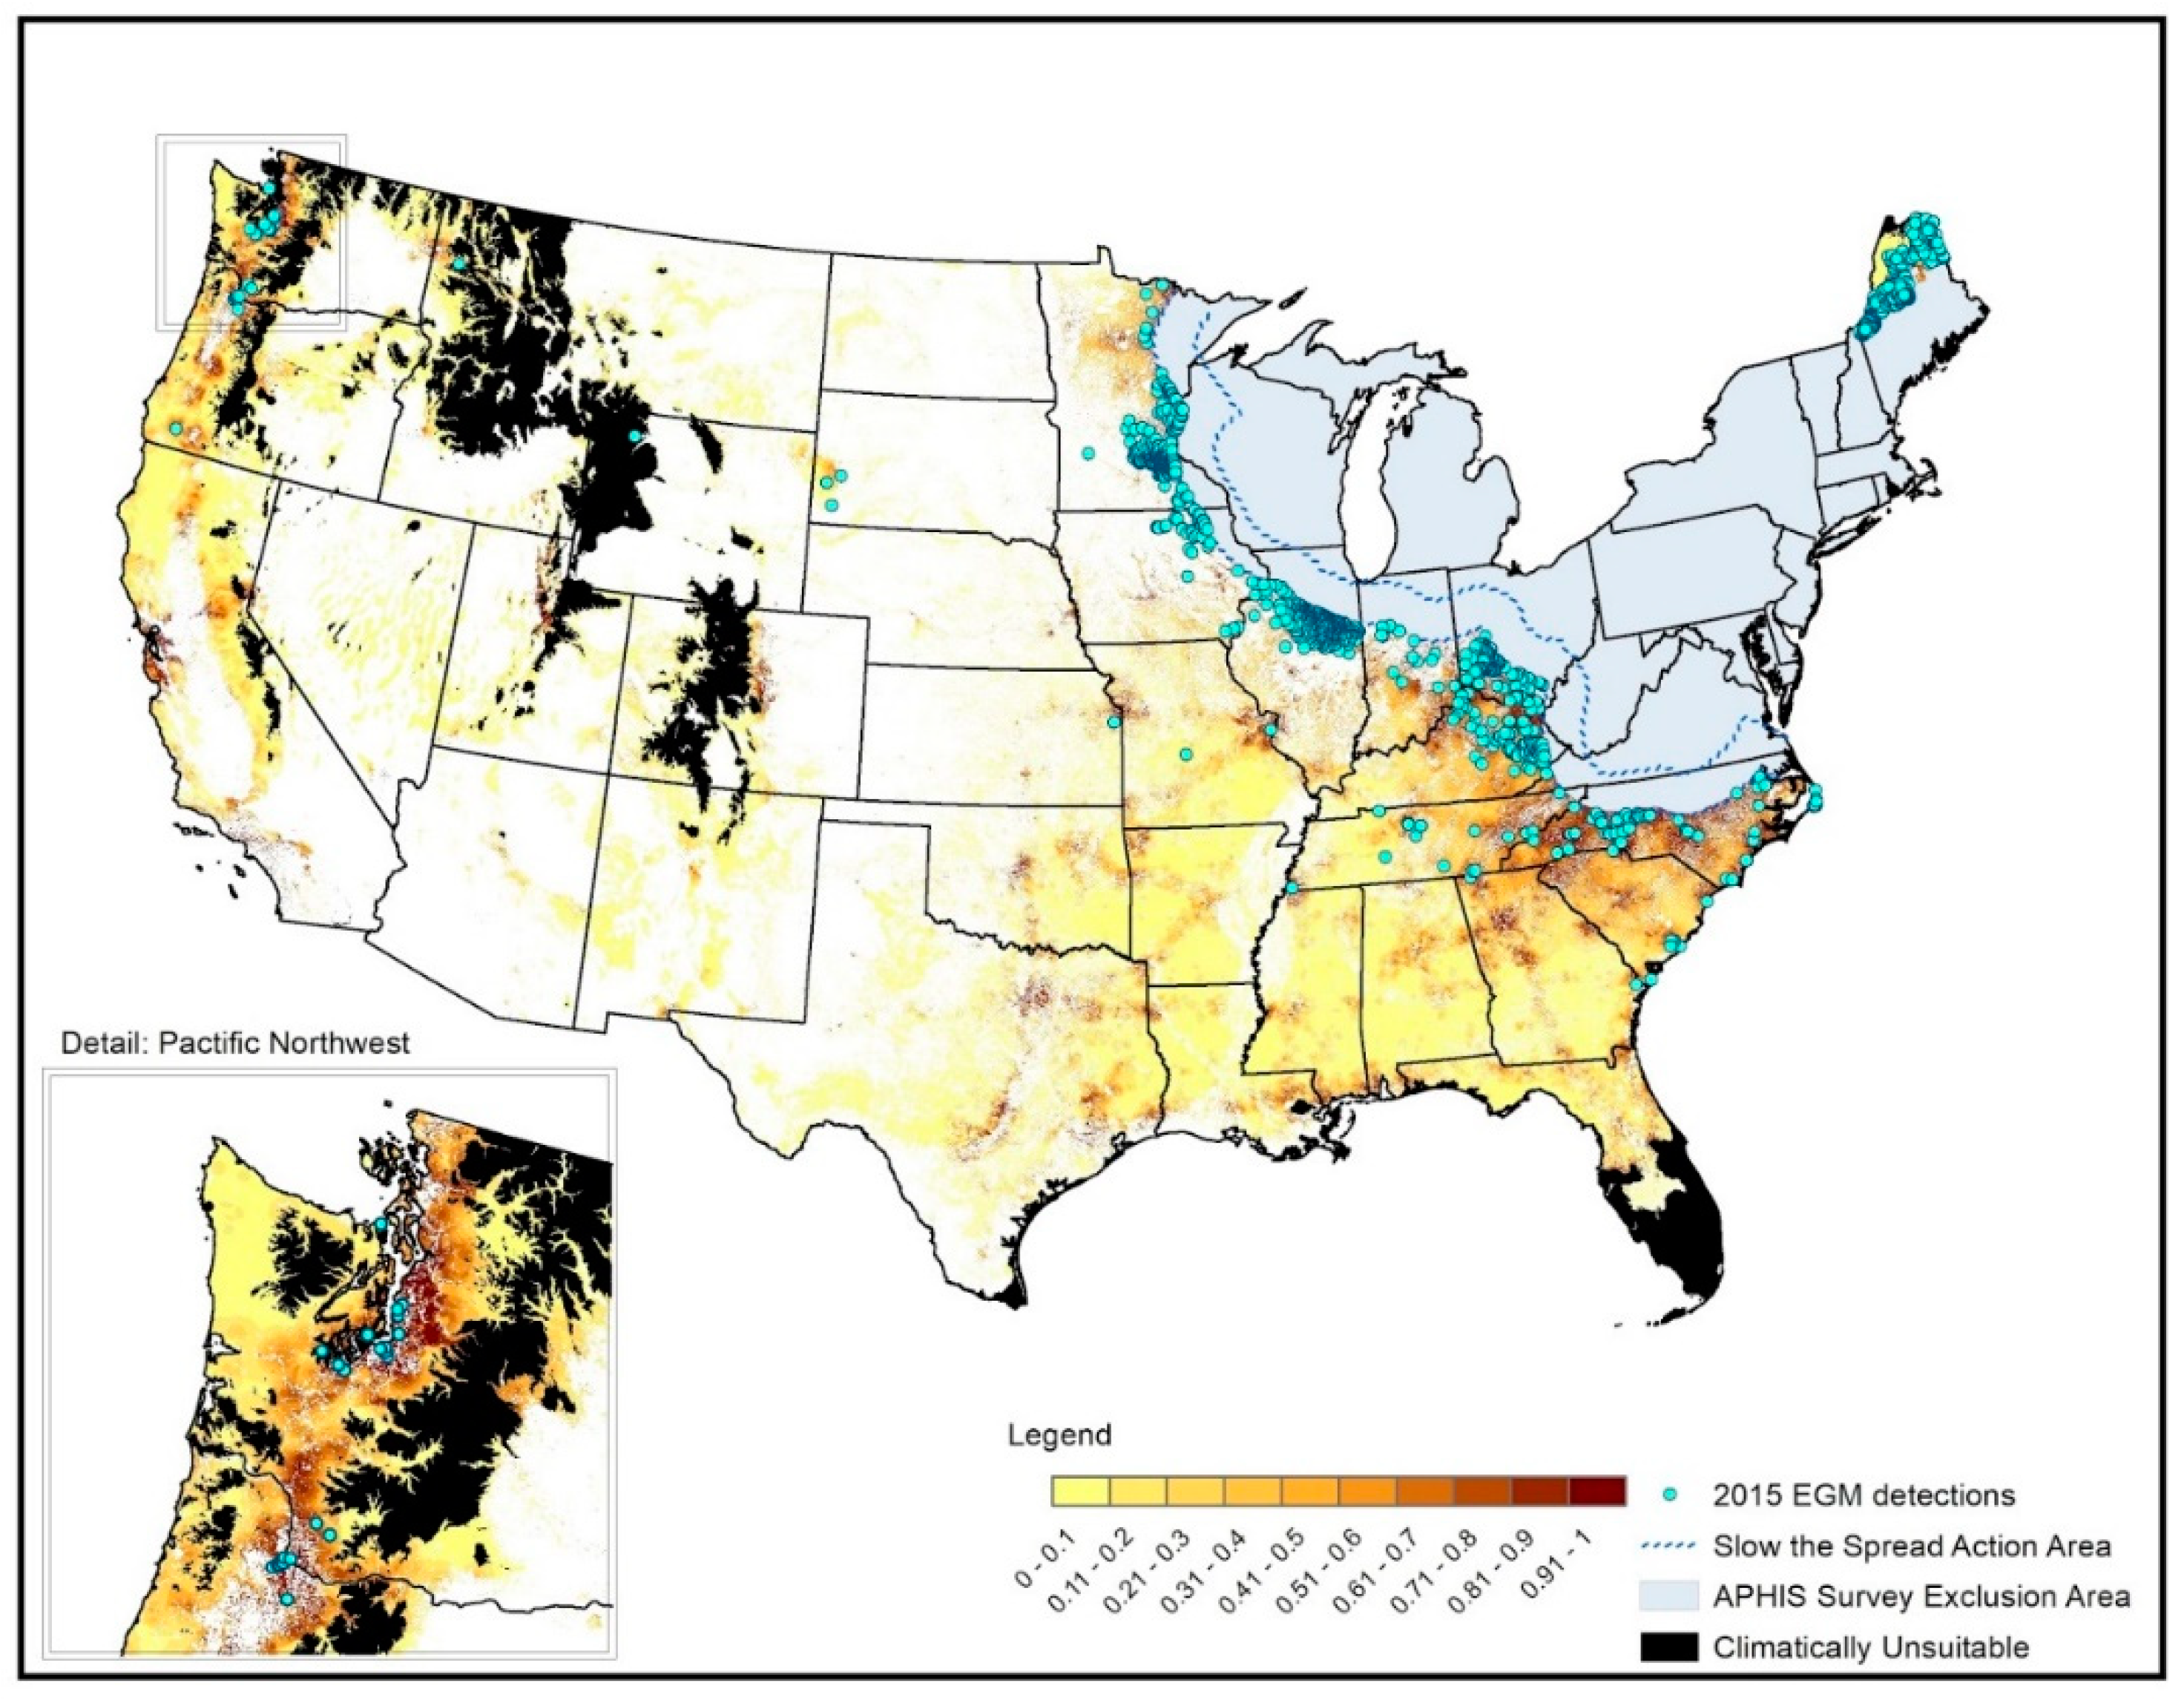
3.1. Spatial Targeting

The spatial distribution of likelihood for gypsy moth detection varied the most between the 2014 and 2015 iterations (Figure 2), due to a change in the methodology for the model regionalization. The 2014 risk model predicted abrupt transitions in risk from the quarantine area to the APHIS survey area, and tight clusters of risk within urban areas. The application of a pathways-driven regionalization approach for the 2015 and later models resulted in a smoothing effect to the spatial distribution of risk between the invasion front and urban areas. Smoothing of the geographic risk also appeared to be a function of allowing predictor retention to be a function of the MARS backward pruning algorithm, rather than user-specified variable retention.
Another change between the 2014 versus the 2015 and later models was the addition of a Maine-only regional model. The spread dynamics for this spatial region were significantly different from the spread dynamics along the western edge (the STS program area). We can see from Figure 2 that risk is annually dynamic in Maine, compared to the slower changing dynamics near the STS program area. The relative differences in spread variability between Maine and the area near the STS zone may be due to northern weather variability affecting population establishment success and the lack of a population suppression program. This region in Maine lies near the edge of climate suitability for gypsy moth population establishment [77], so the effect of annual weather variability may be diminishing the predictor importance of the local spread kernel relative to the STS spread front (Supplementary S2). This dynamic is occurring at similar latitudes as affected provinces in Canada [108], and climate change may expand this pest’s suitable range northward [109]. Gypsy moth egg mass overwintering survival may be enhanced near the Great Lakes by lake effect snow providing thermal insulation [110].
Nationally, the highest density of detections occurred in areas where the spread kernel interacted with urban areas near the spread front. While the majority of gypsy moth detections occurred within the Slow the Spread and short-range geographic areas, there were a large number of detections that occurred in the intermediate and long-range regions in 2015 (n = 162). That year, the risk model correctly predicted the spatial distribution of a population outbreak in the Pacific Northwest (Figure 3). Washington and Oregon experienced incursions in various locales, triggering eradication programs and follow-up surveys in subsequent years.
Predictor importance varied with each regional model, which aligns with the purpose for model regionalization (Supplementary S2). Distance from a population source was the most important in the short-range model, contributing 81% of the relative importance compared to 16% contributed by address forwarding in the 2018 model. Anthropogenic movement played a larger role in the intermediate model, such that address forwarding and distance from the STS action area were the most important predictors and had a similar influence (36% and 39% for the 2018 model, respectively). Anthropogenic variables were the most important predictors in the long-range model, with population density, traffic volume, and median household income as the top three predictors. These patterns were fairly consistent across the annual model iterations. The Maine model had the most annual variation, with both the spread kernel and anthropogenic factors (e.g., distance from sawmills, distance from rest stops, and distance from wood pallet manufacturers) being important.

3.2. Temporal Targeting

Our iterative approach to model development increased the overall predictive performance of the risk model over time (Figure 4). The first model iteration had poor performance, predicting worse than random for sensitivity thresholds less than 0.5. This was due to the discontinuity of modeled risk along the spread front (Figure 2, 2014 model), which under-predicted the detection likelihood near the spread front. Changing the methodology for regionalizing models resulted in a large gain in model performance for 2015, while the 2016 iteration showed improvements primarily in low risk locations. There were also gains within the regional models when we evaluated the predicted risk using the next year’s survey’s positive gypsy moth detections. Predicted risk increased in accuracy (higher mean), increased in precision (smaller interquartile range), or both for all regional models even though the regionalization methodology remained identical between the 2015 and 2016 models (Figure 5). We omitted a boxplot for the Maine-only geographic model because it had insufficient information for a temporal comparison. Maine had a static risk value of 0.51 in the 2014 model (see Supplementary S2), and the state did not report survey data for validation of the 2016 model.

3.3. Pathways Predictor Performance

Address forwarding data (cumulative number of people moving from within the quarantine area to a destination census tract) was used as a proxy for propagule pressure. Our assumption that more household movements resulted in more gypsy moth egg mass introductions appears to be supported by regional model outputs. In the intermediate geographic model, predictor strength for address forwarding data more than quadrupled between the 2015 and the 2018 model iterations, and was the highest ranked predictor of gypsy moth occurrence in the intermediate region in the most recent model iteration (Table 2). This increase in predictor strength was concurrent with the increase in available USPS data to inform the predictor. As our detection dataset is historical and the result of several years of detection data, we found increased predictor performance when the predictor also accumulated more data over time. While we did use address forwarding data in the 2014 model, it was summarized to the zip code level. Due to the historic nature of that model, we no longer had access to the variable importance of address forwarding for the 2014 model, so it is omitted from the comparative analysis in Table 2.

4. Discussion

The inclusion of origin-destination pathway predictors in invasive species distribution models brings significant advantages to targeting the early detection of invasive species. Inclusion of pathways were useful in predicting long-range, human-mediated dispersal of mussels [25,111] and in intermediate-range, human-mediated dispersal with campground reservations for gypsy moth [69]. The increasing variable importance of address forwarding, a proximate predictor for long-distance dispersal of gypsy moth egg masses, with a concurrent increase in model performance and precision over time, was similar to the Leung et al.’s [25] recreational boat movement approximating human-mediated long distance dispersal of mussels. While a change in methodology between 2014 and 2015 accounts for some performance increase, it does not explain the continued increasing trend in subsequent model iterations with stable methodology. The increase in model performance may be due to the accumulation of the address forwarding data as an approximation of propagule pressure, rather than the addition of new detection data. While the risk models were available for the states to target their surveillance, it was optional. There was not an explicit feedback loop between survey design and the risk model, which may have increased the informatic value of new data being collected. Also, given that the gypsy moth program is historically rich in data and collects more than 100,000 new data samples each year, novel detections (new detections in low risk areas) to inform the risk model are rare.
Some research has suggested that predictions of invasion dynamics should be hierarchical, with data gathered from multiple spatial scales [112]. Specific to invasive species distribution models, however, inclusion of a dispersal kernel, which focuses on short range dispersal, to limit over-prediction of risk has been encouraged [3,26]. However, for targeting early detection of invasive species with a human-assisted spread pathway, this suggestion may be too conservative. Dispersal kernels focus detection effort along the spread front, where prevalence is high and fewer samples are required to detect the species. This method fails for early detection in uninfested areas far from the spread front, as illustrated by the gypsy moth 2015 outbreak in the Pacific Northwest. Our regionalized approach addresses the afore-mentioned biological phenomenon of stratified dispersal for gypsy moth. Our approach recognizes the different mechanisms of dispersal by incorporating a dispersal kernel for larval ballooning and other short-range mechanisms, while also addressing human-assisted pathways to explore long-distance dispersal events important for early detection activities overseen by APHIS.
The Slow the Spread program targets a 100-km “transition zone” to suppress gypsy moth spread, which was determined to be the optimal distance for reducing the spread rate to a target rate of 9 km per year [74]. Our short range model included an additional 100 km beyond the transition zone, and it suggested that both areas had the same spread mechanisms. This result concurs with prior analysis of new colony formation occurring as far as 250 km from the spread front [63]. While a spread kernel (partially driven by ballooning and wind-driven transport) was the most important predictor, anthropogenic predictors were also important in determining the detection likelihood within that region. The single largest difference between the short and intermediate range regional models was the change in primary predictor from a spread kernel (distance from prior year detections) to the address forwards. This changeover in pathway importance is demonstrated in the prediction surface as the transition of detection likelihood from the spread front to urban area hot spots.
We expected that the long-range model would show an increasing importance of address forwarding as a predictor of gypsy moth detection, as it does in the intermediate model. However, predictors, such as household income, population density, and traffic volume, exhibited consistently higher predictor performance than address forwarding. Areas of previous infestation in the long range model area generally occur in high-density urban areas, where a higher level of household income may be required for the higher cost of living. Urban areas also have smaller census tracts than rural regions (such as those that dominate the intermediate range model area), and gypsy moth detections frequently appear in very close proximity to high move-in areas without actually occurring in one. This phenomenon adds noise to the model and likely explains the poor predictor performance of address forwards in the long range model.
The need for an iterative approach to both sampling and distribution modeling for invasive species has been acknowledged for many years [47,113]. Tests of the iterative sampling and modeling framework revealed improvements in secondary models based on new information collected as a result of initial models [53]. Here, we present an operationalized iterative modeling framework to support adaptive management of invasive species. As with previous work, our example illustrates increased model performance over time with the addition of new information (both detections and predictors with accumulated information such as address forwarding).
Our model serves as a rapid investigative technique to test hypotheses regarding gypsy moth spread pathways and to inform targeted surveillance. The iterative process allowed us to investigate model prediction failures and test improvements for future model iterations. For example, stakeholders and program management have provided feedback that there is too much risk area in Texas, which is supported by the lack of detections in the region. These two lines of evidence indicate the model is overpredicting in this region, leading us to hypothesize that biological limitations, such as supraoptimal temperatures [114], high winter temperatures precluding a required diapause development stage [115], or dessication [116], may be limiting life stage development in this area. We also detected several false negatives in the intermediate range regional model, which may be a result of missing pathway predictors, such as firewood movement [117,118,119] and recreational activity [16,120] in non-urban landscapes. The lack of origin-destination data sources to estimate these pathways likely results in underestimation of risk in this region. These examples highlight the importance of incorporating expert knowledge [121] and proximate predictors [122] into risk models, ensuring that products are appropriately targeted to the management need.
These operationalized iterative models of an invasive forest pest support management activities at a national scale. Our regionalized approach to model development supports previously identified policy and management objectives to invasive species management at different stages of invasion in different geographic regions [40]. Efforts to prevent the spread of invasive species by targeting pathways are less costly than even early detection efforts [123]. Our models can help target public outreach campaigns to prevent human-assisted movement of gypsy moth through our identification of the importance of these pathways. For example, APHIS partnered with the American Moving and Storage Association in the “Remove Before You Move” outreach campaign [124] to educate the public on how to check their household articles for egg masses before moving [125]. Our models also support the next step in the invasion process by targeting early detection efforts to areas at high risk for population establishment. We interact with the Slow the Spread program targeted at the spread front, allowing for continuous surveillance effort across management areas. Thus, our framework facilitates efforts across stages of the invasion process and the stages’ associated management options.

5. Conclusions

Our results suggest that more effort in the collection and application of human-related, origin-destination datasets that can serve as proximate predictors for invasive species movement is warranted. The application of pathways data in invasive species distribution models should be carefully inspected for geographic variation, and possibly regionalized to better target the variability of pathways of invasion for early detection. Implementation of an iterative modeling approach provides opportunity to improve model predictions over time, understand mechanisms of spread, and enhance targeted management actions. We demonstrate that species distribution models can be effective in an operational context for early detection of invasive species if they include pathways of spread and accommodate variation in space and time.

Supplementary Materials

The following are available online at https://www.mdpi.com/1999-4907/10/2/108/s1, Supplementary S1: Simulation of background data for California, Supplementary S2: Regionalization by pathways importance, Supplementary S3: Development of establishment masks, Supplementary S4: SAHM model template.

Author Contributions

Conceptualization of the first model by G.C., C.J., M.D., J.W., I.L.; Regionalization methodology for 2015 and later models by G.C.; Modeling software maintained by C.J., Model validation by G.C.; Formal analysis for 2014 model, G.C., C.J., M.D., J.W., I.L., Formal analysis for 2015–2016 models G.C.; Formal analysis for the 2018 model M.W.; Computing resources in 2014 provided by C.J.; Data curation by G.C., M.W.; Writing—original draft preparation, G.C., C.J., M.W.; Writing—review and editing, G.C., C.J., M.W., M.D., J.W., I.L.; Visualization, G.C.; Supervision (2014), M.D.; Supervision (2015 and later), G.C.

Funding

This research received no external funding.

Acknowledgments

We gratefully acknowledge the following: Mark Hitchcox (APHIS-PPQ) for his suggestion to investigate the use of U.S. Postal Service address forwarding data; Paul Chaloux and Anthony Man-Son-Hing (APHIS-PPQ) as primary stakeholders who contributed invaluable feedback to align model products with management needs and facilitated data collection via various state and government agencies; members of the Interagency Gypsy Moth Working Group who supplied feedback during stages of model development; Vic Mastro and David Lance for their subject matter expertise and hosting the annual review of the model at the APHIS-PPQ Otis Lab; Andrew Liebhold, Steve Munson, and Bob Rabaglia (USFS) as subject matter experts who provided policy insight, feedback, and/or internal review of this manuscript; Lisa Kennaway and Paul Sutton (APHIS-PPQ) for data and GIS support. We also acknowledge the U.S. Geological Survey Fort Collins Science Center for the use of the Resource for Advanced Modeling (RAM) during original model development and for training in the use of the Software for Assisted Habitat Modeling (SAHM). Our thanks to Donna Leonard and Andy Roberts in the Slow the Spread program and to all the state and local departments of agriculture/forestry who contributed gypsy moth surveillance data and provided feedback/suggestions during annual model roll-outs. Publication costs covered by the National Science Foundation Macrosystems Biology grant DEB-163870. Any use of trade, firm, or product names is for descriptive purposes only and does not imply endorsement by the U.S. Government.

Conflicts of Interest

The authors declare no conflict of interest.

References

  1. Mehta, S.V.; Haight, R.G.; Homans, F.R.; Polasky, S.; Venette, R.C. Optimal detection and control strategies for invasive species management. Ecol. Econ. 2007, 61, 237–245. [Google Scholar] [CrossRef]
  2. Elith, J.; Leathwick, J.R. Species distribution models: Ecological explanation and prediction across space and time. Annu. Rev. Ecol. Evol. Syst. 2009, 40, 677–697. [Google Scholar] [CrossRef]
  3. Václavík, T.; Meentemeyer, R.K. Invasive species distribution modeling (iSDM): Are absence data and dispersal constraints needed to predict actual distributions? Ecol. Model. 2009, 220, 3248–3258. [Google Scholar] [CrossRef]
  4. Soberón, J.; Nakamura, M. Niches and distributional areas: Concepts, methods, and assumptions. Proc. Natl. Acad. Sci. USA 2009, 106, 19644–19650. [Google Scholar] [CrossRef] [PubMed] [Green Version]
  5. Peterson, A.T.; Soberón, J.; Pearson, R.G.; Anderson, R.P.; Martínez-Meyer, E.; Nakamura, M. Ecological Niches and Geographic Distributions (MPB-49); Princeton University Press: Princeton, NJ, USA, 2011. [Google Scholar]
  6. Hardin, G. The competitive exclusion principle. Science 1960, 131, 1292–1297. [Google Scholar] [CrossRef]
  7. Pollock, L.J.; Tingley, R.; Morris, W.K.; Golding, N.; O’Hara, R.B.; Parris, K.M.; Vesk, P.A.; McCarthy, M.A. Understanding co-occurrence by modelling species simultaneously with a Joint Species Distribution Model (JSDM). Methods Ecol. Evol. 2014, 5, 397–406. [Google Scholar] [CrossRef] [Green Version]
  8. Trainor, A.M.; Schmitz, O.J.; Ivan, J.S.; Shenk, T.M. Enhancing species distribution modeling by characterizing predator–prey interactions. Ecol. Appl. 2014, 24, 204–216. [Google Scholar] [CrossRef] [PubMed]
  9. Feldman, R.E.; Peers, M.J.L.; Pickles, R.S.A.; Thornton, D.; Murray, D.L. Climate driven range divergence among host species affects range-wide patterns of parasitism. Glob. Ecol. Conserv. 2017, 9, 1–10. [Google Scholar] [CrossRef] [Green Version]
  10. Crystal-Ornelas, R.; Lockwood, J.L.; Cassey, P.; Hauber, M.E. The establishment threat of the obligate brood-parasitic pin-tailed whydah (Vidua macroura) in North America and the Antilles. Condor 2017, 119, 449–458. [Google Scholar] [CrossRef]
  11. Barve, N.; Barve, V.; Jiménez-Valverde, A.; Lira-Noriega, A.; Maher, S.P.; Peterson, A.T.; Soberón, J.; Villalobos, F. The crucial role of the accessible area in ecological niche modeling and species distribution modeling. Ecol. Model. 2011, 222, 1810–1819. [Google Scholar] [CrossRef]
  12. McNeely, J.A. As the world gets smaller, the chances of invasion grow. Euphytica 2006, 148, 5–15. [Google Scholar] [CrossRef]
  13. Tatem, A.J.; Hay, S.I.; Rogers, D.J. Global traffic and disease vector dispersal. Proc. Natl. Acad. Sci. USA 2006, 103, 6242–6247. [Google Scholar] [CrossRef] [Green Version]
  14. Floerl, O.; Inglis, G.J.; Dey, K.; Smith, A. The importance of transport hubs in stepping-stone invasions. J. Appl. Ecol. 2009, 46, 37–45. [Google Scholar] [CrossRef]
  15. Hastings, A.; Cuddington, K.; Davies, K.F.; Dugaw, C.J.; Elmendorf, S.; Freestone, A.; Harrison, S.; Holland, M.; Lambrinos, J.; Malvadkar, U.; et al. The spatial spread of invasions: New developments in theory and evidence. Ecol. Lett. 2005, 8, 91–101. [Google Scholar] [CrossRef]
  16. Koch, F.H.; Yemshanov, D.; Haack, R.A.; Magarey, R.D. Using a network model to assess risk of forest pest spread via recreational travel. PLoS ONE 2014, 9, 10. [Google Scholar] [CrossRef] [PubMed]
  17. Colunga-Garcia, M.; Magarey, R.A.; Haack, R.A.; Gage, S.H.; Qi, J.Q. Enhancing early detection of exotic pests in agricultural and forest ecosystems using an urban-gradient framework. Ecol. Appl. 2010, 20, 303–310. [Google Scholar] [CrossRef] [PubMed] [Green Version]
  18. Thomas, S.M.; Moloney, K.A. Combining the effects of surrounding land-use and propagule pressure to predict the distribution of an invasive plant. Biol. Invasions 2015, 17, 477–495. [Google Scholar] [CrossRef]
  19. Hulme, P.E.; Bacher, S.; Kenis, M.; Klotz, S.; Kuhn, I.; Minchin, D.; Nentwig, W.; Olenin, S.; Panov, V.; Pergl, J.; et al. Grasping at the routes of biological invasions: A framework for integrating pathways into policy. J. Appl. Ecol. 2008, 45, 403–414. [Google Scholar] [CrossRef]
  20. Simberloff, D. The role of propagule pressure in biological invasions. Annu. Rev. Ecol. Evol. Syst. 2009, 40, 81–102. [Google Scholar] [CrossRef]
  21. Lockwood, J.L.; Cassey, P.; Blackburn, T. The role of propagule pressure in explaining species invasions. Trends Ecol. Evol. 2005, 20, 223–228. [Google Scholar] [CrossRef] [PubMed]
  22. Hulme, P.E. Trade, transport and trouble: Managing invasive species pathways in an era of globalization. J. Appl. Ecol. 2009, 46, 10–18. [Google Scholar] [CrossRef]
  23. Paini, D.R.; Yemshanov, D. Modelling the arrival of invasive organisms via the international marine shipping network: A khapra beetle study. PLoS ONE 2012, 7, 9. [Google Scholar] [CrossRef]
  24. Wilson, C.E.; Castro, K.L.; Thurston, G.B.; Sissons, A. Pathway risk analysis of weed seeds in imported grain: A Canadian perspective. NeoBiota 2016, 30. [Google Scholar] [CrossRef]
  25. Leung, B.; Bossenbroek, J.M.; Lodge, D.M. Boats, pathways, and aquatic biological invasions: Estimating dispersal potential with gravity models. Biol. Invasions 2006, 8, 241–254. [Google Scholar] [CrossRef]
  26. Meentemeyer, R.K.; Anacker, B.L.; Mark, W.; Rizzo, D.M. Early detection of emerging forest disease using dispersal estimation and ecological niche modeling. Ecol. Appl. 2008, 18, 377–390. [Google Scholar] [CrossRef] [PubMed]
  27. Sullivan, M.J.P.; Davies, R.G.; Reino, L.; Franco, A.M.A. Using dispersal information to model the species-environment relationship of spreading non-native species. Methods Ecol. Evol. 2012, 3, 870–879. [Google Scholar] [CrossRef] [Green Version]
  28. Dullinger, S.; Kleinbauer, I.; Peterseil, J.; Smolik, M.; Essl, F. Niche based distribution modelling of an invasive alien plant: Effects of population status, propagule pressure and invasion history. Biol. Invasions 2009, 11, 2401–2414. [Google Scholar] [CrossRef]
  29. Mędrzycki, P.; Jarzyna, I.; Obidziński, A.; Tokarska-Guzik, B.; Sotek, Z.; Pabjanek, P.; Pytlarczyk, A.; Sachajdakiewicz, I. Simple yet effective: Historical proximity variables improve the species distribution models for invasive giant hogweed (Heracleum mantegazzianum s.l.) in Poland. PLoS ONE 2017, 12, e0184677. [Google Scholar] [CrossRef]
  30. Liu, X.; Rohr, J.R.; Li, Y. Climate, vegetation, introduced hosts and trade shape a global wildlife pandemic. Proc. R. Soc. B Biol. Sci. 2013, 280. [Google Scholar] [CrossRef]
  31. Davis, A.J.S.; Singh, K.K.; Thill, J.-C.; Meentemeyer, R.K. Accounting for residential propagule pressure improves prediction of urban plant invasion. Ecosphere 2016, 7, e01232. [Google Scholar] [CrossRef] [Green Version]
  32. U.S. Department of the Interior. Safeguarding America’s Lands and Waters from Invasive Species: A National Framework for Early Detection and Rapid Response; U.S. Department of the Interior: Washington, DC, USA, 2016; 55p.
  33. McGeoch, M.A.; Genovesi, P.; Bellingham, P.J.; Costello, M.J.; McGrannachan, C.; Sheppard, A. Prioritizing species, pathways, and sites to achieve conservation targets for biological invasion. Biol. Invasions 2016, 18, 299–314. [Google Scholar] [CrossRef]
  34. U.S. Department of Agriculture. Hungry Pests: Leave Hungry Pests Behind. Available online: https://www.aphis.usda.gov/aphis/resources/pests-diseases/hungry-pests/What-You-Can-Do (accessed on 9 November 2018).
  35. Araujo, M.B.; Guisan, A. Five (or so) challenges for species distribution modelling. J. Biogeogr. 2006, 33, 1677–1688. [Google Scholar] [CrossRef]
  36. Dormann, C.F.; Schymanski, S.J.; Cabral, J.; Chuine, I.; Graham, C.; Hartig, F.; Kearney, M.; Morin, X.; Römermann, C.; Schröder, B.; et al. Correlation and process in species distribution models: Bridging a dichotomy. J. Biogeogr. 2012, 39, 2119–2131. [Google Scholar] [CrossRef]
  37. Barry, S.; Elith, J. Error and uncertainty in habitat models. J. Appl. Ecol. 2006, 43, 413–423. [Google Scholar] [CrossRef] [Green Version]
  38. Gallien, L.; Douzet, R.; Pratte, S.; Zimmermann, N.E.; Thuiller, W. Invasive species distribution models—How violating the equilibrium assumption can create new insights. Glob. Ecol. Biogeogr. 2012, 21, 1126–1136. [Google Scholar] [CrossRef]
  39. Sullivan, M.J.P.; Franco, A.M.A. Changes in habitat associations during range expansion: Disentangling the effects of climate and residence time. Biol. Invasions 2018, 20, 1147–1159. [Google Scholar] [CrossRef]
  40. Václavík, T.; Meentemeyer, R.K. Equilibrium or not? Modelling potential distribution of invasive species in different stages of invasion. Divers. Distrib. 2012, 18, 73–83. [Google Scholar] [CrossRef]
  41. Andow, D.A.; Kareiva, P.M.; Levin, S.A.; Okubo, A. Spread of invading organisms. Landsc. Ecol. 1990, 4, 177–188. [Google Scholar] [CrossRef]
  42. Shigesada, N.; Kawasaki, K. Biological Invasions: Theory and Practice; Oxford University Press: Oxford, UK, 1997. [Google Scholar]
  43. Merow, C.; Smith, M.J.; Silander, J.A. A practical guide to MaxEnt for modeling species’ distributions: What it does, and why inputs and settings matter. Ecography 2013. [Google Scholar] [CrossRef]
  44. Elith, J.; Leathwick, J.R.; Hastie, T. A working guide to boosted regression trees. J. Anim. Ecol. 2008, 77, 802–813. [Google Scholar] [CrossRef] [Green Version]
  45. Guillera-Arroita, G.; Lahoz-Monfort, J.J.; Elith, J.; Gordon, A.; Kujala, H.; Lentini, P.E.; McCarthy, M.A.; Tingley, R.; Wintle, B.A. Is my species distribution model fit for purpose? Matching data and models to applications. Glob. Ecol. Biogeogr. 2015, 24, 276–292. [Google Scholar] [CrossRef] [Green Version]
  46. Jarnevich, C.S.; Stohlgren, T.J.; Kumar, S.; Morisette, J.T.; Holcombe, T.R. Caveats for correlative species distribution modeling. Ecol. Inform. 2015, 29, 6–15. [Google Scholar] [CrossRef]
  47. Uden, D.R.; Allen, C.R.; Angeler, D.G.; Corral, L.; Fricke, K.A. Adaptive invasive species distribution models: A framework for modeling incipient invasions. Biol. Invasions 2015, 17, 2831–2850. [Google Scholar] [CrossRef]
  48. Wang, O.; Zachmann, L.J.; Sesnie, S.E.; Olsson, A.D.; Dickson, B.G. An iterative and targeted sampling design informed by habitat suitability models for detecting focal plant species over extensive areas. PLoS ONE 2014, 9, e101196. [Google Scholar] [CrossRef] [PubMed]
  49. Williams, J.N.; Seo, C.; Thorne, J.; Nelson, J.K.; Erwin, S.; O’Brien, J.M.; Schwartz, M.W. Using species distribution models to predict new occurrences for rare plants. Divers. Distrib. 2009, 15, 565–576. [Google Scholar] [CrossRef]
  50. Rinnhofer, L.J.; Roura-Pascual, N.; Arthofer, W.; Dejaco, T.; Thaler-Knoflach, B.; Wachter, G.A.; Christian, E.; Steiner, F.M.; Schlick-Steiner, B.C. Iterative species distribution modelling and ground validation in endemism research: An Alpine jumping bristletail example. Biodivers. Conserv. 2012, 21, 2845–2863. [Google Scholar] [CrossRef]
  51. Guisan, A.; Broennimann, O.; Engler, R.; Vust, M.; Yoccoz, N.G.; Lehmann, A.; Zimmermann, N.E. Using niche-based models to improve the sampling of rare species. Conserv. Biol. 2006, 20, 501–511. [Google Scholar] [CrossRef] [PubMed]
  52. Lauzeral, C.; Grenouillet, G.; Brosse, S. The iterative ensemble modelling approach increases the accuracy of fish distribution models. Ecography 2015, 38, 213–220. [Google Scholar] [CrossRef]
  53. Crall, A.W.; Jarnevich, C.S.; Panke, B.; Young, N.; Renz, M.; Morisette, J. Using habitat suitability models to target invasive plant species surveys. Ecol. Appl. 2013, 23, 60–72. [Google Scholar] [CrossRef]
  54. Liebhold, A.M.; Gottschalk, K.W.; Muzika, R.-M.; Montgomery, M.E.; Young, R.; O’Day, K.; Kelley, B. Suitability of North American Tree Species to Gypsy Moth: A Summary of Field and Laboratory Tests; General Technical Report NE-211; USDA Forest Service, Northeastern Forest Experiment Station: Radnor, PA, USA, 1995; 34p.
  55. Gottschalk, K.W. Gypsy moth effects on mast production. In Proceedings of the Workshop: Southern Appalachian Mast Management, Knoxville, TN, USA, 14–16 August 1989; McGee, C.E., Ed.; University of Tennessee: Knoxville, TN, USA, 1989; pp. 42–50. [Google Scholar]
  56. Kessler, K.R.; Labosky, P., Jr. Pulp and papermaking properties of gypsy moth-killed trees. Wood Fiber Sci. 2007, 20, 386–396. [Google Scholar]
  57. Gale, G.A.; DeCecco, J.A.; Marshall, M.R.; McClain, W.R.; Cooper, R.J. Effects of gypsy moth defoliation on forest birds: An assessment using breeding bird census data. J. Field Ornithol. 2001, 72, 291–304. [Google Scholar] [CrossRef]
  58. Thurber, D.K.; McClain, W.R.; Whitmore, R.C. Indirect effects of gypsy moth defoliation on nest predation. J. Wildl. Manag. 1994, 58, 493–500. [Google Scholar] [CrossRef]
  59. Lovett, G.M.; Christenson, L.M.; Groffman, P.M.; Jones, C.G.; Hart, J.E.; Mitchell, M.J. Insect defoliation and nitrogen cycling in forests. BioScience 2002, 52, 335–341. [Google Scholar] [CrossRef]
  60. Etkind, P.H.; Odell, T.M.; Canada, A.T.; Shama, S.K.; Finn, A.M.; Tuthill, R. The gypsy moth caterpillar: A significant new occupational and public health problem. J. Occup. Med. Off. Publ. Ind. Med. Assoc. 1982, 24, 659–662. [Google Scholar] [CrossRef]
  61. Aukema, J.E.; Leung, B.; Kovacs, K.; Chivers, C.; Britton, K.O.; Englin, J.; Frankel, S.J.; Haight, R.G.; Holmes, T.P.; Liebhold, A.M.; et al. Economic impacts of non-native forest insects in the continental United States. PLoS ONE 2011, 6, e24587. [Google Scholar] [CrossRef] [PubMed]
  62. Liebhold, A.; Bascompte, J. The Allee effect, stochastic dynamics and the eradication of alien species. Ecol. Lett. 2003, 6, 133–140. [Google Scholar] [CrossRef]
  63. Liebhold, A.M.; Sharov, A.A.; Tobin, P.C. Population biology of gypsy moth spread. In Slow the Spread: A National Program to Manage the Gypsy Moth; General Technical Report NRS-6; Tobin, P.C., Blackburn, L.M., Eds.; USDA Forest Service, Northern Research Station: Newtown Square, PA, USA, 2007; pp. 15–32. [Google Scholar]
  64. Logan, J.A.; Regniere, J.; Gray, D.R.; Munson, A.S. Risk assessment in the face of a changing environment: Gypsy moth and climate change in Utah. Ecol. Appl. 2007, 17, 101–117. [Google Scholar] [CrossRef]
  65. Regniere, J.; Nealis, V. Modelling seasonality of gypsy moth, Lymantria dispar (Lepidoptera: Lymantriidae), to evaluate probability of its persistence in novel environments. Can. Èntomol. 2002, 134, 805–824. [Google Scholar] [CrossRef]
  66. Regniere, J.; Sharov, A. Simulating temperature-dependent ecological processes at the sub-continental scale: Male gypsy moth flight phenology as an example. Int. J. Biometeorol. 1999, 42, 146–152. [Google Scholar] [CrossRef]
  67. Bigsby, K.M.; Tobin, P.C.; Sills, E.O. Anthropogenic drivers of gypsy moth spread. Biol. Invasions 2011, 13, 2077–2090. [Google Scholar] [CrossRef]
  68. Tobin, P.C.; Blackburn, L.M. Long-distance dispersal of the gypsy moth (Lepidoptera: Lymantriidae) facilitated its initial invasion of Wisconsin. Environ. Entomol. 2008, 37, 87–93. [Google Scholar] [CrossRef]
  69. Tobin, P.C.; Van Stappen, J.; Blackburn, L.M. Human visitation rates to the Apostle Islands National Lakeshore and the introduction of the non-native species Lymantria dispar (L.). J. Environ. Manag. 2010, 91, 1991–1996. [Google Scholar] [CrossRef] [PubMed]
  70. Gray, D.R. Hitchhikers on trade routes: A phenology model estimates the probabilities of gypsy moth introduction and establishment. Ecol. Appl. 2010, 20, 2300–2309. [Google Scholar] [CrossRef] [PubMed]
  71. Lippitt, C.D.; Rogan, J.; Toledano, J.; Sangermano, F.; Eastman, J.R.; Mastro, V.; Sawyer, A. Incorporating anthropogenic variables into a species distribution model to map gypsy moth risk. Ecol. Model. 2008, 210, 339–350. [Google Scholar] [CrossRef]
  72. Taylor, R.A.J.; McManus, M.L.; Pitts, C.W. The absolute efficiency of gypsy moth, Lymantria dispar (Lepidoptera: Lymantriidae), milk-carton pheromone traps. Bull. Èntomol. Res. 1991, 81, 111–118. [Google Scholar] [CrossRef]
  73. Tobin, P.C.; Zhang, A.; Onufrieva, K.; Leonard, D.S. Field evaluation of effect of temperature on release of disparlure from a pheromone-baited trapping system used to monitor gypsy moth (Lepidoptera: Lymantriidae). J. Econ. Entomol. 2011, 104, 1265–1271. [Google Scholar] [CrossRef]
  74. Sharov, A.A.; Liebhold, A.M.; Roberts, A.E. Optimizing the use of barrier zones to slow the spread of gypsy moth (Lepidoptera: Lymantriidae) in North America. J. Econ. Entomol. 1998, 91, 165–174. [Google Scholar] [CrossRef]
  75. Sharov, A.A.; Liebhold, A.M. Bioeconomics of managing the spread of exotic pest species with barrier zones. Ecol. Appl. 1998, 8, 833–845. [Google Scholar] [CrossRef]
  76. Epanchin-Niell, R.S.; Haight, R.G.; Berec, L.; Kean, J.M.; Liebhold, A.M. Optimal surveillance and eradication of invasive species in heterogeneous landscapes. Ecol. Lett. 2012, 15, 803–812. [Google Scholar] [CrossRef]
  77. Gray, D.R. The gypsy moth life stage model: Landscape-wide estimates of gypsy moth establishment using a multi-generational phenology model. Ecol. Model. 2004, 176, 155–171. [Google Scholar] [CrossRef]
  78. Downing, M.C.; Withrow, J.R.; Leinwand, I.I.F.; Cook, G.L.; Kennaway, L.F.; Jarnevich, C.; Sapio, F.J. European Gypsy Moth Lymantria Dispar Dispar Establishment Suitability for 2014; USDA Forest Service, Forest Health Assessment and Applied Sciences Team: Fort Collins, CO, USA, 2014. Available online: https://www.fs.fed.us/foresthealth/technology/pdfs/European_Gyspy_Moth_Establishement_Map_Summary.pdf (accessed on 10 November 2018).
  79. McManus, M.L. The Role of Behavior in the Disperal of Newly Hatch Gypsy Moth Larvae; Research Paper NE-267; USDA Forest Service, Northeastern Forest Experiment Station: Upper Darby, PA, USA, 1973.
  80. McFadden, M.W.; McManus, M.E. An insect out of control? The potential for spread and establishment of the gypsy moth in new forest areas in the United States. In Insect Guilds: Patterns of Interaction with Host Trees; Baranchikov, Y.N., Mattson, W.J., Hain, F.P., Payne, T.L., Eds.; USDA Forest Service, Northeastern Forest Experiment Station: Radnor, PA, USA, 1991; pp. 172–186. [Google Scholar]
  81. Frank, K.L.; Tobin, P.C.; Thistle, H.W.; Kalkstein, L.S. Interpretation of gypsy moth frontal advance using meteorology in a conditional algorithm. Int. J. Biometeorol. 2013, 57, 459–473. [Google Scholar] [CrossRef] [PubMed]
  82. Tobin, P.; Blackburn, L.M. Slow the Spread: A National Program to Manage the Gyspy Moth; Gen. Tech. Rep. NRS-6; US Department of Agriculture, Forest Service, Northern Research Station: Newton Square, PA, USA, 2007.
  83. Tobin, P.C.; Onufrieva, K.S.; Thorpe, K.W. The relationship between male moth density and female mating success in invading populations of Lymantria dispar. Èntomol. Exp. Appl. 2013, 146, 103–111. [Google Scholar] [CrossRef]
  84. Tobin, P.C.; Robinet, C.; Johnson, D.M.; Whitmire, S.L.; Bjørnstad, O.N.; Liebhold, A.M. The role of Allee effects in gypsy moth, Lymantria dispar (L.), invasions. Popul. Ecol. 2009, 51, 373–384. [Google Scholar] [CrossRef]
  85. Sharov, A.A.; Liebhold, A.M.; Ravlin, F.W. Prediction of Gypsy Moth (Lepidoptera: Lymantriidae) mating success from pheromone trap counts. Environ. Èntomol. 1995, 24, 1239–1244. [Google Scholar] [CrossRef]
  86. Onufrieva, K.; Thorpe, K.; Hickman, A.; Leonard, D.; Roberts, E.; Tobin, P. Persistence of the gypsy moth pheromone, disparlure, in the environment in various climates. Insects 2013, 4, 104–116. [Google Scholar] [CrossRef] [PubMed]
  87. Dormann, C.F.; McPherson, J.M.; Araujo, M.B.; Bivand, R.; Bolliger, J.; Carl, G.; Davies, R.G.; Hirzel, A.; Jetz, W.; Kissling, W.D.; et al. Methods to account for spatial autocorrelation in the analysis of species distributional data: A review. Ecography 2007, 30, 609–628. [Google Scholar] [CrossRef]
  88. USDA, Animal and Plant Health Inspection Service. Gypsy Moth Program Manual. First Edition ed. Plant Protection and Quarantine; 2010. Available online: http://www.aphis.usda.gov/import_export/plants/manuals/domestic/downloads/gypsy_moth.pdf (accessed on 10 November 2018).
  89. Liebhold, A.M.; Tobin, P. Growth of newly established alien populations: Comparison of North American gypsy moth colonies with invasion theory. Popul. Ecol. 2006, 48, 253–262. [Google Scholar] [CrossRef]
  90. Tobin, P.C.; Bai, B.B.; Eggen, D.A.; Leonard, D.S. The ecology, geopolitics, and economics of managing Lymantria dispar in the United States. Int. J. Pest Manag. 2012, 58, 195–210. [Google Scholar] [CrossRef]
  91. Armstrong, K.; McHugh, P.; Chinn, W.; Frampton, E.R.; Walsh, P. Tussock moth species arriving on imported used vehicles determined by DNA analysis. N. Z. Plant Prot. 2003, 56, 16–20. [Google Scholar]
  92. Sharov, A.A.; Liebhold, A.M. Model of slowing the spread of gypsy moth (Lepidoptera: Lymantriidae) with a barrier zone. Ecol. Appl. 1998, 8, 1170–1179. [Google Scholar] [CrossRef]
  93. Morisette, J.T.; Jarnevich, C.S.; Holcombe, T.R.; Talbert, C.B.; Ignizio, D.; Talbert, M.K.; Silva, C.; Koop, D.; Swanson, A.; Young, N.E. VisTrails SAHM: Visualization and workflow management for species habitat modeling. Ecography 2013, 36, 129–135. [Google Scholar] [CrossRef]
  94. Elith, J.; Phillips, S.J.; Hastie, T.; Dudík, M.; Chee, Y.E.; Yates, C.J. A statistical explanation of MaxEnt for ecologists. Divers. Distrib. 2011, 17, 43–57. [Google Scholar] [CrossRef]
  95. Phillips, S.J.; Anderson, R.P.; Schapire, R.E. Maximum entropy modeling of species geographic distributions. Ecol. Model. 2006, 190, 231–259. [Google Scholar] [CrossRef]
  96. Elith, J.; Leathwick, J. Predicting species distributions from museum and herbarium records using multiresponse models fitted with multivariate adaptive regression splines. Divers. Distrib. 2007, 13, 265–275. [Google Scholar] [CrossRef]
  97. Friedman, J.H. Multivariate adaptive regression splines. Ann. Stat. 1991, 1–67. [Google Scholar] [CrossRef]
  98. McCullagh, P.; Nelder, J.A. Generalized Linear Models; CRC Press: Boca Raton, FL, USA, 1989; Volume 37. [Google Scholar]
  99. Friedman, J.; Hastie, T.; Tibshirani, R. Additive logistic regression: A statistical view of boosting (with discussion and a rejoinder by the authors). Ann. Stat. 2000, 28, 337–407. [Google Scholar] [CrossRef]
  100. Breiman, L. Random forests. Mach. Learn. 2001, 45, 5–32. [Google Scholar] [CrossRef]
  101. Liaw, A.; Wiener, M. Classification and regression by randomForest. R News 2002, 2, 18–22. [Google Scholar]
  102. Merow, C.; Smith, M.J.; Edwards, T.C.; Guisan, A.; McMahon, S.M.; Normand, S.; Thuiller, W.; Wüest, R.O.; Zimmermann, N.E.; Elith, J. What do we gain from simplicity versus complexity in species distribution models? Ecography 2014, 37, 1267–1281. [Google Scholar] [CrossRef] [Green Version]
  103. Dormann, C.F.; Elith, J.; Bacher, S.; Buchmann, C.; Carl, G.; Carré, G.; Marquéz, J.R.G.; Gruber, B.; Lafourcade, B.; Leitão, P.J.; et al. Collinearity: A review of methods to deal with it and a simulation study evaluating their performance. Ecography 2013, 36, 027–046. [Google Scholar] [CrossRef]
  104. Freeman, E.A.; Moisen, G. PresenceAbsence: An R package for presence absence analysis. J. Stat. Softw. 2008, 23, 1–31. [Google Scholar] [CrossRef]
  105. USDA Forest Service, Forest Health Assessment and Applied Sciences Team. Invasive Species Sample Design Tool (ArcGIS 10.0). Available online: http://www.fs.fed.us/foresthealth/technology/invasives_sample_design_tool.shtml (accessed on 10 November 2018).
  106. Stevens, D.L., Jr.; Olsen, A.R. Spatially balanced sampling of natural resources. J. Am. Stat. Assoc. 2004, 99, 262–278. [Google Scholar] [CrossRef]
  107. Theobald, D.M.; Stevens, D.L.; White, D.; Urquhart, N.S.; Olsen, A.R.; Norman, J.B. Using GIS to generate spatially balanced random survey designs for natural resource applications. Environ. Manag. 2007, 40, 134–146. [Google Scholar] [CrossRef] [PubMed]
  108. Government of Canada, Canadian Food Inspection Agency, and Plant Health and Biosecurity Directorate. “Appendix 1: List of North American Gypsy Moth Infested or Suspected Infested Areas of Canada and the United States.” D-98-09: Comprehensive Policy to Control the Spread of North American Gypsy Moth, Lymantria Dispar in Canada and the United States. 23 June 2017. Available online: www.inspection.gc.ca/plants/plant-pests-invasive-species/directives/forestry/d-98-09/appendix-1/eng/1343832991660/1343834043533 (accessed on 13 December 2018).
  109. Regniere, J.; Nealis, V.; Porter, K. Climate suitability and management of the gypsy moth invasion into Canada. Biol. Invasions 2009, 11, 135–148. [Google Scholar] [CrossRef]
  110. Andresen, J.; McCullough, D.; Potter, B.; Koller, C.; Bauer, L.; Lusch, D.; Ramm, C. Effects of winter temperatures on gypsy moth egg masses in the Great Lakes region of the United States. Agric. For. Meteorol. 2001, 110, 85–100. [Google Scholar] [CrossRef]
  111. Bossenbroek, J.M.; Johnson, L.E.; Peters, B.; Lodge, D.M. Forecasting the expansion of zebra mussels in the United States. Conserv. Biol. 2007, 21, 800–810. [Google Scholar] [CrossRef] [PubMed]
  112. Pyšek, P.; Hulme, P.E. Spatio-temporal dynamics of plant invasions: Linking pattern to process. Écoscience 2005, 12, 302–315. [Google Scholar] [CrossRef]
  113. Stohlgren, T.J.; Schnase, J.L. Risk analysis for biological hazards: What we need to know about invasive species. Risk Anal. 2006, 26, 163–173. [Google Scholar] [CrossRef] [PubMed]
  114. Thompson, L.M.; Faske, T.M.; Banahene, N.; Grim, D.; Agosta, S.J.; Parry, D.; Tobin, P.C.; Johnson, D.M.; Grayson, K.L. Variation in growth and developmental responses to supraoptimal temperatures near latitudinal range limits of gypsy moth Lymantria dispar (L.), an expanding invasive species. Physiol. Èntomol. 2017, 42, 181–190. [Google Scholar] [CrossRef]
  115. Bell, R.A. Manipulation of diapause in the gypsy moth, Lymantria dispar L., by application of KK-42 and precocious chilling of eggs. J. Insect Physiol. 1996, 42, 557–563. [Google Scholar] [CrossRef]
  116. Campbell, R.W. The role of disease and desiccation in the population dynamics of the gypsy moth Porthetria dispar (L.) (Lepidoptera: Lymantriidae). Can. Èntomol. 1963, 95, 426–434. [Google Scholar] [CrossRef]
  117. Tobin, P.C.; Diss-Torrance, A.; Blackburn, L.M.; Brown, B.D. What does “local” firewood buy you? Managing the risk of invasive species introduction. J. Econ. Èntomol. 2010, 103, 1569–1576. [Google Scholar] [CrossRef] [PubMed]
  118. Muirhead, J.R.; Leung, B.; van Overdijk, C.; Kelly, D.W.; Nandakumar, K.; Marchant, K.R.; MacIsaac, H.J. Modelling local and long-distance dispersal of invasive emerald ash borer Agrilus planipennis (Coleoptera) in North America. Divers. Distrib. 2006, 12, 71–79. [Google Scholar] [CrossRef]
  119. Koch, F.H.; Yemshanov, D.; Magarey, R.D.; Smith, W.D. Dispersal of invasive forest insects via recreational firewood: A quantitative analysis. J. Econ. Èntomol. 2012, 105, 438–450. [Google Scholar] [CrossRef] [PubMed]
  120. Anderson, L.G.; Rocliffe, S.; Haddaway, N.R.; Dunn, A.M. The role of tourism and recreation in the spread of non-native species: A systematic review and meta-analysis. PLoS ONE 2015, 10, e0140833. [Google Scholar] [CrossRef] [PubMed]
  121. Drescher, M.; Perera, A.H.; Johnson, C.J.; Buse, L.J.; Drew, C.A.; Burgman, M.A. Toward rigorous use of expert knowledge in ecological research. Ecosphere 2013, 4, 1–26. [Google Scholar] [CrossRef]
  122. Jarnevich, C.S.; Esaias, W.E.; Ma, P.L.A.; Morisette, J.T.; Nickeson, J.E.; Stohlgren, T.J.; Holcombe, T.R.; Nightingale, J.M.; Wolfe, R.E.; Tan, B. Regional distribution models with lack of proximate predictors: Africanized honeybees expanding north. Divers. Distrib. 2014, 20, 193–201. [Google Scholar] [CrossRef]
  123. Leung, B.; Lodge, D.M.; Finnoff, D.; Shogren, J.F.; Lewis, M.A.; Lamberti, G. An ounce of prevention or a pound of cure: Bioeconomic risk analysis of invasive species. Proc. R. Soc. Lond. Ser. B-Biol. Sci. 2002, 269, 2407–2413. [Google Scholar] [CrossRef] [PubMed]
  124. American Moving and Storage Association. Gypsy Moths: Remove before You Move. Available online: https://www.moving.org/home/moving-101/gypsy-moths-remove-before-you-move/ (accessed on 29 November 2018).
  125. U.S. Department of Agriculture, Animal and Plant Health Inspecton Service. Your Move Gypsy Moth Free. Available online: https://www.aphis.usda.gov/aphis/resources/pests-diseases/hungry-pests/the-threat/gypsy-moth-free/ (accessed on 29 November 2018).
Figure 1. The APHIS-PPQ gypsy moth survey program area, defined by the region outside the generally infested area (federal quarantine area) and the spread front (managed by the Slow the Spread program).
Forests 10 00108 g001
Figure 2. Annual risk models depicting the likelihood of gypsy moth detection. Area in grey is the federal quarantine area and the active spread front. Areas in black are climatically unsuitable for establishment.
Forests 10 00108 g002
Figure 3. Validation of the 2015 gypsy moth risk model with survey detection data. The 2015 survey year coincided with population outbreaks of introduced gypsy moth in Washington and Oregon.
Forests 10 00108 g003
Figure 4. Receiver operating curve validating annual gypsy moth risk models with next year survey data, labelled by year with area under the curve (AUC).
Forests 10 00108 g004
Figure 5. Boxplot series of the distribution of predicted risk values for positive detection locations by year and geographic region: (A) Short-range geographic model (0–200 km), (B) intermediate-range geographic model (201–500 km), and (C) long-range geographic model (>500 km).
Forests 10 00108 g005
Table 1. Summary descriptions of the potential predictors for the 2015 model (some of which are updated in subsequent years), indicated by type of pathway: Biologic 1 or anthropogenic 2 dispersal.
PredictorDescriptionValue RangeSource
Distance from STS 1Euclidean distance from a historical merge of STS action areas dating from 2005–2016. “Distance from the spread front”.0–1,032,550 mSlow the Spread
Distance From Prior Year Source Population 1Euclidean distance of current year detection from previous year’s population source (≥3 moths in a trap). Functions as a basic spread kernel.0–1,097,132 mAPHIS PPQ
Traffic Volume (20-mile moving window) 2Traffic volume was selected for highways/interstates and queried on directionality of gypsy moth spread (west/south). Within quarantine bounds, the maximum traffic volume was used regardless of direction. Volumes were interpolated over a 20-mile moving window to represent multiple highway introduction potential within urban areas. “NoData” values were reclassed to zero.0–207,028 AADT (or equivalent metric)TrafficMetrix
Road Density 2Developed from rasterized 2003 TeleAtlas Dynamap /Transportation v. 5.2 for each state at 100 m. Density was calculated by summing the number of 100 m road pixels within a 1 km pixel and standardized to a 0–100 scale.0–100US Forest Service FHAAST
Address Forwards 2Summary of the number of United States Postal Service (USPS) address forwards originating from zipcodes within the gypsy moth quarantine area to that destination census tracts for a two-year period. Forwarding data was compiled by USPS from January 2012–December 2014, and provided to USDA/APHIS under a memorandum of understanding. “NoData” values were reclassed to zero.0–14,332 forwards per census tractUS Postal Service
Median Household Income 212 months (2012) median household income reported on census tract level and joined to 2011 U.S. Census TIGER tracts boundaries. “NoData” values were reclassed to zero.$0–$250,000US Census Bureau, American Commodity Survey.
Population Density 2Population density reported by block group, and joined to 2010 TIGER census block boundaries.0–732,314 people/ square mile2010 Census, US Census Bureau
Distance From Campgrounds 2Euclidean distance from campgrounds identified by federal and state cooperators, or compiled by APHIS from federal, state, and private data sources.0–83,451 mReserveAmerica,
APHIS PPQ, USCampgrounds.info
Distance From Nurseries 2Euclidean distance from regulated nurseries (wholesale and retail).0–1,080,628 mAPHIS PPQ
Distance From Intermodal Facilities 2Euclidean distance from intermodal facilities, where commodities exchange modes of transportation (road, rail, sea port, etc.)0–1,081,072 mBureau of Transportation Statistics, NTAD 2012
Distance From Weigh Stations 2Euclidean distance from weigh stations.0 – 1,128,904 mPOI-Factory.com
Distance From Military Bases 2Euclidean distance from military bases.0–1,079,191 mBureau of Transportation Statistics, NTAD 2012
Distance From Rest Stops 2Euclidean distance from rest stops.0–1,111,864 mPOI-Factory.com
Distance From Saw Mills 2Euclidean distance from primary sawmills.0–1,356,683 mUS Forest Service, Southern Research Station 2005
Distance From Universities 2Euclidean distance from universities.0–1,085,964 mArcGIS Online, 2010
Distance From Wood Pallet Manufacturers 2Euclidean distance from wood pallet manufacturers.0–1,079,592 mHoovers, NAICS code 321920, pulled December 2013
Abbreviations: STS: Slow the Spread; APHIS: Animal and Plant Health Inspection Service; APHIS PPQ: Animal and Plant Health Inspection Service, Plant Protection and Quarantine; FHAAST: Forest Health Assessment and Applied Sciences Team; TIGER: Topologically Integrated Geographic Encoding and Referencing; NTAD: National Transportation Atlas Database; POI: points of interest.
Table 2. Average relative importance for the address forwarding predictor explaining gypsy moth occurrence increase as more data was accumulated to develop the predictor layer.
YearRelative ImportanceVariable RankAccumulated Data (# Years)
20155.9%63
201617.36%24
201835.76%15

