1. Introduction
Renewable Energy Communities (RECs) have become an essential response to the urgency of the energy transition by transferring generation capacity directly to local infrastructures. In the European context, RECs and collective self-consumption schemes have been increasingly recognized as instruments to decentralize electricity generation, promote citizen participation, and increase the local use of renewable energy [
1,
2]. In this context, RECs emerge as structures that enable local energy sharing, promote sustainability, reduce grid losses, and help address energy poverty. However, previous studies show that the performance of these schemes depends not only on the installed renewable capacity, but also on the temporal alignment between generation profiles, consumption patterns, sharing rules, and the objectives of participating consumers [
3,
4]. The expansion of these microgrids introduces complex management challenges. The mismatch between photovoltaic generation peaks, concentrated in the middle of the day, and residential consumption peaks, which are more pronounced during evening and night periods, frequently creates inefficiencies that result in daytime grid overloads and substantial reliance on imports at night. This problem is particularly relevant in island territories, where electrical systems are more vulnerable, grid infrastructure is limited, and seasonal variations in demand can strongly affect the balance between local generation and consumption [
1]. Faced with these challenges, empirical community grid planning has proven insufficient, making it necessary to adopt simulation tools before the physical implementation of infrastructures. Because the performance of an REC depends on the interaction between demand, photovoltaic generation, storage, and grid exchanges, simulation and optimization models have become essential tools for planning collective self-consumption systems [
5,
6]. Unlike static theoretical models, scenario-based simulation approaches can process real consumption and generation data, evaluate alternative configurations, and quantify the impact of photovoltaic expansion, demand flexibility, and battery storage before investment decisions are made. Open-source tools such as PROCSIM and PyECOM have contributed to this field by enabling reproducible analysis of demand and generation scenarios in energy communities [
7,
8].
Despite the growing literature on the optimization of energy communities, most existing studies rely on synthetic load profiles, aggregated demand curves, or small-scale pilot communities with fewer than 50 members [
9,
10]. There remains a significant gap in the application of simulation frameworks fed by real smart-metering data with sub-hourly resolution to large-scale communities exceeding 100 members, particularly when integrated with Artificial Intelligence (AI) models for operational decision support. Smart-meter data are particularly valuable because they allow the simulation model to represent real consumption behaviour instead of relying exclusively on synthetic or aggregated profiles, making it possible to identify daily peaks, seasonal patterns, outliers, and the actual potential for demand flexibility [
9].
This article presents a data-driven digital-twin-inspired simulation framework, supported by the Python framework PyECOM, applied to a real case study: Culatra Island, in southern Portugal. The study uses real consumption data from 338 permanent dwellings and local photovoltaic generation time series, simulating grid behavior in 15 min steps over ten months.
Despite the growing literature on REC optimization, a significant research gap remains: there is a critical lack of simulation frameworks that integrate real, sub-hourly smart-meter data with AI-driven forecasting for large-scale communities. To address this gap, this study proposes a Digital Twin-inspired simulation framework, guided by the following specific, testable research questions (RQs):
RQ1: How does the integration of empirical sub-hourly data and novel demographic filtering improve the baseline energy assessment of large-scale island microgrids?
RQ2: To what extent can the optimal sizing of centralized BESS and PV expansion overcome the limitations of demand-side flexibility in generation-constrained communities?
RQ3: How effectively can the N-HiTS deep learning architecture, enhanced by exogenous meteorological variables, forecast short-term PV generation to support proactive REC management?
This approach aligns with recent calls in the literature to enrich digital twin frameworks with advanced forecasting methodologies [
11].
2. Literature Review
The planning of Renewable Energy Communities has evolved from static simulation models to dynamic approaches driven by the Digital Twin concept. This review focuses on three areas: virtual coordination architectures, Artificial Intelligence-based management systems, and simulation tools for validating local energy balances. The literature also highlights that the performance of collective self-consumption schemes depends on the alignment between photovoltaic generation, consumption profiles, storage capacity, and energy-sharing rules [
2,
4].
In microgrid coordination, Bâra and Oprea [
12] developed a bidirectional Digital Twin model to address Peer-to-Peer coordination failures. The architecture was organized into two sequential optimization levels—an individual household, an internal Energy Management System (iEMS) assistant and a global community assistant, an external Energy Management System (eEMS), with the aim of minimizing costs through intelligent scheduling of flexible loads. The results showed an average reduction of 45 kW in exchanges with the public grid during summer, with a 15% reduction during peak hours, validating the technical feasibility of local energy markets. However, this type of approach is limited in communities where the main problem is not demand management but a chronic generation deficit. This limitation is particularly relevant for island communities, where local renewable generation, seasonal demand variation, and grid dependence must be analysed together [
1].
Walmsley et al. [
13] addressed a different context by developing Adaptive Digital Twins for industrial communities with high energy requirements. The system used a closed feedback loop based on the Monitor-Analyze-Plan-Execute over a shared Knowledge base (MAPE-K) [
14] standard, supported by cloud platforms, giving the model self-optimization and self-learning capabilities. The results were significant: system response time was reduced by up to six times and operational savings reached 2% through autonomous asset management. The main limitation of this approach is its specificity to industrial contexts, where consumption patterns differ greatly from residential ones.
In the residential sector, ur Rehman [
15] integrated a Deep Reinforcement Learning algorithm—specifically Proximal Policy Optimization—with a Digital Twin developed in Python 3.12.9. The model updated the grid state every 15 min and simultaneously managed batteries, electric vehicles, and thermal loads, achieving a 32% reduction in overall energy costs while maintaining a comfort rate above 95%. The limitation of this approach lies in the assumption of full household automation, which is not realistic in most existing communities. In this context, the proposed framework combines simulation and data-driven analysis to evaluate alternative configurations of the energy community using historical consumption and generation data.
Regarding simulation tools, the literature shows a clear transition from static platforms to Python-based Discrete Event simulators. PROCSIM [
7] generates realistic synthetic consumption and generation scenarios, while PyECOM [
8] operates at the management layer, using the SimPy library to orchestrate time and dynamically process market and storage algorithms.
In summary, a critical synthesis of the existing literature reveals that current models predominantly rely on synthetic load profiles, aggregated demand curves, or small-scale pilot studies. Furthermore, there is a notable absence of frameworks that bridge the gap between static sizing tools and proactive operational planning through the integration of deep learning forecasting models. This study explicitly addresses these gaps by deploying a data-driven simulation framework fed by real high-resolution data from 338 dwellings, and by integrating an N-HiTS forecasting module to support large-scale microgrid optimization. This approach aligns with recent calls in the literature for more robust, data-driven optimization strategies in energy communities. To contextualize the methodological contribution of this work,
Table 1 compares the proposed approach with representative state-of-the-art studies, focusing on five criteria: research focus, simulation engine and tech stack, optimization and control logic, and reported outcomes.
3. Materials and Methods
The methodology followed during the project was the Method for Industrial Data Analysis (MIDA) [
20]. MIDA is a structured framework derived from CRISP-DM, specifically tailored for industrial and engineering contexts. It guided this study through four distinct phases: (1) Domain Understanding (identifying the island’s energy vulnerabilities and grid dependence); (2) Data Acquisition and Preparation (cleaning and synchronizing sub-hourly smart-meter data); (3) Modeling (deploying the Digital Twin via PyECOM and integrating N-HiTS forecasting); and (4) Evaluation (validating scenarios to support technical decision-making).
3.1. Case Study and Data Acquisition
Culatra Island, located in southern Portugal, operates as a vulnerable microgrid due to its geographical isolation [
21]. The island has two main residential areas: Culatra, which has population residing all year, and Farol, which is essentially beach houses, empty during the cold season. To capture the stochasticity of the physical system, two empirical datasets were collected.
The first dataset includes electricity consumption data from an initial universe of 525 dwellings. These records were structured in a tabular format containing the unique installation identifier (houseid), timestamp, and consumed energy (consumptionkwh). The series has a strict 15 min period resolution and covers the entire year of 2025. Statistical extraction from this dataset reveals a maximum community consumption of 95.84 kWh in a single interval (equivalent to a power peak of 383.36 kW), a minimum base consumption of 5.82 kWh (23.28 kW), and a global average of 37.00 kWh per simulation step.
While these absolute extremes highlight the maximum stress on the grid throughout the year, analyzing the community’s typical behavior requires a seasonal approach.
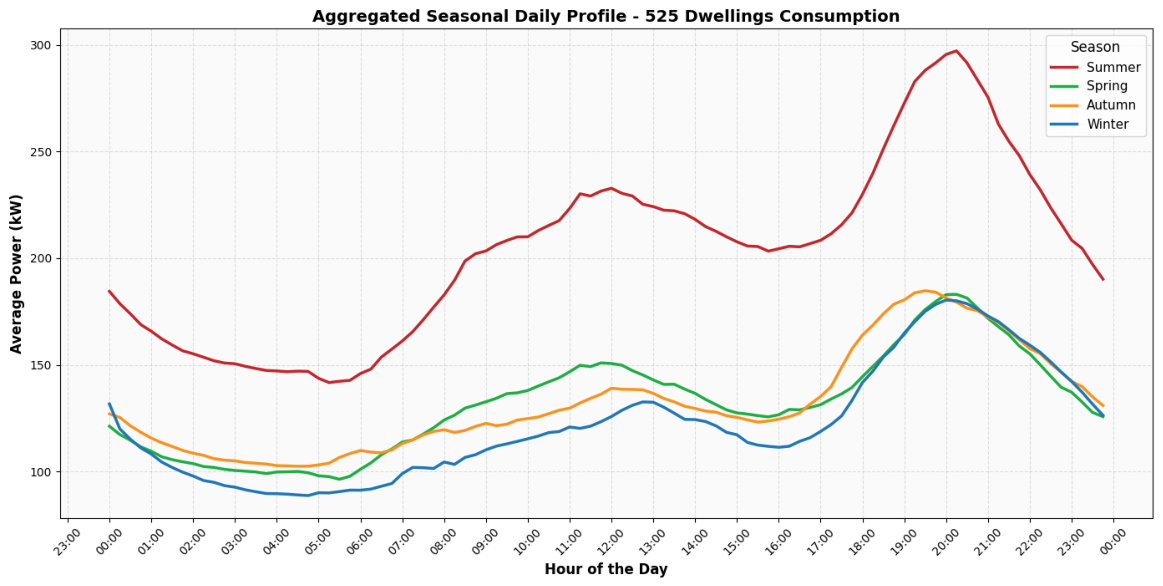
Figure 1 presents the aggregated seasonal daily profile for the initial 525 dwellings. By calculating the average power for each 15 min interval across the different seasons, this representation smooths out the absolute annual extremes. It provides a reliable baseline of the typical daily load curve, clearly exposing the severe summer consumption peak driven by the island’s tourist influx.
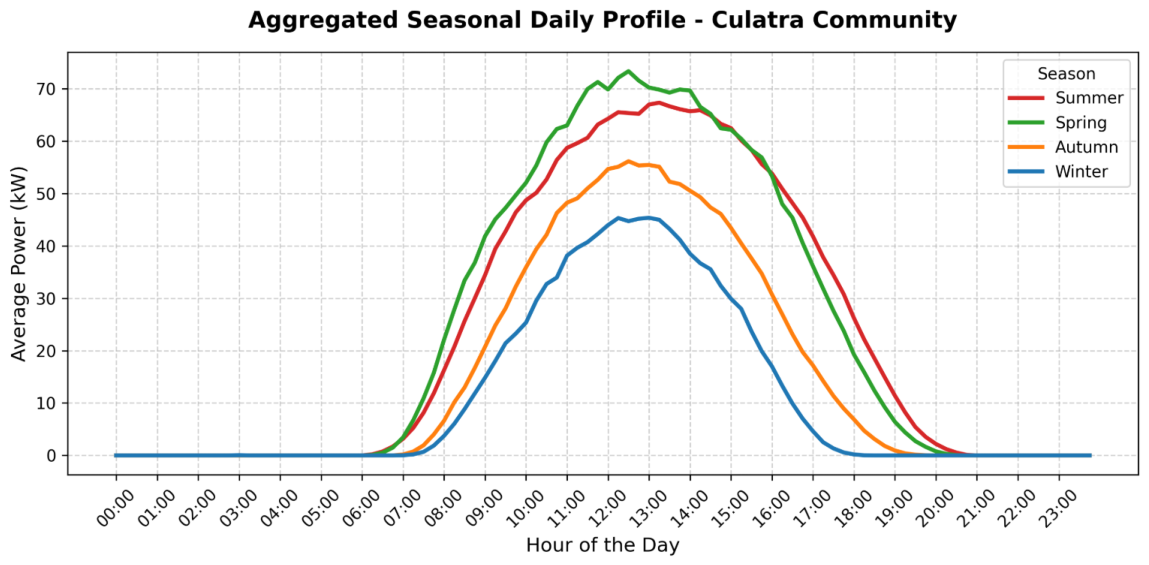
The second dataset refers to photovoltaic generation, recorded independently at 7 production nodes distributed across the island. To illustrate the seasonal variability of the solar resource,
Figure 2 presents the aggregated daily profile of these decentralized generation clusters. This chart represents the community’s installed solar capacity, which yields a gross annual generation of 140,308.91 kWh. Unlike the consumption smart-metering data, the photovoltaic records present a higher sampling frequency, with a period of 1 min. The temporal overlap of both datasets—given that generation data logging began in March 2025—validated a strict simulation window from 1 March to 31 December 2025, totaling 29,376 synchronized simulation steps in the Digital Twin engine.
3.2. Data Preprocessing
To ensure the reliability of the simulation model, both the photovoltaic generation and the residential consumption datasets underwent specific preprocessing routines.
Regarding the photovoltaic generation time series, the exploratory analysis revealed two hardware-data inconsistencies that compromised the energy balance. First, most inverters operated with a bidirectional metering topology that recorded daytime generation with inverted polarity (as negative power) and nighttime standby consumption as positive power. Second, the native records were measured in Watts rather than Kilowatts, causing severe scale disparities. To correct these inconsistencies, a Python-based data preparing routine was developed. The algorithm inverted the data polarity (multiplying by −1 to correctly orient the power signal for data analysis purposes) and forced all residual negative values corresponding to nighttime standby consumption to 0.00 kW. This adjustment was strictly necessary to prevent load double-counting, as the inverters’ standby power consumption is already natively captured by the households’ main smart meters and thus integrated into the electricity consumption dataset. Afterward, a linear conversion factor (division by 1000) was applied to standardize all matrices in kilowatts.
The quantitative impact of the PV data pre-processing is summarized in
Table 2. The routine successfully eliminated nighttime inverter standby noise and corrected signal polarity, restoring the integrity of the generation vector.
Following the data synchronization, the net load (
) at each discrete 15 min time step
t is explicitly defined as the difference between the aggregated community load (
) and the processed photovoltaic generation (
):
Concurrently, the electricity consumption dataset required a demographic filtering process to isolate the real demand of the permanent community. The island includes areas with strong seasonality, mostly composed of holiday homes with residual consumption outside the summer season. Including these dwellings would distort the baseline scenario’s Self-Sufficiency metrics. To overcome this, a filter based on winter energy behavior was implemented. The total consumption of each dwelling from November to February was analyzed, assuming that regular lighting and heating use during this period indicates permanent residence. While we acknowledge that the intensive use of electric heating could act as a confounding factor—potentially inflating the consumption profiles of certain dwellings—this consumption-based methodology provides a significantly more reliable proxy for identifying year-round permanent residents than spatial location alone, which is heavily distorted by summer tourism. The dwellings were ranked by consumption volume in these months, and the 338 highest-consumption dwellings were selected, corresponding to the official number of families with permanent residence on the island. This is justified by the fact that the goal of the project is to study the conditions of self-sufficiency of the permanent community, not the variable community of beach houses in the Farol area.
3.3. Digital Twin Architecture
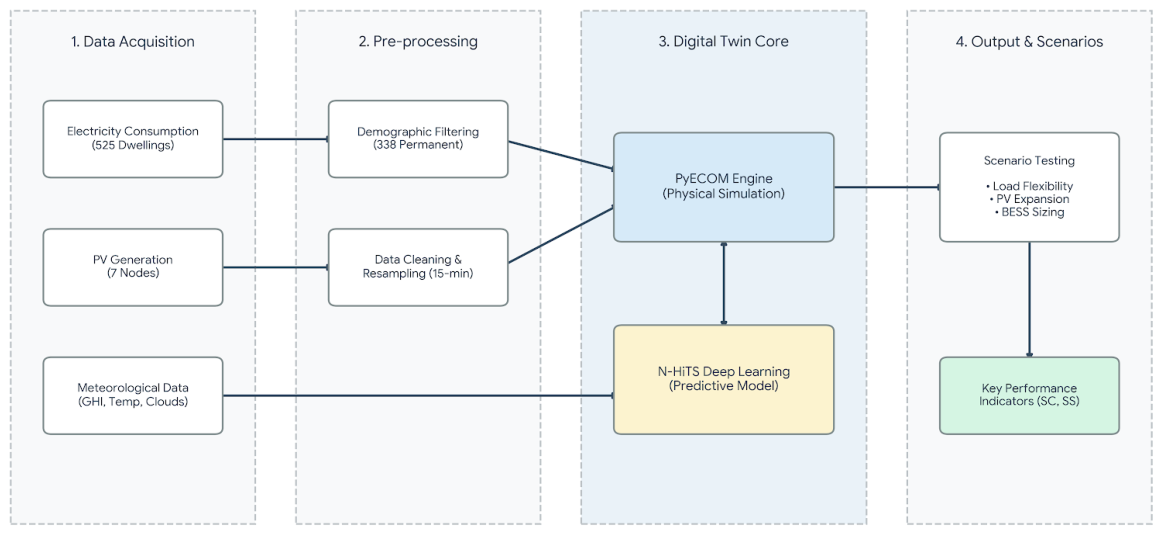
While the term “Digital Twin” strictly implies a fully automated, bi-directional linkage between the physical infrastructure and the virtual environment (a closed-loop system), it is important to clarify the boundaries of the proposed architecture to avoid terminology overclaiming. The current implementation operates as a data-driven, Digital Twin-inspired simulation framework. It functions in an open-loop configuration, utilizing high-resolution empirical data ingestion to perform offline scenario optimization and advanced forecasting. This foundational approach establishes the necessary data structures and predictive capabilities for future aspirations of a fully closed-loop system, where real-time synchronization will eventually enable autonomous, bi-directional actuator dispatch within the community grid. To conceptualize the integration of the physical microgrid with the virtual simulation environment,
Figure 3 illustrates the proposed Digital Twin macro architecture, connecting data ingestion, preprocessing, and the simulation engine.
The simulation framework was implemented with the PyECOM simulator. The simulation engine operates through PyECOM’s native classes, advancing the grid state in 15 min steps. The island’s physical entities were modeled through three computational classes: Load for the consumption profiles of the 338 dwellings, Generator for the aggregated generation curves of the 7 photovoltaic points, and Storage for the scenarios with battery storage systems.
At each time step, the PyECOM sharing algorithm operates on a centralized, proportional allocation logic rather than a simple first-come-first-served basis. The aggregated PV generation is distributed to meet the instantaneous aggregated community demand. The performance of these energy transactions is evaluated using the Self-Consumption (SC) and Self-Sufficiency (SS) rates, defined over the total simulation period
T as follows:
3.4. Solar Generation Predictive Model
As identified in the literature review, the transition toward fully adaptive microgrids requires simulation frameworks capable of proactive operation—a challenge increasingly addressed by AI-driven approaches [
13,
15]. To provide the Digital Twin with this proactive capability, a Deep Learning model based on the Neural Hierarchical Interpolation for Time Series (N-HiTS) architecture [
22], available in the NeuralForecast library, was integrated. N-HiTS was selected over traditional sequential models due to its high computational efficiency and superior accuracy in long-horizon forecasting, achieved through multi-rate signal sampling and hierarchical interpolation. The model was fed with the historical aggregated photovoltaic generation alongside exogenous meteorological variables—Global Horizontal Irradiance (GHI), Cloud Cover, and Ambient Temperature—for the year 2025. These exogenous inputs consist of strictly measured historical data (ground-truth observations) sourced from the Open-Meteo historical weather API, rather than numerical weather forecasts. This explicitly ensures that the model’s training and evaluation phases are grounded in the actual local weather conditions experienced by the community grid.
The forecasting horizon was set to 672 steps, corresponding to a continuous 7-day prediction window at a 15 min resolution. This extended horizon was deliberately chosen to directly support operational decision-making processes, specifically optimal battery scheduling. A 7-day window allows the Energy Management System to anticipate prolonged meteorological phenomena (e.g., consecutive overcast days) and pre-charge the BESS during surplus periods, mitigating future deficits. To adequately capture recent temporal dependencies, the historical input window size (lookback) was defined symmetrically as 672 steps. This 7-day lookback provides the network with a complete weekly cyclical pattern of human activity and solar availability, ensuring sufficient baseline context without introducing computational noise from obsolete long-term data.
The model was trained with data from March to October 2025 and comprehensively tested over a continuous two-month window encompassing November and December. To maintain the operational consistency of the 7-day battery planning horizon, the evaluation was conducted using a rolling forecast methodology. This extended testing period was deliberately implemented not only to utilize the full extent of the available dataset, but also to validate the model’s robustness and generalization capability across a wide range of highly unstable winter meteorological conditions. Performance was evaluated with three metrics: Mean Absolute Error (MAE), Mean Absolute Percentage Error (MAPE), and Coefficient of Determination ().
3.5. Model Assumptions, Boundary Conditions, and Scalability
To ensure methodological transparency, the boundary conditions of the simulation framework are strictly defined by the geographic and electrical limits of the Culatra island community grid. The choice of the PyECOM engine was driven by its deterministic, rule-based sharing algorithm, which guarantees computational efficiency for high-resolution (15 min) multi-node datasets, contrasting with the heavy overhead of stochastic optimization solvers.
A fundamental assumption of the current setup is the ideal operation of the Battery Energy Storage Systems (100% round-trip efficiency and zero degradation). This is justified for long-term capacity planning studies, as the primary objective is to identify raw structural energy deficits before introducing complex, non-linear operational losses. The primary sources of uncertainty and error stem from inherent meteorological volatility and transient smart-meter communication failures, which were largely mitigated by the rigorous pre-processing phase.
Despite the geographically isolated case study, the proposed architecture is highly scalable. Its modularity allows it to be explicitly applied to broader practical fields, offering a replicable foundation for mainland Renewable Energy Communities (RECs), industrial microgrid sizing, and municipal smart-city energy transition planning.
Additionally, regarding the physical hardware boundaries, it must be acknowledged that environmental phenomena such as PV panel fouling (the accumulation of dust, sand, and salt, which is highly prevalent in island and coastal environments) act as a minor ongoing limitation. This physical factor can slightly degrade the realized photovoltaic generation over time compared to laboratory-rated capacities, a variable that should be accounted for in long-term maintenance planning.
4. Results
This section details the simulation results obtained from the Digital Twin framework applied to the Culatra Island Energy Community. To systematically evaluate the community grid’s energy balance and optimization potential, the analysis is structured progressively. Performance is quantified throughout the scenarios primarily via two key indicators: the Self-Consumption Rate (SC) and the Self-Sufficiency Rate (SS). The assessment begins with a baseline diagnosis of the current infrastructure, followed by the evaluation of demand-side flexibility, theoretical photovoltaic capacity expansions, and optimal battery storage sizing. Finally, the integration of the Deep Learning predictive model is validated under real meteorological conditions.
4.1. Baseline Scenario
This scenario evaluates the integration of the real consumption profiles of the 338 permanent dwellings and aggregated photovoltaic generation from the 7 production points into the PyECOM engine. While the sum of the individual theoretical nominal capacities of these 7 nodes totals an original installed capacity of 100.72 kWp, the maximum coincident peak generation actually recorded by the smart meters for the aggregated community was 87.46 kW, due to the natural non-simultaneity of peak solar yields across different physical locations and real-world efficiency losses. The simulation processed 29,376 time steps with 15 min resolution, recording total consumption of 1,013,739.77 kWh and photovoltaic production of 126,876.49 kWh. The baseline scenario revealed two critical indicators: a Self-Consumption Rate (SC) of 99.98% and a Self-Sufficiency Rate (SS) of only 12.51%. The SC close to 100% indicates that virtually all generated solar energy is instantaneously absorbed by the community, without any surplus injected into the grid. The SS of 12.51% confirms that installed photovoltaic capacity covers only about one-eighth of the island’s total consumption, evidencing a critical reliance on the external electricity grid.
A deeper analysis of these indicators confirms that the community grid operates in a state of chronic renewable-generation undersizing. The collected load profiles show the island’s typical residential behavior, with pronounced consumption peaks in the morning and evening periods, when solar irradiance is zero or insufficient.
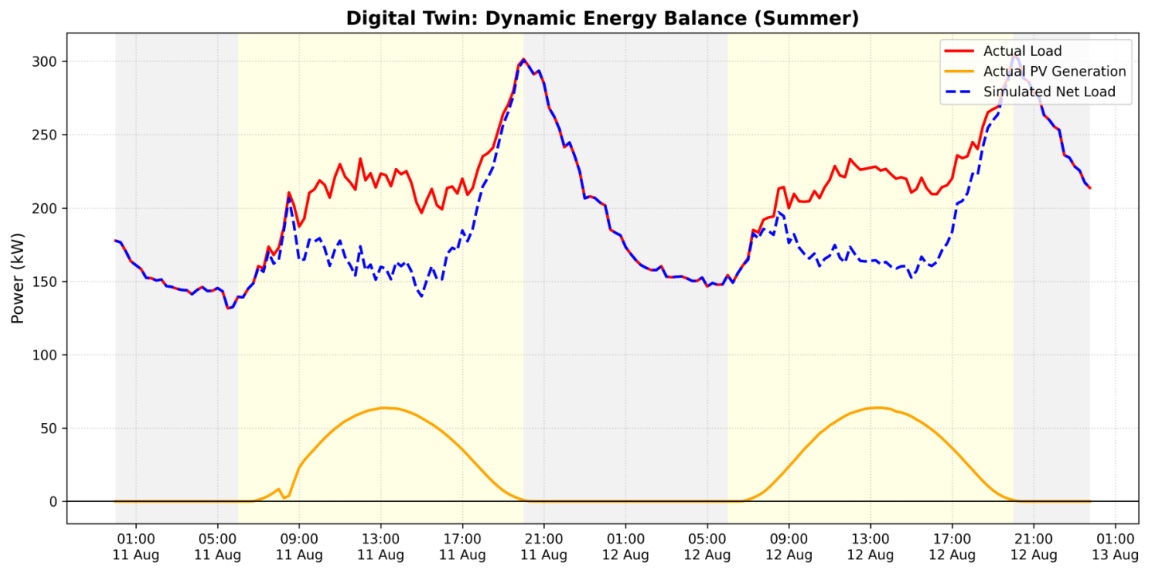
To visually demonstrate this operational behavior, high-resolution 48-h simulation profiles were extracted for both summer and winter periods.
Figure 4 illustrates the dynamic energy balance during two typical summer days (11–12 August). Despite the aggregated photovoltaic generation reaching peaks of 60 to 65 kW, it is manifestly insufficient to offset the daytime demand, which remains highly elevated between 200 and 230 kW. Furthermore, after sunset, the community’s load surges to a daily maximum of approximately 300 kW around 20:00, before stabilizing at a heavy nighttime baseload of 150 kW.
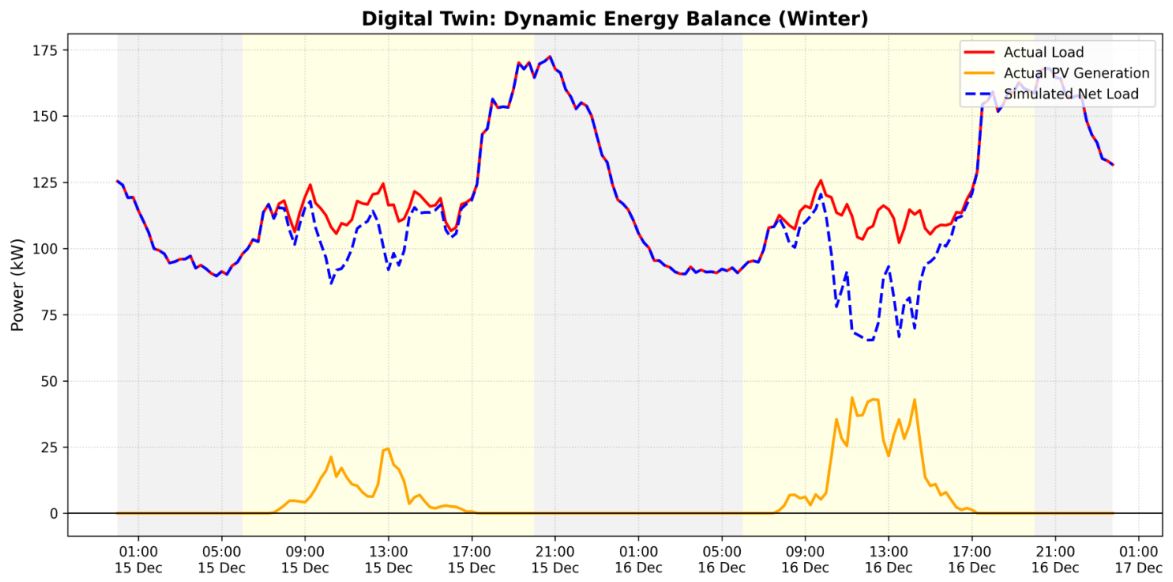
Conversely,
Figure 5 depicts the corresponding behavior during two winter days (15–16 December), revealing a drastic contraction in solar availability alongside heightened thermal comfort needs. Meteorological instability restricts solar generation to brief peaks ranging from 25 to 40 kW, which are instantaneously absorbed by a daytime baseload that rarely drops below 90 to 100 kW. This structural deficit is critically exacerbated at nightfall, when the activation of heating equipment drives the community’s load to pronounced peaks exceeding 170 kW. In both scenarios, the total absorption of the generation curve explicitly proves that base-load supply relies almost entirely on energy imported through the external grid, highlighting the urgency of structural interventions.
4.2. Scenario 1—Consumption Flexibility
To assess the impact of demand management without physical storage, a scenario was simulated in which 30% of the daily load is flexible, testing consumption advancement and delay over 3, 6, and 9 h windows. The results showed complete stagnation of performance indicators in all sub-scenarios, with residual variations on the order of thousandths. This result confirms that, when the Self-Consumption Rate is already at the physical limit of 99.98%, there are no solar surpluses available to be used by shifted loads. The heavy reliance on the external grid on Culatra Island does not result from inadequate consumption habits, but from a structural generation-capacity deficit.
The 30% share of flexible load—typically associated with deferrable appliances and water heating—was shifted by the simulator to the period of greatest solar exposure. However, because the original physical infrastructure no longer produced enough energy even to cover the daytime base load, the logical engine merely changed the timing of imports from the public grid. This demonstrates that the effectiveness of behavioral policies is strictly conditioned by the existence of surplus primary capacity. These findings are in line with existing literature, such as the work of Weckesser et al. [
17], which concludes that the optimal sizing of photovoltaic and battery storage infrastructure is a significantly more deterministic factor than demand-side management in communities facing generation deficits.
4.3. Scenario 2—Photovoltaic Expansion
There is a project for the island to install additional 200 kWp of solar panels. The addition of 200 kWp of photovoltaic capacity to the existing aggregate was simulated (raising the total to 300.72 kWp). To model this expansion without losing the real-world meteorological variability captured in the baseline data, a proportional scaling factor of 2.99 was applied to the historical generation time series. This multiplier was derived directly from the mathematical ratio between the new target capacity and the original installed capacity (300.72 kWp/100.72 kWp).
This reinforcement increased total production to 379,360.70 kWh and raised SS from 12.51% to 32.11%. However, for the first time, SC decreased from 99.98% to 85.80%, due to an accumulated surplus of 53,880.38 kWh of solar energy that was not absorbed by the community during summer generation peaks. This mismatch between daytime solar supply and nighttime demand shows that isolated photovoltaic expansion is insufficient without a storage mechanism.
Photovoltaic expansion amplified midday injection at a rate far above the instantaneous absorption capacity of the dwellings. The approximately 54 MWh of curtailed energy represents not only a lost economic opportunity but also a technical stability challenge, since uncontrolled injections into the grid can cause localized overvoltage problems. It therefore becomes imperative to couple load-leveling tools to manage this new volume of decentralized production.
4.4. Scenario 3—Flexibility with Reinforced Generation
The consumption-flexibility analysis was repeated for the photovoltaic expansion scenario (+200 kWp), systematically testing sub-scenarios with advancement and delay of flexible consumption in 3, 6, and 9 h windows.
Table 3 presents the synthesis of these simulations, evaluating the direct impact of each time-shift strategy on the energy volumes and the evolution of the Self-Consumption (SC) and Self-Sufficiency (SS) rates.
This broad sweep showed that delaying the load worsened grid dependence, while the optimal sub-scenario corresponded to advancing the flexible load by 6 h. This movement shifted the nighttime consumption peak directly into the period of greatest solar generation. The adjustment improved SC to 87.83% and SS to 32.87%, confirming that consumption flexibility has a relevant technical impact only when surplus generation capacity exists in the grid.
The bidirectional exploration of these different time windows showed that the organic synchronization forced by this 6 h advancement is the most effective mitigator before the introduction of physical batteries. By mapping flexible late-afternoon consumption onto the solar zenith, the community retained a larger share of local production and mitigated the wasted surpluses observed in Scenario 2. Nevertheless, the fact that Self-Sufficiency does not exceed the 33% threshold confirms that the elasticity of human behavior has a natural ceiling of effectiveness.
4.5. Scenario 4—Expanded Photovoltaic Expansion
To test the physical limits of the infrastructure, a theoretical test scenario with a more aggressive expansion was simulated: the addition of 400 kWp of photovoltaic capacity (totaling 500.72 kWp). Applying the proportional expansion factor (4.97), massive generation increased total production to 630,576.15 kWh. This volume raised the Self-Sufficiency Rate (SS) to 38.54%. However, due to severe oversizing of generation relative to the community’s instantaneous absorption capacity during daytime hours, the Self-Consumption Rate (SC) fell to 61.96%. The system rejected a massive surplus of 239,883.01 kWh of energy to the external grid, clearly demonstrating that excessive panel deployment, without supporting mechanisms, results in severe structural inefficiency.
The scale of this waste (almost 240 MWh annually) reflects a severe generation-to-demand mismatch. This exploratory analysis fulfills its scientific purpose by showing that aggressive and unilateral scaling of the primary energy source does not translate into a proportional gain in energy independence, quickly pushing the system into a regime of strongly diminishing returns.
4.6. Storage System Sizing
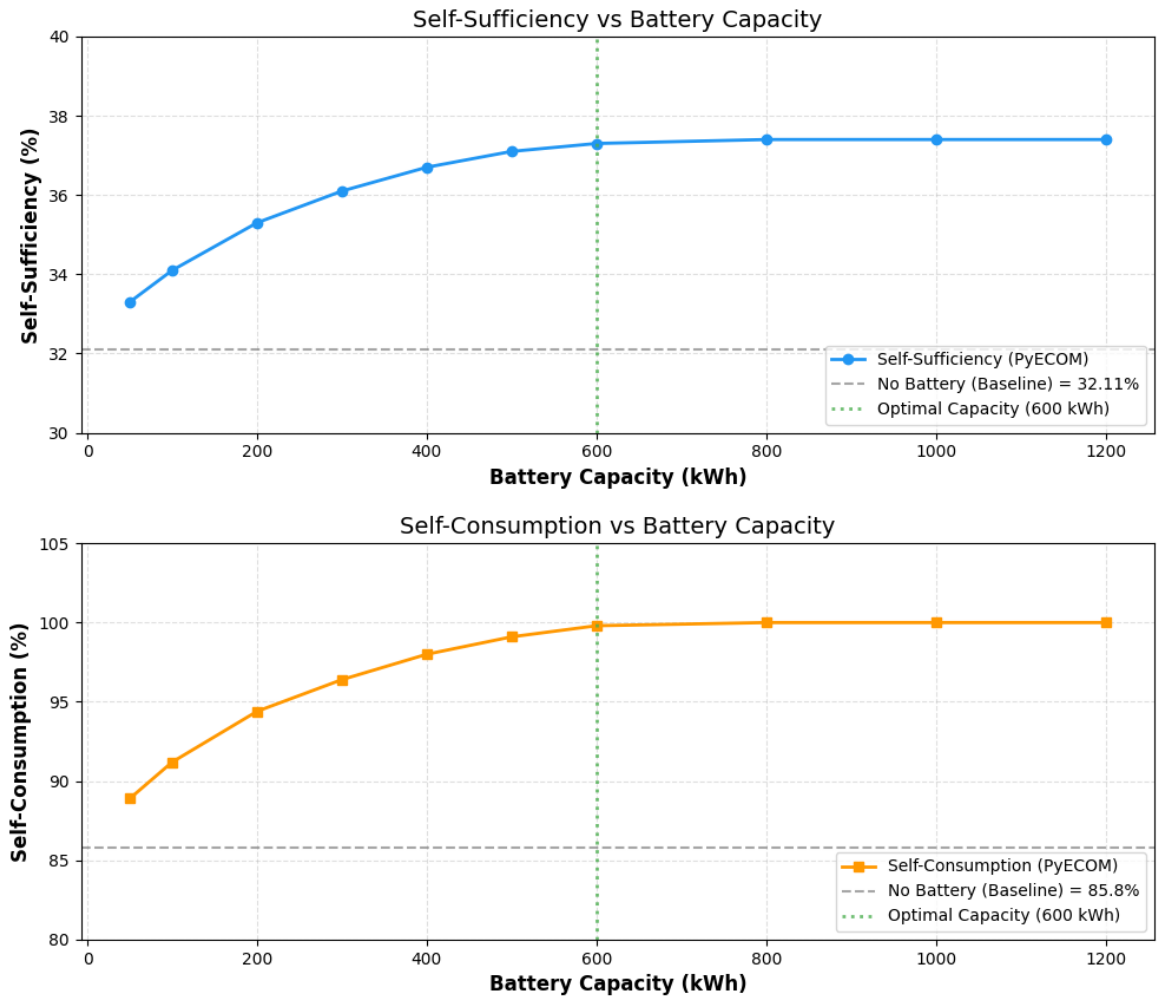
To mitigate the large mismatches identified in the expansion scenarios, an iterative parametric analysis of the community’s daily physical balance was carried out, testing battery capacities between 50 kWh and 1200 kWh.
As shown in
Figure 6, the results demonstrated that, for the realistic expansion scenario (+200 kWp), the Self-Consumption Rate (SC) increases sharply until stabilizing at an optimal capacity of 600 kWh. This battery brings SC to 99.80% and SS to 37.30%, reducing waste almost to zero.
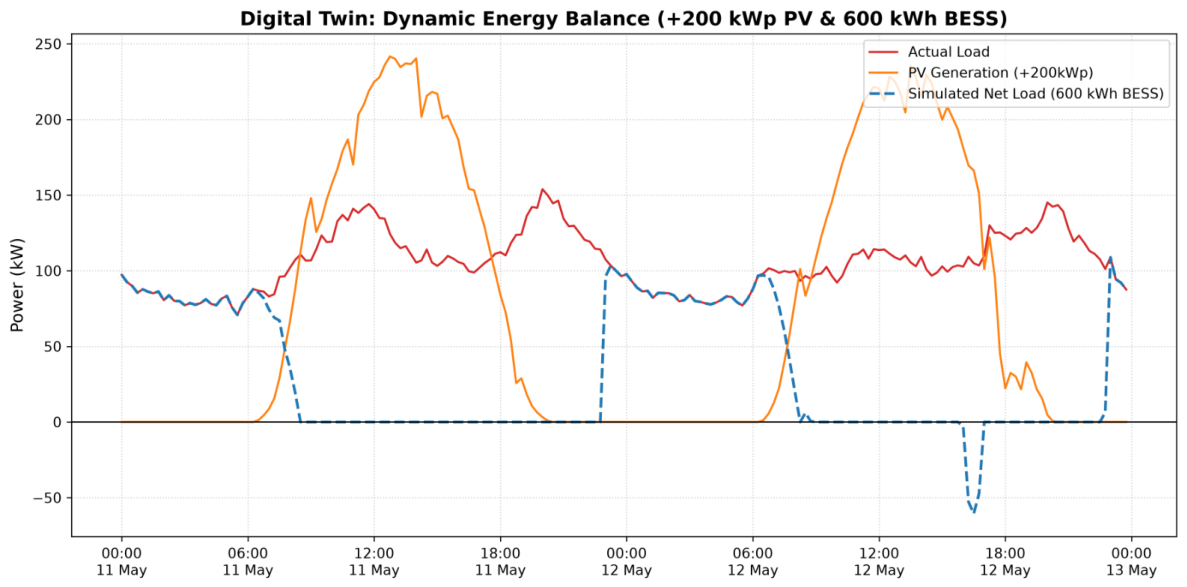
To visually demonstrate the operational impact of this optimal configuration,
Figure 7 illustrates the dynamic energy balance for the +200 kWp PV and 600 kWh BESS scenario during a standard spring period (11–12 May). The profile explicitly shows how the storage system effectively absorbs the midday solar surpluses—flattening the net load to zero during the day—and discharges that stored energy to mitigate the evening residential consumption peak. Notably, on the second day, once the storage capacity is fully reached, the residual surplus is exported to the external grid (represented by the negative net load). This dynamic shifting of the load curve provides a clear graphical representation of the mechanism that restores the community grid’s equilibrium and maximizes local energy retention.
However, when this parametric analysis was crossed with the test scenario (+400 kWp), a paradigm shift was observed. The 600 kWh battery would saturate rapidly, retaining only 85.70% of the generated energy. To support a scenario of this magnitude, storage would need to scale to 1200 kWh, a capacity at which the community grid reaches its maximum of 60.10% Self-Sufficiency and 96.60% Self-Consumption. These results show that aggressive renewable-generation expansion requires a colossal and non-linear investment in storage.
Table 4 presents the synthesis of global performance for each simulated scenario. To address the theoretical assumption of ideal battery operation and quantify the impact of real-world thermodynamic losses, a sensitivity analysis on Round-Trip Efficiency (RTE) was conducted for the optimal 600 kWh BESS configuration. Standard lithium-ion utility-scale batteries typically exhibit an RTE of approximately 90%. Incorporating a 10% efficiency loss during the charging cycles marginally reduces the usable capacity delivered back to the community grid. Under these non-ideal operational conditions, the simulation confirms that the Self-Sufficiency (SS) rate experiences a slight decrease from 37.30% to 36.9%. Concurrently, the Self-Consumption (SC) rate slightly drops from 99.80% to 98.5%. Because the performance indicators explicitly plateau at this capacity, this sensitivity analysis confirms that the structural sizing of 600 kWh remains the optimal and robust threshold for this community’s energy transition, even when accounting for thermodynamic degradation.
4.7. Forecasting Scenario
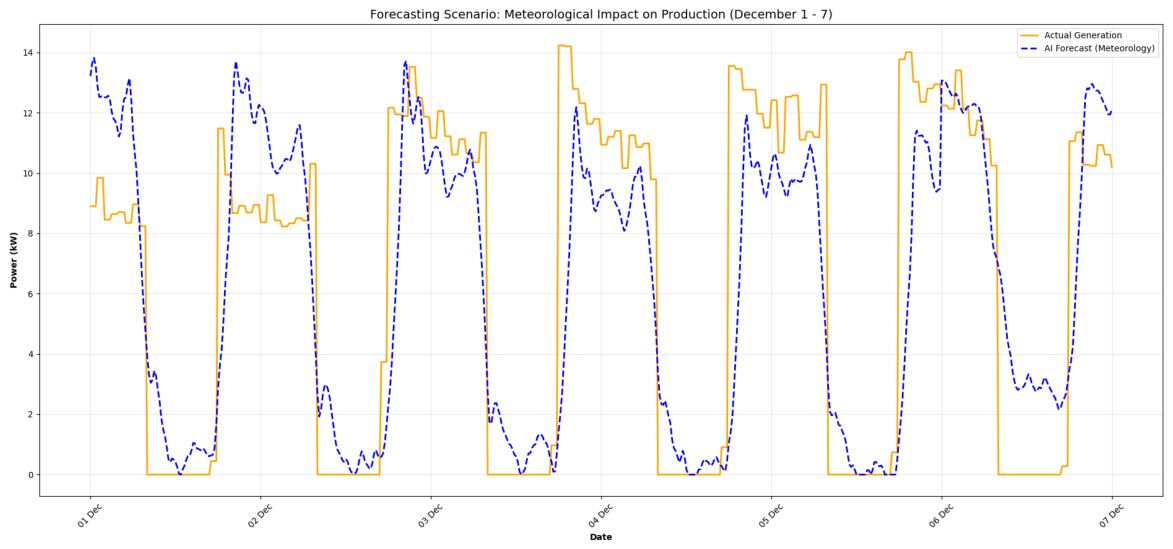
The predictive-performance assessment over this extended two-month window revealed a Mean Absolute Error (MAE) of only 2.29 kW and a Coefficient of Determination () of 64.48%. Although the literature frequently reports values exceeding 80% for photovoltaic forecasting, such results are typically associated with clear-sky conditions or hourly aggregated data. The 64.48% obtained in this study reflects the strict 15 min resolution and the severe meteorological instability that characterized the November and December testing period.
The Mean Absolute Percentage Error (MAPE) was 28.25%. The technical analysis of these metrics confirms the robustness of the model operating at the real scale of the community grid. The MAE of 2.29 kW shows a minimal physical deviation between the forecast and actual generation, offering high reliability for daily planning. When calculating the MAPE, instances where the actual generation was below 1 kW were intentionally excluded. For a community grid of this specific scale, generation values under this threshold typically represent twilight transitions, heavy shading anomalies, or baseline inverter noise. Retaining these near-zero denominators would mathematically distort the metric with very high percentage errors that hold no practical relevance for the Energy Management System’s operational dispatch or battery scheduling algorithms. This explicit filtering procedure follows standard practices in photovoltaic forecasting, stabilizing the error at a realistic 28.25% despite the challenging winter conditions.
To rigorously evaluate the predictive performance, the N-HiTS model was benchmarked against a Historical Seasonal Mean baseline. The predictive-performance assessment during diurnal generation periods (defined as actual generation ≥ 1 kW) revealed that the baseline yielded a significantly higher MAE of 4.60 kW and a Root Mean Square Error (RMSE) of 5.64 kW. In contrast, the N-HiTS model demonstrated superior stability, achieving an MAE of 2.29 kW and an RMSE of 3.44 kW. Unlike naive mean models that merely project average historical curves and fail during abrupt weather shifts, the N-HiTS architecture explicitly integrates exogenous meteorological data, achieving superior predictive performance, thereby contributing to optimize the Energy Management System’s battery scheduling algorithms.
The crucial aspect lies in the algorithm’s demonstrated ability to generalize the curve and anticipate abrupt declines caused by cloud cover. This validation shows that the Digital Twin goes beyond mere monitoring, functioning as a predictive tool capable of anticipating battery dispatch or flexibility policies before generation deficits occur. This behavior is graphically illustrated in
Figure 8.
4.8. Model Validation and Statistical Rigor
To ensure the robustness of the Digital Twin framework, a two-tiered validation approach was implemented to assess both the physical energy balance and the predictive accuracy.
First, the baseline simulation’s physical validity was verified by cross-referencing the aggregated community load with official national benchmarks. Throughout the ten-month simulation, the 338 permanent dwellings consumed a total of 1,013,739.77 kWh. This equates to an average monthly consumption of approximately 300 kWh per household. This value is strictly consistent with the official averages reported by the Portuguese Energy Services Regulatory Authority (ERSE) for residential dwellings operating in an all-electric paradigm without natural gas infrastructure. This alignment provides a robust empirical validation of the initial demographic filtering phase, confirming that the isolated 338 profiles accurately represent real-world continuous habitation rather than distorted seasonal tourism behavior.
Second, to enhance the statistical rigor of the forecasting module and provide actionable boundaries for the community grid, empirical prediction intervals were established. Assuming a normal distribution of the forecasting errors, the 90% prediction interval was mathematically derived from the out-of-sample Root Mean Square Error (RMSE = 3.44 kW). This yields a statistical confidence boundary of approximately ± 5.66 kW around the deterministic N-HiTS forecast. Establishing this interval is crucial for robust operational planning, as it quantifies the uncertainty of the meteorological inputs. It allows the Energy Management System to operate safely within known probabilistic limits and schedule battery dispatch policies that account for worst-case generation scenarios, bypassing the need for visual interval shading in the high-resolution generation plots.
5. Discussion
The energy transition of isolated community grids, such as Culatra Island, into fully operational Renewable Energy Communities (RECs) requires planning tools that go beyond static sizing. The development of this simulation framework demonstrated that scenario-based modelling fed by high-granularity real smart-metering data is essential to avoid inefficient investments and diagnose structural vulnerabilities [
9,
17]. The Baseline Scenario established a clear premise: an almost perfect Self-Consumption Rate (99.98%) does not indicate success when Self-Sufficiency is limited to 12.51%, masking critical dependence on mainland infrastructure, a decoupling between SC and SS previously identified as characteristic of generation-constrained communities [
10,
17].
The scenario evaluation revealed dynamics that challenge conventional community grid planning assumptions. Load flexibility alone proved inefficient in chronically deficit grids; only when coupled with photovoltaic expansion (+200 kWp) did demand synchronization improve local energy retention. However, the stagnation at 33% confirms that demand-side flexibility operates within well-documented physical and behavioural constraints [
18], serving as a secondary optimizer that cannot replace physical storage infrastructure. This is consistent with Albouys-Perrois et al. [
18], who demonstrated through multi-agent simulation that storage and energy exchanges have a substantially greater impact on collective self-consumption than behavioural adjustments alone.
The isolated PV expansion tests (+200 kWp and +400 kWp) illustrated the consequences of unilateral oversizing. The abrupt SC decline and 240 MWh of curtailed surpluses show that PV capacity misaligned with the nighttime base-load curve creates not only economic inefficiency but also voltage stability concerns on the distribution grid [
17]. Furthermore, because our transient analysis relies primarily on aggregated community profiles, it intrinsically masks localized power quality dynamics. In physical implementations, the abrupt injection of uncontrolled PV surpluses can lead to severe localized overvoltage at specific low-voltage network nodes. Conversely, rapid meteorological shifts, such as sudden cloud cover, introduce steep generation ramp rates that can cause voltage fluctuations and flickering. Acknowledging these high-frequency transient instabilities reinforces the critical need for our proposed framework: coupling fast-responding BESS with proactive AI-based forecasting is strictly necessary not only for energy balancing, but also to physically smooth the injection curve and maintain grid stability. Weckesser et al. [
17] demonstrated that grid loading can be reduced by up to 58% with appropriate configurations, but that uncoordinated PV oversizing without storage exacerbates rather than alleviates grid impact.
The BESS parametric analysis confirmed that communal storage investment follows non-linear diminishing returns. The inflection point at 600 kWh indicates that optimal REC sizing requires a careful balance between generation capacity and the ability to intercept the summer daytime surplus. Forcing expansions requiring 1200 kWh batteries would lead to high winter idle capacity, a seasonal asymmetry consistently reported in the literature [
17,
19].
The resulting self-sufficiency of 37.30% under the Final Scenario (300.72 kWp PV + 600 kWh BESS) closely aligns with the 37.8% theoretical ceiling identified by Weckesser et al. [
17] for communities without storage but with high prosumer ratios, reinforcing the conclusion that PV capacity, rather than storage alone, is the primary driver of self-sufficiency in generation-constrained communities. Guo et al. [
19] corroborate this interpretation: their optimised centralised BESS with P2P sharing achieved a 16.34% annual cost reduction, with BESS models proving most cost-effective in Spring and Summer, the same seasons where Culatra reaches near-100% self-consumption, yet struggles with self-sufficiency during winter.
Finally, the N-HiTS forecasting model demonstrates that the framework possesses the predictive capabilities required for proactive operation. By accurately anticipating sudden generation drops caused by meteorological shifts, it provides the essential physical baseline for future intelligent algorithms to optimize battery dispatch before operational deficits occur.
6. Conclusions
The most critical finding of this study is that the severe structural energy deficit of the Culatra Island community grid (initially operating at only 12.51% Self-Sufficiency) cannot be resolved through demand-side flexibility or generation capacity alone. Achieving an optimal infrastructural balance requires pairing a +200 kWp photovoltaic expansion with a 600 kWh Battery Energy Storage System (BESS). This specific configuration effectively captures the massive daytime surpluses (retaining near 100% Self-Consumption) while preventing the severe diminishing returns and winter idle capacity observed in oversized tests (e.g., +400 kWp PV and 1200 kWh batteries).
However, it is essential to set realistic expectations regarding the energy autonomy of isolated coastal communities. Even at this optimal structural threshold, the maximum achievable Self-Sufficiency rate plateaus at approximately 37% (when accounting for realistic thermodynamic battery losses). This explicitly demonstrates that while the community can maximize its local resources, it will maintain a significant and unavoidable dependence on the external mainland grid to sustain continuous baseloads and winter evening peaks.
The results obtained provide broader insights that extend beyond the specific community analysed. First, the findings demonstrate that SC and SS should not be interpreted as equivalent indicators of energy-community performance. The baseline scenario achieved an almost perfect SC Rate while remaining highly dependent on external electricity imports, highlighting the importance of evaluating multiple performance indicators simultaneously. Second, this study validates that the planning of isolated community grids cannot be carried out using static sizing methods.
To address these dynamics, this work presented a Digital Twin-inspired simulation framework using the PyECOM engine. The major advantage is the combination of high-resolution stochastic physical simulation with an Artificial Intelligence-based predictive model (N-HiTS). Demonstrating a very low error (MAE of 2.29 kW), the forecasting model accurately anticipates the solar generation curve. This proves the potential of predictive analytics to support proactive energy management, enabling future algorithms to improve battery dispatch strategies and reduce renewable curtailment before generation deficits occur.
Some limitations should be considered when interpreting the results. The demographic filtering methodology used to identify permanent residents represents a statistical approximation based on consumption behaviour rather than a direct demographic classification. Furthermore, the current implementation operates in an open-loop configuration without real-time synchronization or autonomous control. Finally, concrete future work will focus on the economic dimension of the transition. We propose developing an advanced economic optimization module to jointly determine the optimal PV and battery sizing configurations by explicitly minimizing the Levelized Cost of Energy (LCOE), ensuring that future Renewable Energy Community investments are both physically robust and financially sustainable.




 ,
,