1. Introduction
In fruit production, the maturity classification of fruit is a critical stage, because it determines its commercial value, consumer acceptance, storage logistics, postharvest shelf life, and reduces losses due to spoilage [
1,
2]. Traditionally, quality fruit inspection has been performed through human visual assessment, based on external indicators such as size, shape, and, most importantly, color. However, this conventional method has significant limitations: it is subjective, tedious, slow, error-prone, and costly, leading to inconsistencies in product standardization and making it inadequate for large-scale supply chain demands [
2,
3,
4].
Automated ripeness categorization using computer vision systems is proposed as an alternative to precision agriculture. This method involves non-destructive capture of digital images of the fruit, followed by feature extraction, classification, and analysis using machine learning algorithms, thereby transforming physical inspection into a data-driven process. It also enables real-time evaluations, eliminates observer bias, and ensures standardized quality [
2,
3,
5].
Among the classification techniques used in these systems are deep learning methods with Convolutional Neural Networks (CNNs), such as ResNet, VGG, YOLO, and MobileNet, which dominate the state of the art for their ability to automatically learn complex representations from visual data and deliver outstanding performance [
3,
4]. However, these architectures have practical limitations: their training requires massive, labeled datasets and high-end computational resources, such as high-capacity GPUs [
5,
6].
In contrast, Machine Learning (ML) includes techniques such as Support Vector Machines (SVMs), K-Nearest Neighbors (KNNs), and Multi-Layer Perceptron (MLP), which represent a “simplified” learning approach because they rely on manually extracted image features. Rizzo et al. [
2] and Wang et al. [
7] explain that while deep learning operates on raw data, manual features allow for the construction of a description of the fruit based on representative and diverse attributes, making it possible to evaluate which specific combination of descriptors provides the best physical accuracy. These methods achieve competitive performance while using a fraction of the resources and run smoothly on low-cost devices [
6,
8,
9].
Handcrafted features are chosen for their biological interpretability; for example, the
,
, and
components of CIE
directly quantify chlorophyll degradation and carotenoid biosynthesis in the pericarp [
10,
11]. Similarly, the Hue (
H) channel in HSV models the dominant hue by decoupling illumination effects [
12].
The Gray-Level Co-occurrence Matrix (GLCM) and Local Binary Patterns (LBPs) texture descriptors measure physical skin changes such as roughness and wrinkling [
13,
14]. In mango analysis, combining texture with color data helps track the visual development of lenticels (cuticular pores) throughout ripening [
15].
Despite these advances, most research on mangoes (Mangifera indica L., cv. Ataulfo) relies on destructive methods or on expensive sensors, such as Raman or hyperspectral spectrometers.
The primary objective of this paper is to propose a low-cost, highly efficient ripeness classification system for Ataulfo mango images. Although the state-of-the-art literature strongly favors deep convolutional neural networks for agricultural computer vision, we hypothesize that carefully selected vector descriptors based on color and texture features, combined with an optimized traditional machine learning technique, are sufficient to model the maturation process while reducing computational cost during training and inference. The major contributions are as follows:
A new dataset of 10,400 RGB images of mangoes (Mangifera indica L., cv. Ataulfo) captured in a controlled environment and classified into four ripeness stages: green-ripe, partially ripe, firm-ripe, and soft-ripe.
A low-dimensional descriptor with 33 features: 23 for color, 5 for GLM texture, and 5 for LBPriu2 microtexture, used to effectively encode Ataulfo mango ripeness in images.
An enhanced MLP for Ataulfo mango ripeness image classification that greatly reduces training and inference costs while maintaining performance comparable to lightweight deep learning models.
Related Work
Various studies report applications of artificial intelligence (AI) for the automatic classification of fruits [
4,
16,
17,
18,
19]. For example, Alfatni et al. [
20] proposed a system to classify oil palm bunches by biological variety and degree of ripeness with 270 images per class under controlled lighting conditions. They converted images from the RGB color model to HSI, segmented them using the MEXR color index combined with morphological operations, and extracted chromatic, structural, and textural features using GLCM, BGLAM, and Gabor wavelets. After evaluating KNN, SVM, and MLP algorithms, the MLP with BGLAM feature fusion achieved 93% accuracy and inference times of 0.40–0.44 s per image. Similarly, Munera et al. [
21] used a dataset of 257 pomegranates (139 healthy and 118 infected) and segmented them using Otsu to separate the fruit from the background. They extracted grayscale histograms and 43 GLCM-derived textural descriptors, which were then classified by the Random Forest algorithm. The system achieved 97% accuracy, 5% higher than manual inspection. Furthermore, Irhebhude et al. [
22] developed a system to categorize the maturity of mangoes and oranges based on 477 photographs. They removed the background with the Graph-cut method and computed color histograms and 14 Haralick texture descriptors, which were then optimized using Locality-Preserving Projection (LoPP). They used decision trees and SVMs to discover that texture features are more effective than color features, reaching accuracy rates of 93.5% for mangoes and 92.2% for oranges. Similar manually extracted color, texture and shape descriptors have also been used alongside classical classifiers for tasks related to fruit quality, disease, variety and maturity [
14,
23,
24,
25,
26].
Object detection and instance segmentation have also been employed to identify fruits within complex agricultural scenes [
27,
28,
29]. Classical thresholding and color-space analysis are low-cost pre-processing strategies that can be used for fruit segmentation and ripeness or quality assessment [
30,
31,
32,
33,
34].
In addition to classical approaches that manually extract features, some studies integrate hybrid strategies that incorporate deep learning [
35,
36]. For example, Said and Joshi [
37] studied natural and artificially induced ripening in mangoes and apples using up to 150,000 thermal and spectral images from public datasets. They segmented regions of interest using prominence maps and the YCbCr color space, and extracted features with LSTM and GRU architectures. They implemented the hybrid CXGBN model, which achieved 95.85% accuracy and an inference time of 108.93 ms per image, outperforming VGG16, MLP, and decision trees. Similarly, M. Knott et al. [
6] evaluated pre-trained Vision Transformers (ViTs) for fruit quality on the Fayoum Banana dataset with 273 images and the CASC IFW dataset with 5,858 images of apples. Features extracted with the DINO ViT-S and ViT-B models were classified with KNN, logistic regression, SVM, Random Forest, XGBoost, and MLP, and compared with pretrained CNNs. The best results were 95.0% accuracy for apples with ViT-B/8 and SVM, and 94.1% for bananas with ViT-S/8 and XGBoost, both requiring three times fewer samples than CNNs.
Research on mango fruit image analysis has explored various strategies for data acquisition, feature extraction, and classification [
9,
38,
39]. For example, Sikder et al. [
40] constructed a dataset of 975 images of Himsagor mangoes in three states: unripe, ripe, and overripe. During image preprocessing, they set the image backgrounds to white, converted the images from RGB to HSV, and expanded the dataset to 3900 images. When they evaluated classical models (GNB, SVM, Gradient Boosting, Random Forest, KNN), a proprietary sequential CNN, and VGG16, they found that Gradient Boosting trained on features extracted by the CNN achieved the highest accuracy, at 96.28%. Similarly, Ratha et al. [
8] analyzed 1853 images of 15 mango varieties. They segmented the fruit against white backgrounds using Sobel edge filters and extracted a descriptor of 1000 features with MobileNet-v2. Subsequently, the descriptors were classified using Cubic SVM, KNN, Naïve Bayes, and Decision Trees. The best performance was achieved by Cubic SVM, with 99.5% validation accuracy. In a complementary study, Al Riza et al. [
15] predicted the ripeness level of the Sein Ta Lone mango using 308 images of 77 samples. They calculated 26 color and texture features and applied Partial Least Squares Regression (PLSR). The method achieved an
of 0.97 and an RMSE of 0.49 for predicting soluble solids (Brix), and an
of 0.99 and an RMSE of 0.05 for predicting pH.
In the specific case of the Ataulfo mango variety, Vargas Cano et al. [
41] analyzed a dataset of 72 fruits to categorize maturity indices using an AS7262 physical sensor. They obtained six spectral features from the wavelengths and evaluated Partial Least Squares (PLS), Classification Trees (CART), and Random Forest models, with the CART model proving the most accurate at 90% accuracy. Loera-Alvarado et al. [
42] processed 300 images of 30 ripe fruits to non-destructively estimate area and volume on an Android mobile app. The authors segmented the fruit by applying a median filter followed by local minimum binarization. They determined that the red channel (RC) achieved the highest accuracy for area estimation, with the lowest relative error (2.19%), while for volume, they achieved an
of 0.93 and a relative error of 4.73%. Finally, Martínez-Hernández et al. [
12] conducted photographic monitoring of mangoes over 21 days of storage to predict their ripeness level using chemical kinetics models. They employed the OpenCV and Python libraries, converted the images from BGR to HSV space to correctly segment the fruit, and extracted features from the Hue (H) channel, evaluating five kinetic models, of which the first-order fractional conversion model provided the best fit with an
= 0.93 and an MSE = 2.11.
Based on this review, it is evident that automatic fruit classification has advanced through the use of segmentation techniques, visual feature extractors, and machine learning or deep learning models. However, there remains an opportunity to develop methods specific to the Ataulfo mango that do not rely exclusively on specialized sensors or computationally expensive deep neural networks. In particular, it is relevant to explore approaches based on manually derived color and texture features that capture the visual changes associated with fruit ripeness while also facilitating their implementation on resource-constrained devices.
2. Materials and Methods
The experiments were conducted on a Linux system with an x86_64 architecture, an i7-13650HX CPU running at 2.60 GHz (Intel Corporation, Santa Clara, CA, USA), 16 GB of RAM, and a GeForce RTX 4060 Laptop GPU with 8 GB of VRAM (NVIDIA Corporation, Santa Clara, CA, USA). The model was implemented in Python 3.12.3 (Python Software Foundation, Wilmington, DE, USA) using TensorFlow 2.20.0 (Google LLC, Mountain View, CA, USA), NumPy, Pandas, and Scikit-learn (NumFOCUS, Austin, TX, USA). MLP training does not require hardware acceleration, reinforcing the computational feasibility of the proposed approach.
2.1. Ataulfo Mango Dataset
The proposed dataset was collected in 2024 and 2025 at different times during the Ataulfo mango season, under the same harvest conditions and in the same region. Mangoes were grown in the Costa Grande region of Guerrero, Mexico, and purchased from local suppliers, though the exact municipality of origin was unknown. The first set of mangoes was collected in August 2024. At that time, only fruits at stages III (firm-ripe) and IV (soft-ripe) were available, as the earlier stages of ripeness were not yet present. The second set of mangoes was picked up in February 2025, at the start of the new Ataulfo mango season. In this case, we obtained images of the four ripeness stages: green-ripe, partially ripe, firm-ripe, and soft-ripe.
Table 1 summarizes the number of images by class and by year of capture.
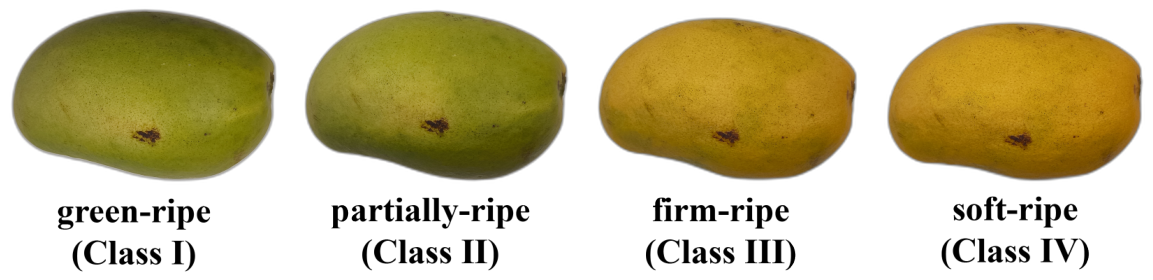
All images were captured with the same device under controlled environmental conditions: consistent LED lighting, a uniform background, and a fixed distance between the camera and the object. These conditions ensured a consistent visual appearance in the images and enabled their integration into a single dataset. In total, 10,400 Ataulfo mango images were collected and distributed among the four maturity classes, see
Figure 1. The labels represent visual categories associated with the post-harvest stage and the external color changes observed. No physicochemical measurements or destructive tests were used to assign the classes.
The images were captured every three days to document the natural progression of color change during fruit ripening. This interval was determined from experimental observations and direct consultations with local merchants, and it was corroborated by Martínez-Hernández et al. [
12], who document similar intervals for the kinetic modeling of color in mangoes. Unlike the seven-round scheme used by Hernández et al., this study used four rounds because the fruits showed advanced deterioration and severe surface blemishes after the fifth round.
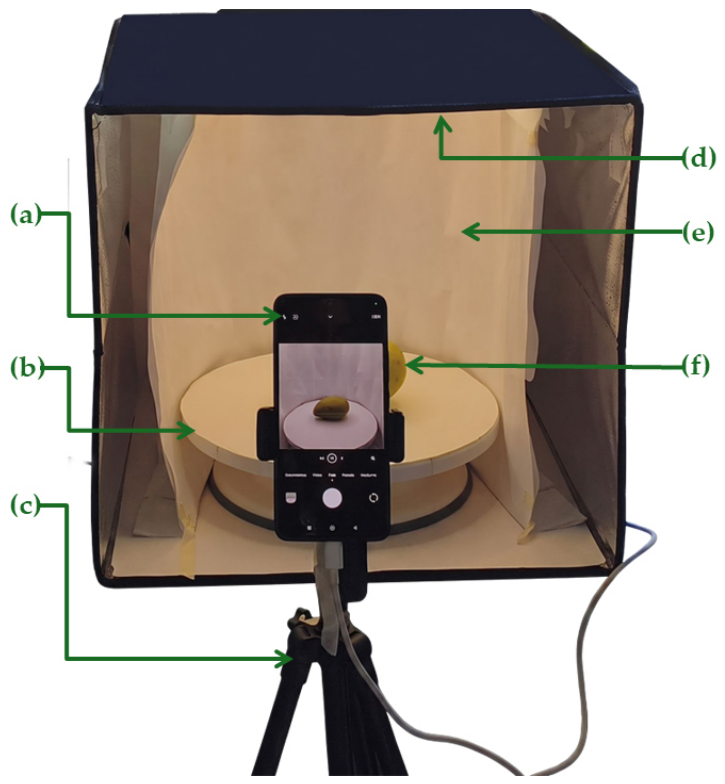
We photographed each mango from 20 viewpoints: two in orthographic orientation (one per main side) and 18 in perspective orientation, evenly spaced every 40 degrees around a 360-degree rotation, while maintaining a 1:1 image aspect ratio. A generic commercial turntable was used to capture images and ensure angular repeatability, as shown in
Figure 2. We used a 64 MP mobile device (Poco X6 Pro, Xiaomi Corporation, Beijing, China) to capture the images.
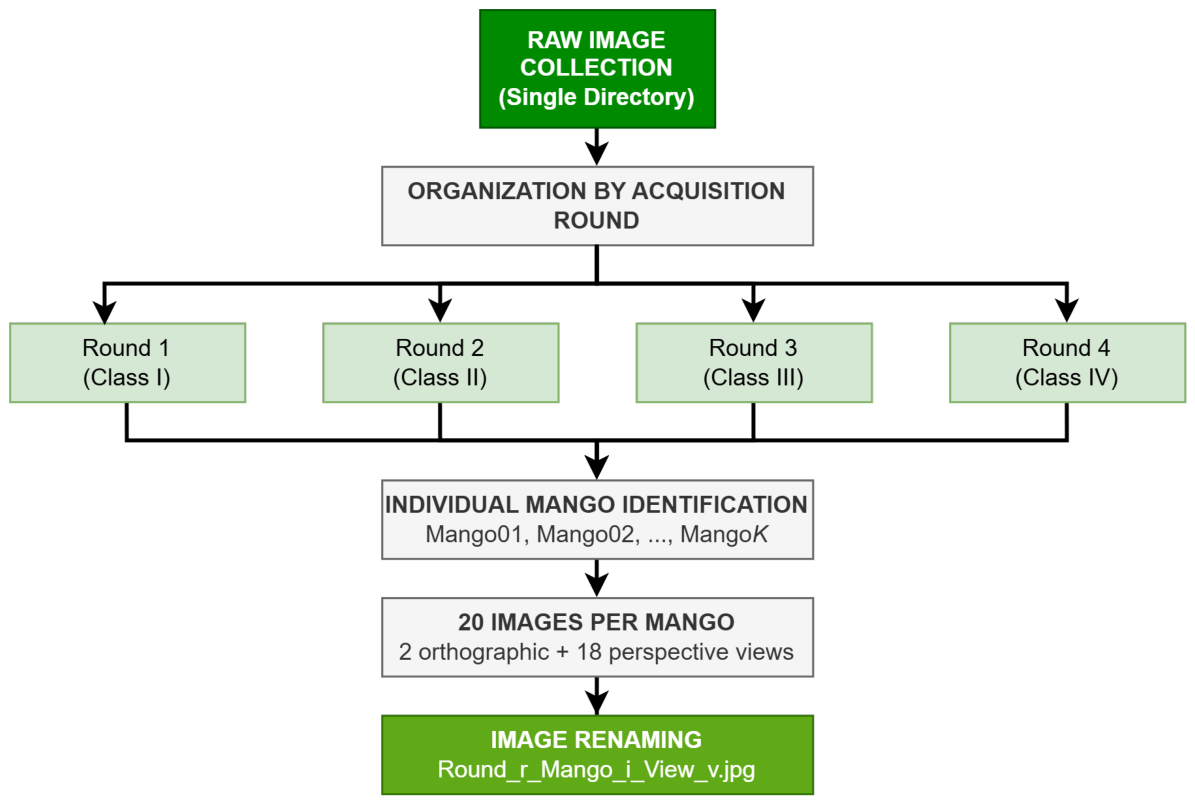
The dataset is organized in a hierarchical structure by across four capture rounds. Within each round folder, the images of each mango are named using the scheme
Round_r_Mango_i_View_v, where
r indicates the capture round,
i the fruit identifier, and
v the corresponding view of the mango (
Figure 3). For example, the file
Round_02_Mango_15_View_18 belongs to view 18 of mango 15 captured in the second round.
2.2. Data Partitioning by Fruit and Data Leakage Prevention
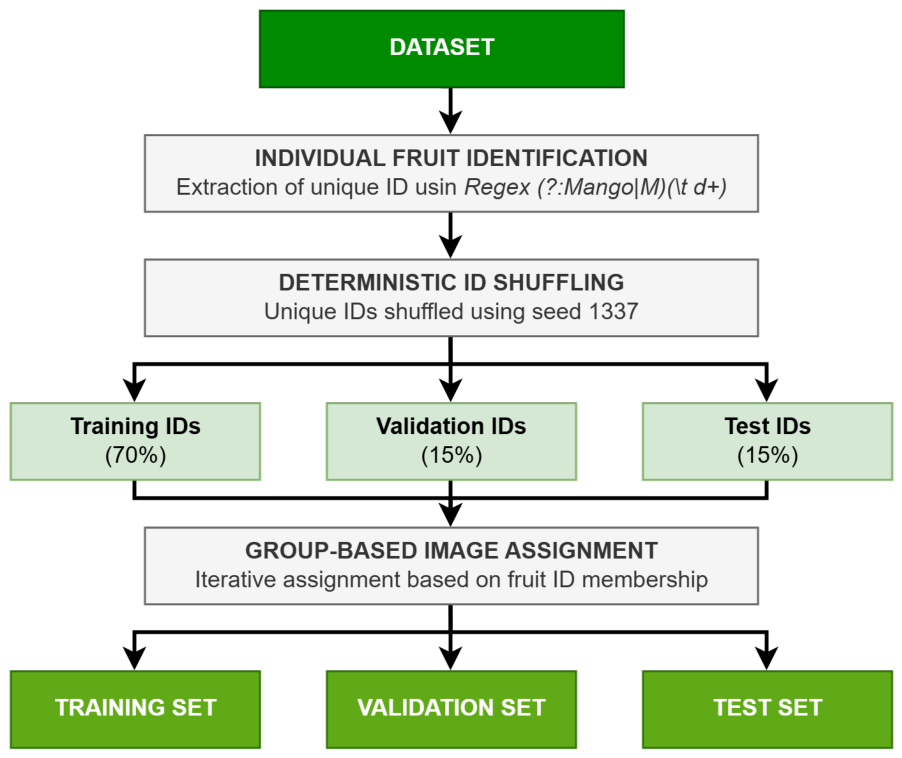
Figure 4 illustrates the methodological workflow implemented to separate the datasets and prevent information leakage. The process is based on organized, renamed data collection. In the first processing block, a regular expression (
Regex) algorithm analyzes the file names to identify and extract the unique identifier for each mango. Next, an identifier matrix is constructed, shuffled with a seed (1337), and split into three proportional subsets: 70% for training, 15% for validation, and 15% for test. During the image assignment stage, each image is checked to determine which subset its parent identifier belongs to, and then it is assigned to that partition. This splitting strategy guarantees that the model does not evaluate different perspectives of the same fruit during validation or testing if it has already seen that fruit during training.
2.3. Ground Truth Segmentation Creation
To validate segmentation quality, we used binary masks generated using the open-source Rembg library (Daniel Gatis) [
43] as the Ground Truth. Rembg automatically separates the main object from the background in RGB images using a pretrained neural network. All masks were manually verified by a person. These generated masks were used only to compare the results of the thresholding techniques and to compute quantitative metrics, such as the Intersection over Union (IoU) and Precision.
2.4. Segmentation of Ataulfo Mangoes in Images
Image segmentation is a fundamental step in fruit classification systems because it isolates the region of interest (ROI) from the background and reduces noise that could adversely affect the subsequent stages of feature extraction and classification. In this work, segmentation was applied to color images of Ataulfo mangoes captured under controlled conditions to separate the fruit region from the background while maintaining low computational cost and high segmentation accuracy. We do not apply any preprocessing methods to improve the image quality. We evaluated fixed thresholds in the HSV, HSI, and CIE color spaces.
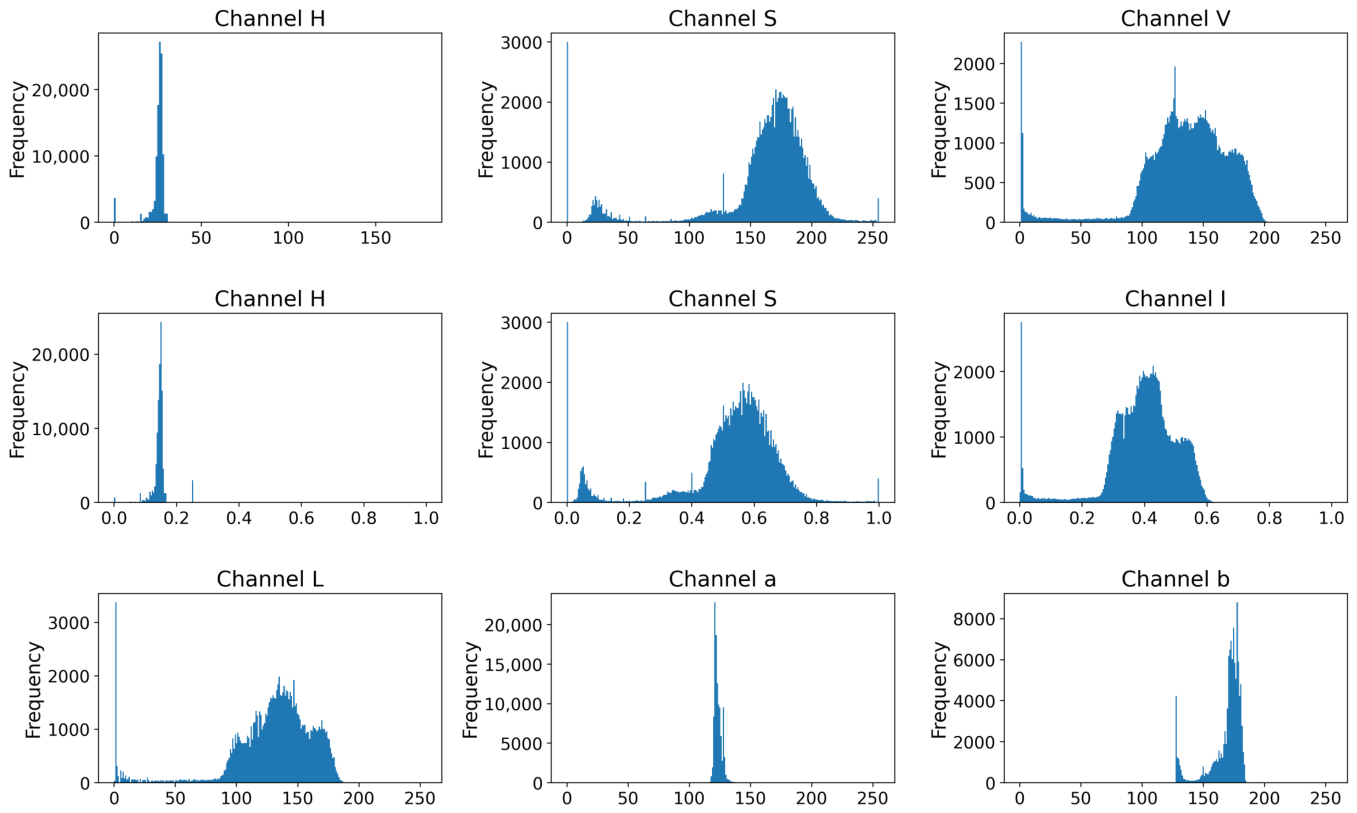
To segment mangoes in each image of our dataset, we manually define the ranges in which the object of interest is statistically distinct from the background, using state-of-the-art color spaces for fruit segmentation, such as HSV, HSI, and CIE
. We then evaluate different channel combinations and select those that produce the most distinct distributions.
Figure 5 shows the histograms for each channel of the analyzed color models: HSV (first row), HSI (second row) and CIE
(third row).
We identify ranges of pixel values (normalized to 0–255) that correspond to the yellow and green regions in mango images. The color spaces were initially calculated using their native numerical representations, and channels whose values were not expressed in the 0–255 range were rescaled to this common interval.
Table 2 lists the selected pixel ranges for each color model, all of which correspond to the values used during segmentation. In the CIE
and HSI models, only the
and S channels were used because they were most effective at separating green and yellow tones.
The segmentation process is as follows. First, we convert the RGB images to the selected color model. Then, we identify pixels within the intensity ranges to create a binary mask. Next, we refine the mask using a morphological closing operation with a elliptical kernel. This kernel type and size balances fidelity to the reference mask, contour preservation, reduced risk of oversmoothing, and computational efficiency. Finally, we multiply the resulting mask pixel-wise ( operator) with the original image to obtain the segmented mango region.
2.5. Feature Descriptors Construction from Images
The goal of feature extraction is to transform visual data from mango region images into a vector descriptor. This vector is a numerical representation of the fruit and is essential for training machine learning classification models. The process converts subjective visual properties, such as color and texture, into objective, computationally manageable data. The feature extraction workflow is structured and modular, as summarized in Algorithm 1. This design allows different types of information to be processed efficiently and consolidated into a unified representation.
| Algorithm 1: Unified extraction of color and texture features. |
 |
2.5.1. Color Descriptors
We construct feature descriptors exclusively from the fruit pixel regions, as defined by the binary masks generated during the segmentation step. Color is a key visual indicator of the characteristics of a fruit, such as its ripeness. To capture this information accurately, we analyze the mango images across three color spaces. The RGB space is suitable for quantifying the amount of “greenness” [
44] which decreases as ripening begins. The CIE
space is chosen for its perceptual uniformity, which makes metrics such as the
ratio reliable indicators of color changes associated with the ripeness of the Ataulfo mango [
45]. The HSV space is important for decoupling pure color information (Hue) from lighting effects (Value), which is important for mango image analysis because mangoes often have a waxy skin that reflects light [
40].
The first eight descriptors are derived from the RGB space. We compute the mean and standard deviation of four vegetation indices widely used in precision agriculture [
46]: Excess Green (ExG), Visible Atmospherically Resistant Index (VARI), Normalized Green–Red Difference Index (NGRDI), and Green–Red Ratio (G/R). These indices combine the R, G, and B channels to highlight information about the condition of the fruit’s skin.
Table 3 lists the formulas for these indices.
Meanwhile, for the CIE
color space, we calculate the mean and standard deviation for each of its three channels:
(lightness),
(green–red), and
(blue–yellow). The generation of ratio-based features, such as
, is a technique used to isolate and enhance chromatic variations in computer vision systems [
49]. Its inclusion is justified because channel
describes the transition from green to red, whereas channel
represents the transition toward yellow [
32]. Thus, this ratio condenses the color change of Ataulfo mango into a robust index, following a mathematical principle used in recent agricultural literature, in which the ratio of the
and
components is used to evaluate fruit tone [
50]. In this work, the descriptor is defined as follows:
A colorfulness or chroma index is also calculated for each pixel. As the mango ripens, the yellow color becomes purer. This index is defined as follows [
45]:
where
p denotes a pixel within the segmented fruit region, and
and
represent the corresponding chromatic coordinates of that pixel in the CIE
color space.
Subsequently, the mean and standard deviation of are calculated throughout the region of the fruit.
For the final set of color descriptors, the HSV space is decomposed into its components of Hue, Saturation, and Value/Brightness. The mean and standard deviation of each channel are then computed over the fruit region.
2.5.2. Texture Descriptors Using Gray-Level Co-Occurrence Matrix(GLCM)
Texture analysis using GLCM is a statistical method that quantifies spatial relationships among pixel intensities. Unlike color analysis, GLCM captures second-order texture properties, such as homogeneity, contrast, and apparent surface roughness. These features, which are not apparent in simple color analysis, can be linked to relevant attributes, such as firmness, surface damage, or specific stages of ripeness [
45].
In this work, textural features are extracted from the segmented region of the fruit (binary mask). Each segmented image is converted to grayscale, and a co-occurrence matrix is computed to derive the following metrics: contrast, correlation, energy, homogeneity, and dissimilarity.
2.5.3. Texture Descriptors Based on Local Binary Patterns (LBPRiu2)
We also use Local Binary Patterns (LBP) as a complementary descriptor to characterize the microtexture of the mango surface and to capture small imperfections that GLCM might overlook during statistical averaging. Recent comparative evidence has shown that handcrafted texture descriptors, such as LBP and GLCM, provide discriminative information for supervised image classification when paired with machine learning models [
51]. The LBP principle compares each pixel’s intensity with those of its immediate neighbors to generate a binary code that captures the local pattern. Subsequently, the final representation is analyzed using a histogram and descriptive statistics are used to summarize its distribution, consistent with the usefulness of measures such as mean, standard deviation, skewness, and kurtosis reported in OpenStax [
52].
We selected the LBPriu2 version for its rotational invariance, which is useful because the dataset was collected from multiple angles and orientations of mangoes, favoring descriptors that are more stable under perspective changes. In LBPriu2, each segmented image is converted to grayscale, the basic LBP is calculated with neighbors and , and then transformed into the riu2 variant (uniform and rotation-invariant). Using the binary codes obtained within the fruit mask, a normalized histogram is constructed to calculate statistical descriptors such as LBP_entropy, LBP_skewness, LBP_kurtosis, LBP_std, and LBP_energy.
2.5.4. Overview of the Feature Descriptor and Ablation Study Design
The final descriptor comprises 33 features, selected for their ability to capture relevant variations in the ripening of Ataulfo mangoes. All features were calculated within the fruit’s region of interest and then normalized using Min–Max scaling to the range
, ensuring numerical consistency and stability during classifier training.
Table 4 presents the complete list of features included in the final descriptor.
To quantify the individual and synergistic effects of different descriptor families on network performance, a feature ablation study was conducted. The original 33-dimensional feature vector was divided into three categories:
Color (23 features): Composed of color indices and color spaces (CIE , HSV, and vegetation indices).
GLCM Texture (5 features): Descriptors extracted from the Gray-Level Co-occurrence Matrix and averaged across four angular directions.
LBP Microtexture (5 features): Statistical moments computed from the normalized histogram of the rotation-invariant Local Binary Pattern (LBPriu2).
We evaluated four descriptor types to train the neural network architecture under the same experimental conditions: (1) using only the 23 color variables; (2) combining color descriptors with GLCM texture variables; (3) combining color descriptors with LBP descriptors; and (4) fusing all 33 features.
2.6. Classification of Mango Ripeness
The classification stage determines the maturity class of Ataulfo mangoes based on the features extracted in the previous phase. In computer vision, two main paradigms are classical Machine Learning, which relies on explicit feature extraction fed into a classifier, and Deep Learning (CNNs), which learn and classify features directly from images. Although CNNs are the dominant approach due to their ability to learn hierarchical representations from low-level features to more abstract concepts [
53], their implementation poses many challenges: they often require large volumes of data, high computational resources (GPUs) and architecture tuning that can lead to costly trial and error. Furthermore, handcrafted descriptor design opens the door to alternative approaches under data or resource constraints [
54]. Given these considerations, we propose designing a Multilayer Perceptron (MLP).
2.6.1. Hyperparameter Optimization to Identify the Optimal MLP Architecture
We defined the MLP architecture and used the Grid Search technique to select the best hyperparameters for the neural network. The purpose of this process was to analyze the impact of the model’s components to best classify the descriptors extracted from the Ataulfo mango dataset and to select the architecture with the best generalization capacity. In this stage, 3385 unique MLP configurations were assessed, examining hyperparameters such as activation functions, weight initialization schemes, optimizers, batch sizes, number of hidden layers, learning rates, regularization coefficients, normalization mechanisms, and class balancing strategies.
Table 5 summarizes the search space explored during this hyperparameter optimization, including the variables considered and the ranges of values examined. The final model configuration was the one that maximized the F1-score on the validation set. Each architecture is named using the convention
Type-xL
([−]), where
Type denotes the architecture family,
x indicates the total number of hidden layers, and
and
denote the number of neurons in the first and second (optional) hidden layers, respectively.
2.6.2. MLP Architecture Selected
The selected architecture was Wide-2L (512–256), comprising an input layer of 33 units, two fully connected (FC) layers of 512 and 256 neurons, respectively, and an output layer of 4 neurons corresponding to the maturation phases. Each FC layer is followed by a Batch Normalization (BN) layer and a Leaky ReLU activation. The output layer uses a softmax function to model the multi-class probability distribution. Neurons weights are initialized using the variance-scaling scheme. Dropout with a rate of 0.12 is applied to both hidden layers, and
regularization with a coefficient of
is applied to training weights to reduce overfitting. A summary of the MLP classifier architecture is presented in
Table 6.
In addition, the model was trained with a batch size of 128. Instead of using Focal Loss, a standard loss function with class-dependent penalty weights was used to reduce recurrent errors between adjacent ripeness stages. The penalty coefficients were set to , , , and for each class. The values of these coefficients were assigned empirically through an iterative experimental process. During the preliminary training phases, analysis of the confusion matrices revealed that the models frequently confused adjacent stages of maturation. To address this, multiple configurations were tested to penalize misclassification.
3. Results
3.1. Segmentation Tests of Mango Regions in the Images
Fruit segmentation was validated by comparing the created masks with a GT produced using the Rembg library and manually verified against it. Two metrics were used for the evaluation: IoU (Intersection over Union) and Precision. Precision is the proportion of correctly segmented pixels among all pixels classified as belonging to the mango region.
Table 7 summarizes the overall average performance of each method in all classes and provides the average segmentation time for each technique.
Table 8 presents the IoU and precision values by maturity class, reporting the mean and its variability using the interquartile range (Q1–Q3). In this context, Q1 and Q3 correspond to the first and third quartiles, respectively, allowing us to describe both the central value and the dispersion of the results by class. The CIE
(
channel) approach produced consistent masks across all four classes, with an average IoU above 0.90 and precision close to 1. By contrast, the HSI (S-channel) showed greater variability in the IoU metric at later stages of maturity.
3.2. Findings from the Feature Ablation Study
The ablation study results on the test set are presented in
Table 9. Our MLP model, trained solely on colorimetric features (Color Only) achieved competitive performance. However, incorporating GLCM texture features (Color + GLCM) led to a slight decrease in performance, with an accuracy of 80.95% and a macro F1 score of 0.7990, suggesting that these features introduce redundant information or noise when combined with color alone.
In contrast, integrating LBP and color features (Color + LBPriu2) improved the model’s discriminative power, increasing accuracy to 84.05%. The full feature combination (Color + GLCM + LBPriu2) achieved the best performance, with an accuracy of 88.21% and a macro F1 score of 0.8784. These results indicate that colorimetric information, spatial texture captured by GLCM, and local microtexture patterns described by LBPriu2 provide complementary information for discriminating subtle transitions among fruit ripening stages.
3.3. Results of Classification with the Proposed MLP and the 33-Dimensional Descriptor
The dataset was split using a stratified hold-out strategy for all experiments, with 15% of the samples reserved for validation and another 15% for testing, while preserving class proportions in each subset. All partitions were generated with a fixed seed of 1337 to ensure reproducibility. We compared the performance of the proposed MLP against state-of-the-art pretrained models (MobileNetV2, MobileNetV3, and ResNet18). All models were assessed with the same stratified data split and test set. We did not use resampling techniques, such as oversampling or undersampling.
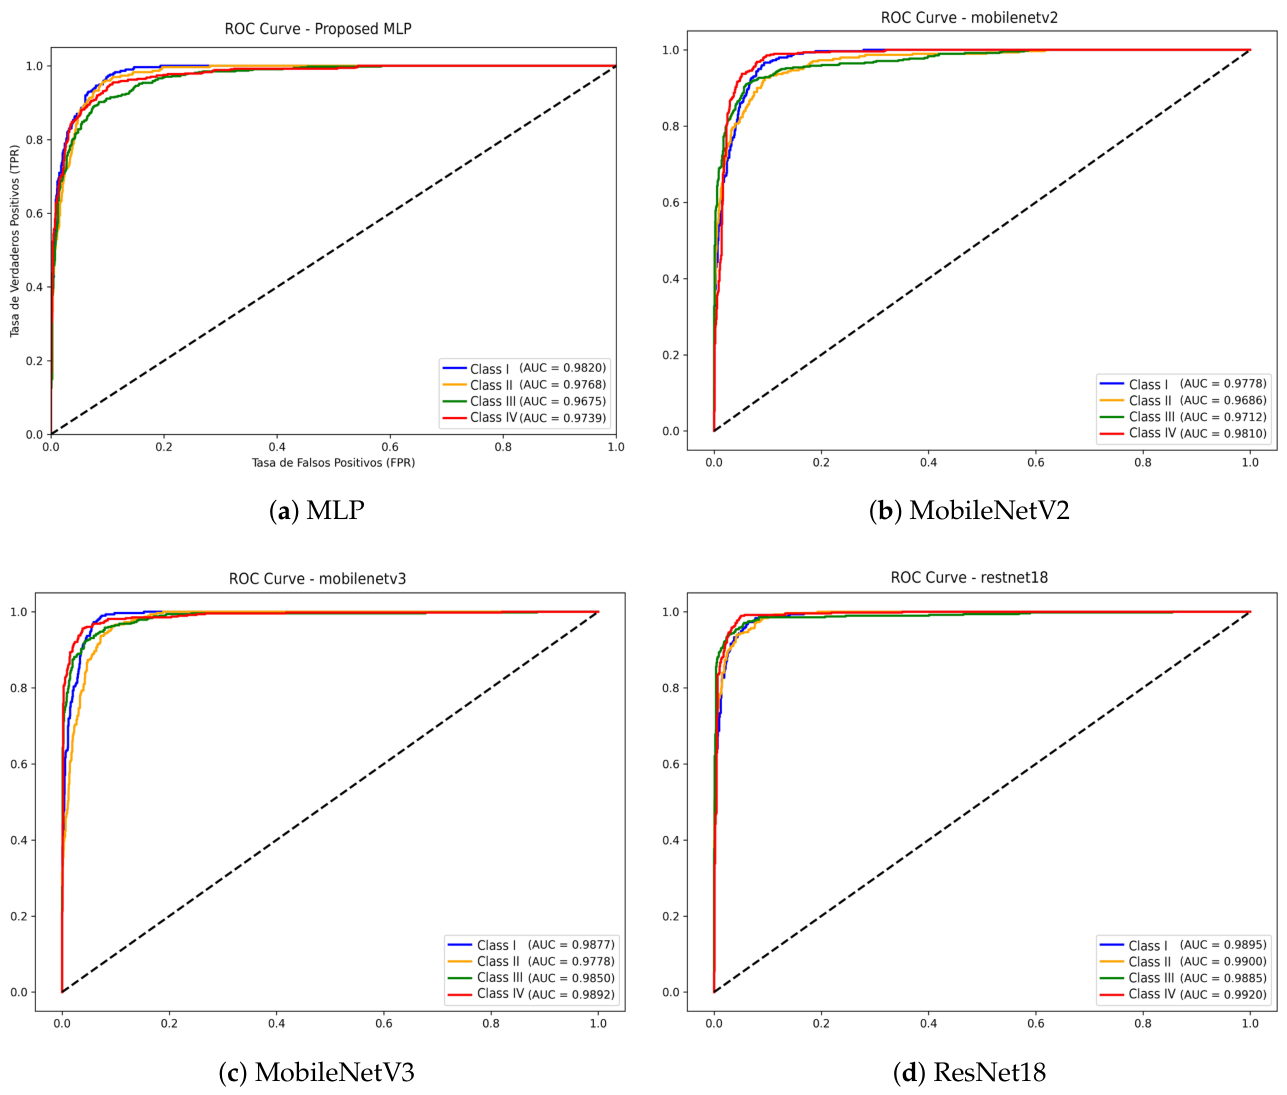
Figure 6 shows the ROC curves for each of the four classes, obtained using the proposed MLP and the pretrained deep learning models. The proposed MLP, MobileNetV2, and MobileNetV3 achieved AUCs of approximately 0.96 to 0.98. ResNet18 showed the highest and most consistent performance, with AUCs of 0.9885 to 0.9920. Overall, the results indicate strong class separation across decision thresholds for all evaluated models. It is worth noting that MLP needs only a very low-dimensional feature descriptor compared to the deep learning models examined.
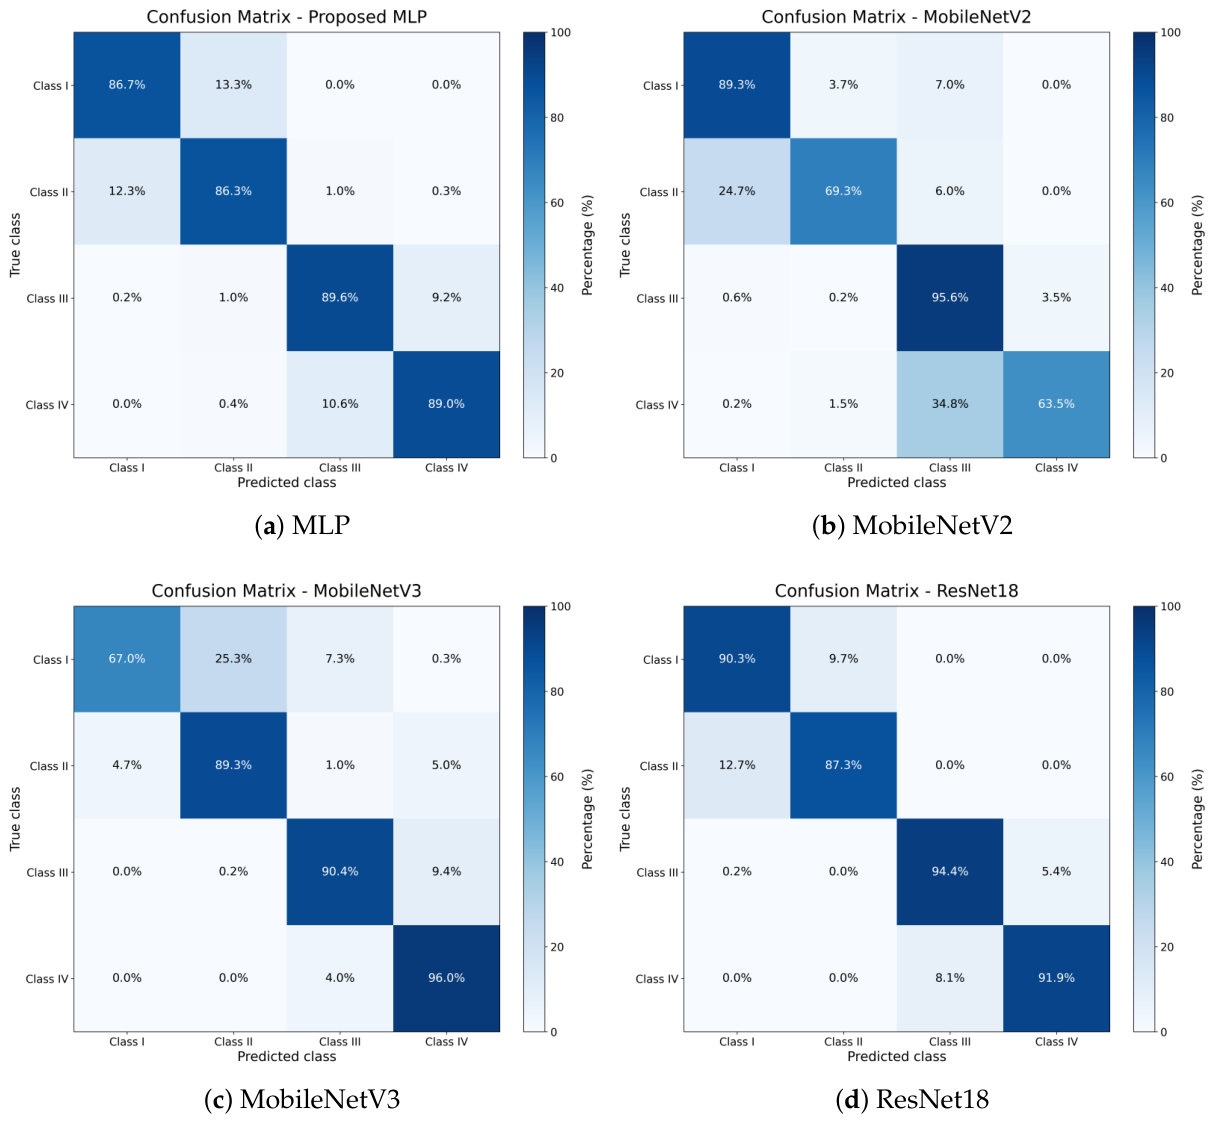
Figure 7 presents the normalized confusion matrices for the analyzed models on the test set. The rows correspond to the actual classes, and the columns to the predicted classes. All matrices show a high concentration of values along the main diagonal, indicating strong model performance. The most significant confusion occurs between Classes I and II and between Classes III and IV, a pattern consistent with the gradual transition between adjacent maturation phases. MobileNetV2 shows significant confusion, classifying Class II images as Class I and Class IV images as Class III, while MobileNetV3 misclassifies Class I images as Class II. ResNet18 demonstrates the greatest ability to distinguish between classes and delivers the best overall performance, albeit at the cost of higher computational complexity and more trainable parameters. The proposed MLP outperforms both MobileNet models in macro-F1 and shows more uniform class-specific recall across the four maturation stages, while maintaining computational requirements that are considerably lower than those of ResNet18.
We also compared the proposed model’s performance with two classical machine learning algorithms: Random Forest and SVM with an RBF kernel.
Table 10 shows that Random Forest achieved an accuracy of 0.7808 and a macro-F1 score of 0.7697, whereas SVM achieved an accuracy of 0.8122 and a macro-F1 score of 0.8083. Although SVM achieved 2.18% higher accuracy than MobileNetV2, both classical models showed overall performance inferior to that of the proposed MLP, MobileNetV3, and ResNet18. For this reason, and to keep the graphical analysis focused on the main DL architectures analyzed, their ROC curves and confusion matrices were omitted.
To determine the number of floating-point operations (FLOPs), Asperti et al. [
55] state that a single dense layer with input dimension
and output dimension
requires approximately
where the factor of 2 is due to each
multiply–accumulate (MAC) operation being equivalent to two floating-point operations (FLOPs).
Because a multilayer perceptron (MLP) consists of multiple densely connected layers arranged sequentially, the total number of operations during the inference phase (forward pass) is calculated as follows:
where
and
are the input and output dimensions of layer
l.
Table 11 shows the GFLOPs and the number of trainable parameters for the DL models. Although ResNet18 achieves the highest F1 score, it does so at a significantly higher computational cost. In contrast, the proposed MLP achieves a competitive F1 score while having several orders of magnitude fewer trainable parameters and an inference computational cost that is several orders of magnitude lower.
4. Discussion
This paper presented an efficient and reproducible approach for automatically classifying the ripening stages of the Ataulfo mango, based on an MLP trained on a compact 33-feature vector that integrates color descriptors, vegetation indices, and texture. Our proposal achieved competitive performance (Macro-F1 = 0.8784 on the test set) on an RGB image dataset of mangoes exhibiting variability across seasons and mango-recollection sites.
The experimental results demonstrate that a handcrafted feature extraction method, when used with an optimized MLP classifier, performs on par with, or even better than, lightweight deep architectures for this task. In particular, the proposed MLP outperformed MobileNetV2 and MobileNetV3 in macro F1-score by 10.44% and 2.20%, respectively. While ResNet18 attained the highest macro-F1 score of 0.9097, it required significant computational resources (1.81 GFLOPs) and had a large model size (11.7 million parameters). In contrast, our proposal achieved a 99.98% reduction in GFLOPs and required 77.7 times fewer trainable parameters than ResNet18. Our proposal offers approximately a three-order-of-magnitude reduction in computational cost relative to the MobileNet models and nearly a four-order-of-magnitude reduction relative to ResNet18, while maintaining a particularly favorable balance between accuracy and efficiency. This balance is crucial for deployment on hardware-constrained systems, such as mobile devices or edge computing platforms.
The proposed classification method also outperformed the classical Random Forest and SVM algorithms, which achieved F1-scores of 0.7697 and 0.8083, respectively. The optimized MLP provides a more effective decision function for the extracted feature representation than the other classical machine learning algorithms evaluated.
Confusion matrix analysis indicates that the MLP’s performance issues are primarily confined to adjacent classes, with the greatest confusion occurring between Classes I and II, followed by confusion between Classes III and IV. This pattern aligns with the nature of the ripening process; therefore, this behavior is not unique to the proposed MLP. The pretrained architectures also exhibited errors near adjacent class boundaries. MobileNetV2 showed substantial confusion between Class II and Class I, and between Class IV and Class III, whereas MobileNetV3 mainly confused Class I with Class II.
The MLP’s performance also validates the methodological preprocessing strategy. In the segmentation stage, classical Digital Image Processing techniques proved sufficient for extracting mango regions from images captured in a controlled environment. The results support the use of classical techniques, with HSV y CIE achieving effective segmentation under controlled conditions, yielding an average IoU of 0.90 and an accuracy of 0.99. Using the segmented mango region, a 33-dimensional descriptor—combining color statistics in RGB, CIE and HSV spaces, RGB vegetation indices, second-order texture (GLCM), and microtexture (LBPriu2) —effectively captured the physical changes in the fruit during ripening.
The ablation study showed that a higher-dimensional representation (color + GLCM + LBP) achieved the best performance (F-score = 0.8784), outperforming alternatives that used color alone (0.8009), color + GLCM (0.7990), and color + LBPriu2 (0.8302). The three properties—color, global structure, and microstructure—separate the data clusters more effectively than any lower-dimensional subspace.
A key factor in the observed robustness is an evaluation on a realistic dataset of 10,400 images collected in the Costa Grande region of the state of Guerrero, México. The dataset spans four mango ripening stages, two time periods (2024 and 2025), and two mango recollection sites. It was split into training, validation, and test sets, with all views of each mango included in a single subset to prevent information leakage and overly optimistic performance estimates. While this study aimed to compare a traditional machine learning classifier with pretrained CNNs, no resampling techniques, such as oversampling or undersampling, were applied, and the original class distribution was retained. However, class-dependent penalty weights were incorporated into the proposed MLP’s loss function. Preserving the original distribution ensures that the evaluation metrics reflect the acquisition conditions represented in the dataset. Future work will investigate data augmentation strategies to address data imbalance. This dataset is a valuable resource for future research into non-destructive classification and quality assessment of fruit.
Compared with previous studies, the results are consistent with those reported by Worasawate et al. [
9] and Tan et al. [
38], who note that classical ML models trained on discriminative, handcrafted features can be highly effective. At the same time, in contrast to the trend documented in recent reviews (e.g., Rojas Santelices et al. [
3] and Espinoza et al. [
5]) that emphasize the dominance of pretrained neural networks, this study shows that part of that performance may depend on a substantial increase in computational cost. In this regard, the proposed approach offers an alternative that delivers competitive performance with minimal computational requirements. Among the limitations, we acknowledge that handcrafted feature extraction depends critically on segmentation quality and that the model lacks the representational capacity of deep architectures, such as ResNet18, to capture highly complex nonlinear relationships.
Limitations and Future Research Directions
Table 12 summarizes the key limitations identified at each stage of the proposed method and the corresponding directions for future research.
5. Conclusions
This paper presents a non-destructive system for classifying mango ripeness (Mangifera indica L., cv. Ataulfo) into four stages. The results confirm that extraction of hand-made features remains a valid and effective approach in precision agriculture. Our proposal achieved an F1-score of 0.8784 on the partially ripe test set, indicating that comparable performance can be achieved without large-scale deep architectures, which is particularly relevant in resource-constrained settings. Experimental evidence shows that a compact 33-dimensional feature vector extracted from segmented RGB images is sufficient to characterize ripeness stages. By combining color descriptors, vegetation indices, and texture indicators, we can effectively detect intrinsic physical changes in the fruit and build a discriminative representation that pres erves the classifier’s performance. The ablation study confirmed that fusing color features, GLCM, and LBP yielded a more discriminative representation among the evaluated configurations. Furthermore, the data partitioning—which kept all images of the same fruit in the same set—allowed us to estimate performance on independent samples and to prevent information leakage between the training, validation, and test sets.
The results also show that a carefully hyperparameter-optimized MLP model can outperform certain lightweight CNNs widely used in computer vision applications for agriculture. In particular, the proposed MLP outperformed MobileNetV2 and MobileNetV3 on the partially ripe F1 test set, demonstrating that deep learning is not indispensable when the relevant descriptors of the phenomenon (ripening) are well-defined and consistently extracted. The proposed MLP also outperformed Random Forest and SVM, confirming the importance of combining the handcrafted feature vector with an appropriately optimized classifier. Regarding operational feasibility, the key advantage of our approach is its high computational efficiency. The proposed model reduces inference costs by about three orders of magnitude relative to MobileNet models and nearly four orders of magnitude relative to ResNet18. This decrease in computational cost, along with its significantly fewer trainable parameters, makes it suitable for deployment on mobile devices or edge hardware, where limited power and processing resources are often crucial.
Furthermore, error analysis confirms that there are inherent limits to visual maturity classification. Residual confusion is concentrated among adjacent ripeness stages, particularly between Classes I and II and, to a lesser extent, between Classes III and IV. This behavior is also observed in deep learning models, including more computationally intensive architectures such as ResNet18, though the predominant confusion boundary varies across architectures. This finding suggests that some of the classification error may be attributable to the visual similarity inherent in adjacent ripeness stages rather than to limitations of the proposed model alone.
Finally, we confirm that the methodological validity of this study is supported by an evaluation conducted on a dataset of 10,400 Ataulfo mango images collected in the Costa Grande region of Guerrero, Mexico. This experimental design incorporates variability across acquisition periods and sites, enabling the assessment of the proposed method under the conditions represented in the dataset. It also lays a strong foundation for developing non-destructive systems for agricultural applications.
Author Contributions
Conceptualization, I.M.-C., J.F.-P. and M.C.-B.; methodology, I.M.-C., J.F.-P. and M.C.-B.; software, I.M.-C. and J.F.-P.; validation, I.M.-C., J.F.-P., M.C.-B., W.C.-F. and A.B.-N.; formal analysis, I.M.-C., J.F.-P. and M.C.-B.; investigation, I.M.-C. and J.F.-P.; resources, I.M.-C., J.F.-P. and M.C.-B.; data curation, I.M.-C. and J.F.-P.; writing—original draft preparation, I.M.-C. and J.F.-P.; writing—review and editing, I.M.-C., J.F.-P., M.C.-B., W.C.-F. and A.B.-N.; visualization, I.M.-C. and J.F.-P.; supervision, J.F.-P. and M.C.-B.; project administration, J.F.-P. and M.C.-B. All authors have read and agreed to the published version of the manuscript.
Funding
This research received no external funding.
Data Availability Statement
The data and code that support the findings of this study are openly available in a GitHub (v1.0) repository at
https://github.com/Imanol-24/ataulfo-mango-maturity-dataset.git (accessed on 13 August 2026). The repository contains the complete image dataset of Ataulfo mangoes, the numerical dataset of extracted feature vectors in CSV format, and the source code used for image segmentation, feature extraction, model training, and evaluation, allowing the full reproduction of the proposed study.
Acknowledgments
Imanol Marianito-Cuahuitic would like to thank the Secretaría de Ciencia, Humanidades, Tecnología e Innovación (SECIHTI) of Mexico for its scholarship support.
Conflicts of Interest
The authors declare no conflicts of interest.
Abbreviations
The following abbreviations are used in this manuscript:
| CNN | Convolutional Neural Network |
| DICE | Sørensen–Dice coefficient |
| FANN | Feed-Forward Artificial Neural Network |
| FLOPs | Floating Point Operations |
| GFLOPs | Giga Floating Point Operations |
| GLCM | Gray-Level Co-occurrence Matrix |
| HSI | Hue, Saturation, Intensity |
| HSV | Hue, Saturation, Value |
| IoU | Intersection over Union |
| KNN | K-Nearest Neighbors |
| LAB | CIE color space |
| LBP | Local Binary Pattern |
| Rotation-Invariant Uniform Local Binary Pattern |
| MLP | Multilayer Perceptron |
| PCA | Principal Component Analysis |
| PLS | Partial Least Squares |
| PLSR | Partial Least Squares Regression |
| RGB | Red, Green, Blue |
| RMSE | Root Mean Squared Error |
| ROI | Region of Interest |
| SVM | Support Vector Machine |
| SVR | Support Vector Regression |
| ViT | Vision Transformer |
References
- Valenzuela, J.L. Advances in Postharvest Preservation and Quality of Fruits and Vegetables. Foods 2023, 12, 1830. [Google Scholar] [CrossRef] [Scilit] [PubMed]
- Rizzo, M.; Marcuzzo, M.; Zangari, A.; Gasparetto, A.; Albarelli, A. Fruit ripeness classification: A survey. Artif. Intell. Agric. 2023, 7, 44–57. [Google Scholar] [CrossRef] [Scilit]
- Rojas Santelices, I.; Cano, S.; Moreira, F.; Peña Fritz, Á. Artificial Vision Systems for Fruit Inspection and Classification: Systematic Literature Review. Sensors 2025, 25, 1524. [Google Scholar] [CrossRef] [Scilit] [PubMed]
- Shu, Y.; Zhang, J.; Wang, Y.; Wei, Y. Fruit Freshness Classification and Detection Based on the ResNet-101 Network and Non-Local Attention Mechanism. Foods 2025, 14, 1987. [Google Scholar] [CrossRef] [Scilit] [PubMed]
- Espinoza, S.; Aguilera, C.; Rojas, L.; Campos, P.G. Analysis of Fruit Images With Deep Learning: A Systematic Literature Review and Future Directions. IEEE Access 2024, 12, 3837–3859. [Google Scholar] [CrossRef] [Scilit]
- Knott, M.; Perez-Cruz, F.; Defraeye, T. Facilitated machine learning for image-based fruit quality assessment. J. Food Eng. 2023, 345, 111401. [Google Scholar] [CrossRef] [Scilit]
- Wang, W.; Zhu, A.; Wei, H.; Yu, L. A novel method for vegetable and fruit classification based on using diffusion maps and machine learning. Curr. Res. Food Sci. 2024, 8, 100737. [Google Scholar] [CrossRef] [Scilit] [PubMed]
- Ratha, A.K.; Barpanda, N.K.; Sethy, P.K.; Behera, S.K. Automated classification of Indian mango varieties using machine learning and MobileNet-v2 deep features. Trait. Signal 2024, 41, 669–678. [Google Scholar] [CrossRef] [Scilit]
- Worasawate, D.; Sakunasinha, P.; Chiangga, S. Automatic Classification of the Ripeness Stage of Mango Fruit Using a Machine Learning Approach. AgriEngineering 2022, 4, 32–47. [Google Scholar] [CrossRef] [Scilit]
- Castro, W.; Oblitas, J.; De-La-Torre, M.; Cotrina, C.; Bazán, K.; Avila-George, H. Classification of Cape Gooseberry Fruit According to its Level of Ripeness Using Machine Learning Techniques and Different Color Spaces. IEEE Access 2019, 7, 27389–27400. [Google Scholar] [CrossRef] [Scilit]
- Galvez-Lopez, D.; Salvador-Figueroa, M.; Rosas-Quijano, R.; Martínez-Luzuriaga, J.D.; Gómez-Estrada, J.A.; Vázquez-Ovando, A. Postharvest characteristics of Ataulfo mango grown in Soconusco, Chiapas. Agro Product. 2023, 16, 57–71. [Google Scholar] [CrossRef] [Scilit]
- Martínez Hernández, D.; Contreras López, E.; Pérez Flores, J.G.; García Curiel, L.; Pérez Escalante, E.; Salinas Ocampo, I.O.; González Olivares, L.G. Modelado cinético del cambio de color en mango utilizando OpenCV y Python. Arandu UTIC 2024, 11, 423–438. [Google Scholar] [CrossRef] [Scilit]
- Olorunfemi, B.O.; Nwulu, N.I.; Adebo, O.A.; Kavadias, K.A. Advancements in machine visions for fruit sorting and grading: A bibliometric analysis, systematic review, and future research directions. J. Agric. Food Res. 2024, 16, 101154. [Google Scholar] [CrossRef] [Scilit]
- Dhakshina Kumar, S.; Esakkirajan, S.; Bama, S.; Keerthiveena, B. A Microcontroller Based Machine Vision Approach for Tomato Grading and Sorting Using SVM Classifier. Microprocess. Microsyst. 2020, 76, 103090. [Google Scholar] [CrossRef] [Scilit]
- Al Riza, D.F.; Rulin, C.; Tun, N.T.T.; Yi, P.P.L.; Thwe, A.A.; Myint, K.T.; Kondo, N. Mango (Mangifera indica cv. Sein Ta Lone) Ripeness Level Prediction Using Color and Textural Features of Combined Reflectance-Fluorescence Images. J. Agric. Food Res. 2023, 11, 100477. [Google Scholar] [CrossRef] [Scilit]
- Mim, T.; Rahman, M.M.; Biswas, J.; Shafkat, A.; Uddin, K.M.M. FruitsMultiNet: A deep neural network approach to identify fruits through multi-scale feature fusion using mobile interface. J. Agric. Food Res. 2025, 22, 102083. [Google Scholar] [CrossRef] [Scilit]
- Rahman, M.M.; Basar, M.A.; Shinti, T.S.; Khan, M.S.I.; Babu, H.M.H.; Uddin, K.M.M. A Deep CNN Approach to Detect and Classify Local Fruits through a Web Interface. Smart Agric. Technol. 2023, 5, 100321. [Google Scholar] [CrossRef] [Scilit]
- Ismail, N.; Malik, O.A. Real-Time Visual Inspection System for Grading Fruits Using Computer Vision and Deep Learning Techniques. Inf. Process. Agric. 2022, 9, 24–37. [Google Scholar] [CrossRef] [Scilit]
- Sultana, S.; Tasir, M.A.M.; Nobel, S.M.N.; Kabir, M.M.; Mridha, M.F. XAI-FruitNet: An Explainable Deep Model for Accurate Fruit Classification. J. Agric. Food Res. 2024, 18, 101474. [Google Scholar] [CrossRef] [Scilit]
- Alfatni, M.S.M.; Khairunniza-Bejo, S.; Marhaban, M.H.B.; Saaed, O.M.B.; Mustapha, A.; Shariff, A.R.M. Towards a Real-Time Oil Palm Fruit Maturity System Using Supervised Classifiers Based on Feature Analysis. Agriculture 2022, 12, 1461. [Google Scholar] [CrossRef] [Scilit]
- Munera, S.; Rodríguez-Ortega, A.; Cubero, S.; Aleixos, N.; Blasco, J. Automatic detection of pomegranate fruit affected by blackheart disease using X-ray imaging. LWT 2025, 215, 117248. [Google Scholar] [CrossRef] [Scilit]
- Irhebhude, M.E.; Kolawole, A.O.; Bugaje, F.B. Recognition of Mangoes and Oranges Colour and Texture Features and Locality Preserving Projection. Int. J. Comput. Digit. Syst. 2022, 11, 963–975. [Google Scholar] [CrossRef] [Scilit]
- Shakil, R.; Islam, S.; Shohan, Y.A.; Mia, A.; Rajbongshi, A.; Rahman, M.H.; Akter, B. Addressing Agricultural Challenges: An Identification of Best Feature Selection Technique for Dragon Fruit Disease Recognition. Array 2023, 20, 100326. [Google Scholar] [CrossRef] [Scilit]
- Rosbi, M.; Omar, Z.; Khairuddin, U.; Majeed, A.P.P.A.; Bakar, S.A.R.S.A. Machine learning for automated oil palm fruit grading: The role of fuzzy C-means segmentation and textural features. Smart Agric. Technol. 2024, 9, 100691. [Google Scholar] [CrossRef] [Scilit]
- Taner, A.; Mengstu, M.T.; Selvi, K.Ç.; Duran, H.; Kabaş, Ö.; Gür, İ.; Karaköse, T.; Gheorghiță, N.-E. Multiclass Apple Varieties Classification Using Machine Learning with Histogram of Oriented Gradient and Color Moments. Appl. Sci. 2023, 13, 7682. [Google Scholar] [CrossRef] [Scilit]
- Xiao, F.; Wang, H.; Li, Y.; Cao, Y.; Lv, X.; Xu, G. Object Detection and Recognition Techniques Based on Digital Image Processing and Traditional Machine Learning for Fruit and Vegetable Harvesting Robots: An Overview and Review. Agronomy 2023, 13, 639. [Google Scholar] [CrossRef] [Scilit]
- Lu, Y.; Ji, Z.; Yang, L.; Jia, W. Mask Positioner: An effective segmentation algorithm for green fruit in complex environment. J. King Saud. Univ. Comput. Inf. Sci. 2023, 35, 101598. [Google Scholar] [CrossRef] [Scilit]
- El Akrouchi, M.; Mhada, M.; Bayad, M.; Hawkesford, M.J.; Gérard, B. AI-based framework for early detection and segmentation of green citrus fruits in orchards. Smart Agric. Technol. 2025, 10, 100834. [Google Scholar] [CrossRef] [Scilit]
- Giménez-Gallego, J.; Martinez-del-Rincon, J.; González-Teruel, J.D.; Navarro-Hellín, H.; Navarro, P.J.; Torres-Sánchez, R. On-Tree Fruit Image Segmentation Comparing Mask R-CNN and Vision Transformer Models. Application in a Novel Algorithm for Pixel-Based Fruit Size Estimation. Comput. Electron. Agric. 2024, 222, 109077. [Google Scholar] [CrossRef] [Scilit]
- Wu, B.; Zhou, J.; Ji, X.; Yin, Y.; Shen, X. An ameliorated teaching–learning-based optimization algorithm based study of image segmentation for multilevel thresholding using Kapur’s entropy and Otsu’s between class variance. Inf. Sci. 2020, 533, 72–107. [Google Scholar] [CrossRef] [Scilit]
- Vite-Chávez, O.; Flores-Troncoso, J.; Olivera-Reyna, R.; Muñoz-Minjares, J.U. Improvement Procedure for Image Segmentation of Fruits and Vegetables Based on the Otsu Method. Image Anal. Stereol. 2023, 42, 185–196. [Google Scholar] [CrossRef] [Scilit]
- Costa, A.G.; De Sousa, D.A.G.; Paes, J.L.; Cunha, J.P.B.; De Oliveira, M.V.M. Classification of robusta coffee fruits at different maturation stages using colorimetric characteristics. Eng. Agrícola 2020, 40, 518–525. [Google Scholar] [CrossRef] [Scilit]
- Cho, B.H.; Koyama, K.; Olivares Díaz, E.; Koseki, S. Determination of “Hass” avocado ripeness during storage based on smartphone image and machine learning model. Food Bioprocess Technol. 2020, 13, 1579–1587. [Google Scholar] [CrossRef] [Scilit]
- Nuño-Maganda, M.A.; Dávila-Rodríguez, I.A.; Hernández-Mier, Y.; Barrón-Zambrano, J.H.; Elizondo-Leal, J.C.; Díaz-Manriquez, A.; Polanco-Martagón, S. Real-Time Embedded Vision System for Online Monitoring and Sorting of Citrus Fruits. Electronics 2023, 12, 3891. [Google Scholar] [CrossRef] [Scilit]
- Hussain Hassan, N.M.; Hassan Mahmoud, M.M.; Ismeil, M.A.; Mabrook, M.M.; Donkol, A.A.; Mabrouk, A.M. ANN-SVM-IP: An Innovative Method for Rapidly and Efficiently Detecting and Classifying of External Defects of Apple Fruits. IEEE Access 2025, 13, 123487–123514. [Google Scholar] [CrossRef] [Scilit]
- Sajitha, P.; Andrushia, A.D.; Anand, N.; Naser, M.Z.; Lubloy, E. A Deep Learning Approach to Detect Diseases in Pomegranate Fruits via Hybrid Optimal Attention Capsule Network. Ecol. Inform. 2024, 84, 102859. [Google Scholar] [CrossRef] [Scilit]
- Said, A.G.; Joshi, B. SmartRipen: LSTM-GRU Feature Selection and XGBoost-CNN for Fruit Ripeness Detection. Food Phys. 2025, 2, 100053. [Google Scholar] [CrossRef] [Scilit]
- Tan, J.L.; Hashim, F.H.; Sampe, J.; Baseri Huddin, A.; Salim, G.M.; Md Ali, S.H. Machine learning classification of mango maturity based on carotene content from Raman spectra. PeerJ 2025, 13, e20288. [Google Scholar] [CrossRef] [Scilit] [PubMed]
- Muzamal, M.; Hussain, M.; De Wibowo, A. Non-Destructive Mango Quality Prediction Using Machine Learning Algorithms. Eng. Proc. 2025, 107, 116. [Google Scholar] [CrossRef] [Scilit]
- Sikder, M.S.; Islam, M.S.; Islam, M.; Reza, M.S. Improving Mango Ripeness Grading Accuracy: A Comprehensive Analysis of Deep Learning, Traditional Machine Learning, and Transfer Learning Techniques. Mach. Learn. Appl. 2025, 19, 100619. [Google Scholar] [CrossRef] [Scilit]
- Cano, D.V.; Schlam, F.F.H.; de la O, J.L.R.; Priego, A.F.B. ‘Ataulfo’ mango maturity index prediction using the AS7262 spectral sensor. Rev. Bras. Frutic. 2024, 46, e-048. [Google Scholar] [CrossRef] [Scilit]
- Loera-Alvarado, G.; Chávez-Franco, S.H.; Carrillo-Salazar, J.A.; González-Camacho, J.M.; Suárez-Espinosa, J.; Valle-Guadarrama, S. Analysis of Digital Images on a Mobile Device to Estimate Surface Area and Volume of Mango Fruit (Mangifera indica L.). Agro Product. 2021, 14, 23–28. [Google Scholar] [CrossRef] [Scilit]
- Gatis, D. rembg (Version 2.0.72) [Python Package]. Python Package Index (PyPI). Available online: https://pypi.org/project/rembg/ (accessed on 30 January 2026).
- Zhang, M.; Zhou, J.; Sudduth, K.A.; Kitchen, N.R. Estimation of maize yield and effects of variable-rate nitrogen application using UAV-based RGB imagery. Biosyst. Eng. 2020, 189, 24–35. [Google Scholar] [CrossRef] [Scilit]
- Adainoo, B.; Thomas, A.L.; Krishnaswamy, K. Correlations between color, textural properties and ripening of the North American pawpaw (Asimina triloba) fruit. Sustain. Food Technol. 2023, 1, 263–274. [Google Scholar] [CrossRef] [Scilit]
- Galal, H.; Elsayed, S.; Elsherbiny, O.; Allam, A.; Farouk, M. Using RGB Imaging, Optimized Three-Band Spectral Indices, and a Decision Tree Model to Assess Orange Fruit Quality. Agriculture 2022, 12, 1558. [Google Scholar] [CrossRef] [Scilit]
- Liu, Y.; Ban, S.; Wei, S.; Li, L.; Tian, M.; Hu, D.; Liu, W.; Yuan, T. Estimating the frost damage index in lettuce using UAV-based RGB and multispectral images. Front. Plant Sci. 2024, 14, 1242948. [Google Scholar] [CrossRef] [Scilit] [PubMed]
- De Swaef, T.; Maes, W.H.; Aper, J.; Baert, J.; Cougnon, M.; Reheul, D.; Steppe, K.; Roldán-Ruiz, I.; Lootens, P. Applying RGB- and Thermal-Based Vegetation Indices from UAVs for High-Throughput Field Phenotyping of Drought Tolerance in Forage Grasses. Remote Sens. 2021, 13, 147. [Google Scholar] [CrossRef] [Scilit]
- Palumbo, M.; Cefola, M.; Pace, B.; Attolico, G.; Colelli, G. Computer vision system based on conventional imaging for non-destructively evaluating quality attributes in fresh and packaged fruit and vegetables. Postharvest Biol. Technol. 2023, 200, 112332. [Google Scholar] [CrossRef] [Scilit]
- Panebianco, S.; Van Wijk, E.; Yan, Y.; Cirvilleri, G.; Musumarra, A.; Pellegriti, M.G.; Scordino, A. Delayed luminescence in monitoring the postharvest ripening of tomato fruit and classifying according to their maturity stage at harvest. Food Bioprocess Technol. 2024, 17, 5119–5133. [Google Scholar] [CrossRef] [Scilit]
- Francisco, W.C.; Tavira, J.V.; Vega, J.J.C.; Robles, B.D.V.; Tamariz, E.R.; Ortega, A.B. Comparative Analysis of Techniques for Texture Feature Extraction for Supervised Classification of Wood and Textile Waste. Recycling 2026, 11, 86. [Google Scholar] [CrossRef] [Scilit]
- OpenStax. Skewness and the Mean, Median, and Mode. In Introductory Business Statistics, 2e; OpenStax: Houston, TX, USA, 2023; Available online: https://openstax.org/books/introductory-business-statistics-2e/pages/2-6-skewness-and-the-mean-median-and-mode (accessed on 30 January 2026).
- Hallur, S.; Gavade, A. Image feature extraction techniques: A comprehensive review. Frankl. Open 2025, 12, 100366. [Google Scholar] [CrossRef] [Scilit]
- Jabed, M.A.; Azmi Murad, M.A. Crop yield prediction in agriculture: A comprehensive review of machine learning and deep learning approaches, with insights for future research and sustainability. Heliyon 2024, 10, e40836. [Google Scholar] [CrossRef] [Scilit] [PubMed]
- Asperti, A.; Evangelista, D.; Marzolla, M. Dissecting FLOPs Along Input Dimensions for GreenAI Cost Estimations. In Machine Learning, Optimization, and Data Science; Nicosia, G., Ojha, V., La Malfa, E., La Malfa, G., Jansen, G., Pardalos, P.M., Giuffrida, G., Umeton, R., Eds.; Springer International Publishing: Cham, Switzerland, 2022; pp. 86–100. [Google Scholar] [CrossRef] [Scilit]
Figure 1.
Visual appearance of the mango across the four stages of ripeness analyzed in this study.
Figure 1.
Visual appearance of the mango across the four stages of ripeness analyzed in this study.
Figure 2.
Prototype developed for controlled image capturing of the Ataulfo mango: (a) 64 MP mobile device, (b) turntable for 360° rotation, (c) tripod, (d) LED lighting, (e) uniform background, and (f) Ataulfo mango.
Figure 2.
Prototype developed for controlled image capturing of the Ataulfo mango: (a) 64 MP mobile device, (b) turntable for 360° rotation, (c) tripod, (d) LED lighting, (e) uniform background, and (f) Ataulfo mango.
Figure 3.
File structure of the dataset and the nomenclature used to name the Ataulfo mango images.
Figure 3.
File structure of the dataset and the nomenclature used to name the Ataulfo mango images.
Figure 4.
Workflow for fruit-level dataset partitioning into training, validation, and test sets to prevent data leakage.
Figure 4.
Workflow for fruit-level dataset partitioning into training, validation, and test sets to prevent data leakage.
Figure 5.
Image pixel-intensity histograms for the different channels in the three-color space models.
Figure 5.
Image pixel-intensity histograms for the different channels in the three-color space models.
Figure 6.
ROC curves for the evaluated models: (a) Proposed MLP with the 33-feature vector (b) MobileNetV2, (c) MobileNetV3, and (d) ResNet18.
Figure 6.
ROC curves for the evaluated models: (a) Proposed MLP with the 33-feature vector (b) MobileNetV2, (c) MobileNetV3, and (d) ResNet18.
Figure 7.
Normalized confusion matrices on the test set for: (a) Proposed MLP (b) MobileNetV2, (c) MobileNetV3, and (d) ResNet18.
Figure 7.
Normalized confusion matrices on the test set for: (a) Proposed MLP (b) MobileNetV2, (c) MobileNetV3, and (d) ResNet18.
Table 1.
Distribution of images in the proposed dataset by class and capture year.
Table 1.
Distribution of images in the proposed dataset by class and capture year.
| Dataset | Class I | Class II | Class III | Class IV |
|---|
| DA (August 2024) | 0 | 0 | 1200 | 1200 |
| DB (February 2025) | 2000 | 2000 | 2000 | 2000 |
| Total | 2000 | 2000 | 3200 | 3200 |
Table 2.
Ranges of pixel values for yellow and green regions of mangoes.
Table 2.
Ranges of pixel values for yellow and green regions of mangoes.
| Color Model | Channels | Green Ranges | Yellow Ranges |
|---|
| HSV | (H, S, V) | [(0, 100, 40), (30, 250, 250)] | [(15, 135, 80), (30, 255, 255)] |
| CIE | () | [150, 190] | [150, 200] |
| HSI | (S) | [77, 255] | [102, 204] |
Table 3.
Formulas for RGB vegetation indices.
Table 3.
Formulas for RGB vegetation indices.
| Index | Formula | Reference |
|---|
| ExG | | |
| VARI | | [47] |
| NGRDI | | |
| G/R | | [48] |
Table 4.
Final feature descriptor used for classifying the ripeness of Ataulfo mangoes.
Table 4.
Final feature descriptor used for classifying the ripeness of Ataulfo mangoes.
| Color Model | Category | Features |
|---|
| RGB | Vegetation indexes | ExG_mean, ExG_std, VARI_mean, VARI_std, NGRDI_mean, NGRDI_std, G/R_mean, G/R_std |
| HSV | Color | Hue_mean_degree, Hue_std_degree, S_mean, S_std, V_mean, V_std |
| CIE | Color | L_mean, L_std, a_mean, a_std, b_mean, b_std |
| CIE | Chromatic relationship | |
| CIE | Global color | colorfulness_mean, colorfulness_std |
| GRAY | Statistical texture (GLCM) | GLCM_contrast_mean, GLCM_correlation_mean, GLCM_dissimilarity_mean, GLCM_energy_mean, GLCM_homogeneity_mean |
| GRAY | Structural texture () | energy, entropy, skewness, kurtosis, std |
Table 5.
Hyperparameters analyzed in the grid search method.
Table 5.
Hyperparameters analyzed in the grid search method.
| Parameter | Parameter Values |
|---|
| Architectures | Narrow-2L (128–64), Base-1L (256), Base-2L (256–128), Wide-2L (512–256) |
| Optimizers | {adam, adamax, adagrad, ftrl} |
| Weight initializations | {henormal, variancescaling} |
| Activation functions | {leakyrelu, softsign} |
| Batch sizes | {64, 128, 256} |
| Learning rates | {0.002, 0.003, 0.0031, 0.0032, 0.00325, 0.0033, 0.004, 0.005} |
| Dropouts by layer | {0.12, 0.15, 0.20, 0.25} |
| L2 regularization | |
| Batch Normalization | {True, False} |
| Label smoothing rates | {0.000, 0.002, 0.005, 0.010, 0.015, 0.020, 0.030, 0.050} |
| Focal loss function | {True, False} |
| Balancing weights | ; ; ; |
Table 6.
Proposed architecture of the MLP classifier.
Table 6.
Proposed architecture of the MLP classifier.
| Layer | Type | Units | Activation Function | Regularization Function |
|---|
| Input | Feature vector | 33 | – | – |
| Hidden 1 | FC + BN | 512 | Leaky ReLU | Dropout (0.12) + L2 |
| Hidden 2 | FC + BN | 256 | Leaky ReLU | Dropout (0.12) + L2 |
| Output | FC | 4 | Softmax | – |
Table 7.
Average comparison by method: IoU, precision, and processing time.
Table 7.
Average comparison by method: IoU, precision, and processing time.
| Method | Mean IoU | Mean Precision | Avg. Time (s) |
|---|
| HSV | 0.90 | 0.99 | 0.04 |
| HSI (S channel) | 0.88 | 0.98 | 0.25 |
| CIE ( channel) | 0.90 | 0.99 | 0.08 |
Table 8.
Segmentation performance using different color models: IoU and class-wise precision (Q1–Q3).
Table 8.
Segmentation performance using different color models: IoU and class-wise precision (Q1–Q3).
| Color Model | Class | IoU (Q1–Q3) | Precision (Q1–Q3) |
|---|
| HSV | 1 | 0.85 (0.66–0.92) | 1.00 (0.99–1.00) |
| | 2 | 0.92 (0.89–0.93) | 1.00 (0.98–1.00) |
| | 3 | 0.91 (0.88–0.93) | 1.00 (1.00–1.00) |
| | 4 | 0.92 (0.92–0.93) | 1.00 (1.00–1.00) |
| HSI (S channel) | 1 | 0.92 (0.92–0.94) | 1.00 (0.99–1.00) |
| | 2 | 0.93 (0.93–0.94) | 1.00 (0.99–1.00) |
| | 3 | 0.75 (0.64–0.87) | 1.00 (0.99–1.00) |
| | 4 | 0.65 (0.54–0.77) | 1.00 (0.99–1.00) |
| CIE ( channel) | 1 | 0.90 (0.85–0.92) | 1.00 (1.00–1.00) |
| | 2 | 0.92 (0.90–0.93) | 1.00 (1.00–1.00) |
| | 3 | 0.93 (0.92–0.94) | 1.00 (1.00–1.00) |
| | 4 | 0.92 (0.93–0.94) | 1.00 (0.99–1.00) |
Table 9.
Performance comparison on the test set across various descriptor categories used during training.
Table 9.
Performance comparison on the test set across various descriptor categories used during training.
| Descriptor Categories | Total Features | Test Accuracy | Test Macro-F1 |
|---|
| Color Only | 23 | 0.8143 | 0.8009 |
| Color + GLCM | 28 | 0.8095 | 0.7990 |
| Color + LBPriu2 | 28 | 0.8405 | 0.8302 |
| Color + GLCM + LBPriu2 | 33 | 0.8821 | 0.8784 |
Table 10.
Comparison of models’ performance: Accuracy, Macro-F1, AUC.
Table 10.
Comparison of models’ performance: Accuracy, Macro-F1, AUC.
| Model | Accuracy | Macro-F1 | AUC |
|---|
| Proposed MLP | 0.8821 | 0.8784 | 0.9751 |
| MobileNetV2 | 0.7949 | 0.7954 | 0.9747 |
| MobileNetV3 | 0.8744 | 0.8595 | 0.9849 |
| ResNet18 | 0.9147 | 0.9097 | 0.9900 |
| Random Forest | 0.7808 | 0.7697 | 0.9589 |
| SVM (RBF) | 0.8122 | 0.8083 | 0.9643 |
Table 11.
Comparison of GFLOPs and model capacity.
Table 11.
Comparison of GFLOPs and model capacity.
| Model | GFLOPs | Trainable Parameters (M) |
|---|
| Proposed MLP | | 0.151 |
| MobileNetV2 | 0.30 | 3.5 |
| MobileNetV3 | 0.22 | 5.5 |
| ResNet18 | 1.81 | 11.7 |
Table 12.
Main limitations of the proposed approach and suggested future research directions.
Table 12.
Main limitations of the proposed approach and suggested future research directions.
| Stage | Current Limitation | Future Research Direction |
|---|
| Image acquisition | Images were acquired using uniform LED lighting, a homogeneous background, a fixed distance, and a single mobile device. | Validate the system across different devices, lighting conditions, backgrounds, and postharvest environments. |
| Dataset construction | The four ripeness classes were not available in both acquisition periods. Classes I and II were observed only in 2025, whereas Classes III and IV were observed in 2024 and 2025. | Gather all ripeness stages from multiple seasons, suppliers, acquisition times, and production locations. |
| Segmentation | The fixed color thresholds depend on controlled acquisition conditions and may be sensitive to changes in illumination and background. | Assess segmentation techniques that perform reliably despite changing lighting and background environments. |
| Feature representation | The descriptor is based on visible RGB information and on handcrafted color and texture features. | Evaluate the robustness of the extracted features and the individual contribution of each feature under more diverse acquisition conditions. |
| Statistical evaluation | Model comparisons are based on point estimates from the independent test set, without confidence intervals or statistical significance tests. | Perform multiple evaluations and calculate confidence intervals and statistical uncertainty for comparing models. |
| Deployment | The proposed model has not yet been implemented or directly evaluated on mobile devices or edge hardware. | Evaluate inference time, memory consumption, and energy requirements on resource-constrained devices. |
| Disclaimer/Publisher’s Note: The statements, opinions and data contained in all publications are solely those of the individual author(s) and contributor(s) and not of MDPI and/or the editor(s). MDPI and/or the editor(s) disclaim responsibility for any injury to people or property resulting from any ideas, methods, instructions or products referred to in the content. |




 ,
,