
Charging Station Siting and Capacity Determination Based on a Generalized Least-Cost Model of Traffic Distribution


Abstract
1. Introduction
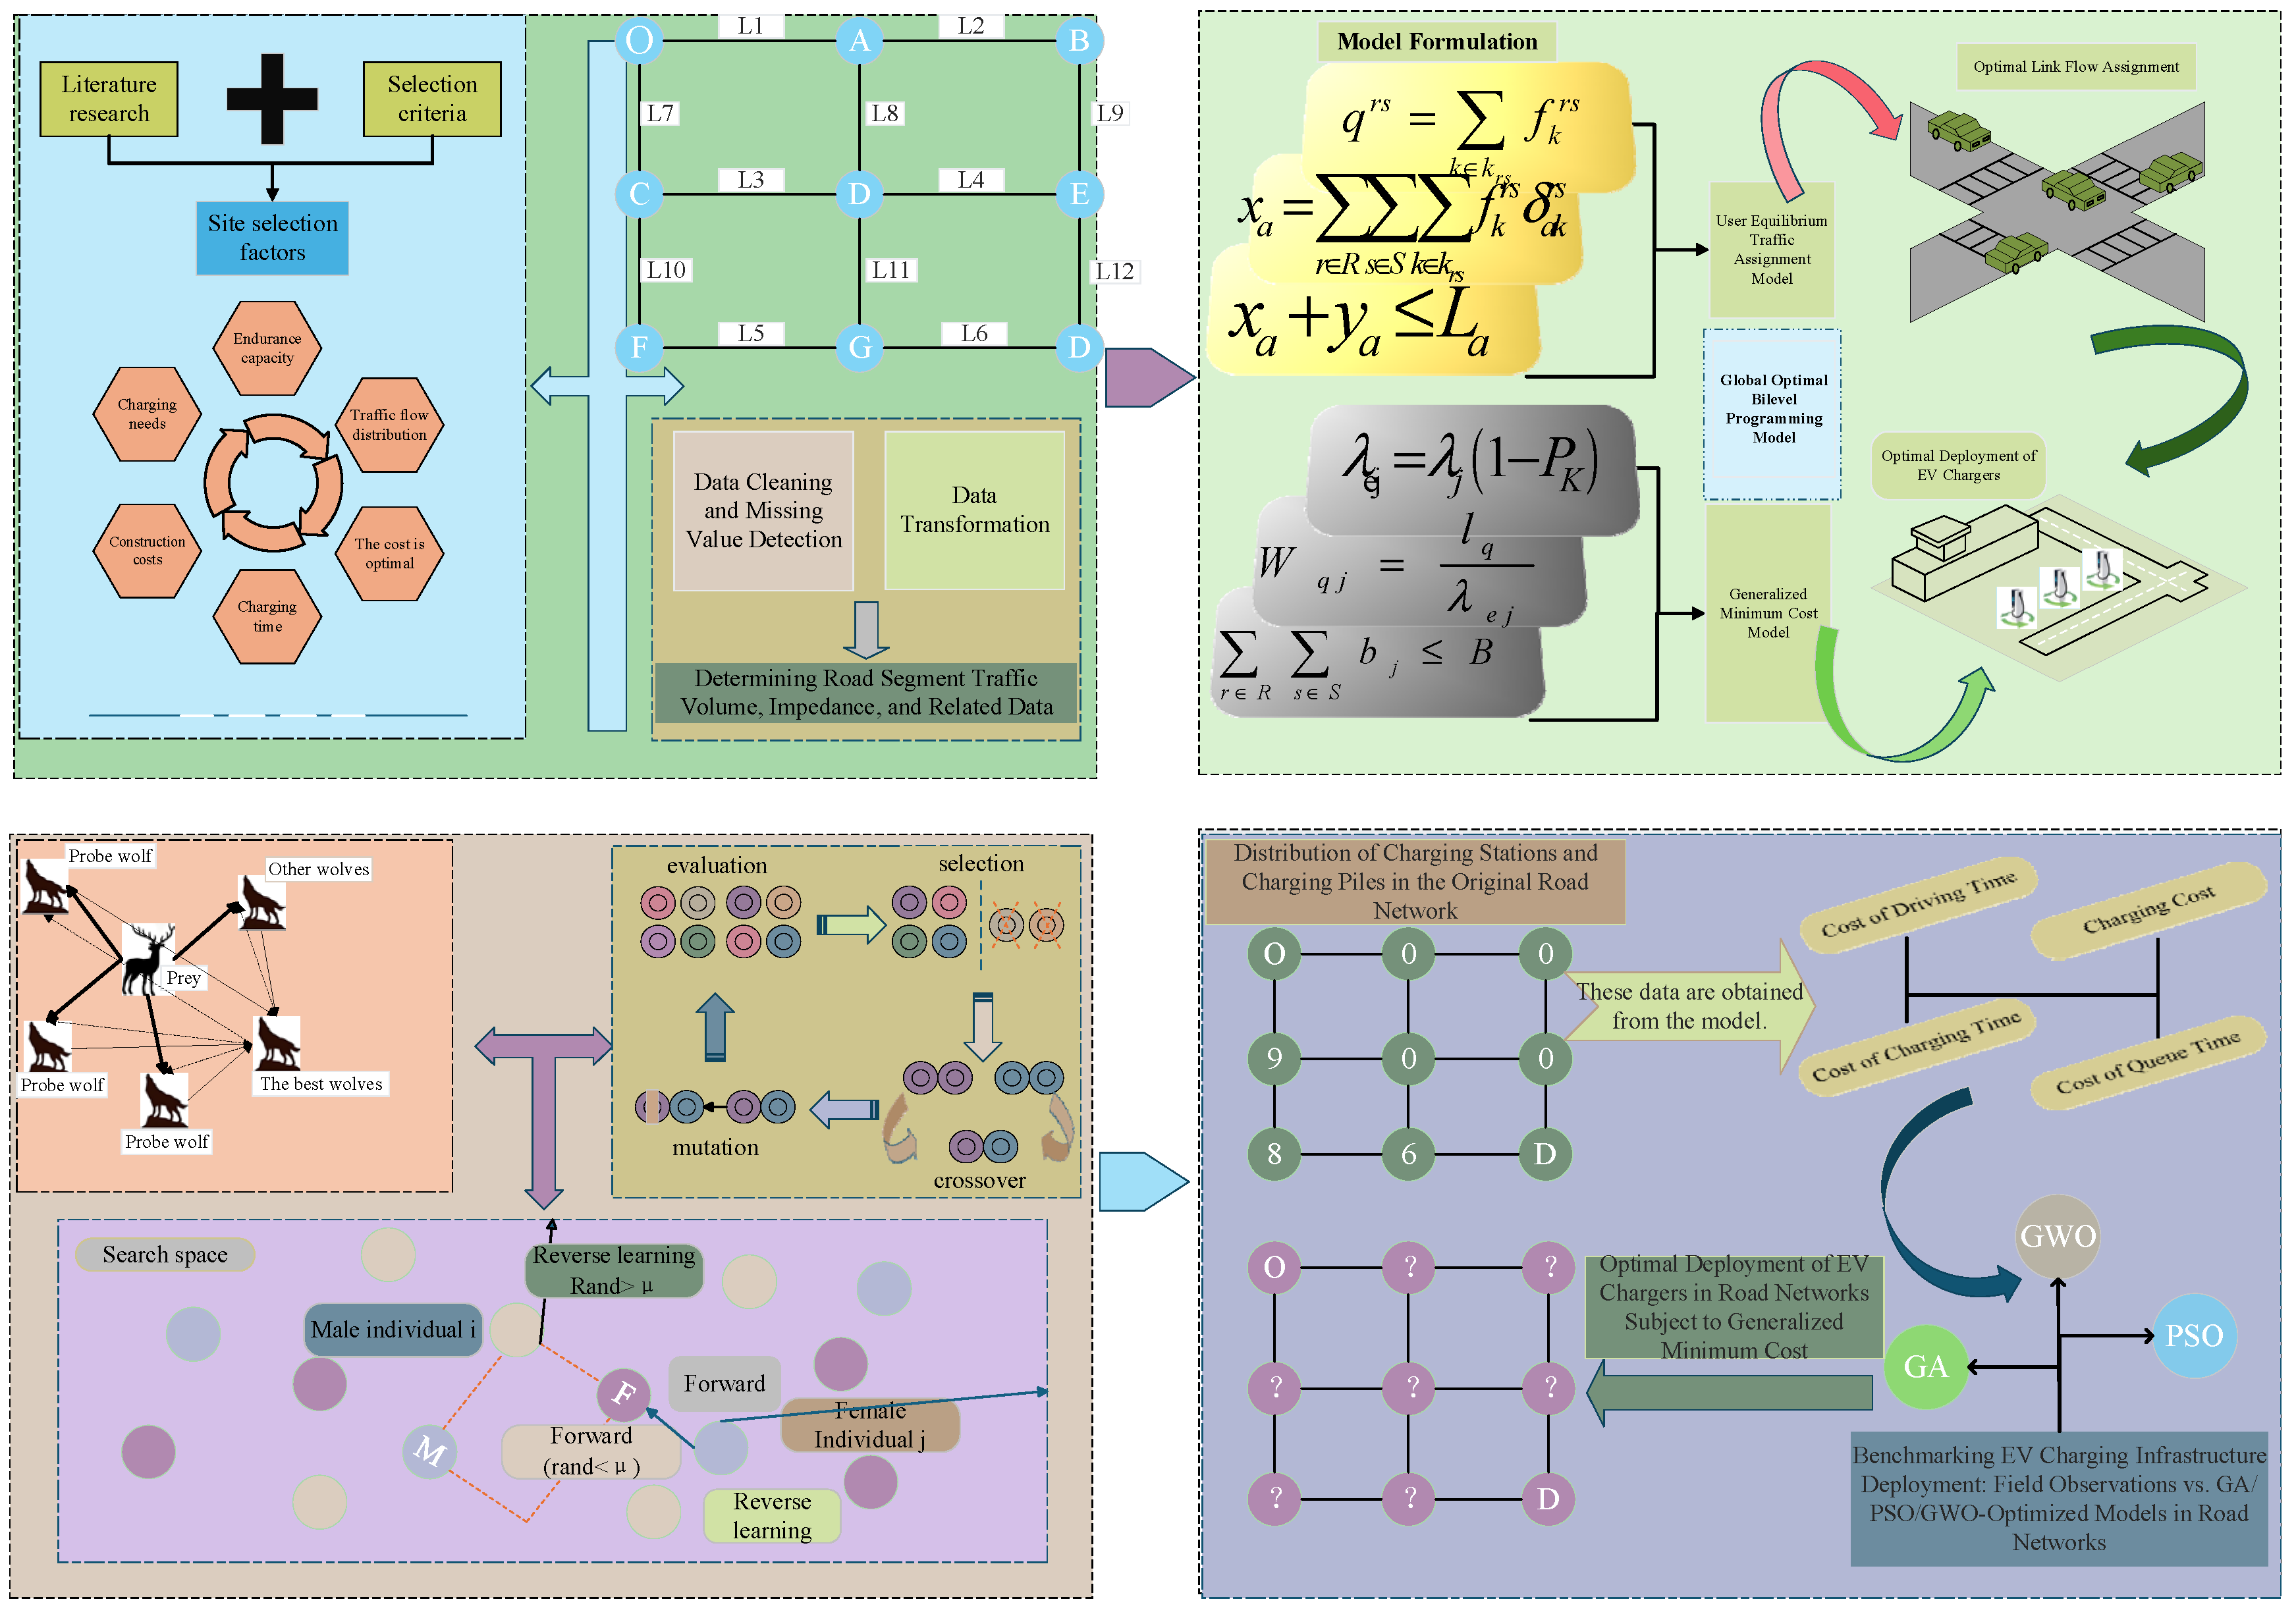
2. Methods
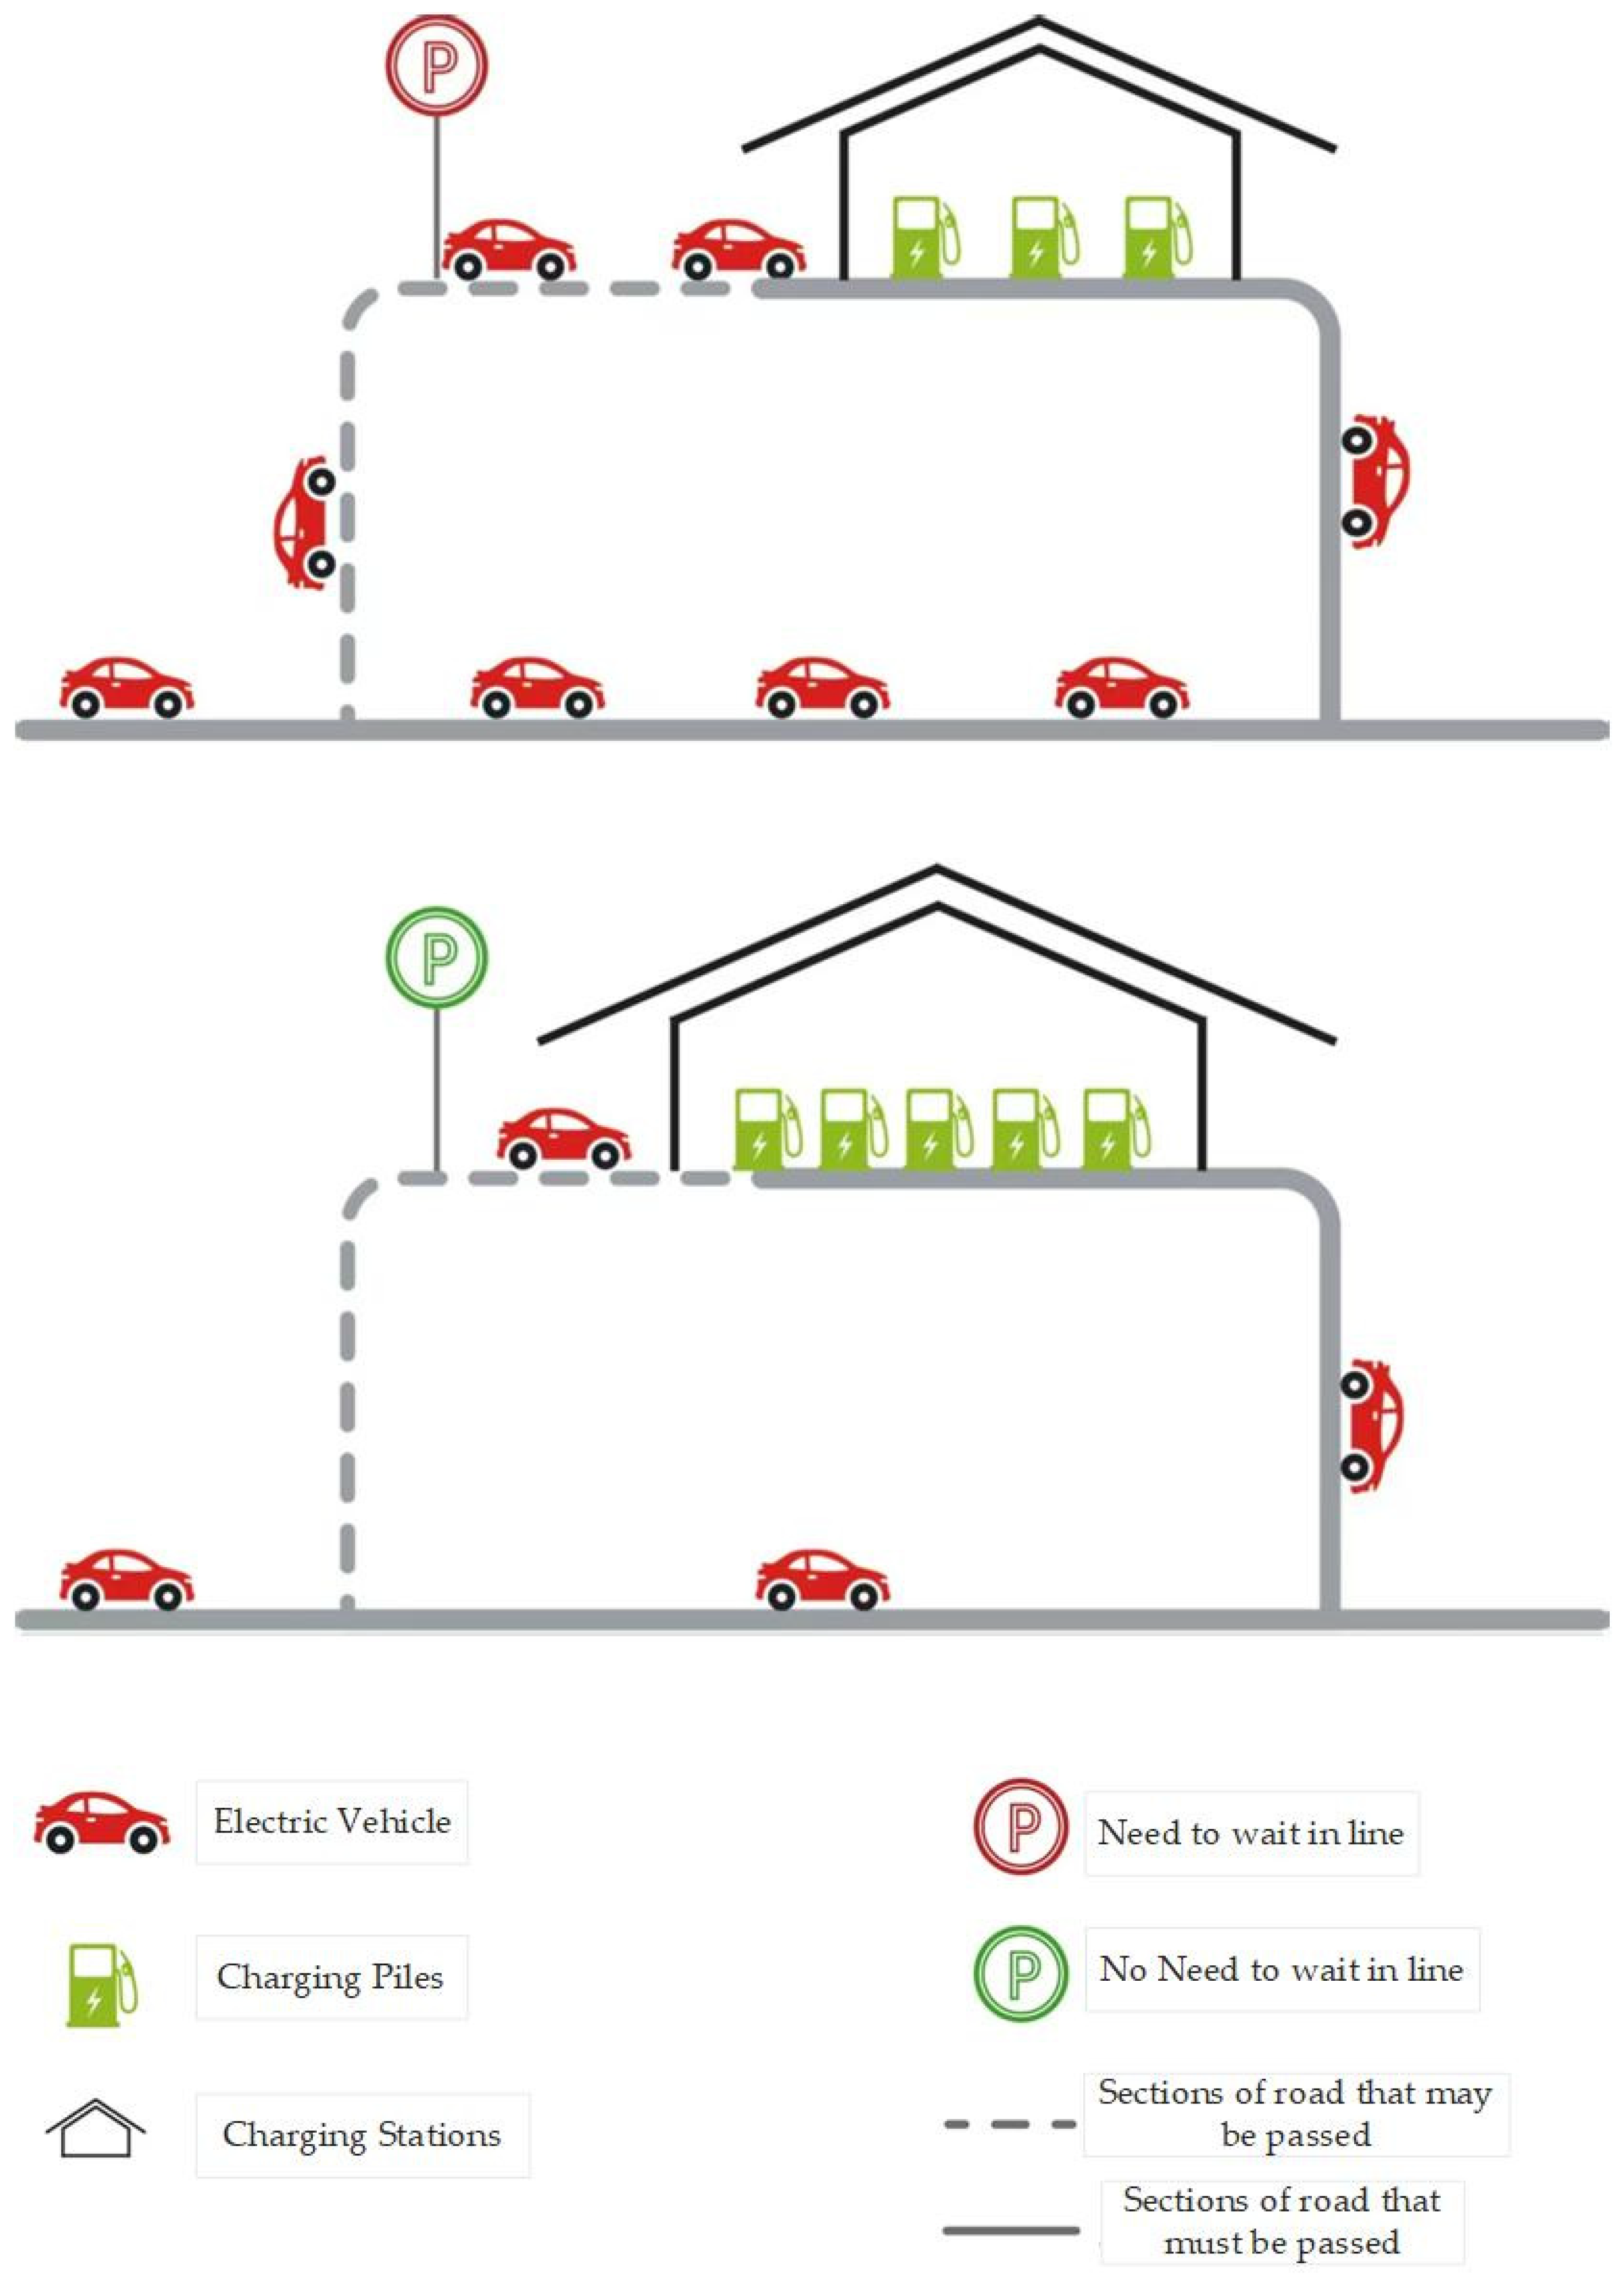
2.1. Problem Statement
2.2. Model Building
2.2.1. Upper-Level Planning Model
2.2.2. Lower-Layer Planning Model
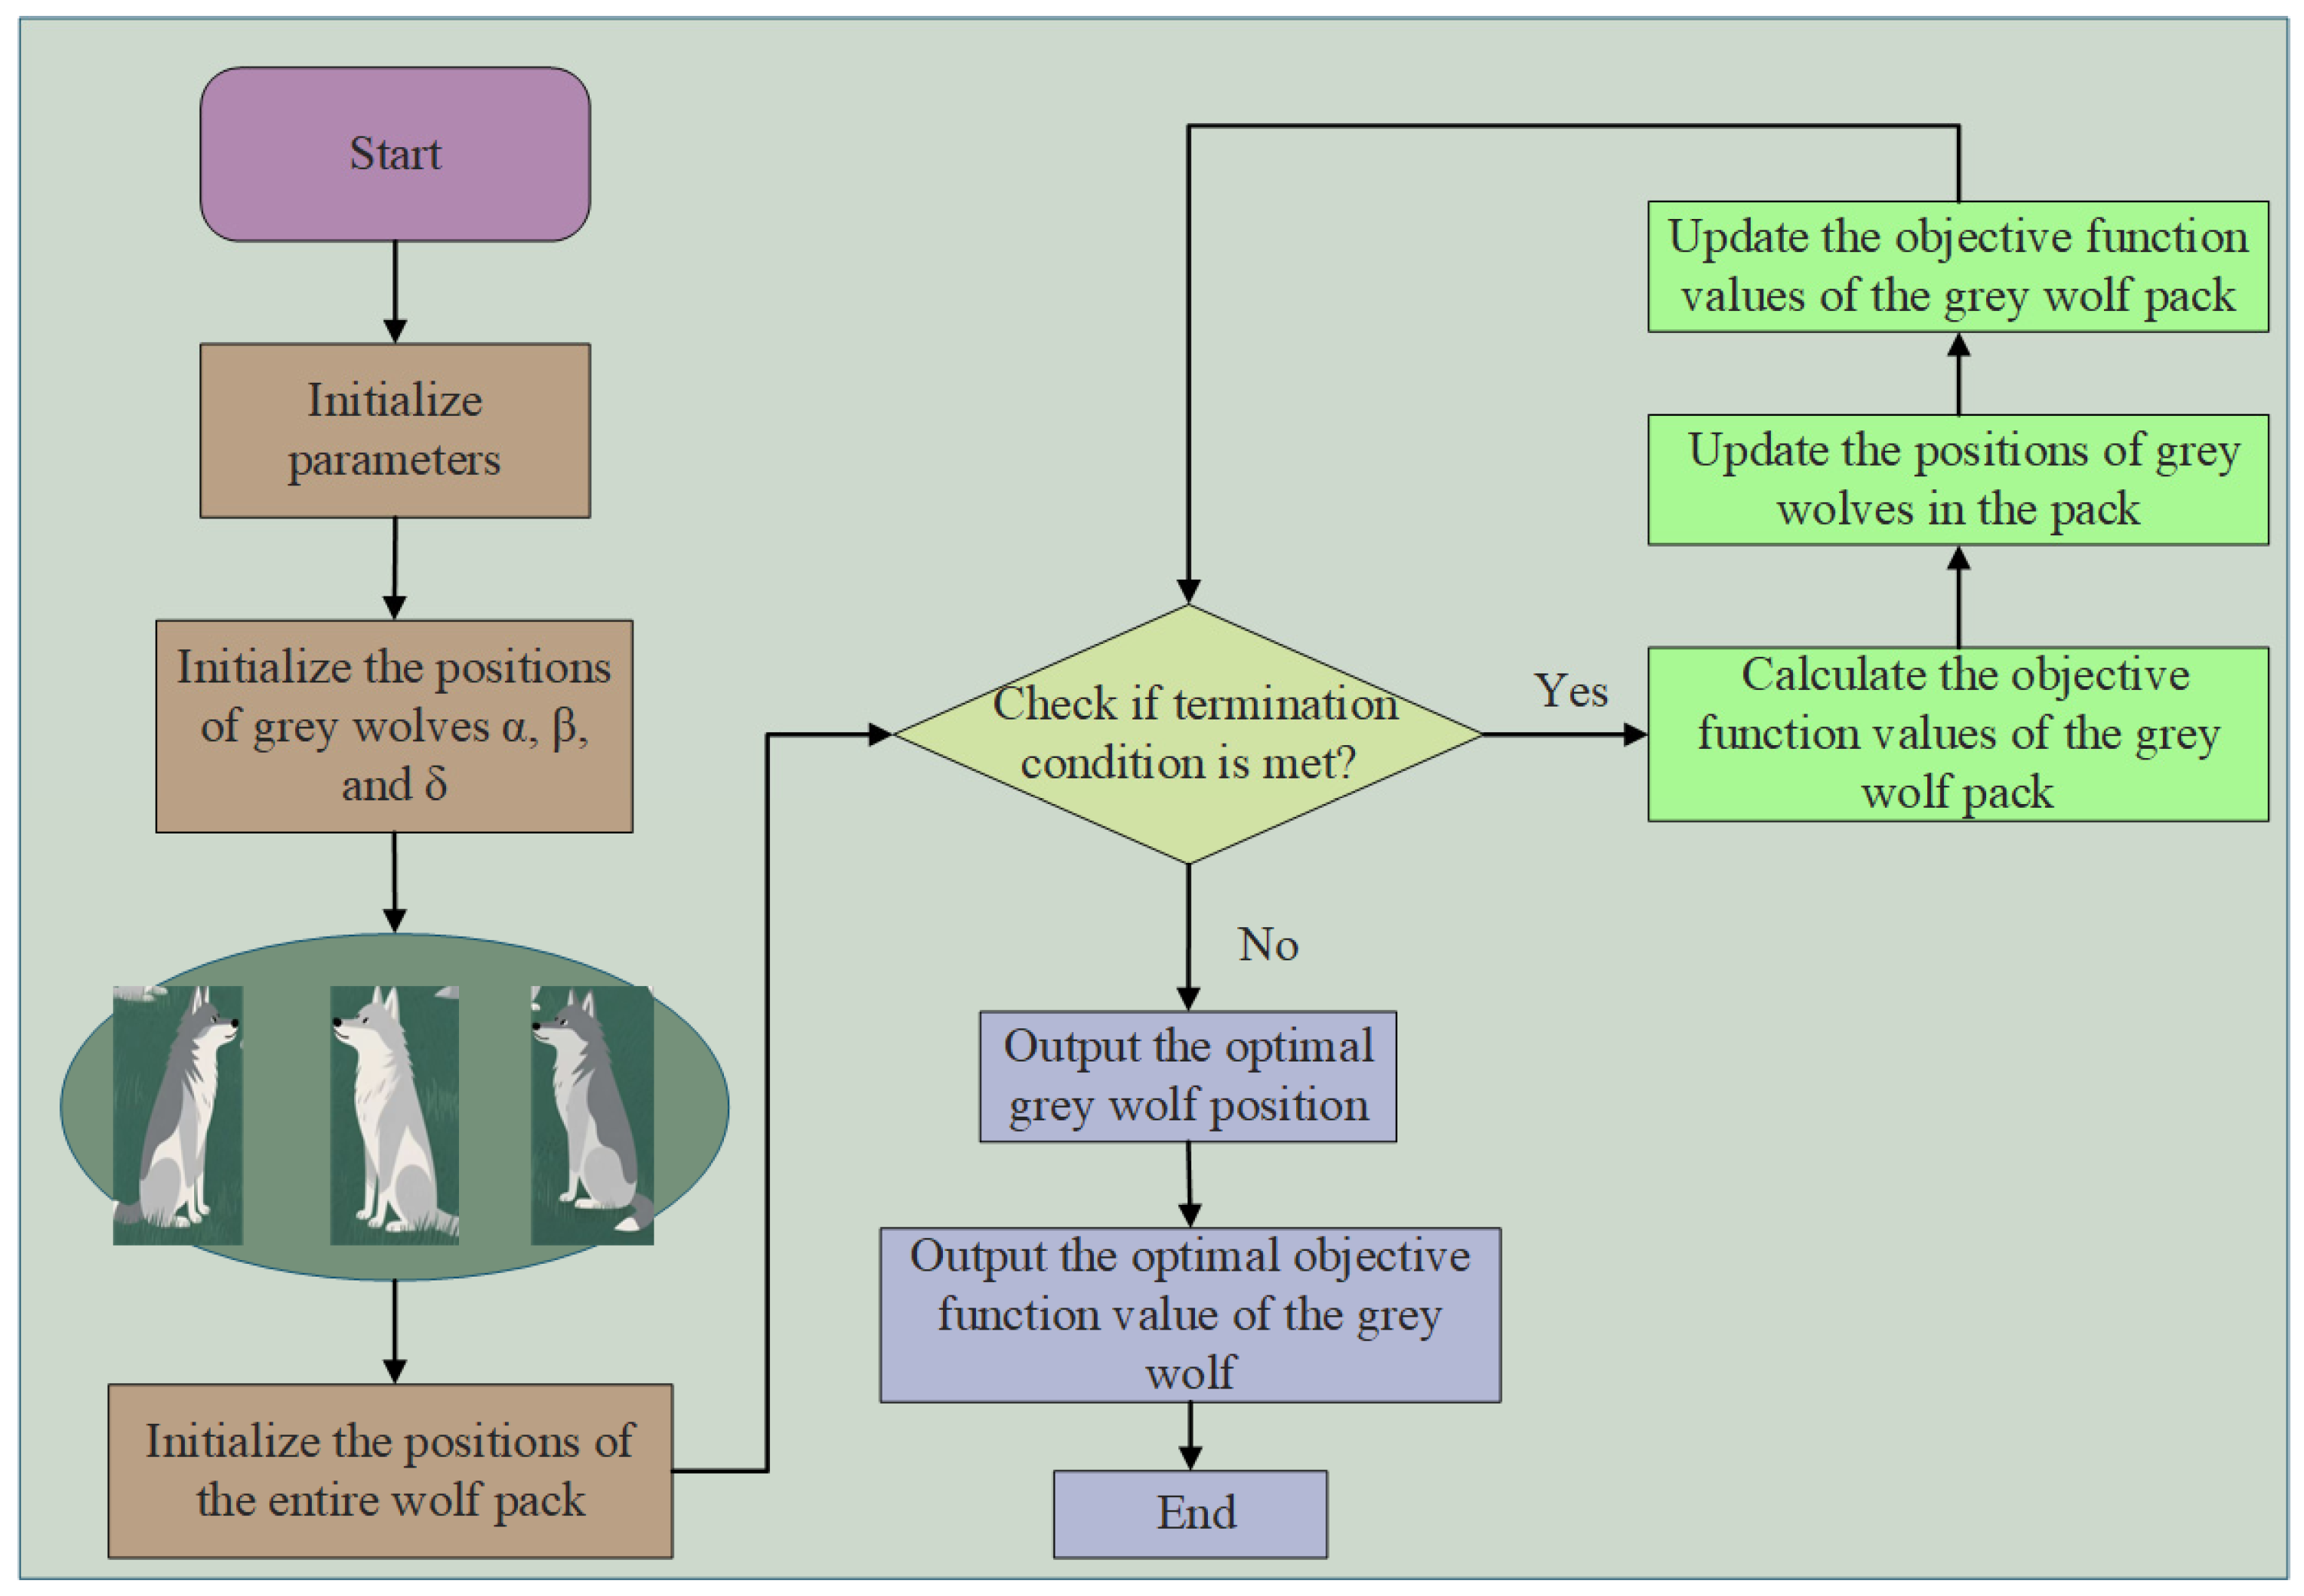
3. Algorithm Introduction
4. Case Study
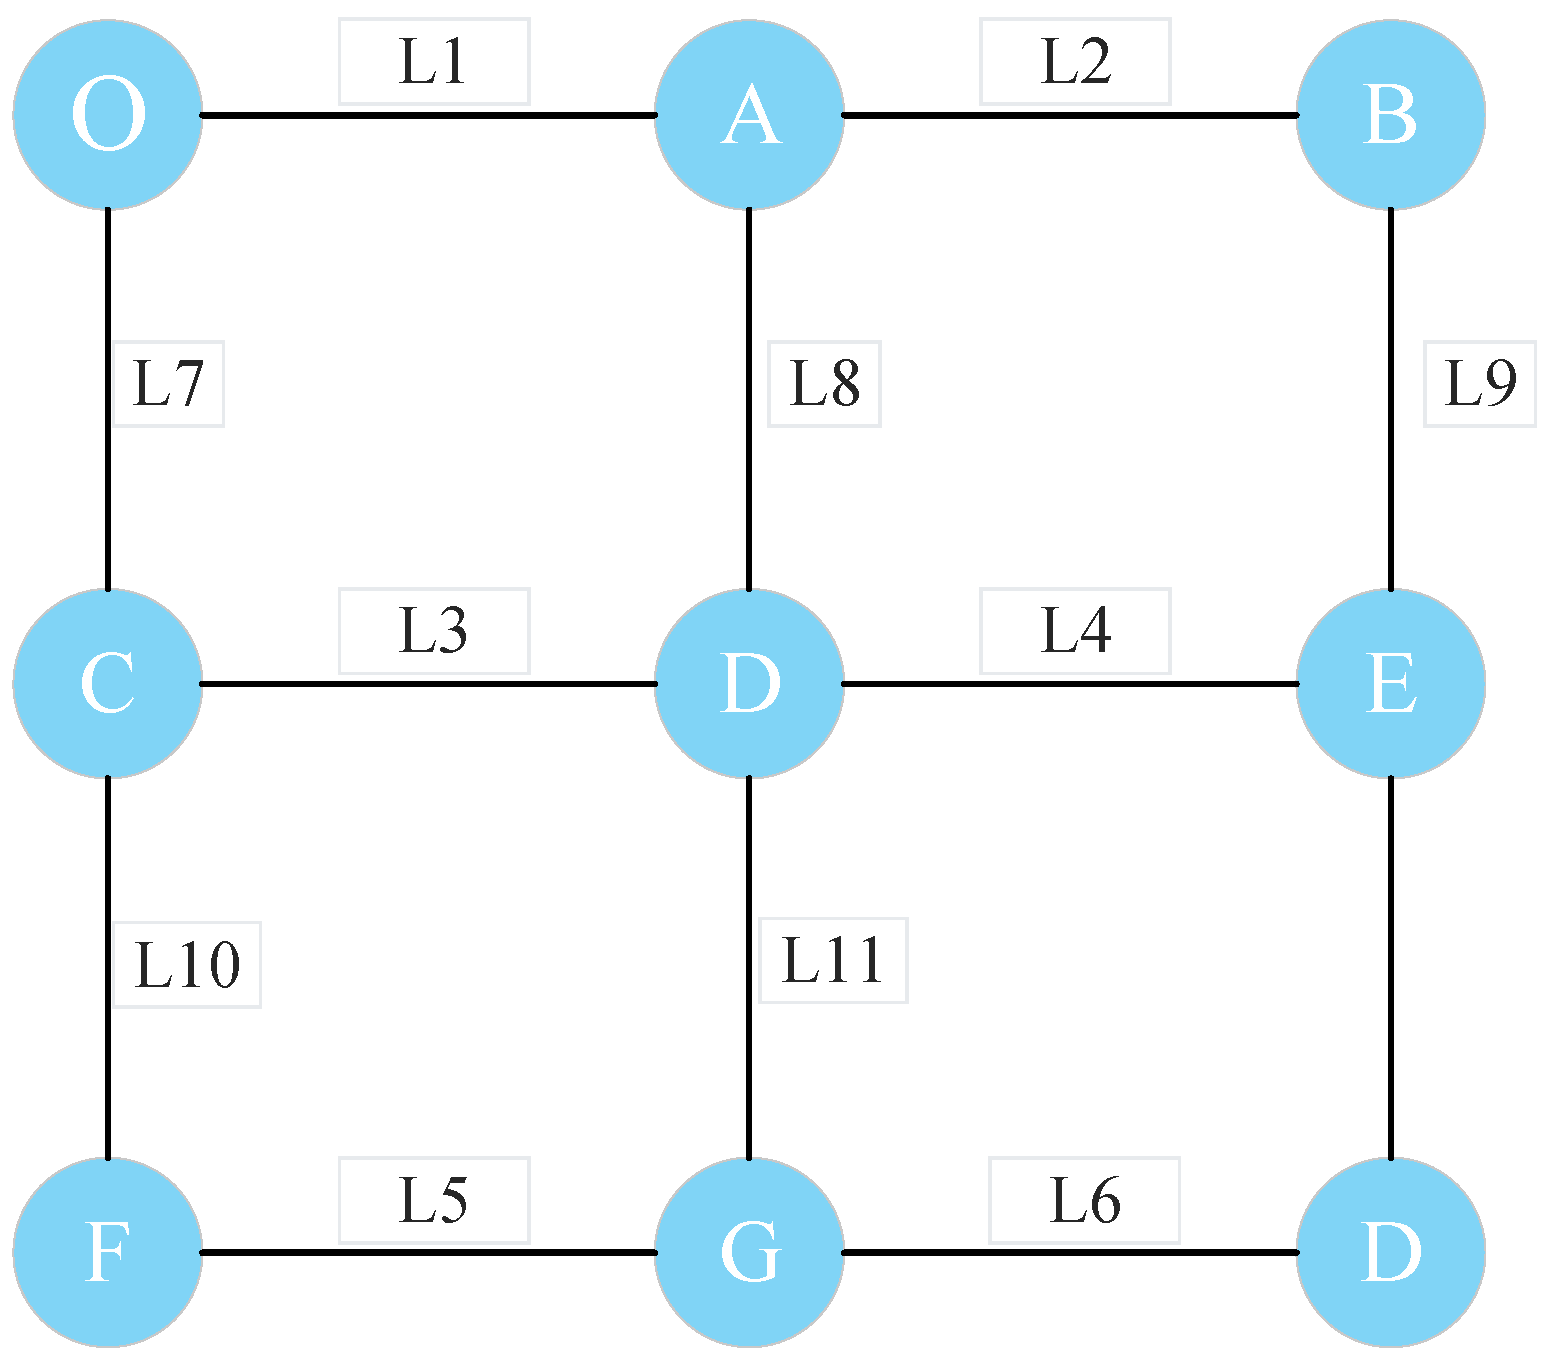
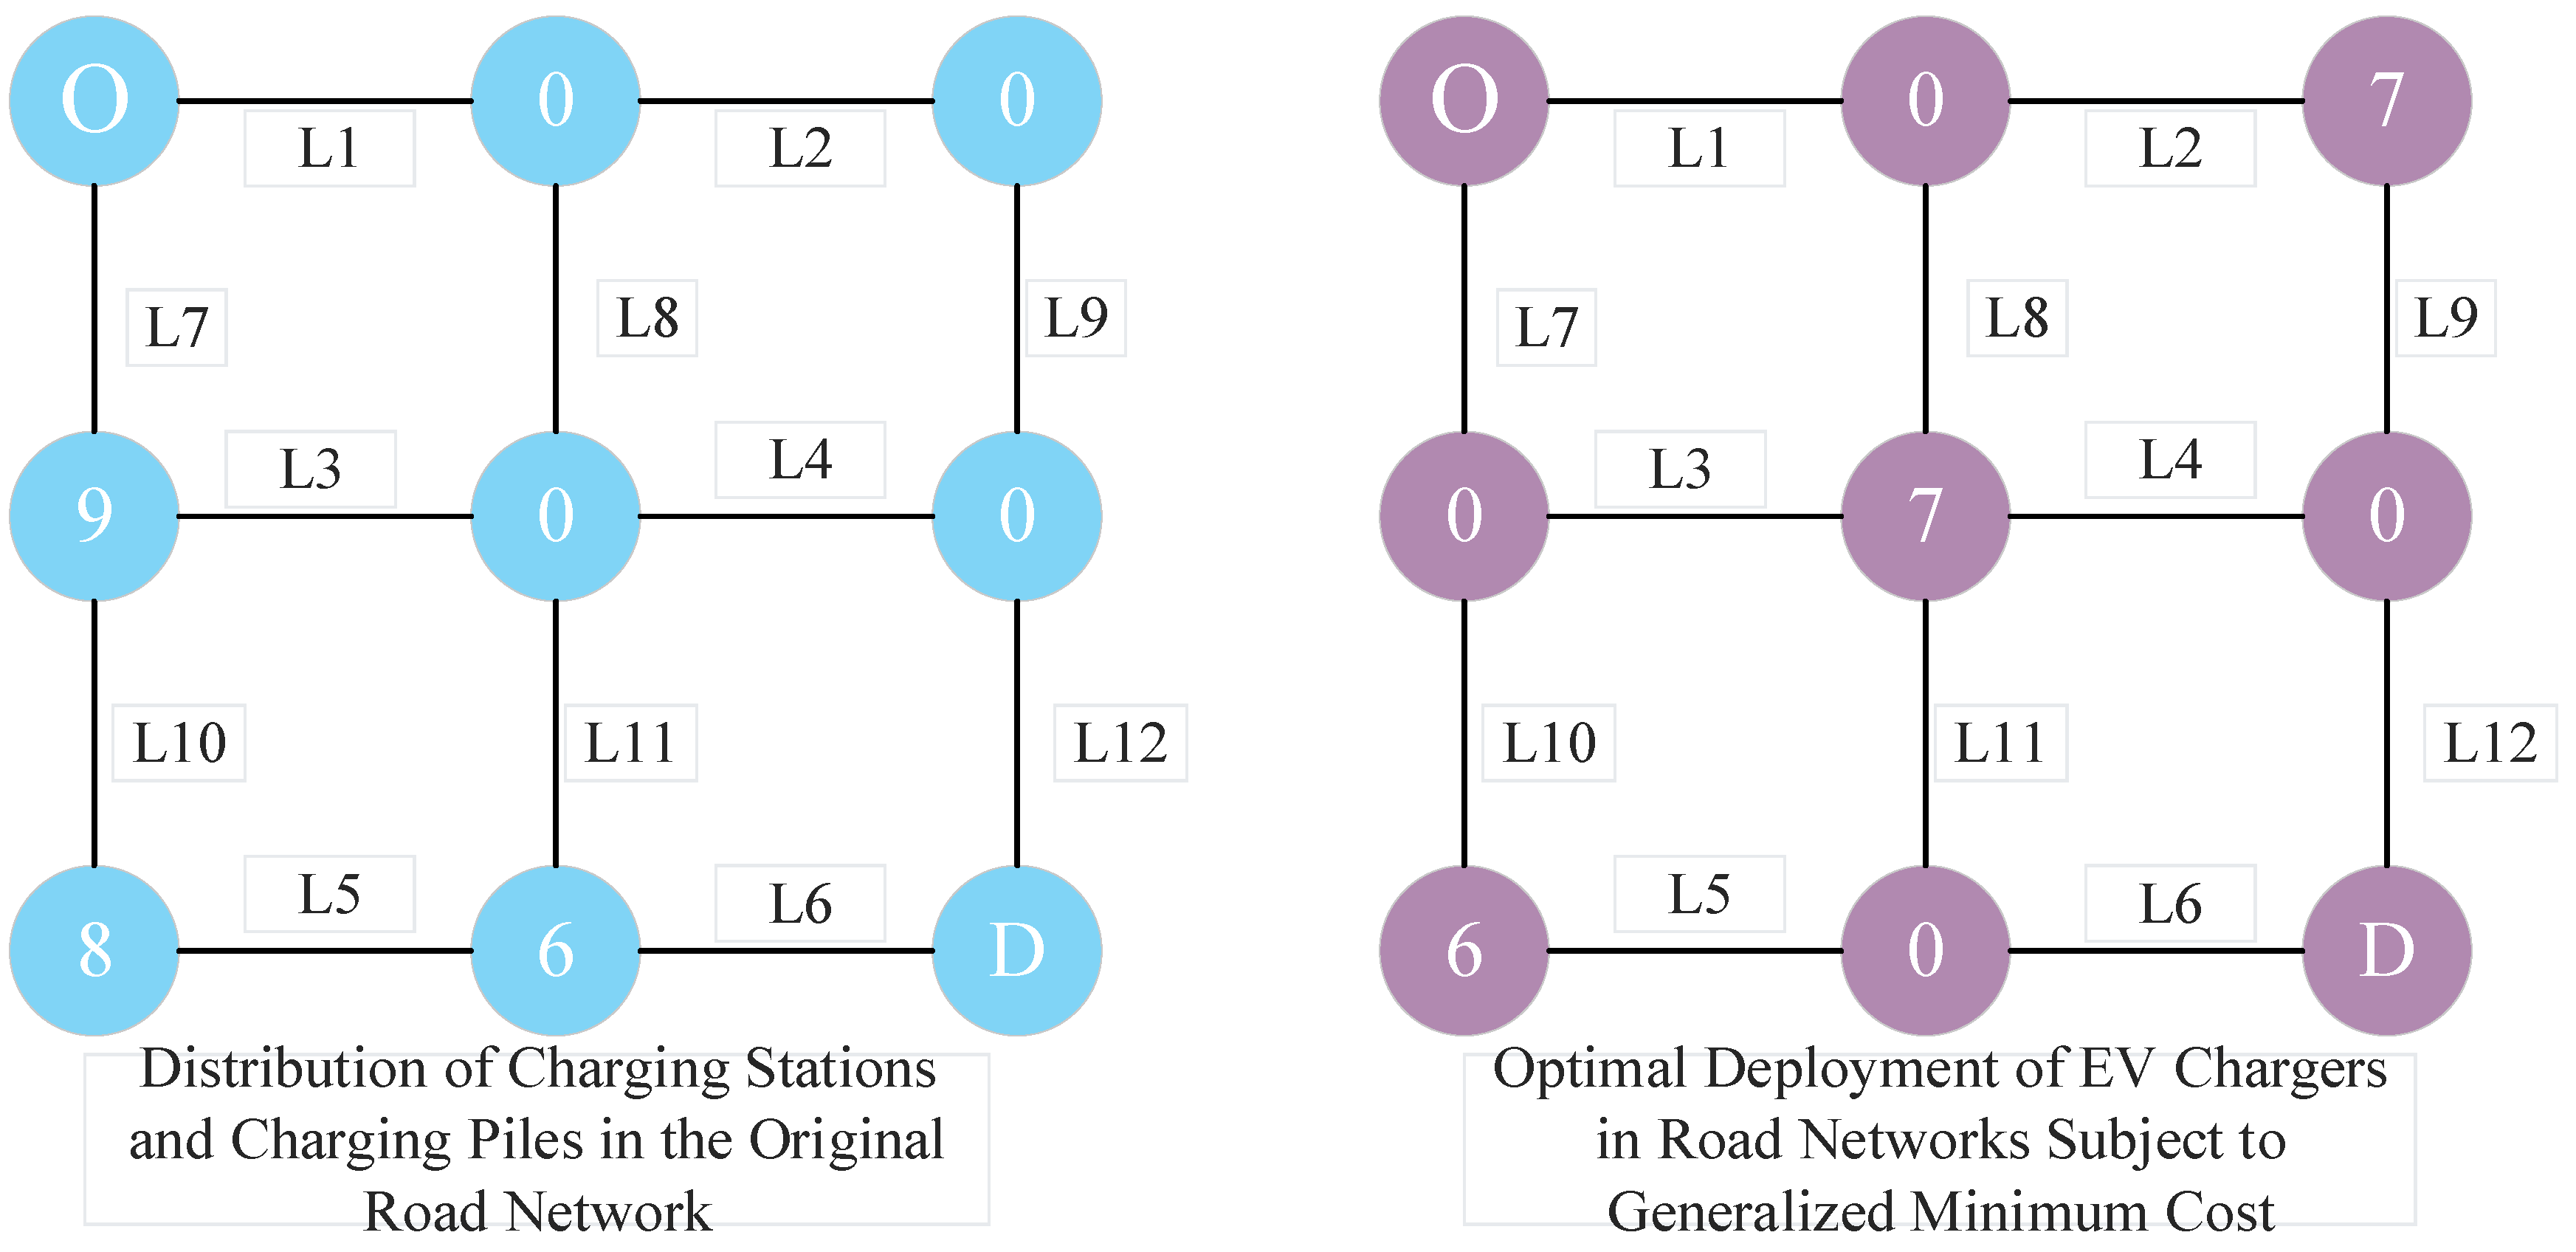
4.1. Example Road Network
| Path 1: L1—L2—L9—L12 | Path 2: L1—L8—L4—L12 |
| Path 3: L1—L8—L11—L6 | Path 4: L7—L3—L4—L12 |
| Path 5: L7—L3—L11—L6 | Path 6: L7—L10—L5—L6 |
4.2. Parameter Settings
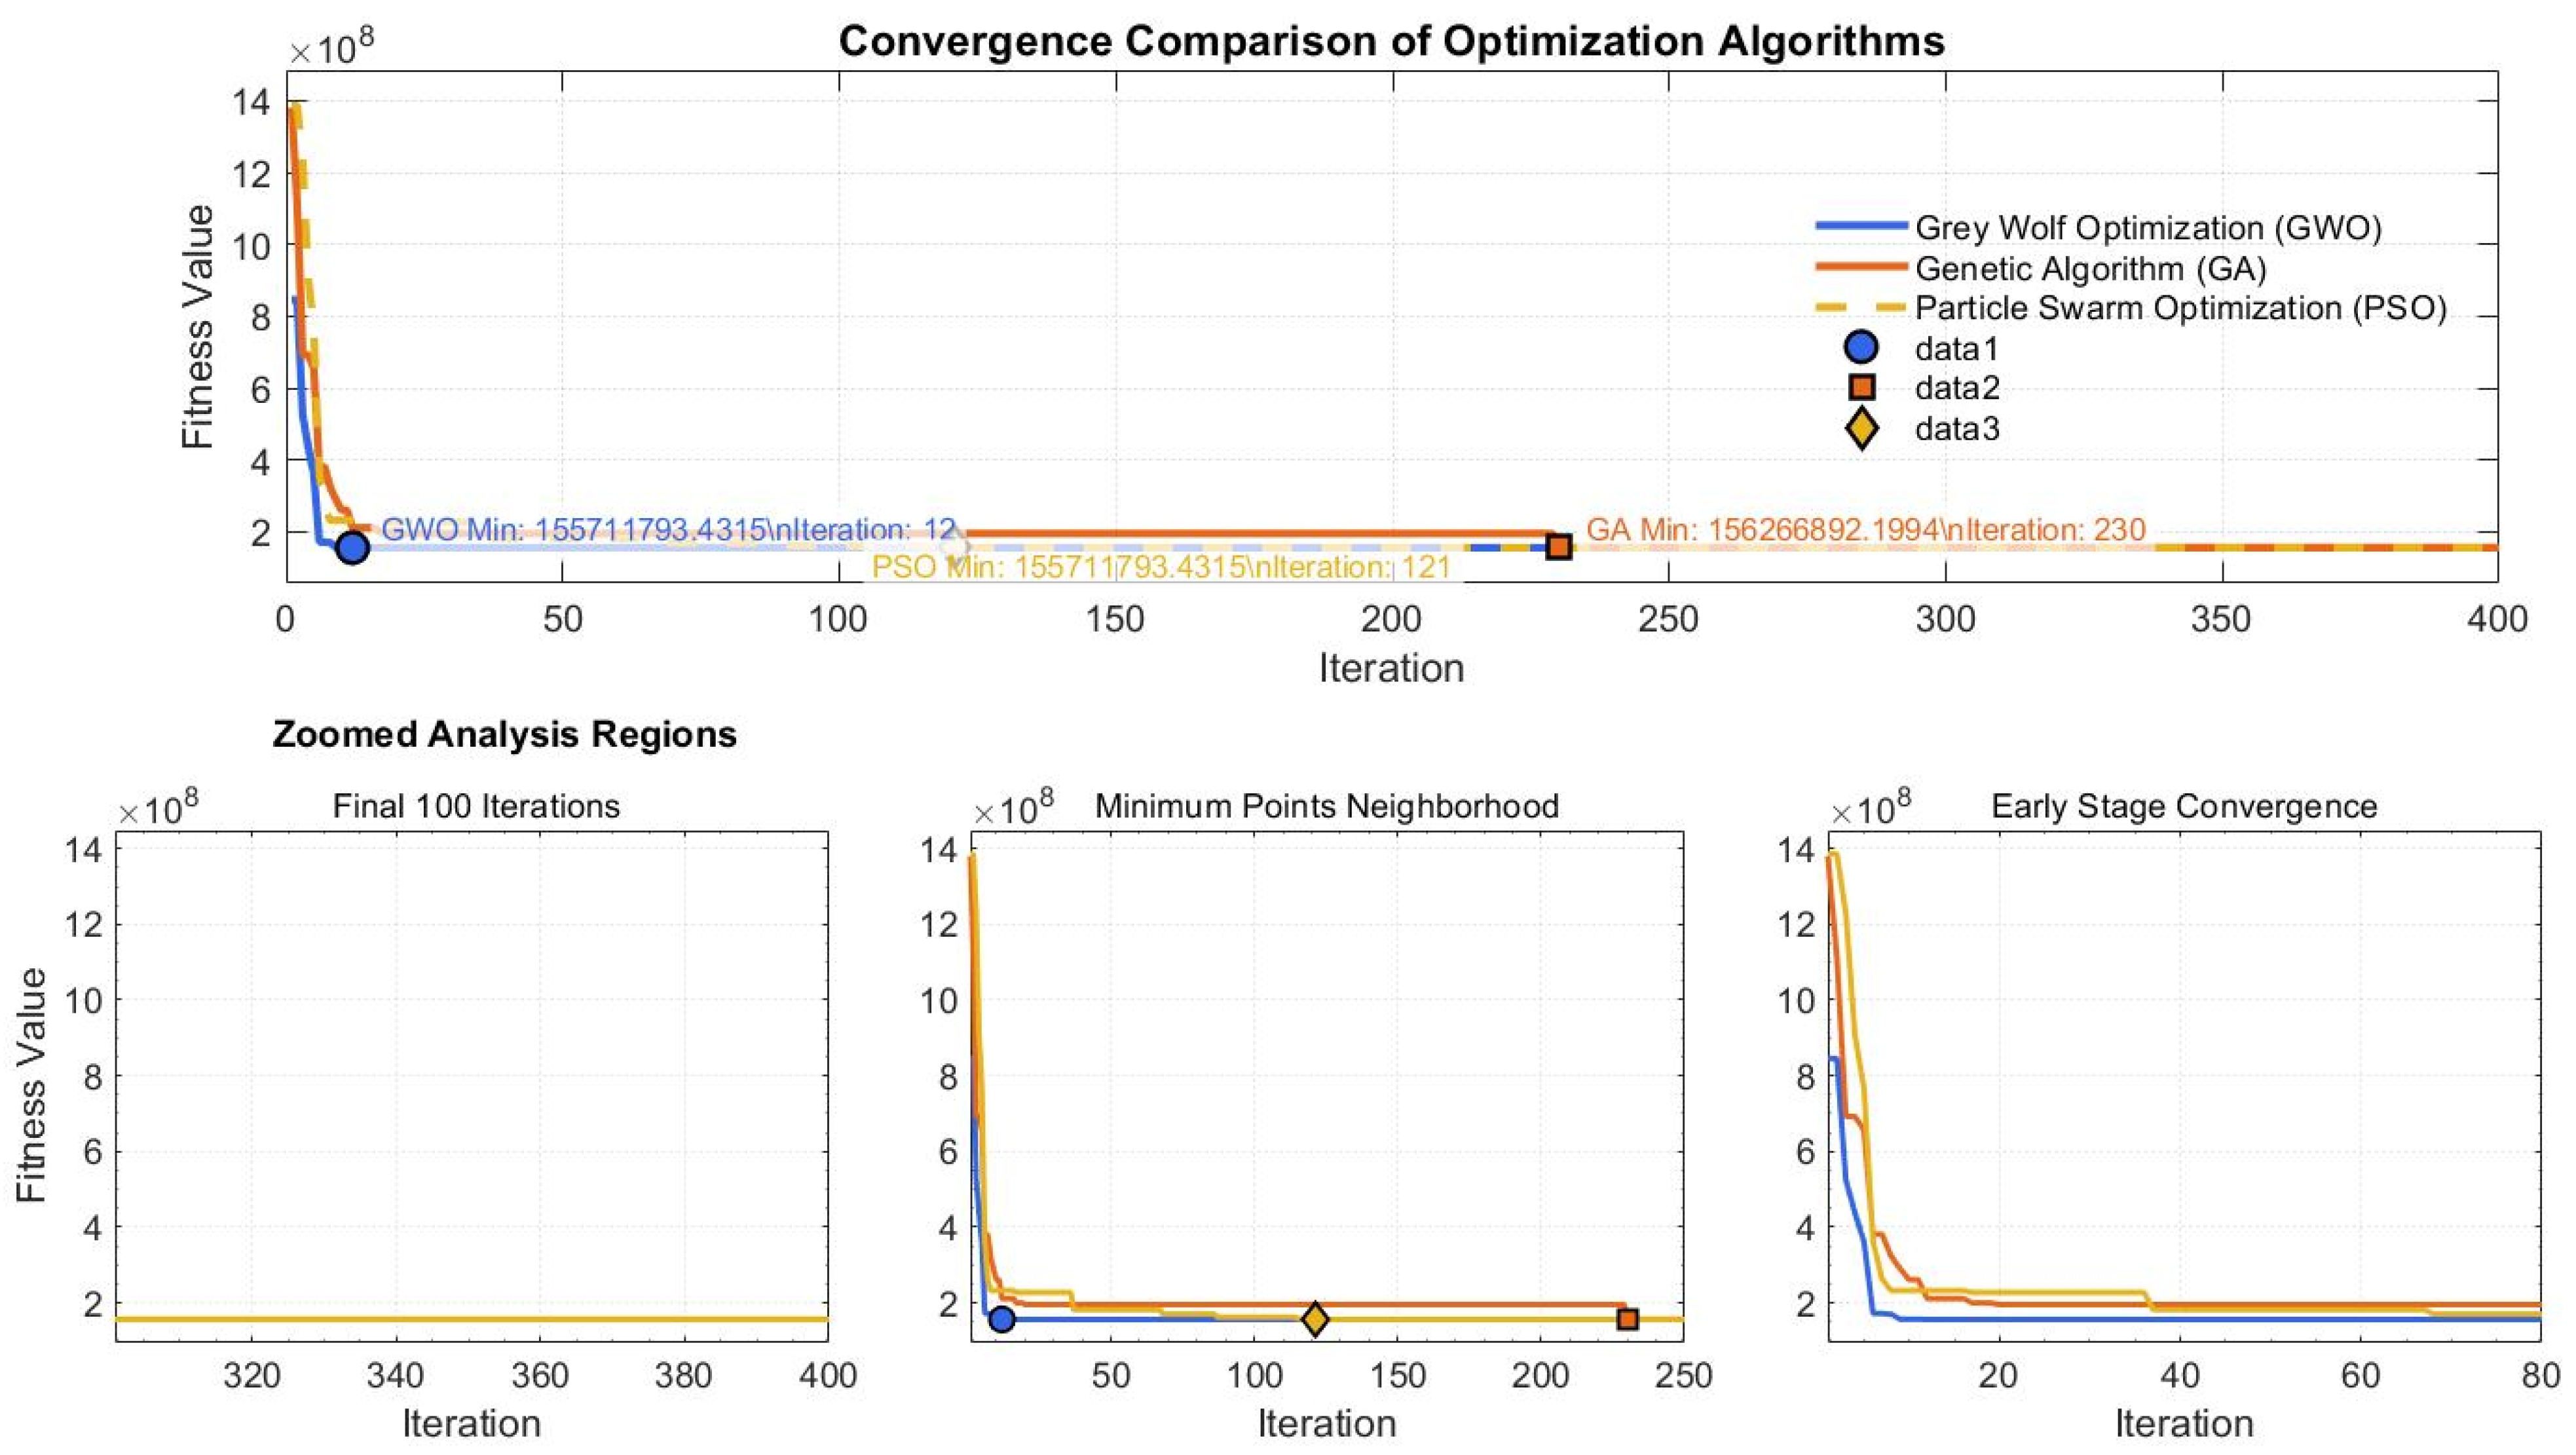
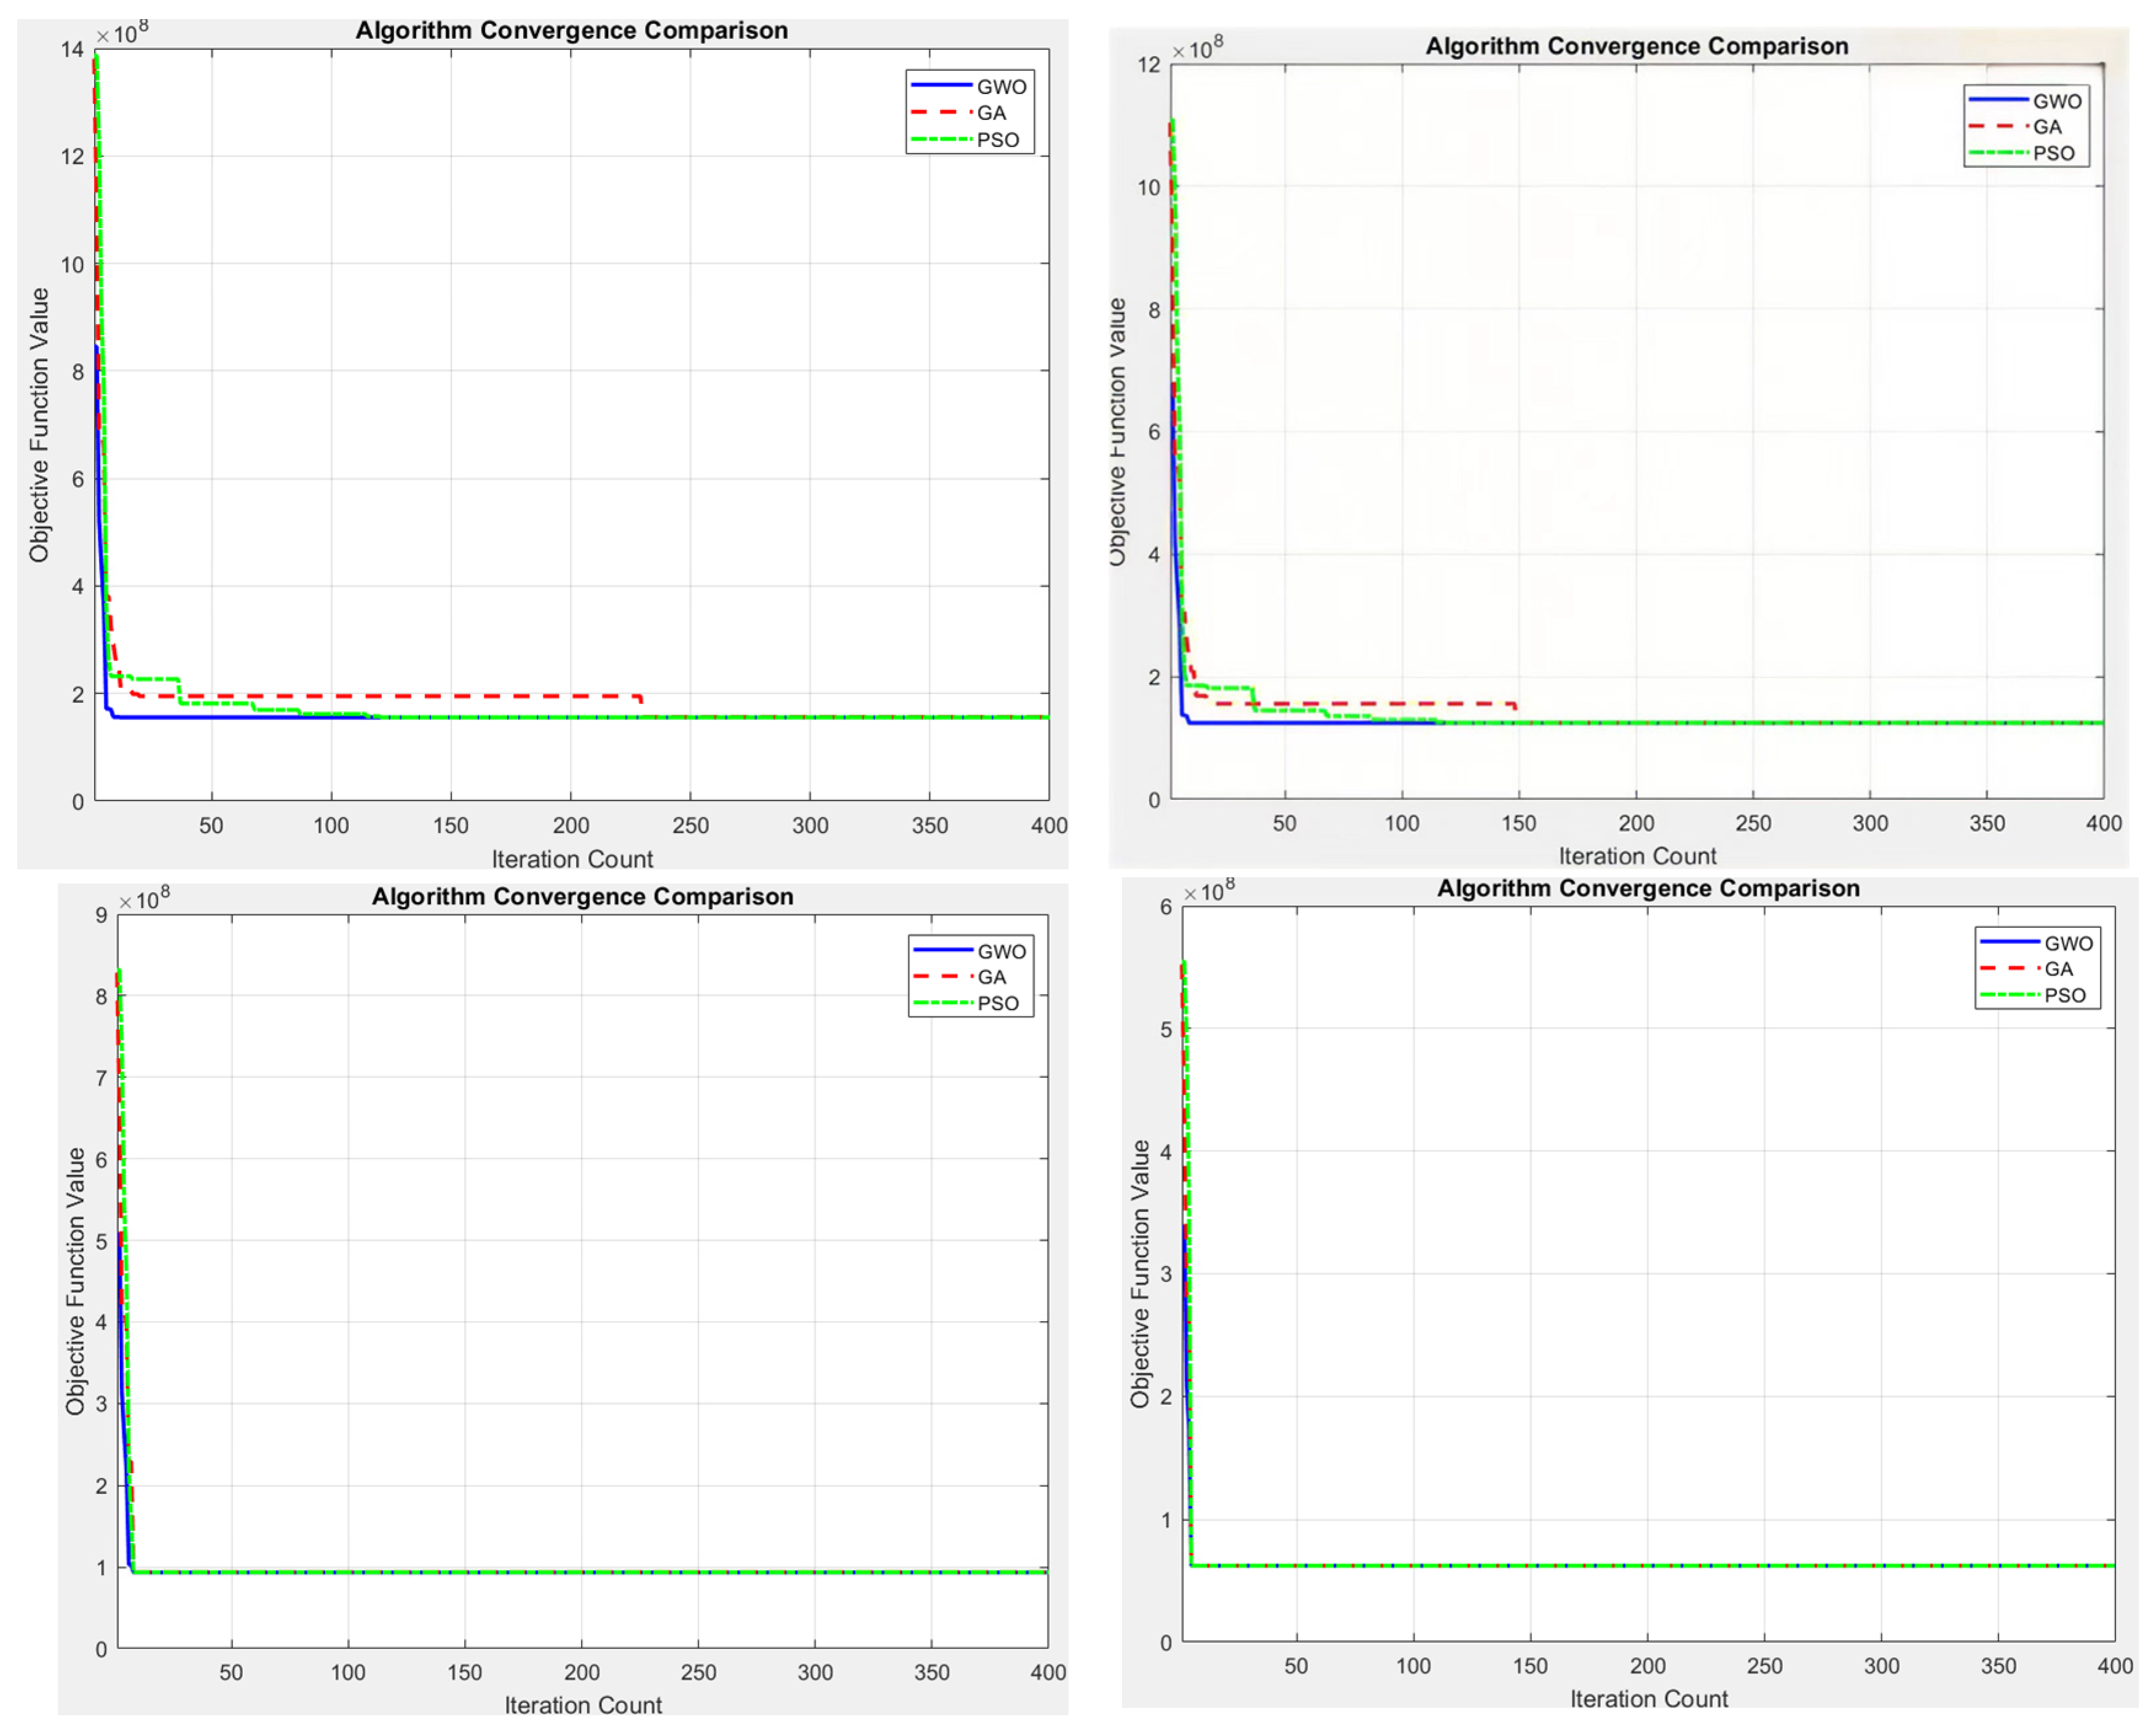
4.3. Result Analysis
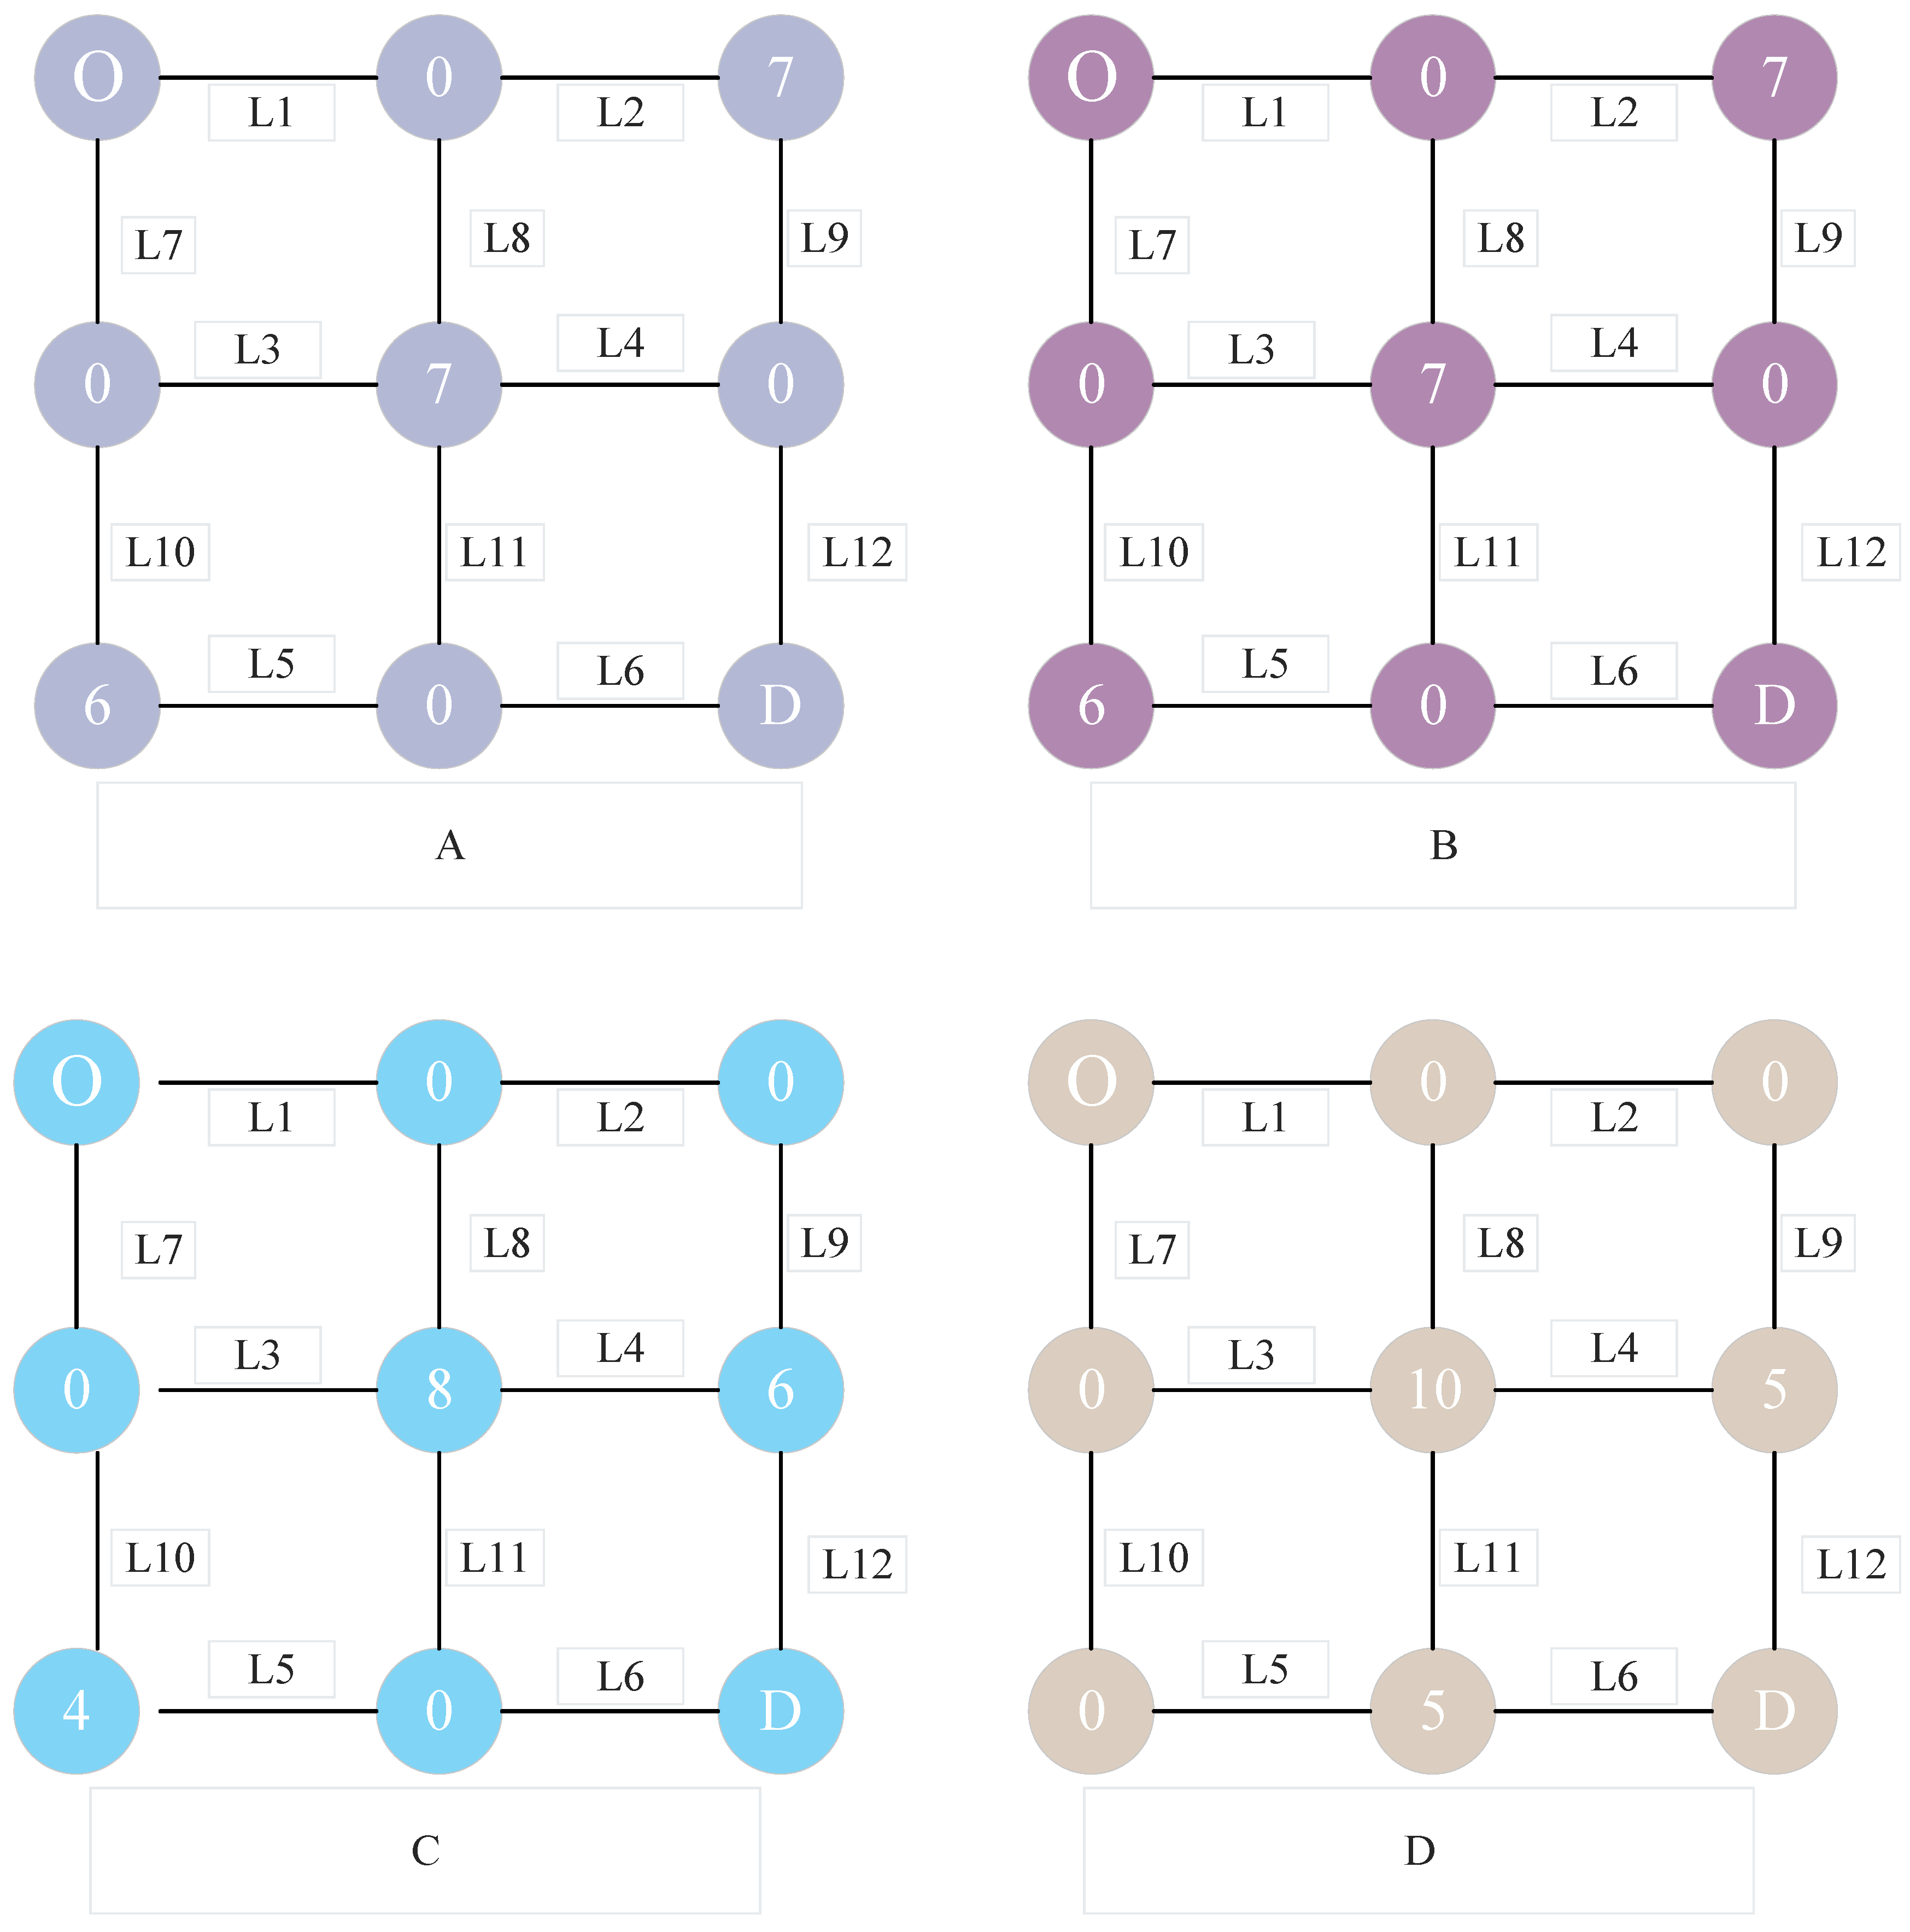
4.4. Sensitivity Analysis
5. Conclusions
Author Contributions
Funding
Data Availability Statement
Acknowledgments
Conflicts of Interest
Appendix A

| Notation | Descriptions |
|---|---|
| nodes | |
| road sections | |
| starting point, | |
| terminal point, | |
| OD pairs | |
| set of paths between | |
| traffic of the path between | |
| traffic flow, | |
| travel time | |
| transit time | |
| A binary variable indicating if a link is on the path for an OD pair | |
| road capacity | |
| road distance | |
| speed | |
| initial power consumption | |
| state of charge | |
| waiting time for charging within the station | |
| A binary variable indicating if EV is charged at charging station | |
| A binary variable for locating a charging station at | |
| quality of electric vehicles | |
| road rolling friction coefficient | |
| charging efficiency of charging stations | |
| number of charging stations | |
| charging station service capability | |
| average charging time for electric vehicles | |
| service intensity of charging stations | |
| average waiting time within the charging station | |
| maximum waiting time that customers can accept | |
| total investment quantity of charging stations | |
| price of electricity | |
| per capita hourly income | |
| power of electric vehicle engine | |
| road speed limit standards | |
| average power consumption per kilometer |
References
- Cui, Q.; Li, X.; Bai, X.; He, L.; Liu, M. How the synergy effect between renewable electricity deployment and terminal electrification mitigates transportation sectors’ carbon emissions in China? Transp. Policy 2025, 166, 135–147. [Google Scholar] [CrossRef]
- Hisoğlu, S.; Çömert, R.; Antila, M.; Åman, R.; Huovila, A. Towards solar-energy-assisted electric vehicle charging stations: A literature review on site selection with GIS and MCDM methods. Sustain. Energy Technol. Assess. 2025, 75, 104193. [Google Scholar] [CrossRef]
- Ecer, F.; Pamucar, D.; Demir, G. Decision-analytics-based electric vehicle charging station location selection: A cutting-edge fuzzy rough framework. Energy Rep. 2025, 14, 711–735. [Google Scholar] [CrossRef]
- Gkiotsalitis, K.; Rizopoulos, D.; Merakou, M.; Iliopoulou, C.; Liu, T.; Cats, O. Electric bus charging station location selection problem with slow and fast charging. Appl. Energy 2025, 382, 125242. [Google Scholar] [CrossRef]
- Bilsel, M.; Kilic, H.S.; Kalender, Z.T.; Tuzkaya, G. Multi-objective model for electric vehicle charging station location selection problem for a sustainable transportation infrastructure. Comput. Ind. Eng. 2024, 198, 110695. [Google Scholar] [CrossRef]
- Dimitriadou, A.; Gkiotsalitis, K.; Liu, T.; Cats, O. An exact optimization model for the electric bus charging station location problem under inter-station travel time and energy consumption uncertainties. Transp. Res. Part C Emerg. Technol. 2025, 178, 105182. [Google Scholar] [CrossRef]
- Fan, J.; Du, X.; Wu, M. Application of multi-criteria decision-making method based on improved grade Z-number in site selection of new energy vehicles charging stations. Eng. Appl. Artif. Intell. 2025, 151, 110731. [Google Scholar] [CrossRef]
- He, F.; Wu, D.; Yin, Y.; Guan, Y. Optimal deployment of public charging stations for plug-in hybrid electric vehicles. Transp. Res. Part B Methodol. 2013, 47, 87–101. [Google Scholar] [CrossRef]
- Ademulegun, O.O.; MacArtain, P.; Oni, B.; Hewitt, N.J. Multi-Stage Multi-Criteria Decision Analysis for Siting Electric Vehicle Charging Stations within and across Border Regions. Energies 2022, 15, 9396. [Google Scholar] [CrossRef]
- Yang, X.; Niu, D.; Sun, L.; Ji, Z.; Zhou, J.; Wang, K.; Siqin, Z. A bi-level optimization model for electric vehicle charging strategy based on regional grid load following. J. Clean. Prod. 2021, 325, 129313. [Google Scholar] [CrossRef]
- Wang, B.; Liang, Y.; Zheng, T.; Yuan, M.; Zhang, H. Multi-objective site selection optimization of the gas-gathering station using NSGA-II. Process Saf. Environ. Prot. 2018, 119, 350–359. [Google Scholar] [CrossRef]
- Liu, J.; Xiao, Y.; Wang, D.; Pang, Y. Optimization of site selection for construction and demolition waste recycling plant using genetic algorithm. Neural Comput. Appl. 2019, 31 (Suppl. S1), S233–S245. [Google Scholar] [CrossRef]
- Laddha, N.; Vardhan, P.; Machavarapu, P.K. Innovative Urban Planning: A Heuristic Approach Using the Simulated Annealing Algorithm to Optimize the Land Use Allocation for Enhancing Public Transportation Ridership. Transp. Res. Procedia 2025, 90, 686–693. [Google Scholar] [CrossRef]
- Altaf, M.; Yousif, M.; Ijaz, H.; Rashid, M.; Abbas, N.; Khan, M.A.; Waseem, M.; Mohammed Saleh, A. PSO-based optimal placement of electric vehicle charging stations in a distribution network in smart grid environment incorporating backward forward sweep method. IET Renew. Power Gener. 2024, 18, 3173–3187. [Google Scholar] [CrossRef]
- Cui, Q.; Li, Q.; Li, G.; Li, Z.; Han, X.; Lee, H.P.; Liang, Y.; Wang, B.; Jiang, J.; Wu, C. Globally-optimal prediction-based adaptive mutation particle swarm optimization. Inf. Sci. 2017, 418–419, 186–217. [Google Scholar] [CrossRef]
- Elghardouf, N.; Ennaciri, Y.; Elakkary, A.; Sefiani, N. Multi-loop active disturbance rejection control and PID control strategy for poultry house based on GA, PSO and GWO algorithms. Heliyon 2024, 10, e29579. [Google Scholar] [CrossRef] [PubMed]
- Garg, H. A hybrid PSO-GA algorithm for constrained optimization problems. Appl. Math. Comput. 2016, 274, 292–305. [Google Scholar] [CrossRef]
- Amirteimoori, A.; Mahdavi, I.; Solimanpur, M.; Ali, S.S.; Tirkolaee, E.B. A parallel hybrid PSO-GA algorithm for the flexible flow-shop scheduling with transportation. Comput. Ind. Eng. 2022, 173, 108672. [Google Scholar] [CrossRef]
- Yang, J.; Yan, F.; Zhang, J.; Peng, C. Hybrid chaos game and grey wolf optimization algorithms for UAV path planning. Appl. Math. Model. 2025, 142, 115979. [Google Scholar] [CrossRef]
- Wardrop, J.G. Some Theoretical Aspects of Road Traffic Research. In Proceedings of the Institution of Civil Engineers; ICE Publishing: London, UK, 1952; pp. 325–362. [Google Scholar]
| Vehicle Classification | Urban Roads |
|---|---|
| Electric Vehicles | 1.0 |
| Passenger Cars | 1.0 |
| Medium/Large Buses | 2.0 |
| Light Trucks | 1.0 |
| Heavy/Medium Trucks | 2.0 |
| Tricycles | 0.6 |
| Motorcycles | 0.4 |
| Bicycles | 0.2 |
| E-bikes | 0.3 |
| Other Motor Vehicles | 1.0 |
| Other Non-motorized Vehicles | 2.0 |
| Road | Road | ||||||
|---|---|---|---|---|---|---|---|
| 1 | 380 | 9 | 1.9 | 7 | 200 | 7 | 1 |
| 2 | 480 | 12 | 2.4 | 8 | 140 | 7 | 1 |
| 3 | 510 | 9 | 1.9 | 9 | 120 | 6 | 0.9 |
| 4 | 640 | 12 | 2.4 | 10 | 280 | 10 | 1.4 |
| 5 | 380 | 10 | 1.9 | 11 | 190 | 10 | 1.4 |
| 6 | 440 | 12 | 2.2 | 12 | 190 | 10 | 1.4 |
| Parameter | Meaning | Value | Parameter | Significance | Value |
|---|---|---|---|---|---|
| The amount of electricity when fully charged | 50 | Total traffic of vehicles on the road network | 2358 | ||
| Charging efficiency of charging stations | 60 | Price per kilowatt hour per unit of electricity | 1 | ||
| Total number of charging stations | 20 | Per capita hourly wage | 13.7 | ||
| Quality of electric vehicles | 1700 | The maximum acceptable waiting time for customers | 10 | ||
| Maximum speed limit on the road | 60 | Road rolling friction force | 0.016 | ||
| Average power consumption per kilometer | 0.2 |
| Comparison Between Actual and Algorithm | GWO | GA | PSO | Actual User Travel Situation |
|---|---|---|---|---|
| Generalized minimum cost | 155,711,793.43 | 156,266,892.20 | 156,011,872.56 | 1,896,387,349.53 |
Disclaimer/Publisher’s Note: The statements, opinions and data contained in all publications are solely those of the individual author(s) and contributor(s) and not of MDPI and/or the editor(s). MDPI and/or the editor(s) disclaim responsibility for any injury to people or property resulting from any ideas, methods, instructions or products referred to in the content. |
© 2025 by the authors. Licensee MDPI, Basel, Switzerland. This article is an open access article distributed under the terms and conditions of the Creative Commons Attribution (CC BY) license (https://creativecommons.org/licenses/by/4.0/).
Share and Cite
Ma, M.; Wang, F.; Xiong, L.; Wang, Y.; Li, W. Charging Station Siting and Capacity Determination Based on a Generalized Least-Cost Model of Traffic Distribution. Algorithms 2025, 18, 479. https://doi.org/10.3390/a18080479
Ma M, Wang F, Xiong L, Wang Y, Li W. Charging Station Siting and Capacity Determination Based on a Generalized Least-Cost Model of Traffic Distribution. Algorithms. 2025; 18(8):479. https://doi.org/10.3390/a18080479
Chicago/Turabian StyleMa, Mingzhao, Feng Wang, Lirong Xiong, Yuhonghao Wang, and Wenxin Li. 2025. "Charging Station Siting and Capacity Determination Based on a Generalized Least-Cost Model of Traffic Distribution" Algorithms 18, no. 8: 479. https://doi.org/10.3390/a18080479
APA StyleMa, M., Wang, F., Xiong, L., Wang, Y., & Li, W. (2025). Charging Station Siting and Capacity Determination Based on a Generalized Least-Cost Model of Traffic Distribution. Algorithms, 18(8), 479. https://doi.org/10.3390/a18080479