
Comparison of Meta-Heuristic Optimization Algorithms for Global Maximum Power Point Tracking of Partially Shaded Solar Photovoltaic Systems


Abstract
1. Introduction
- A statistical investigation of modern heuristic optimization methods for (GMPPT) in photovoltaic (PV) systems under partial shading conditions has been presented;
- Comprehensive analysis of the challenges associated with heuristic optimization-based GMPPT techniques, focusing on their exploitative and explorative search capabilities;
- Introduction of a novel GMPPT method called Chimp Optimization Algorithm, which effectively balances the exploitative and explorative search capabilities;
- Statistical comparisons of different heuristic optimization-based GMPPT techniques in terms of tracking routines, accumulated energy and tracking efficiency.
Applications of Metaheuristics Algorithm
- ➢
- Metaheuristics algorithms offer a powerful approach to tackling complex optimization problems in diverse domains. Their flexibility, robustness and ability to find satisfactory solutions make them invaluable tools for real world problems as presented below.
- ➢
- Metaheuristics are widely used to tackle problems with a large number of possible combinations, such as the Traveling Salesman Problem, Knapsack Problem or Job Scheduling. Examples of metaheuristics for combinatorial optimization include GA, PSO, ACO and Simulated Annealing (SA).
- ➢
- Metaheuristics are used for optimizing the design parameters of complex systems. For example, they can optimize the shape of an aircraft wing, the layout of an electric circuit, electromagnetic device or the parameters of a chemical process.
- ➢
- Metaheuristics are utilized in optimizing transportation routes, vehicle routing problems and logistics planning. They help find efficient paths for deliveries, minimizing travel time and costs.
- ➢
- Metaheuristics can optimize production schedules, inventory management, and resource allocation in manufacturing processes.
- ➢
- Metaheuristics can be used to create computer programs that can play games effectively by finding near-optimal strategies.
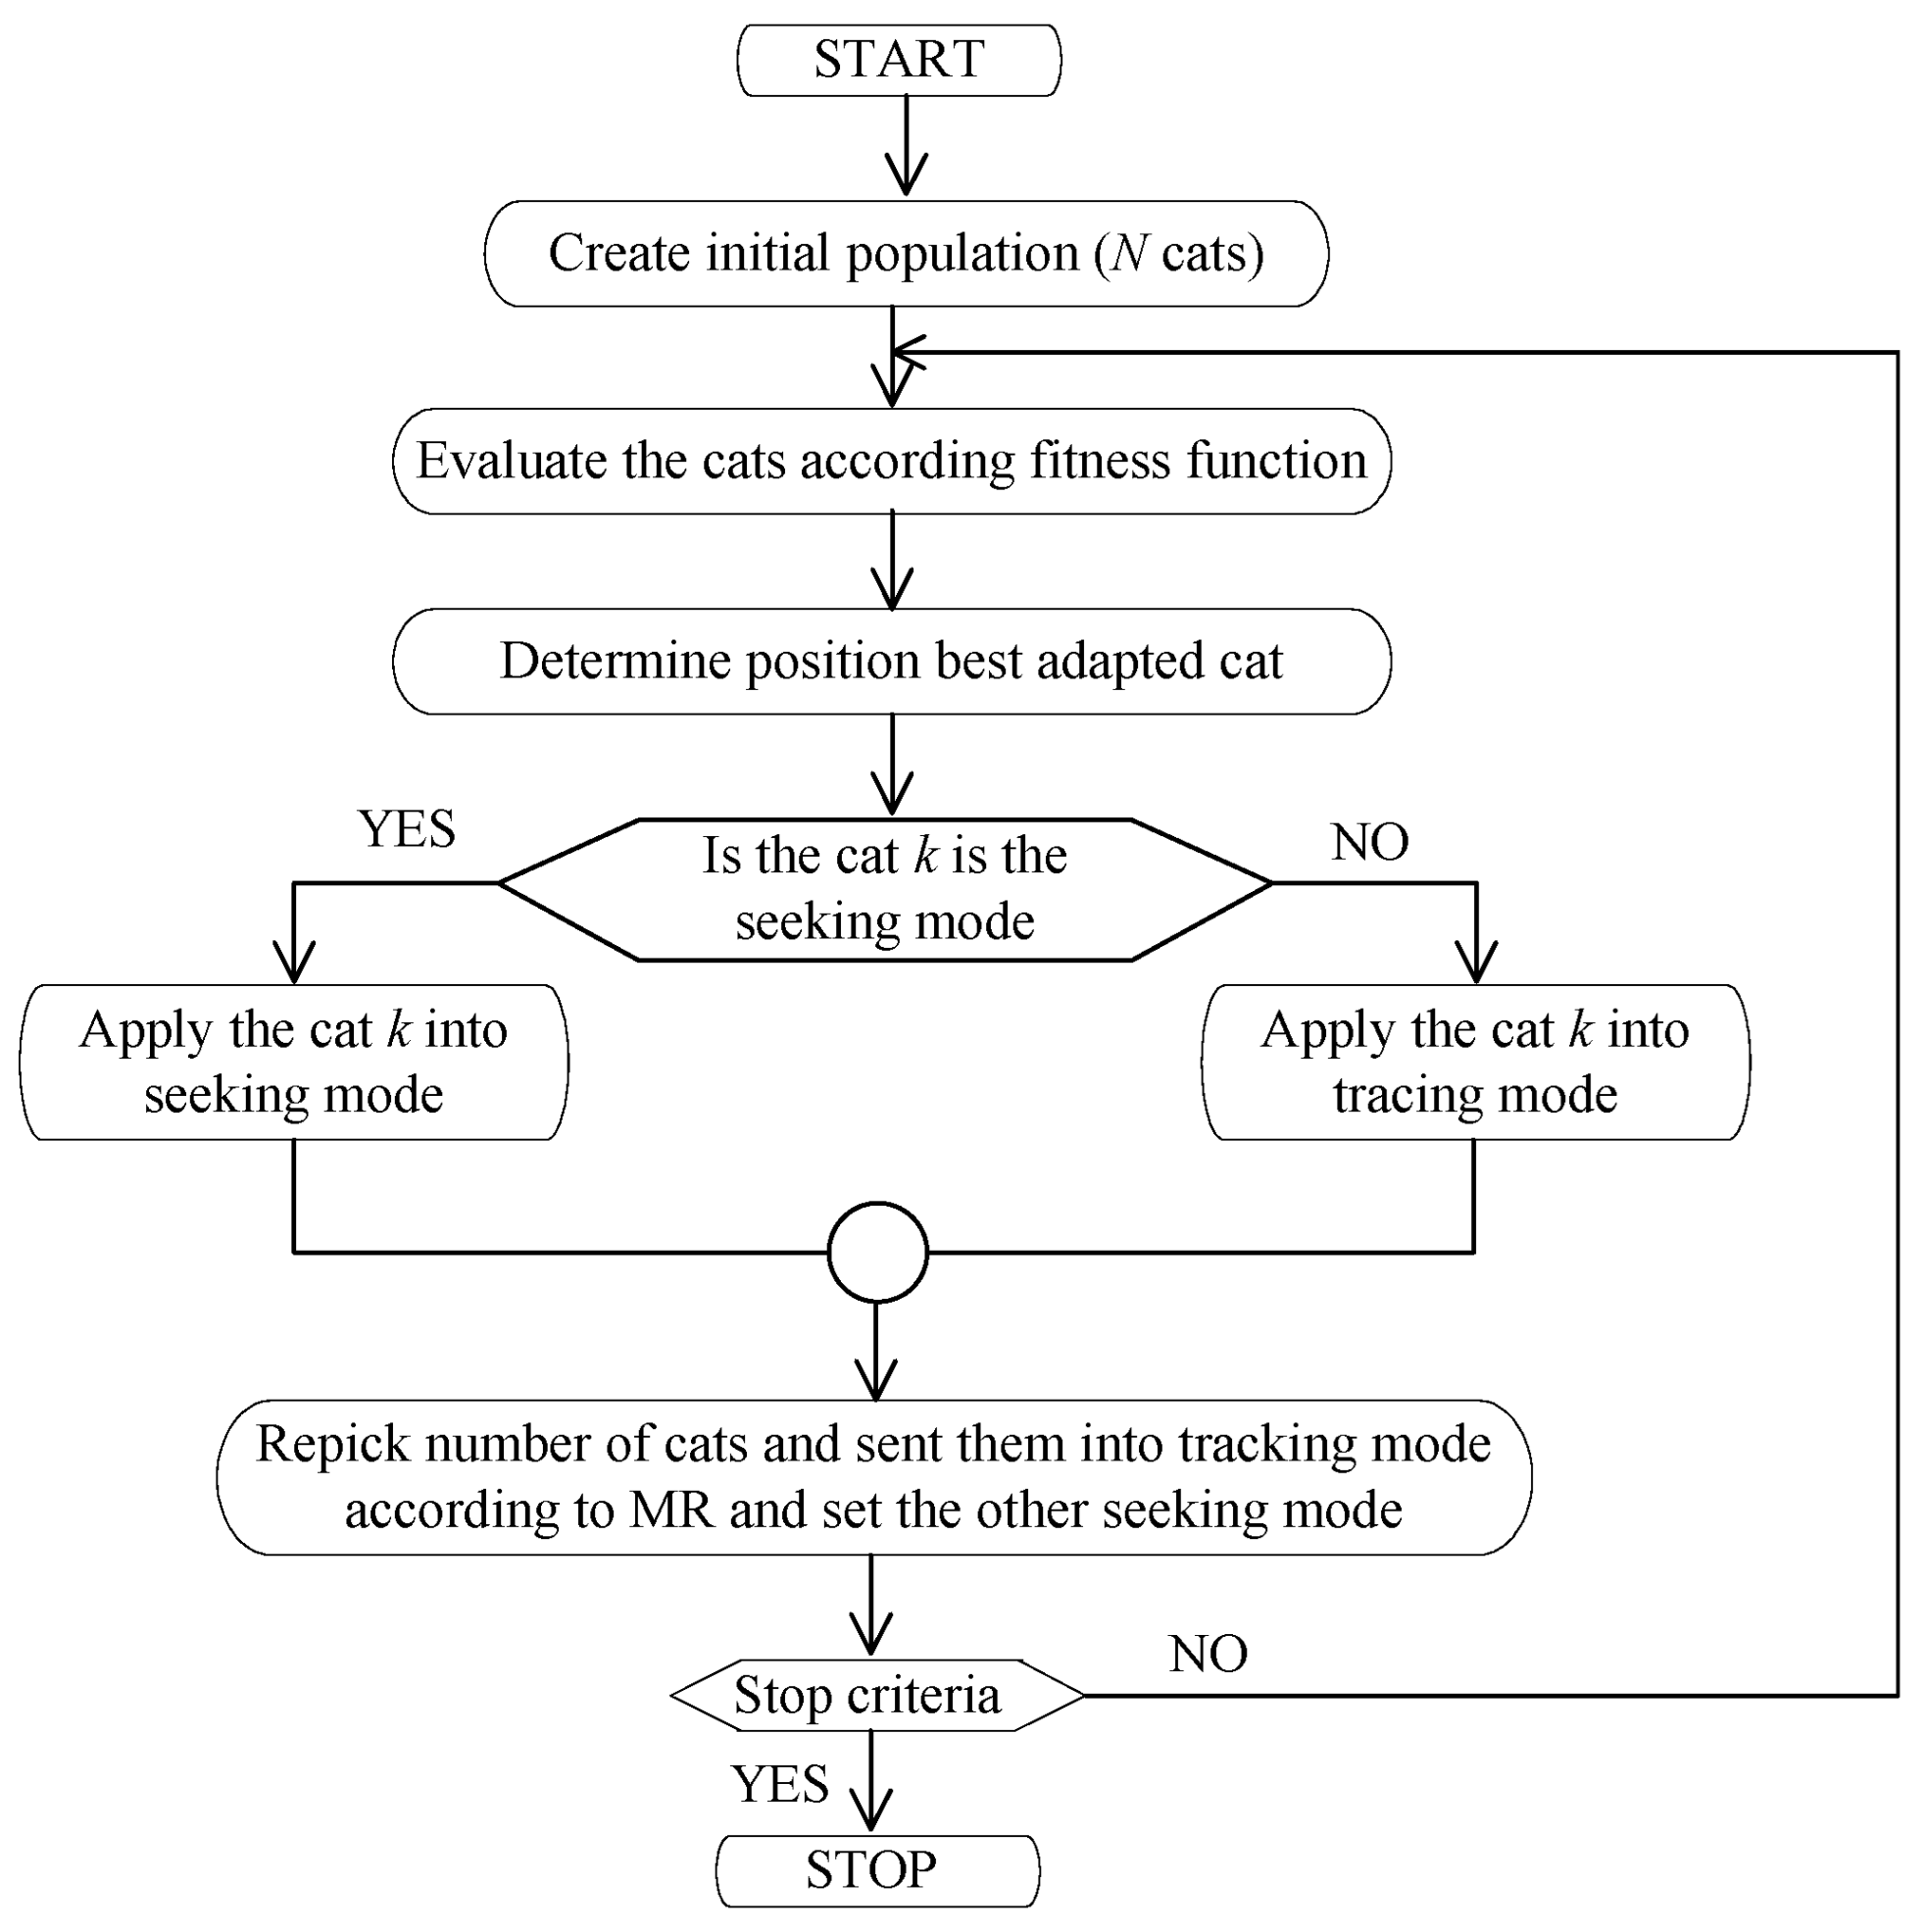
2. Application of CSO-Based MPPT Controller for Solar PV Strings under Partial Shading Conditions
2.1. Seeking Mode
- ➢
- Seeking memory pool (SMP);
- ➢
- Seeking range dimensions (SRD);
- ➢
- Counts of dimensions to change (CDC);
- ➢
- Self-position consideration (SPC).
2.2. Tracing Mode
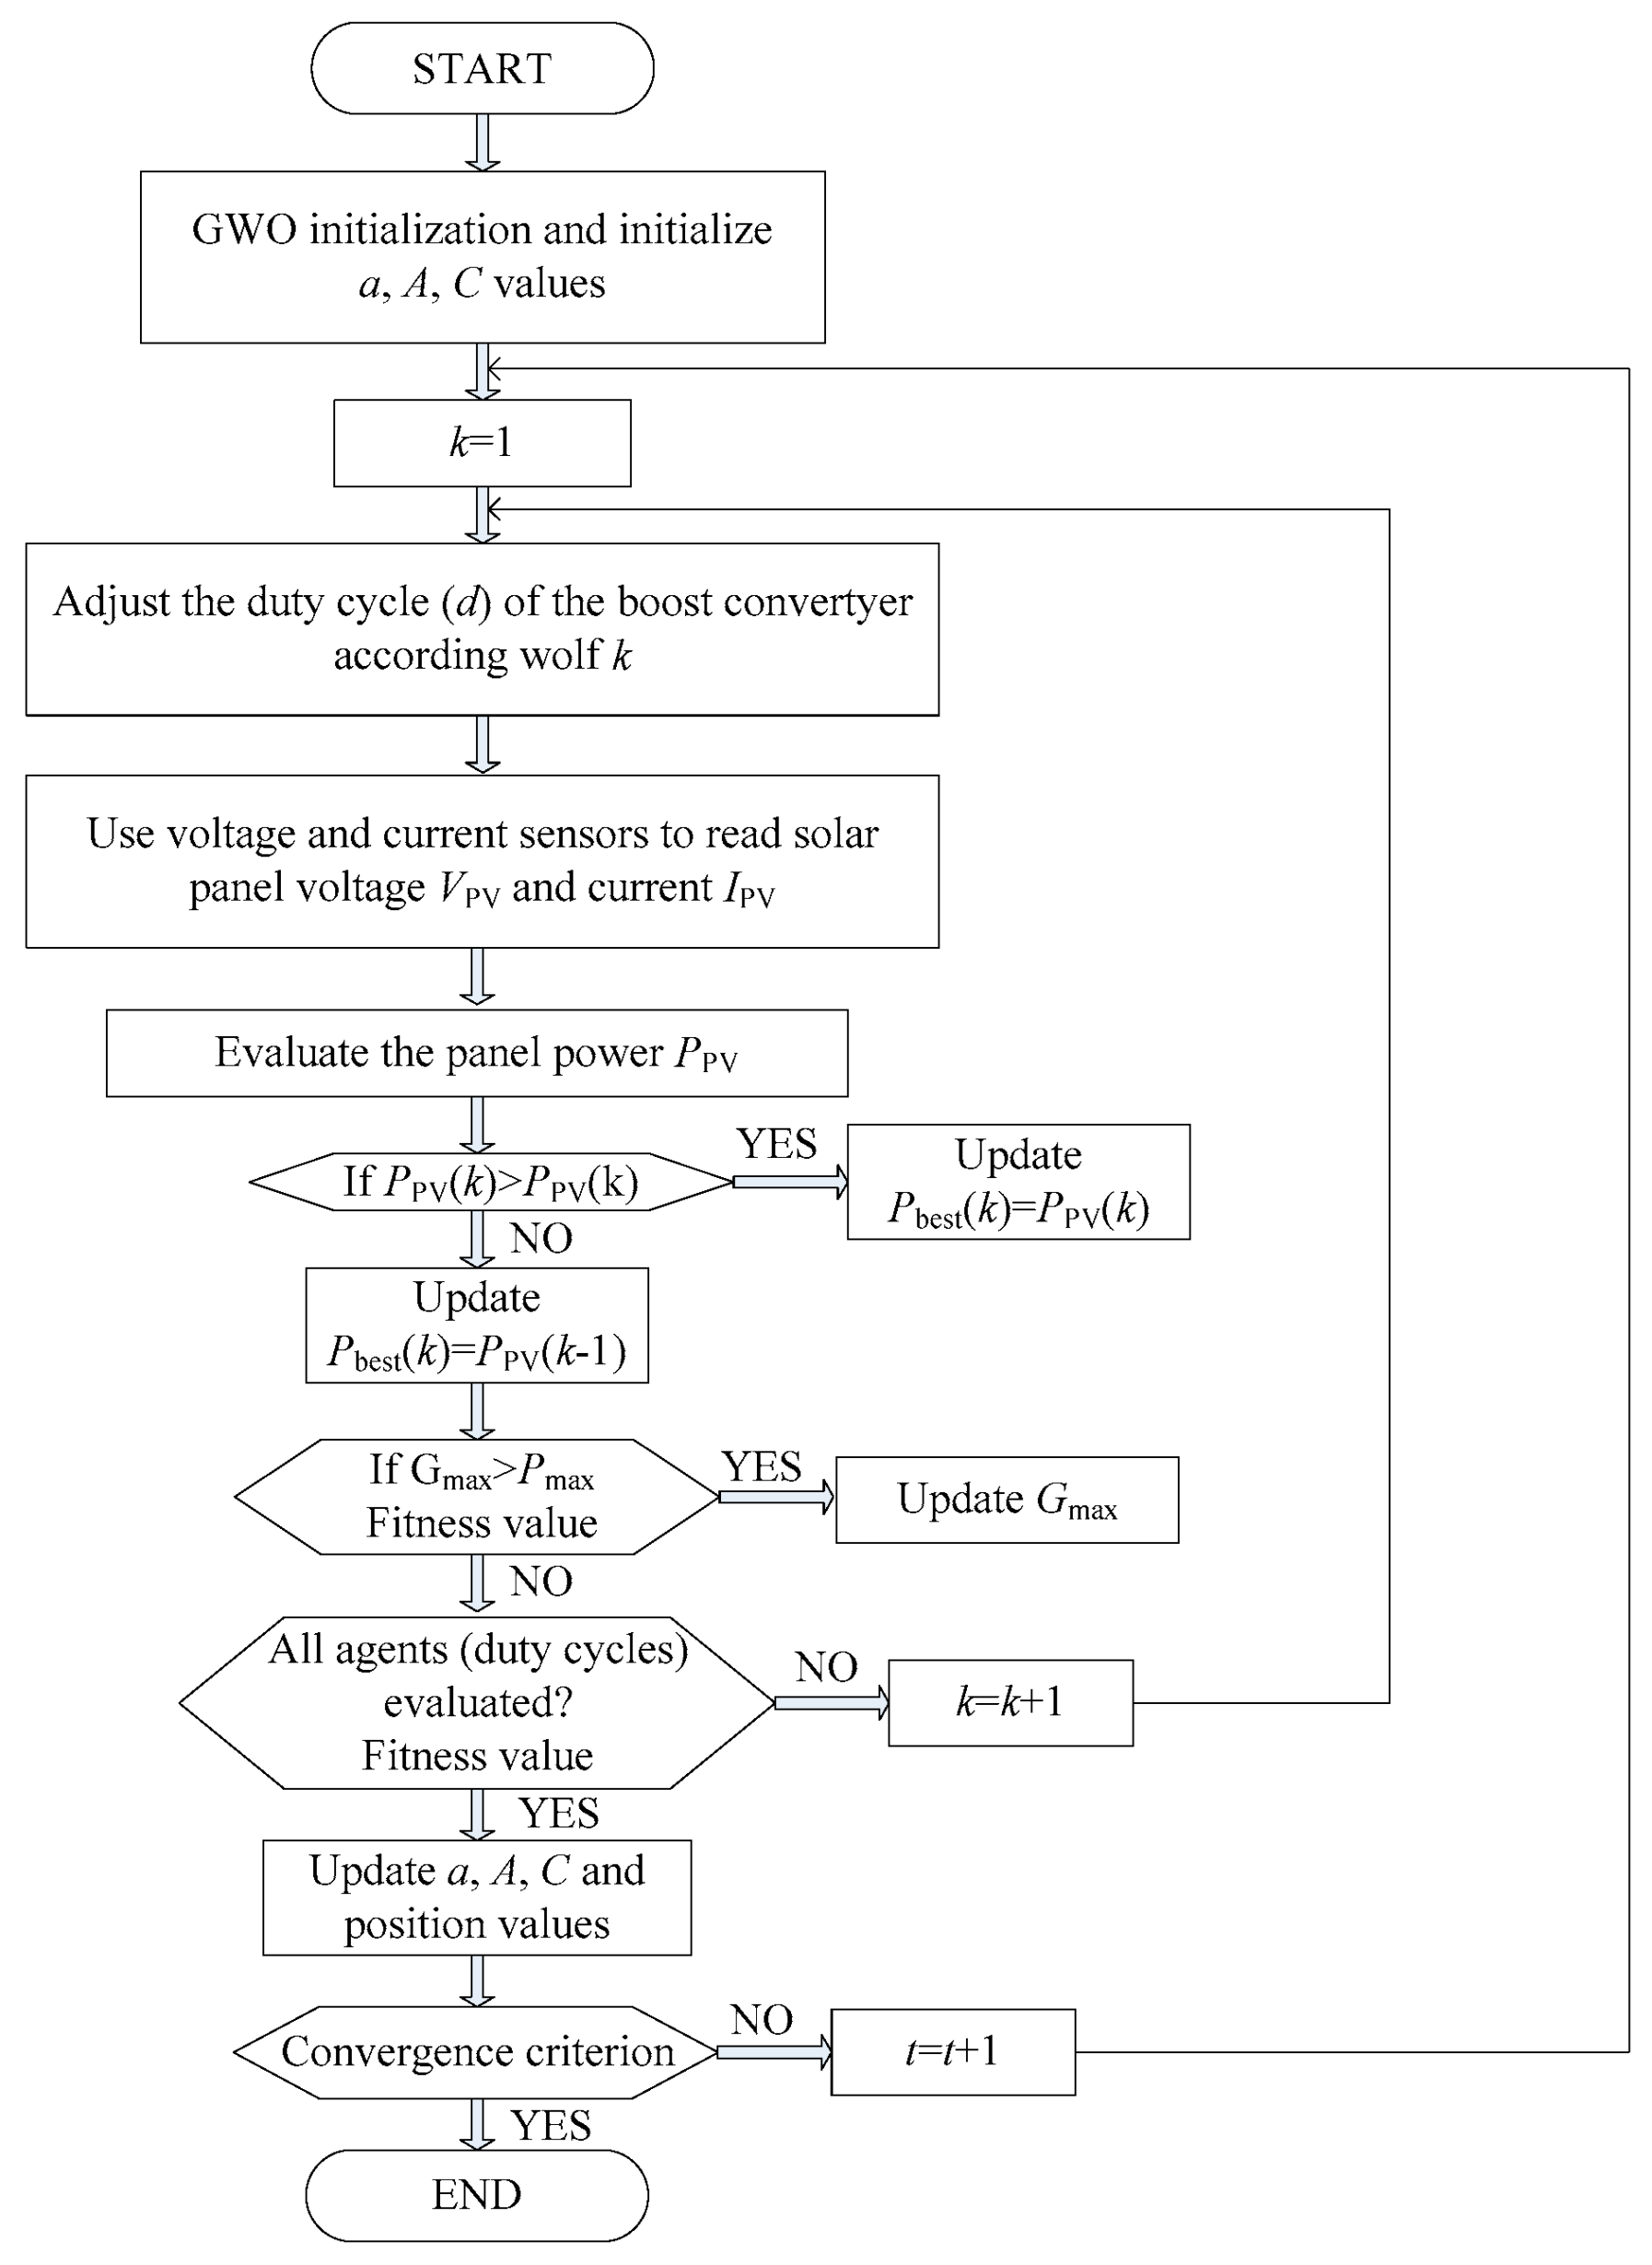
3. Application of GWO-Based MPPT Controller for Solar PV String under Shading Conditions
3.1. Encircling the Prey
3.2. Hunting Process (Updating of Wolf Position)
3.3. Attacking the Prey (Exploitation of Search Process)
3.4. Searching the Prey
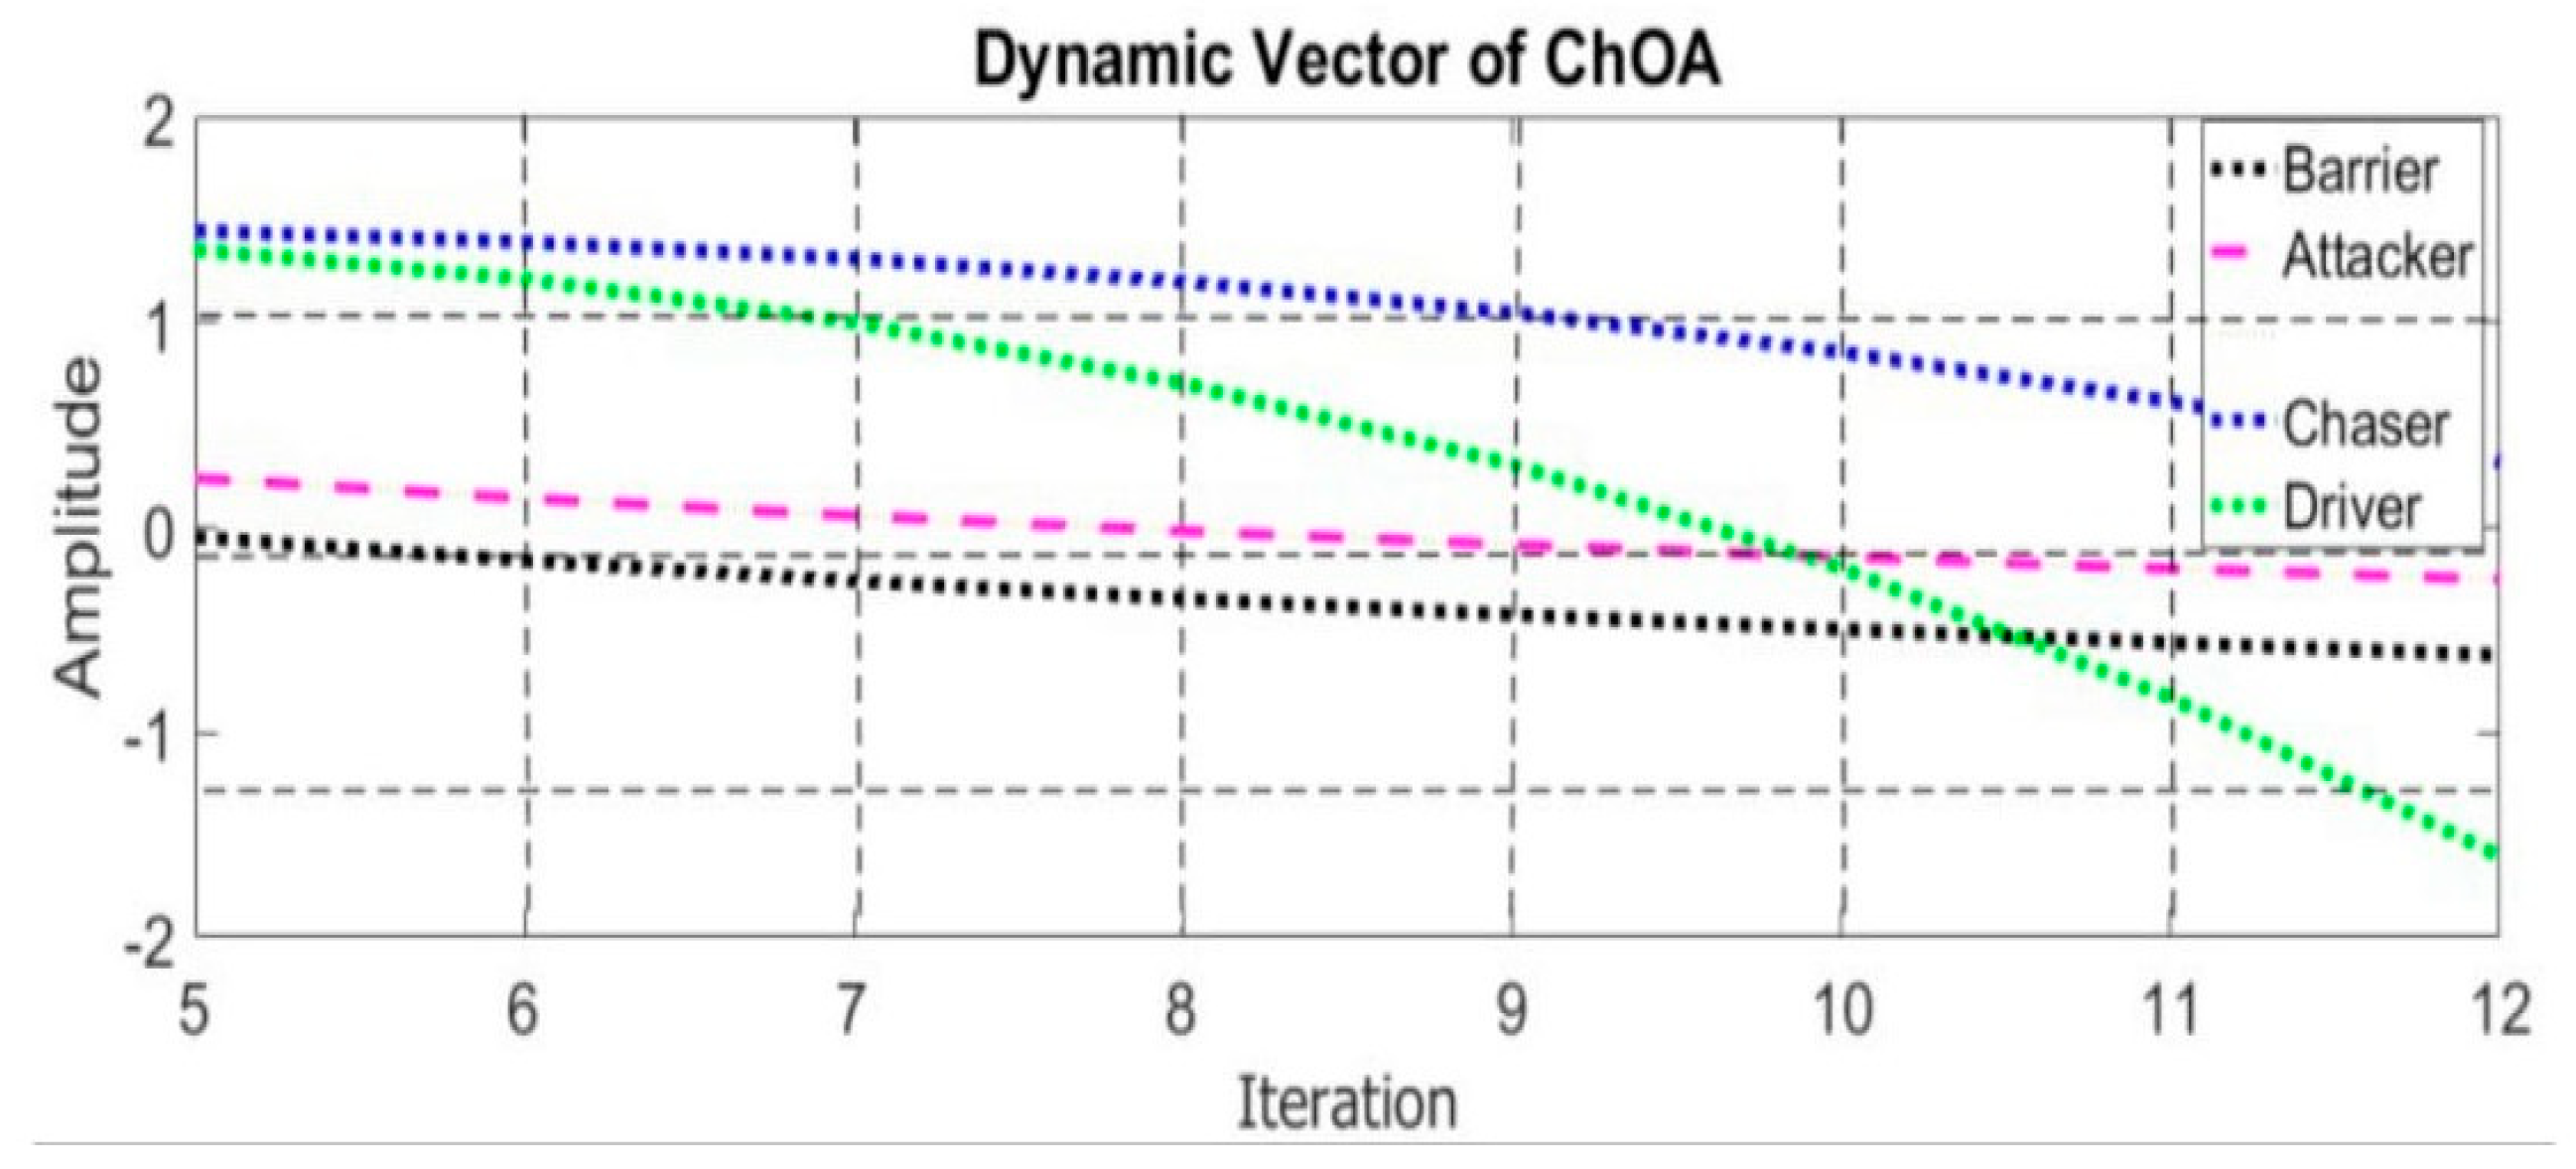
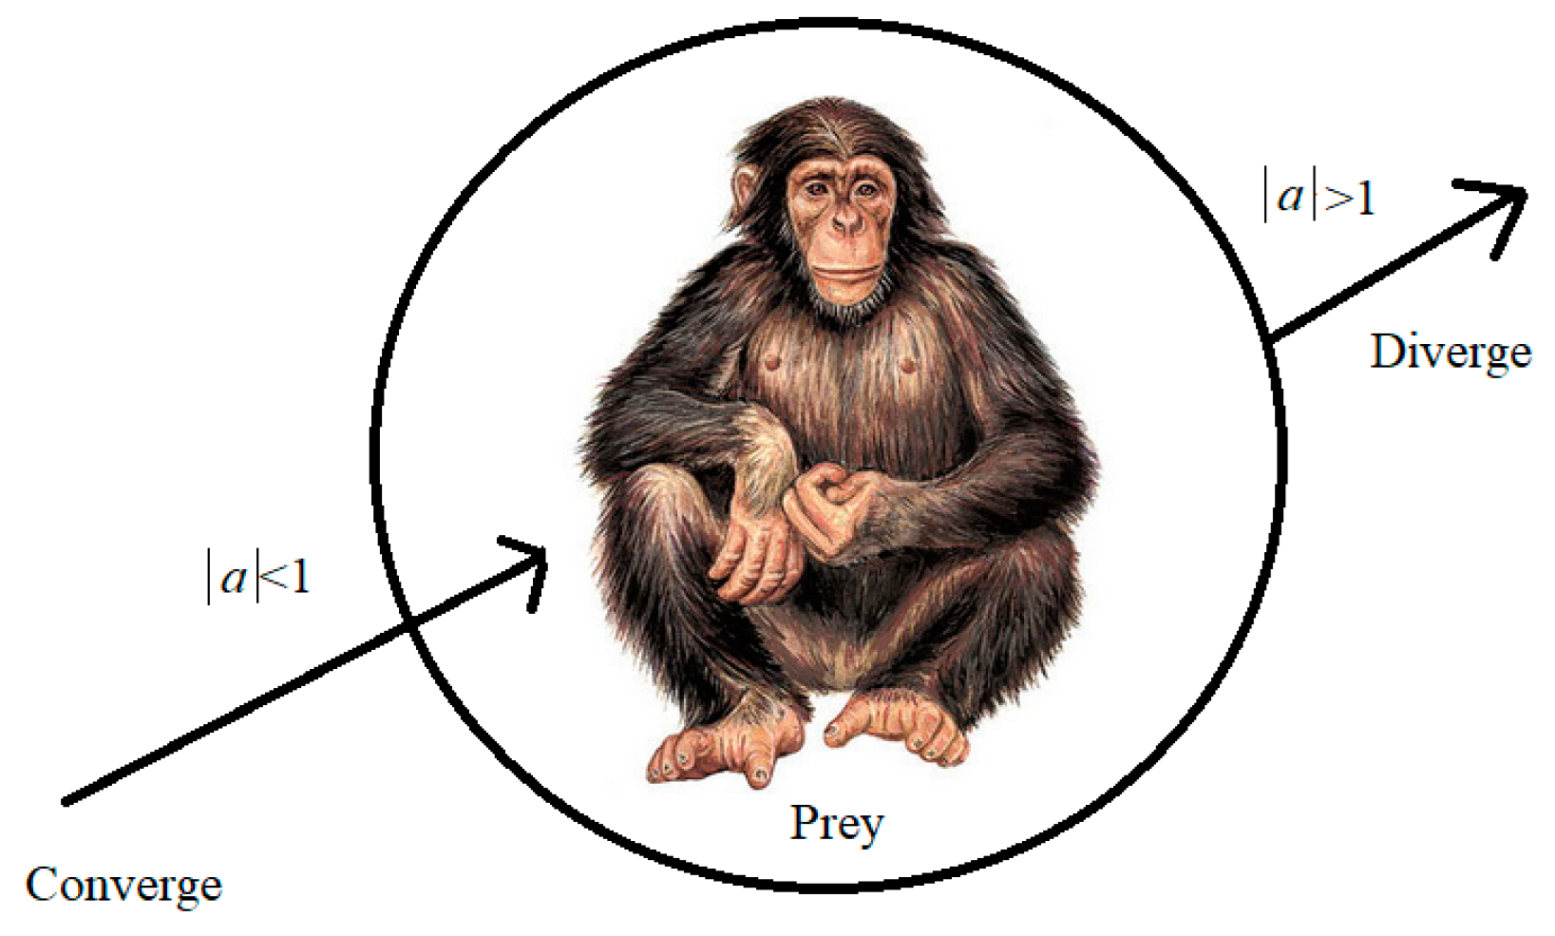
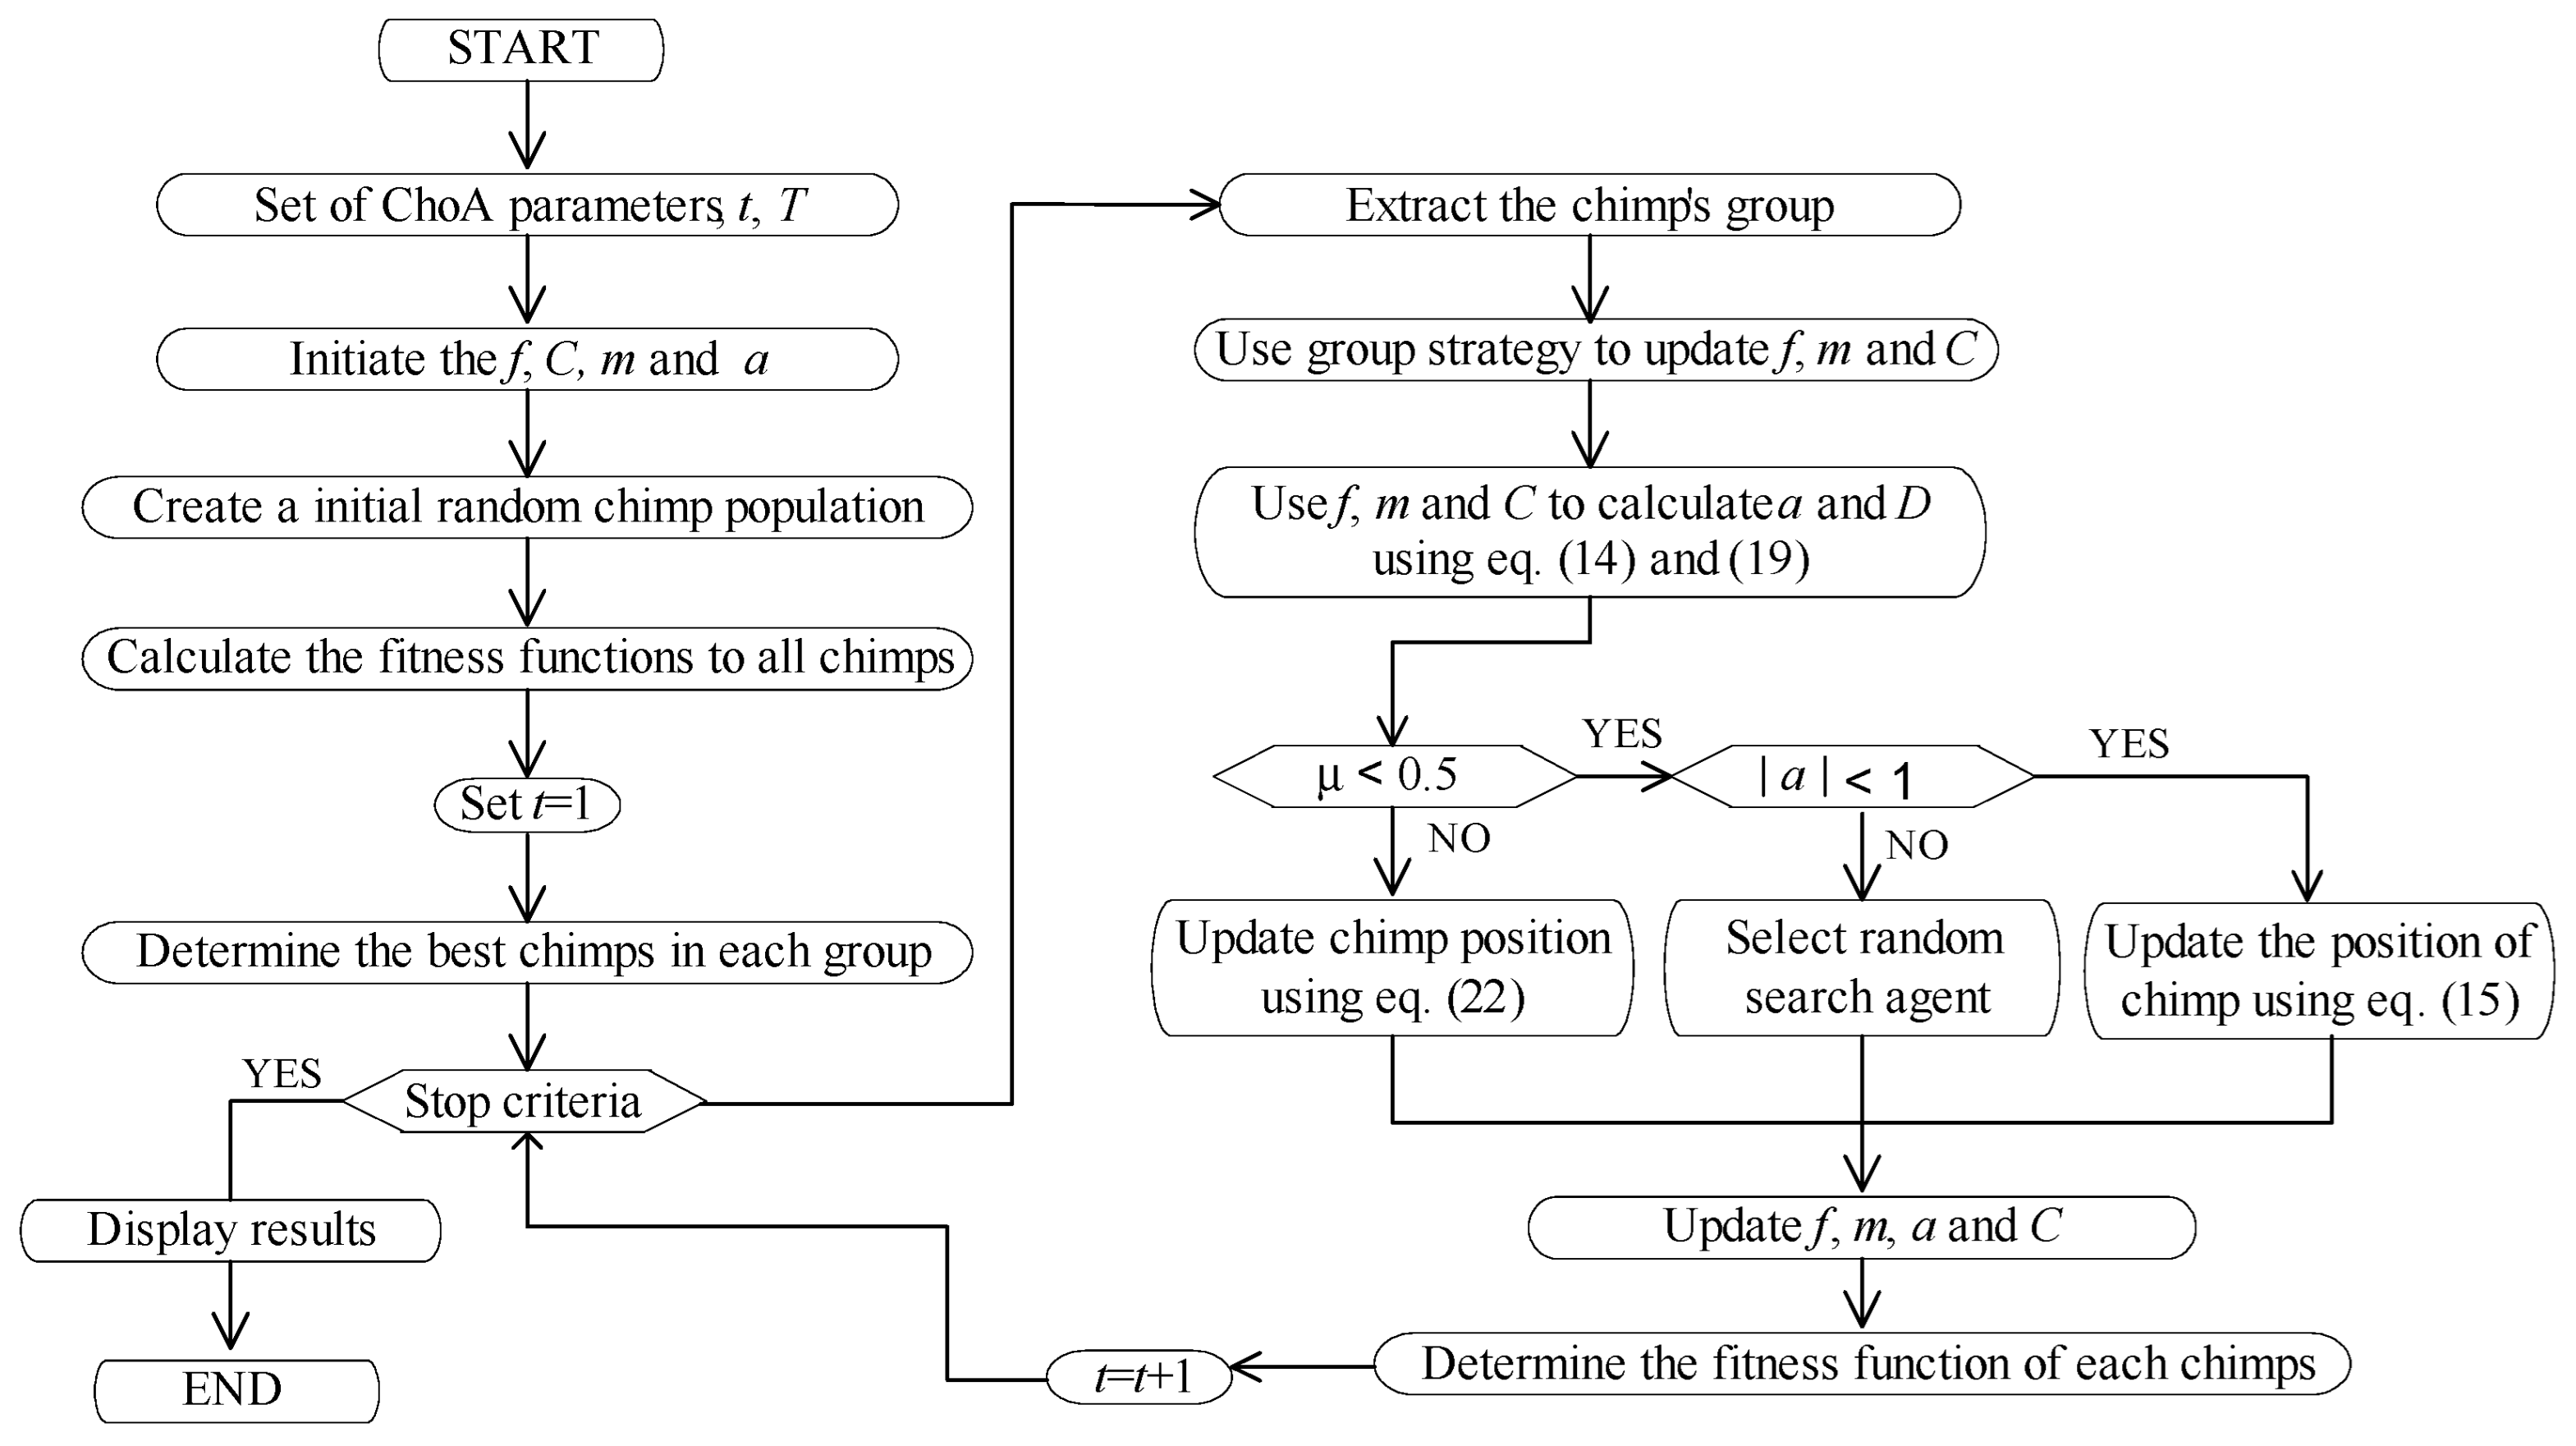
4. Application of ChOA-Based MPPT Controller for Solar PV Module under Shading Conditions
4.1. Exploration Stage
4.2. Attacking Approach (Exploitation Phase)
4.3. Chaotic Maps (Sexual Motivation)
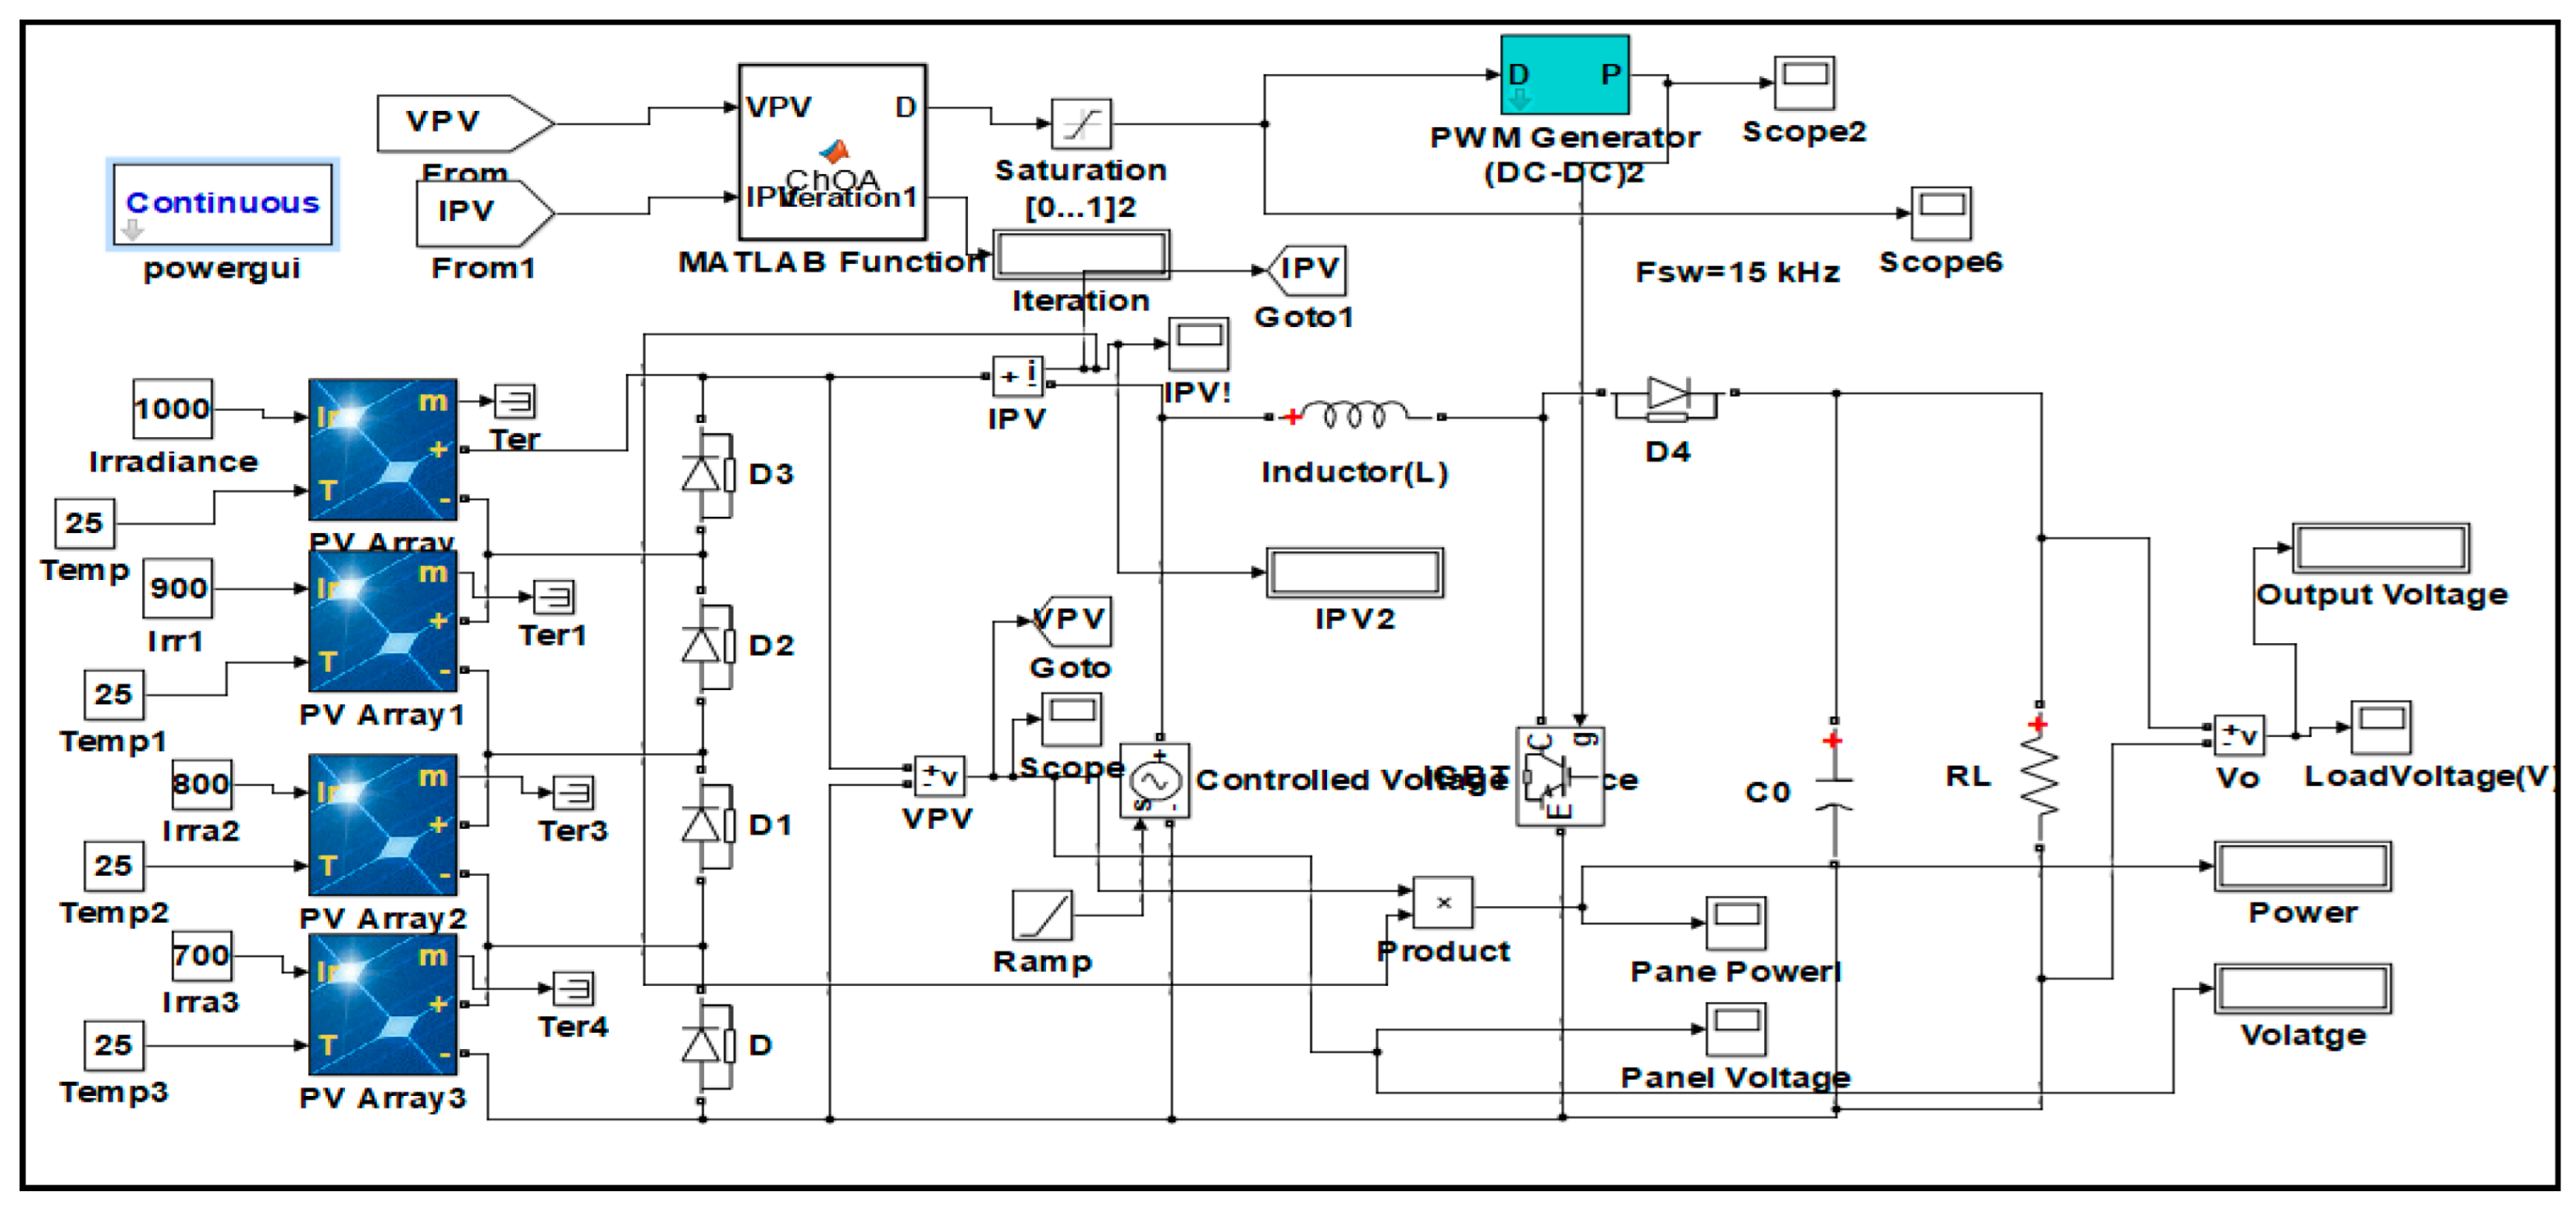
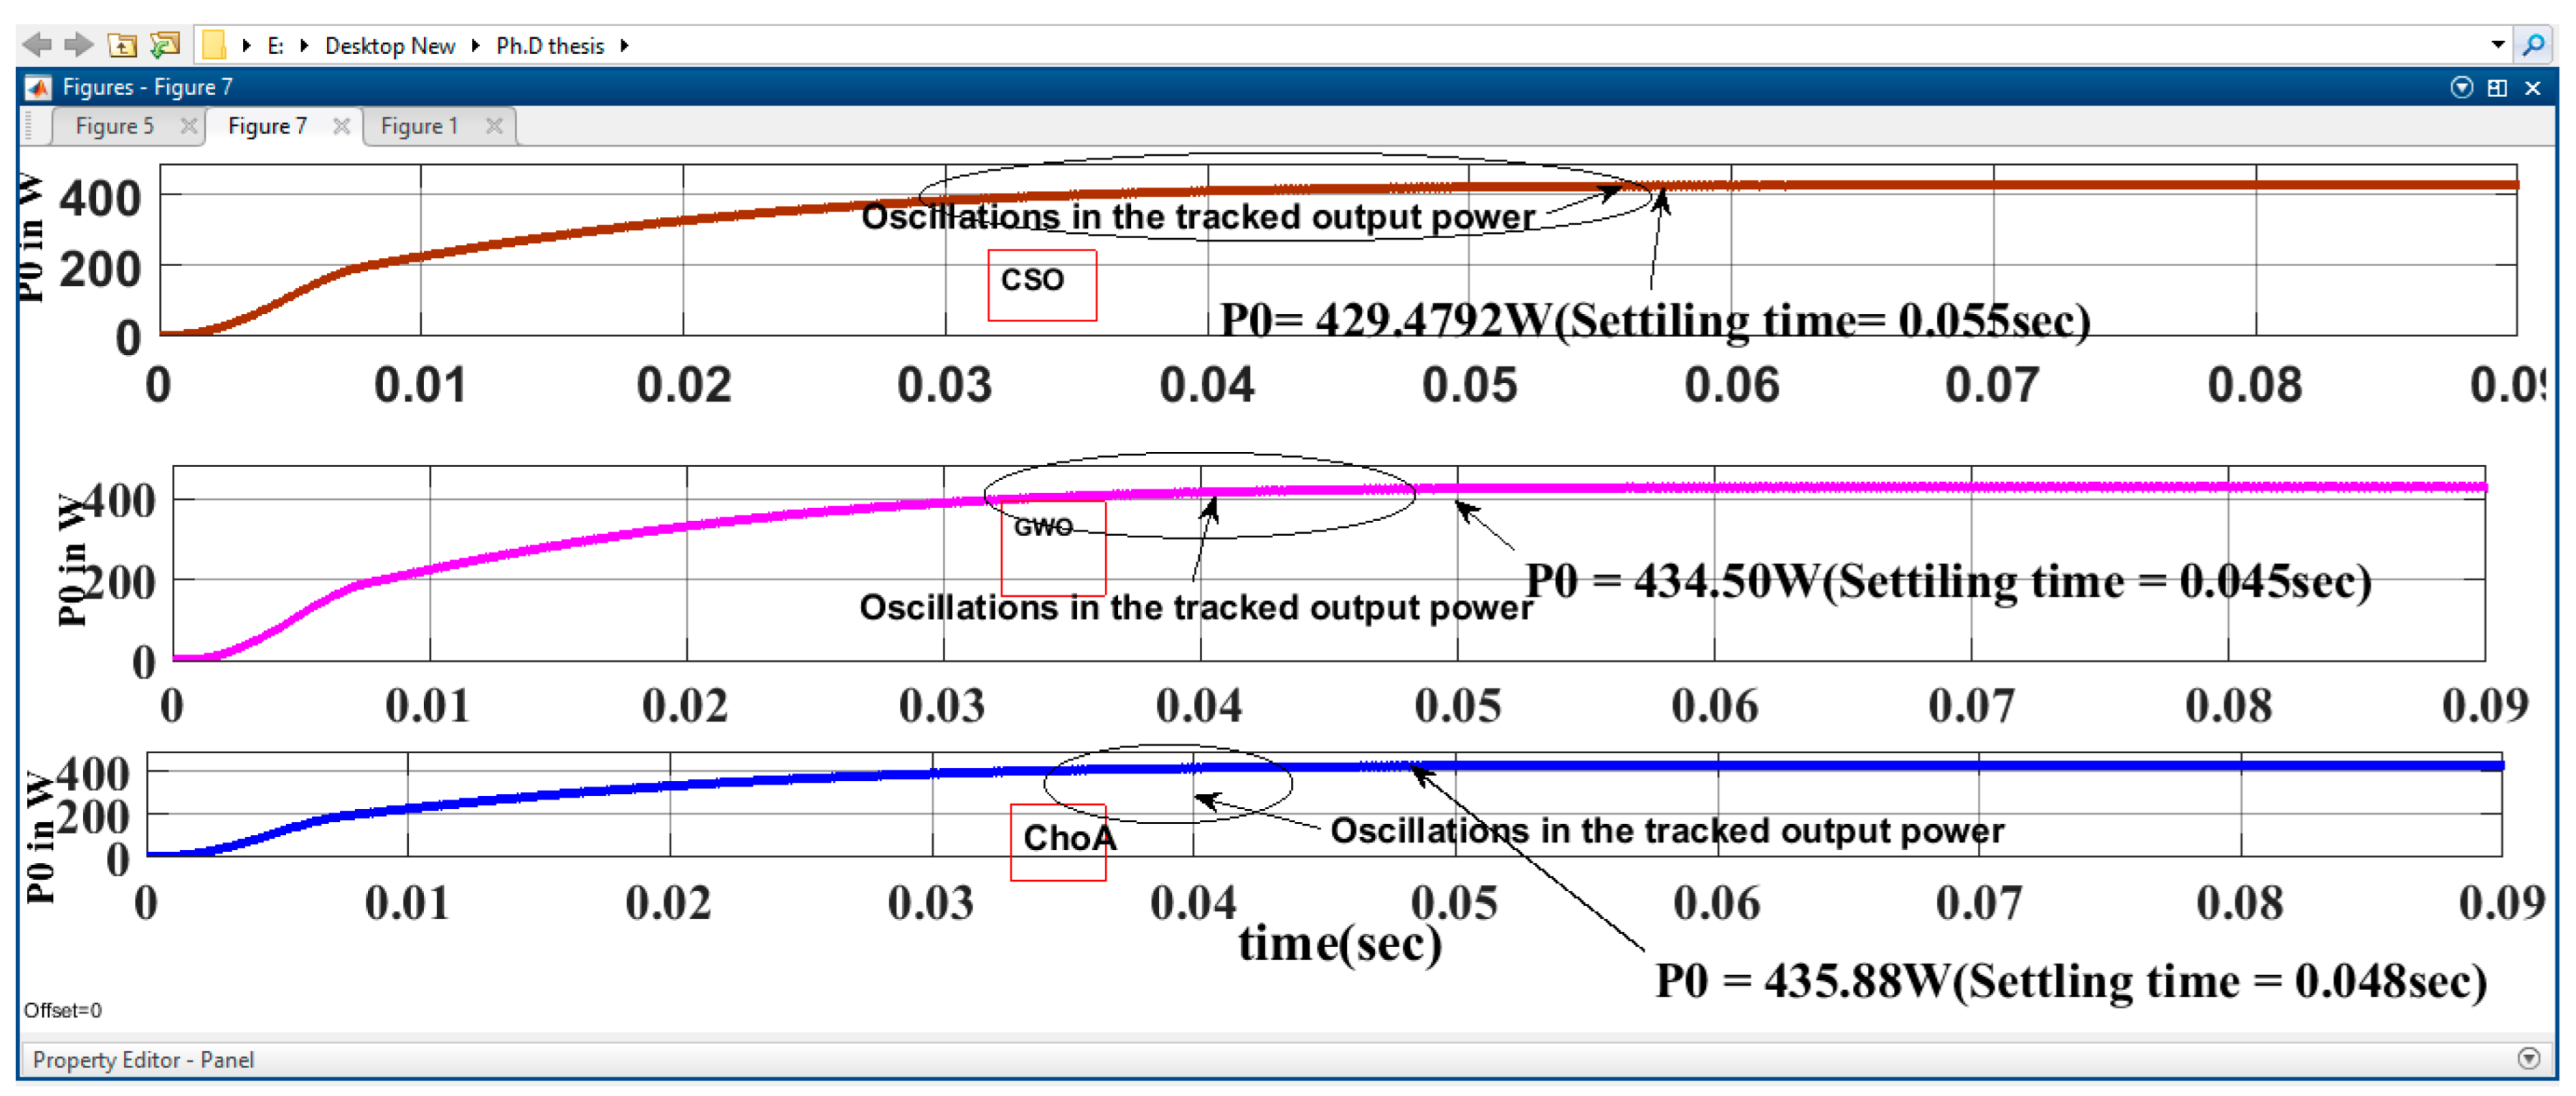
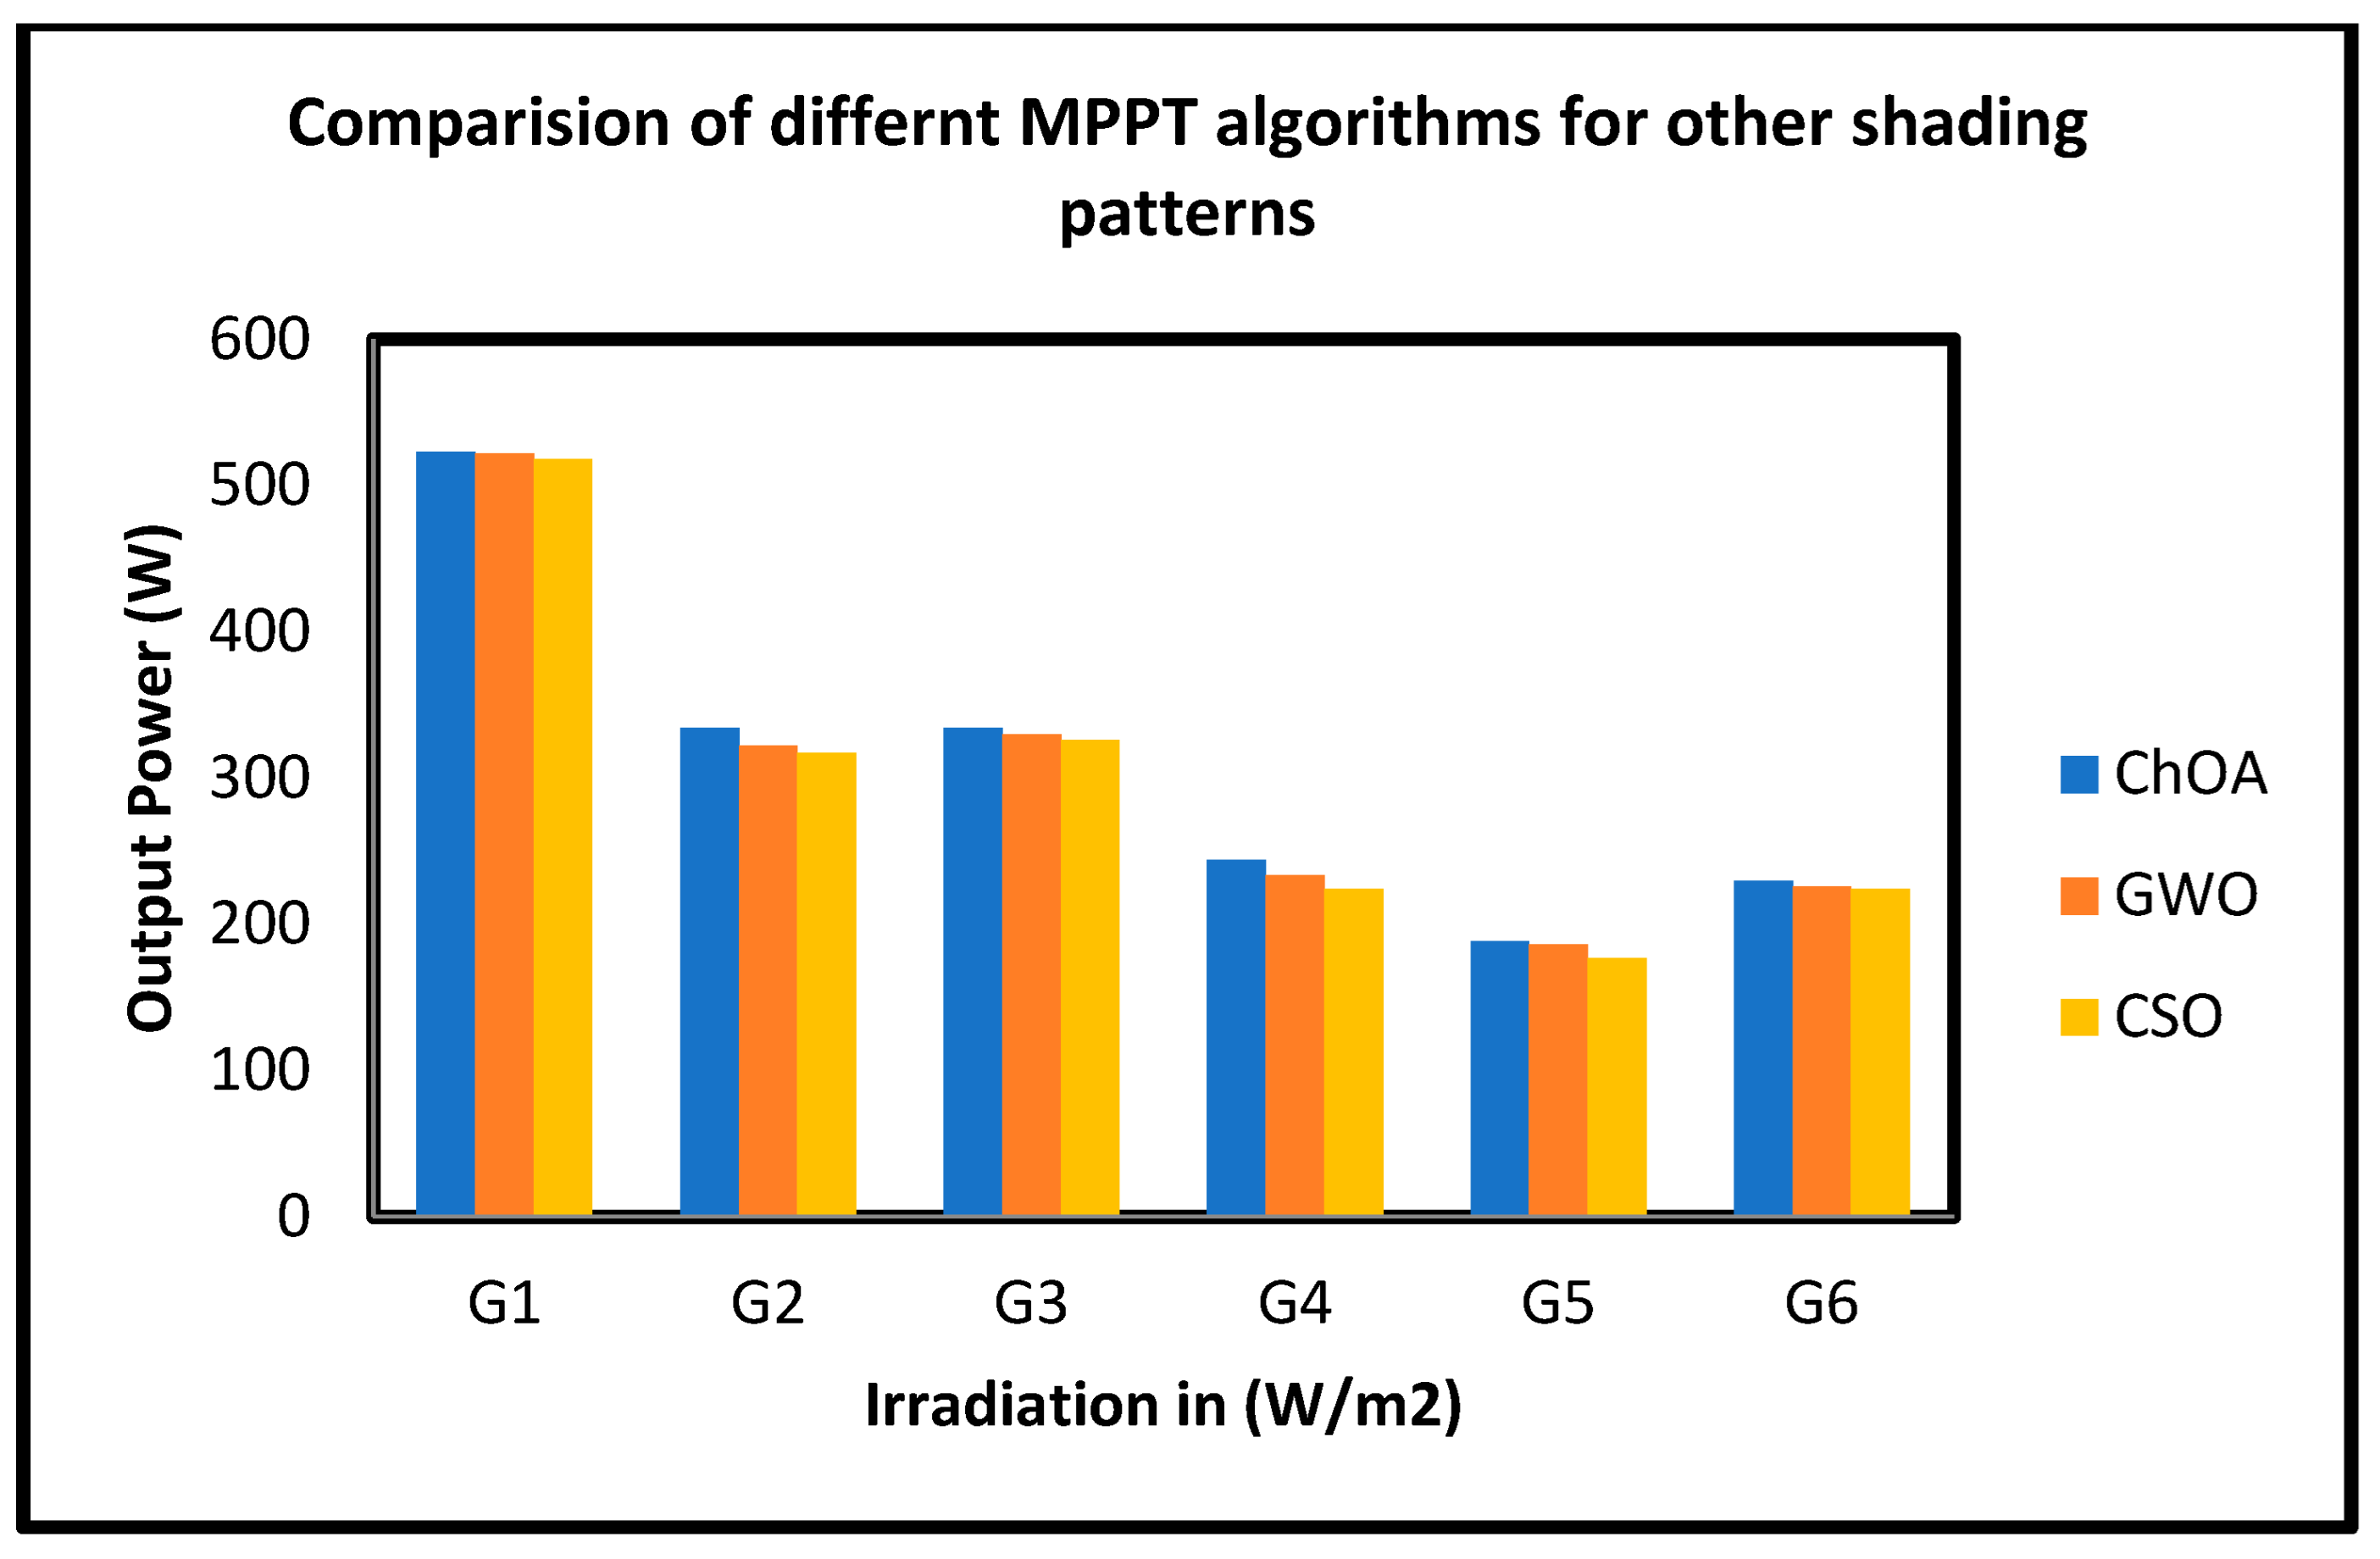
5. Case Studies
6. Conclusions
Author Contributions
Funding
Data Availability Statement
Conflicts of Interest
Nomenclature
| PV System | Photovoltaic system |
| MPPT | Maximum Power Point Tracking |
| GMPP | Global Maximum Power Point |
| PSC | Partial Shading Condition |
| CSO | Cat Swarm Optimization |
| GWO | Grey Wolf Optimization |
| ChoA | Chimp Optimization algorithm |
| PSO | Particle Swarm Optimization |
| TLBO | Teaching Learning Based Optimization |
| ACO | Ant Colony Optimization |
| P&O | Perturb and Observe |
| INC | Incremental Conductance |
| GA | Genetic Algorithm |
| DEA | Differential Evaluation Algorithm |
| FLC | Fuzzy Logic Controller |
| FA | Firefly Algorithm |
| SMP | Seeking Memory Pool |
| MBA | Mine Blast Algorithm |
References
- Available online: https://cea.nic.in/reports/monthly/executive%20summary/2020/exe_summary-02 (accessed on 1 March 2021).
- Novas, N.; Garcia, R.M.; Camacho, J.M.; Alcayde, A. Advances in Solar Energy towards Efficient and Sustainable Energy. Sustainability 2021, 13, 6295. [Google Scholar] [CrossRef]
- Kulaksız, A.A.; Akkaya, R. A genetic algorithm optimized ANN-based MPPT algorithm for a standalone PV system with induction motor drive. Solar Energy 2012, 86, 2366–2375. [Google Scholar] [CrossRef]
- Tajuddin, M.F.N.; Arif, M.S.; Ayob, S.M.; Salam, Z. Perturbative methods for maximum power point track-ing (MPPT) of photovoltaic (PV) systems: A review. Int. J. Energy Res. 2015, 39, 1153–1178. [Google Scholar] [CrossRef]
- Thangamani, K.; Manickam, M.L.; Chellaiah, C. An experimental study on photovoltaic module with opti-mum power point tracking method. Int. Trans. Electr. Energy Syst. 2020, 30, e12175. [Google Scholar] [CrossRef]
- Ramli, M.A.M.; Twaha, S.; Ishaque, K.; Al-Turki, Y.A. A review on maximum power point tracking for pho-tovoltaic systems with and without shading conditions. Renew. Sustain. Energy Rev. 2017, 67, 144–159. [Google Scholar] [CrossRef]
- Liu, Y.H.; Huang, S.C.; Liang, W.C. A particle swarm optimization –Based maximum power point tracking algorithm for PV systems operating under partially shaded conditions. IEEE Trans. Energy Convers. 2012, 27, 1027–1035. [Google Scholar] [CrossRef]
- KashifIshaquem, H.; Salam, Z. A direct control based maximum power point Tracking method for photovoltaic system under partial shading conditions using Particle Swarm optimization Algorithm. Appl. Energy 2012, 99, 414–422. [Google Scholar] [CrossRef]
- Renaudineau, H.; Donatantonio, F.; Fontchastagner, J.; Petrone, G. A PSO-Based Global MPPT Technique for Distributed PV Power Generation. IEEE Trans. Ind. Electron. 2015, 62, 1047–1058. [Google Scholar] [CrossRef]
- Phimmasone, V.; Kondo, Y.; Kamejima, T.; Miyatake, M. Evaluation of extracted energy from PV with PSO-based MPPT against various types of solar irradiation changes. In Proceedings of the 2010 International on Electrical Machines and Systems, Incheon, Republic of Korea, 10–13 October 2010; pp. 487–492. [Google Scholar]
- Chao, K.H.; Lin, Y.S.; Lai, U.D. Improved particle swarm optimization for maximum power point tracking in photovoltaic module arrays. Appl. Energy 2015, 158, 609–618. [Google Scholar] [CrossRef]
- Roy Chowdhury, S.; Saha, H. Maximum power point tracking of partially shaded solar Photovoltaic arrays. Sol. Energy Mater. Sol. Cells 2010, 94, 1441–1447. [Google Scholar] [CrossRef]
- Tobon, A.; Restrepo, J.; Ceballos, J.P.V.; Ibeas, A. Maximum Power Point Tracking of Photovoltaic Panels by Using Improved Pattern Search Methods. Energies 2017, 10, 1316. [Google Scholar] [CrossRef]
- Babu, T.S.; Sangeetha, K.; Rajasekar, N. Voltage band based improved particle. Swarm optimization technique for maximum power point tracking. in solar photovoltaic System. J. Renew. Sustain. Energy 2016, 8, 013106. [Google Scholar] [CrossRef]
- Gavhane, P.S.; Krishnamurthy, S.; Dixit, R.; Ram, J.P.; Rajasekar, N. EL-PSO based MPPT for solar PV. under partial shaded condition. Energy Procedia 2017, 117, 1047–1053. [Google Scholar] [CrossRef]
- Babu, T.S.; Rajasekar, N.; Sangeetha, K. Modified Particle Swarm optimization technique based Maximum Power Point Tracking for uniform and under partial shading condition. Appl. Soft Comput. 2015, 34, 13–624. [Google Scholar] [CrossRef]
- Husain, M.A.; Tariq, A.; Hameed, S.; Arif, M.S.B.; Jain, A. Comparative assessment of maximum power point tracking procedures for photovoltaic systems. Green Energy Environ. 2017, 2, 5–17. [Google Scholar] [CrossRef]
- Kalaiarasi, N.; Subranshu, D.; Sanjeevikumar, P.; Paramasivam, S. Maximum Power Point Tracking Implementation by DSPACE Controller Integrated through Z-Source Inverter Using PSO Technique for Photovoltaic Applications. Appl. Sci. 2018, 8, 145. [Google Scholar] [CrossRef]
- Dileep, G.; Singh, S.N. Application of soft computing techniques for maximum power point tracking of SPV system. Sol. Energy 2017, 141, 182–202. [Google Scholar] [CrossRef]
- Ahmed, J.; Salam, Z. A critical evaluation on maximum power point tracking methods for partial shading in PV systems. Renew. Sustain. Energy Rev. 2015, 47, 933–953. [Google Scholar] [CrossRef]
- Wen, H.; Chu, G.; Hu, Y.; Jiang, L. A novel power-increment based GMPPT algorithm for PV arrays under partial shading conditions. Sol. Energy 2018, 169, 353–361. [Google Scholar] [CrossRef]
- Rezk, H.; Fathy, A.; Abdelaziz, Y. A Comparision of different global MPPT techniques based on meta-heuristic algorithms for photovoltaic system subjected to partial Shading conditions. Renew. Sustain. Energy Rev. 2017, 74, 377–386. [Google Scholar] [CrossRef]
- Abokhalil, A. Maximum Power Point Tracking for a PV System using Tuned Support Vector Regression by Particle Swarm Optimization. J. Eng. Res. 2020, 8, 4. [Google Scholar] [CrossRef]
- Gangwar, P.; Singh, R.; Tripathi, R.P.; Singh, A.K. Effective solar power harnessing using a few novel solar tree designs and their performance assessment. Energy Sources Part A Recovery Util. Environ. Eff. 2019, 41, 1828–1837. [Google Scholar] [CrossRef]
- Mohanty, B.; Tripathy, S.A. Teaching learning based optimization technique for optimal location and size of DG in distribution network. J. Electr. Syst. Inf. Technol. 2016, 3, 33–44. [Google Scholar] [CrossRef]
- Rezk, H.; Fathy, A. Simulation of global MPPT based on Teaching-Learning based optimization technique for partially shaded PV system. Electr. Eng. 2017, 99, 847–859. [Google Scholar] [CrossRef]
- Fathy, A.; Rezk, H. A novel methodology for simulating maximum power point trackers using Mine blast optimization and teaching learning based optimization algorithm for partially shaded photovoltaic system. J. Renew. Sustain. Energy 2016, 8, 023503. [Google Scholar] [CrossRef]
- Crepinsek, M.; Liu, S.; Mernik, L. A note on teaching learning based optimization algorithm. Inf. Sci. 2012, 212, 79–93. [Google Scholar] [CrossRef]
- Sundareswaran, K.; Peddapati, S.; Palani, S. MPPT of PV Systems Under Partial Shaded Conditions through a Colony of Flashing Fireflies. IEEE Trans. Energy Convers. 2014, 29, 463–472. [Google Scholar] [CrossRef]
- Farzaneh, J.; Keypour, R.; Khanesar, M.A. A New Maximum Power Point Tracking Based on Modified Firefly Algorithm for PV System Under Partial Shading Conditions. Technol. Econ. Smart Grids Sustain. Energy 2018, 3, 9. [Google Scholar] [CrossRef]
- Mohanthy, S.; Subudhi, B.; Ray, P.K. A Grey wolf Assisted Perturb and Observe MPPT Algorithm for a PV system. IEEE Trans. Energy Conversat. 2017, 32, 340–347. [Google Scholar] [CrossRef]
- Eltamaly, A.M.; Farh, H.M.H. Dynamic global maximum power point tracking of the PV systems under variant partial shading using hybrid GWO-FLC. Sol. Energy 2019, 177, 306–316. [Google Scholar] [CrossRef]
- Mohanthy, S.; Subudhi, B.; Ray, P.K. A new MPPT design using Grey Wolf optimization technique for photovoltaic system under partial shading conditions. IEEE Trans. Sustain. Energy 2016, 7, 181–188. [Google Scholar] [CrossRef]
- Songyang, L.; Haipeng, Y.; Miao, W. Cat swarm optimization algorithm based on the information interaction of subgroup and the top-N learning strategy. J. Intell. Syst. 2022, 31, 489–500. [Google Scholar] [CrossRef]
- Knypiński, Ł. Constrained optimization of line-start PM motor based on the gray wolf optimizer. Eksploat. Niezawodn. Maint. Reliab. 2021, 23, 1–10. [Google Scholar] [CrossRef]
- Sadeghi, F.; Larijani, A.; Rostami, O.; Martín, D.; Hajirahimi, P. A Novel Multi-Objective Binary Chimp Optimization Algorithm for Optimal Feature Selection: Application of Deep-Learning-Based Approaches for SAR Image Classification. Sensors 2023, 23, 1180. [Google Scholar] [CrossRef] [PubMed]


| Type | Barrier | Attacker | Driver | Chaser |
|---|---|---|---|---|
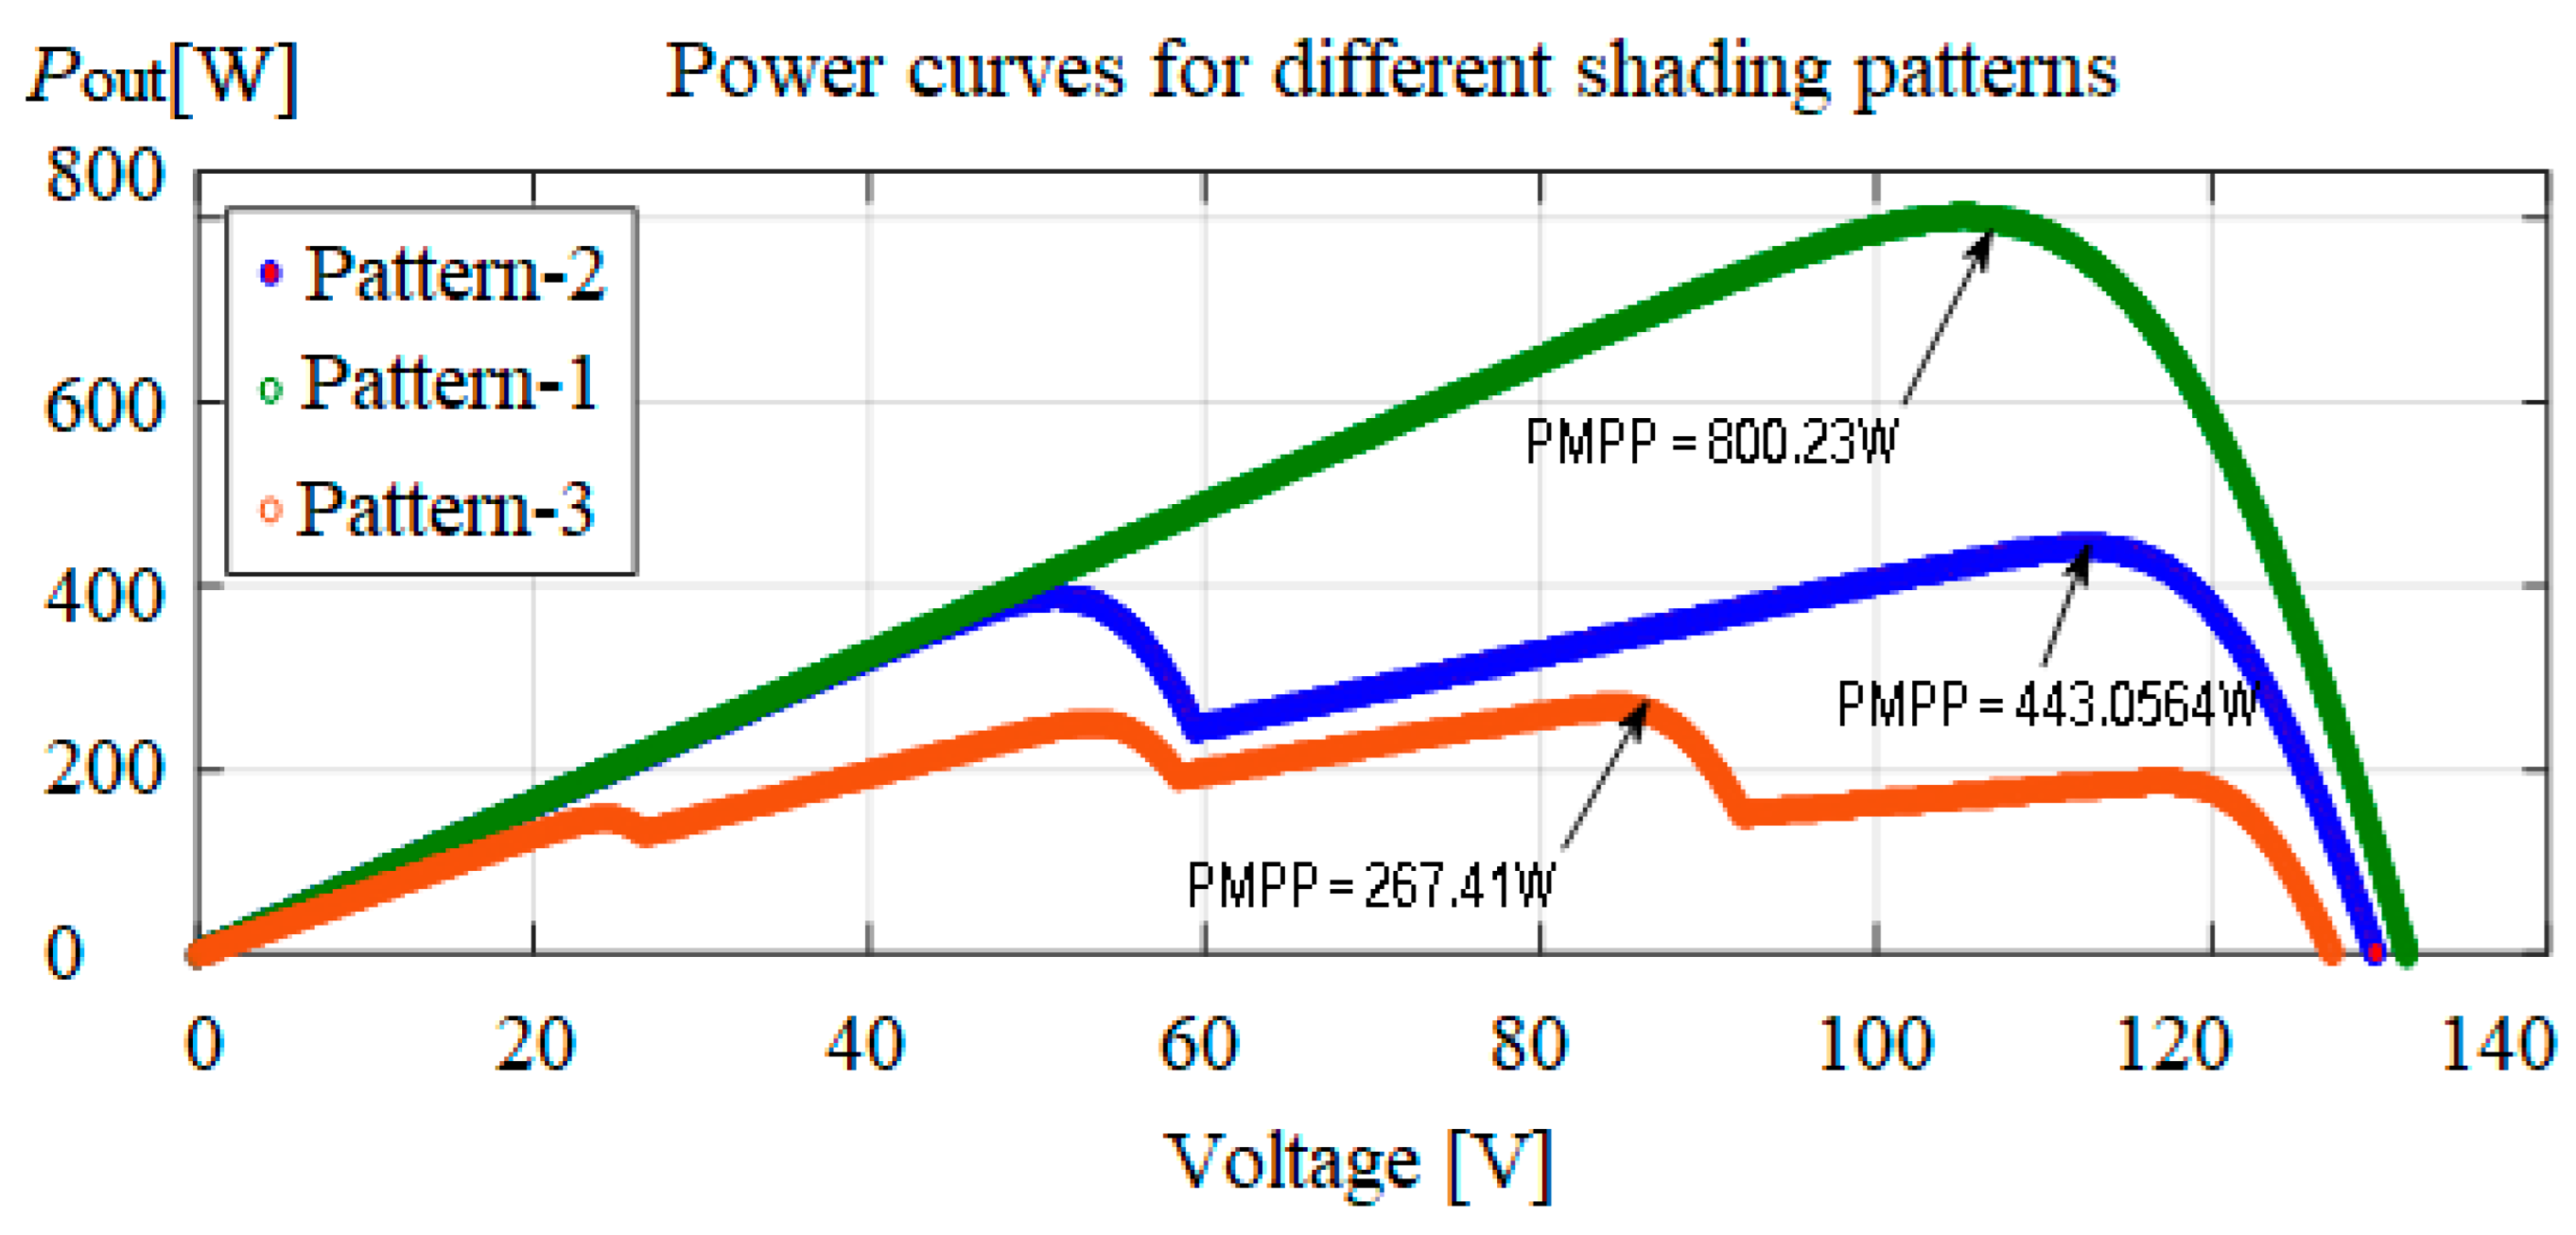
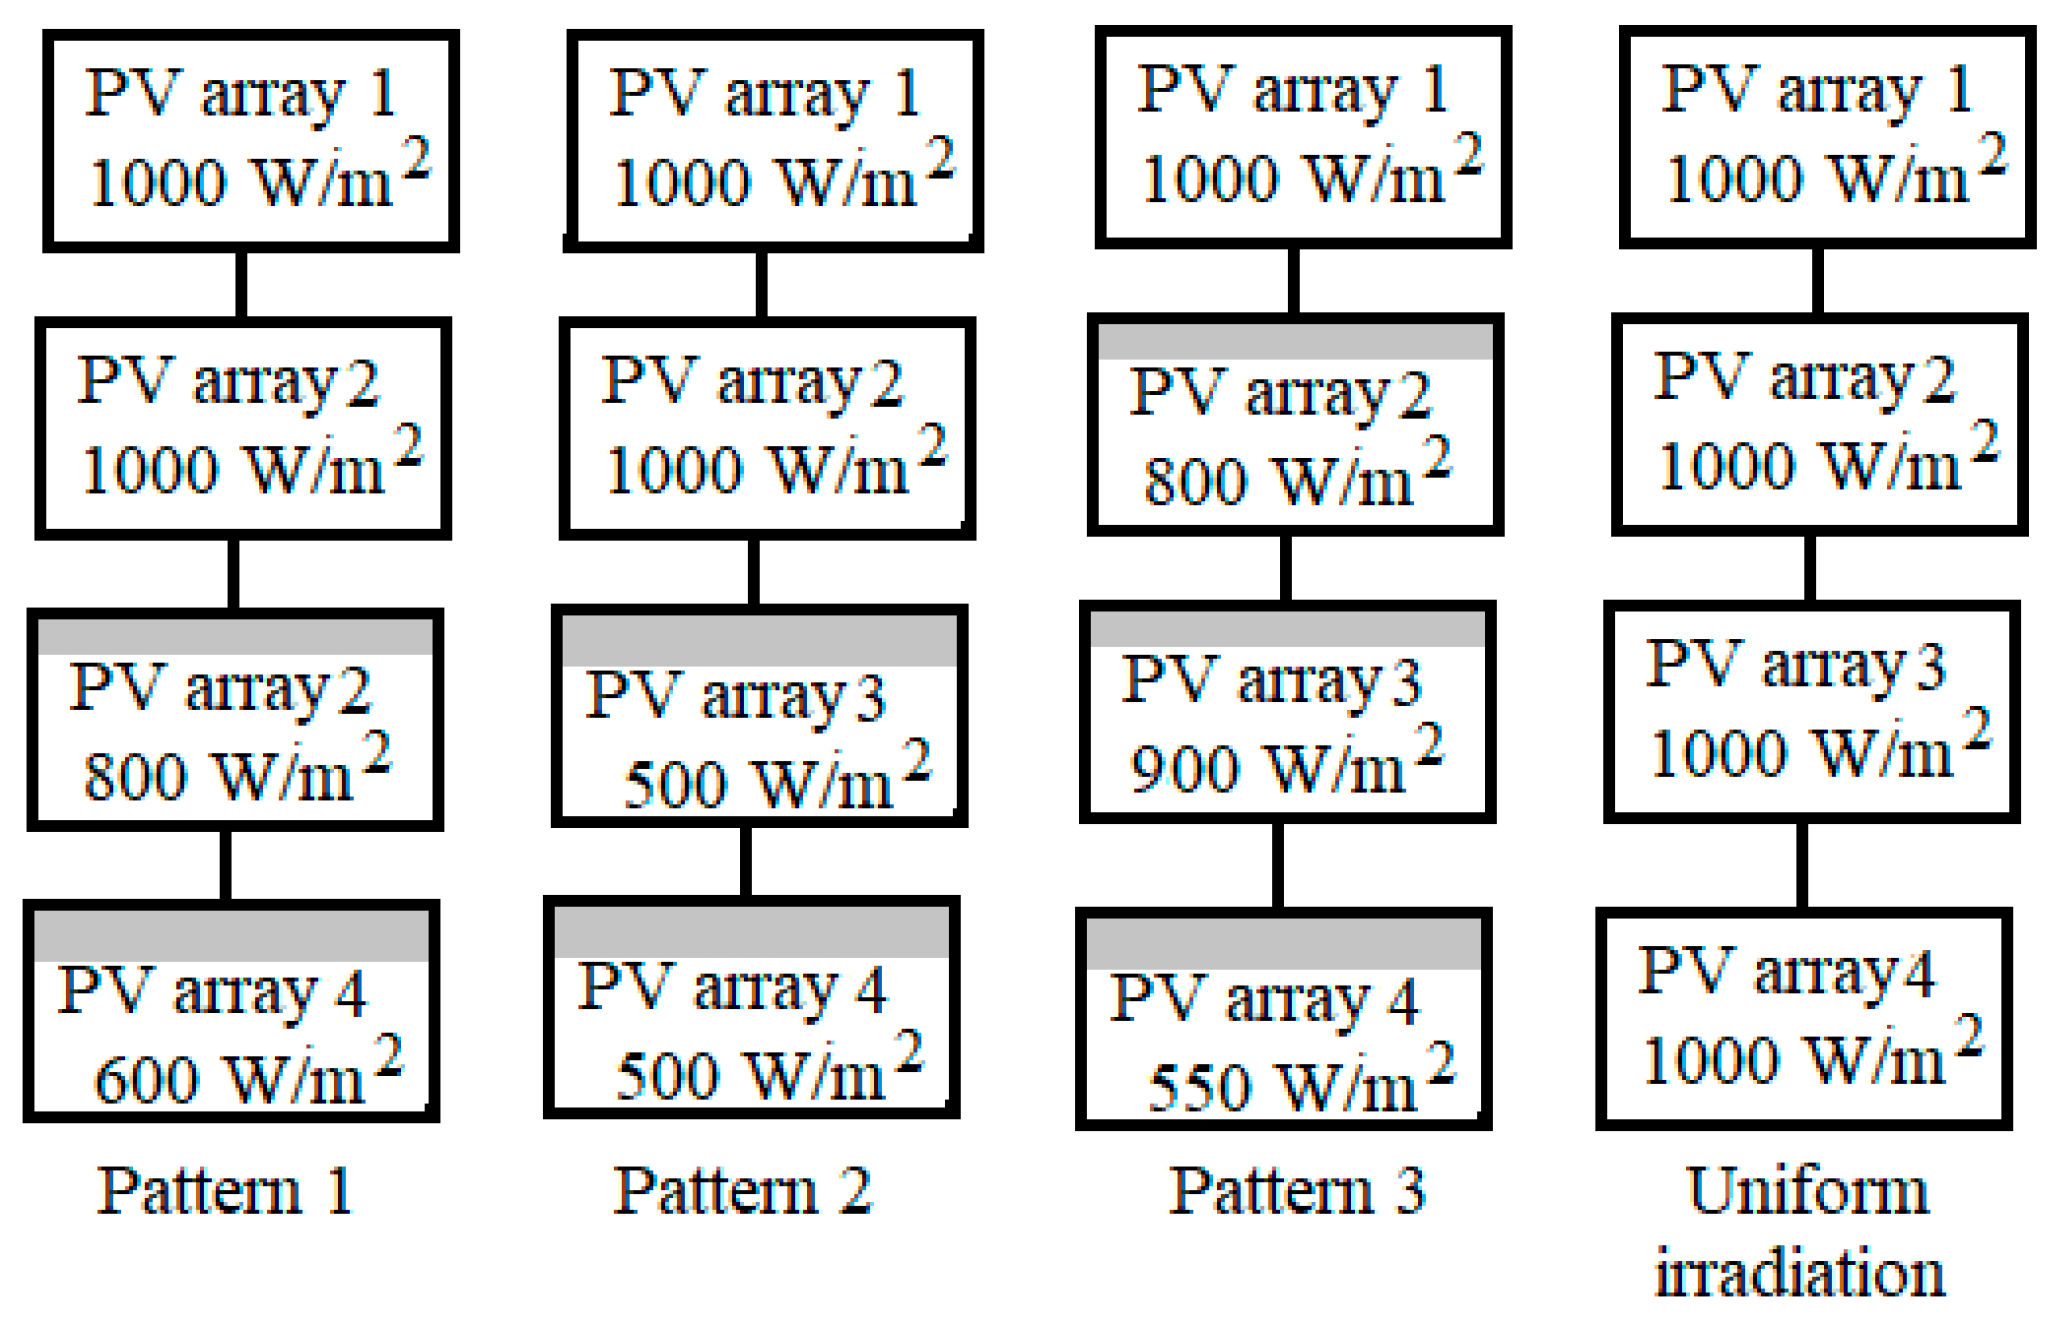
| Case No | Arrangement of PV Modules | No. of PV Modules | Irradiance Level | Temperature |
|---|---|---|---|---|
| 1 | Pattern-1 | 4 | 1000 W/m2 | 25 °C |
| 1000 W/m2 | ||||
| 800 W/m2 | ||||
| 600 W/m2 | ||||
| 2 | Pattern-2 | 4 | 1000 W/m2 | 25 °C |
| 1000 W/m2 | ||||
| 500 W/m2 | ||||
| 500 W/m2 | ||||
| 3 | Pattern-3 | 4 | 1000 W/m2 | 25 °C |
| 800 W/m2 | ||||
| 900 W/m2 | ||||
| 550 W/m2 | ||||
| 4 | Pattern-4 | 4 | 1000 W/m2 | 25 °C |
| 1000 W/m2 | ||||
| 1000 W/m2 | ||||
| 1000 W/m2 |
| Parameter | Value |
|---|---|
| Total cells/modules | 54 |
| Voc [V] | 33 |
| Isc [A] | 8 |
| Vmpp [V] | 26 |
| Impp [A] | 8 |
| Pmpp [W] | 200 |
| Specifications of DC-DC Boost Converter | |
| Input Inductance (L1) | 330 µF |
| Switching frequency | 25 kHz |
| Output side capacitance (Cout) | |
| Algorithm | Parameter | Value |
|---|---|---|
| CSO | Maximum number of iterations (T) | 25 |
| Number of cats | 25 | |
| Time step (Δt) | 1 | |
| SRD | 0.3 | |
| Constant number (C1) | 2 | |
| SMP | 5 | |
| CDC | 1 | |
| MR | 0.2 | |
| ChoA | Number of chimps | 25 |
| Maximum number of iterations (T) | 25 | |
| GWO | Number of. agents (wolf) | 25 |
| Maximum number of iterations (T) | 25 | |
| Control parameter (a) | 2 to 0 |
| Other Different Shading Patterns | Parameter | ChOA | GWO | CSO |
|---|---|---|---|---|
| G1 = [1000, 900, 800, 700] | Maximum power @GMPP(W) | 525.13 | 525.13 | 525.13 |
| Output voltage(V) | 115.23 | 115.47 | 117.48 | |
| Output current (A) | 4.54 | 4.52 | 4.412 | |
| Output power (W) | 523.14 | 521.92 | 518.357 | |
| Conversion efficiency (%) | 99.62 | 99.38 | 98.71 | |
| G2 = [900, 550, 100, 600] | Maximum power @GMPP(W) | 336.61 | 336.61 | 336.61 |
| Output voltage(V) | 84.57 | 83.4V | 82.46 | |
| Output current (A) | 3.9489 | 3.86A | 3.849 | |
| Output power (W) | 333.95 | 321.92 | 317.38 | |
| Conversion efficiency (%) | 99.21 | 95.63 | 94.28 | |
| G3 = [750, 850, 600, 800] | Maximum power @GMPP(W) | 340.06 | 340.06 | 340.06 |
| Output voltage(V) | 53.67 | 53.21 | 82.46 | |
| Output current (A) | 6.23 | 6.21 | 3.95 | |
| Output power (W) | 334.36 | 329.90 | 325.71 | |
| Conversion efficiency (%) | 98.32 | 97.01 | 95.78 | |
| G4 = [600, 800, 400, 200] | Maximum power @GMPP(W) | 258.29 | 258.29 | 258.29 |
| Output voltage(V) | 56.41 | 55.41 | 54.32 | |
| Output current (A) | 4.32 | 4.21 | 4.123 | |
| Output power (W) | 243.69 | 233.27 | 223.96 | |
| Conversion efficiency (%) | 94.34 | 90.31 | 86.70 | |
| G5 = [600, 200, 800, 250] | Maximum power @GMPP(W) | 191.22 | 191.22 | 191.21 |
| Output voltage(V) | 66.31 | 65.31 | 66.21 | |
| Output current (A) | 2.873 | 2.853 | 2.67 | |
| Output power (W) | 188.51 | 186.13 | 176.78 | |
| Conversion efficiency (%) | 98.58 | 97.33 | 92.45 | |
| G6 = [400, 600, 800, 100] | Maximum power @GMPP(W) | 232.52 | 232.52 | 232.52 |
| Output voltage(V) | 87.54 | 86.46 | 85.44 | |
| Output current (A) | 2.621 | 2.61 | 2.62 | |
| Output power (W) | 229.44 | 225.66 | 223.86 | |
| Conversion efficiency (%) | 98.67 | 97.04 | 96.27 |
Disclaimer/Publisher’s Note: The statements, opinions and data contained in all publications are solely those of the individual author(s) and contributor(s) and not of MDPI and/or the editor(s). MDPI and/or the editor(s) disclaim responsibility for any injury to people or property resulting from any ideas, methods, instructions or products referred to in the content. |
© 2023 by the authors. Licensee MDPI, Basel, Switzerland. This article is an open access article distributed under the terms and conditions of the Creative Commons Attribution (CC BY) license (https://creativecommons.org/licenses/by/4.0/).
Share and Cite
Nagadurga, T.; Devarapalli, R.; Knypiński, Ł. Comparison of Meta-Heuristic Optimization Algorithms for Global Maximum Power Point Tracking of Partially Shaded Solar Photovoltaic Systems. Algorithms 2023, 16, 376. https://doi.org/10.3390/a16080376
Nagadurga T, Devarapalli R, Knypiński Ł. Comparison of Meta-Heuristic Optimization Algorithms for Global Maximum Power Point Tracking of Partially Shaded Solar Photovoltaic Systems. Algorithms. 2023; 16(8):376. https://doi.org/10.3390/a16080376
Chicago/Turabian StyleNagadurga, Timmidi, Ramesh Devarapalli, and Łukasz Knypiński. 2023. "Comparison of Meta-Heuristic Optimization Algorithms for Global Maximum Power Point Tracking of Partially Shaded Solar Photovoltaic Systems" Algorithms 16, no. 8: 376. https://doi.org/10.3390/a16080376
APA StyleNagadurga, T., Devarapalli, R., & Knypiński, Ł. (2023). Comparison of Meta-Heuristic Optimization Algorithms for Global Maximum Power Point Tracking of Partially Shaded Solar Photovoltaic Systems. Algorithms, 16(8), 376. https://doi.org/10.3390/a16080376