Article

Error Investigation on Wi-Fi RTT in Commercial Consumer Devices

School of Engineering, University of Edinburgh, Edinburgh EH8 9YL, UK
*
Authors to whom correspondence should be addressed.
Algorithms 2022, 15(12), 464; https://doi.org/10.3390/a15120464
Submission received: 25 October 2022 / Revised: 18 November 2022 / Accepted: 3 December 2022 / Published: 7 December 2022
(This article belongs to the Collection Feature Papers in Algorithms)

Abstract

:
Researchers have explored multiple Wi-Fi features to estimate user locations in indoor environments in the past decade, such as Received Signal Strength Indication (RSSI), Channel State Information (CSI), Time of Arrival (TOA), and Angle of Arrive (AoA). Fine Time Measurement (FTM) is a protocol standardized by IEEE 802.11-2016, which can estimate the distance between the initiator and the station using Wi-Fi Round-Trip Time (RTT). Promoted by Google, such a protocol has been explored in many mobile localization algorithms, which can provide meter-level positioning accuracy between Wi-Fi RTT-enabled smartphones and access points (APs). However, previous studies have shown that the Wi-Fi RTT measurements are sensitive to environmental changes, which leads to significant errors in the localization algorithms. Such an error usually varies according to different environments and settings. Therefore, this paper investigates the error in Wi-Fi RTT distance measurements by setting multiple experiments with different hardware, motion status, and signal path loss conditions. The experiment results show that four categories of errors are found in RTT distance measurements, including hardware-dependent bias, blocker-dependent bias, fluctuations, and outliers. Comparison and analysis are carried out to illustrate the impact of the different errors on Wi-Fi RTT distance.

1. Introduction

The Global Positioning System (GPS) has served for years for providing reliable Location-Based-Services (LBS) in outdoor scenarios. However, the performance of GPS signal degrades in indoor scenarios caused by blockers, such as walls and roofs. In recent years, Wi-Fi has been widely explored to provide LBS in complex indoor environments due to easy implementation and no requirements for extra infrastructure. Researchers have explored multiple Wi-Fi characteristics to estimate user locations, including Received Signal Strength Indication (RSSI) [1], Channel State Information (CSI) [2], Time of Arrival (TOA) [3], and Angle of Arrive (AoA) [4].
In recent years, a new protocol of Fine Time Measurement (FTM) has been standardized by IEEE 802.11-2016 to provide meter-level positioning accuracy [5] using the new technology of Round-Trip Time (RTT). Such a protocol is able to calculate the distance between the RTT-enabled smartphone and the Access Point (AP) by measuring the round-trip time of flight of the signal. Compared to other techniques (such as TOF), Wi-Fi RTT does not require clock synchronization between APs and smartphones. Wi-Fi RTT shows great potential to provide indoor positioning service for mobile users. Some researchers have shown efforts to calibrate the signal or develop reliable positioning algorithms in recent years [6,7,8,9,10,11,12,13,14,15,16].
In 2018, Google introduced the Wi-Fi API to the Android system for smartphones running Android 9 (Pie) or later [17]. Promoted by Google, new smartphones from many manufacturers with up-to-date Android systems support Wi-Fi RTT. Such smartphones can send Wi-Fi ranging requests to nearby APs to measure their distance according to the Wi-Fi signal traveling time in a very short latency. In addition, Google has also introduced some apps for developers and researchers to test and explore the RTT signal for distance estimation and positioning use. Wi-Fi RTT has great potential to become a prevailing positioning method in the near future.
Although Google claims that Wi-Fi RTT provides highly accurate distance estimations (meter-level accuracy), the error in Wi-Fi RTT distance measurements varies according to different environments and settings. The study from Horn [18] shows that the Wi-Fi RTT distance can be affected by hardware and position. It also suggests that position-dependent error caused by user motion usually leads to a significant error in the ranging results. Moreover, the non-line-of-sight/line-of-sight (NLOS/LOS) condition is also the main factor that leads to inaccurate Wi-Fi RTT distance measurements. Yu et al. [19] conducted some experiments to block the RTT signal using different materials of blockers to evaluate the Wi-Fi RTT distance measurements in NLOS conditions. However, the experiments and analysis are not enough to cover the possible situations in complex indoor environments, particularly when considering the complicated settings of different user devices, motion status, and signal pass losses.
Therefore, this study explores the errors of Wi-Fi RTT distance measurements for mobile localization with extensive experiments. The contributions are as follows:
  • This paper fully investigates, analyzes, and summarises four categories of errors in Wi-Fi RTT distance measurements, including hardware-dependent bias, blocker-dependent bias, fluctuations, and outliers.
  • Two cases of keeping the smartphone static or varying its position during continuous measurement of the Wi-Fi RTT distance are stipulated to analyze the errors against user movements.
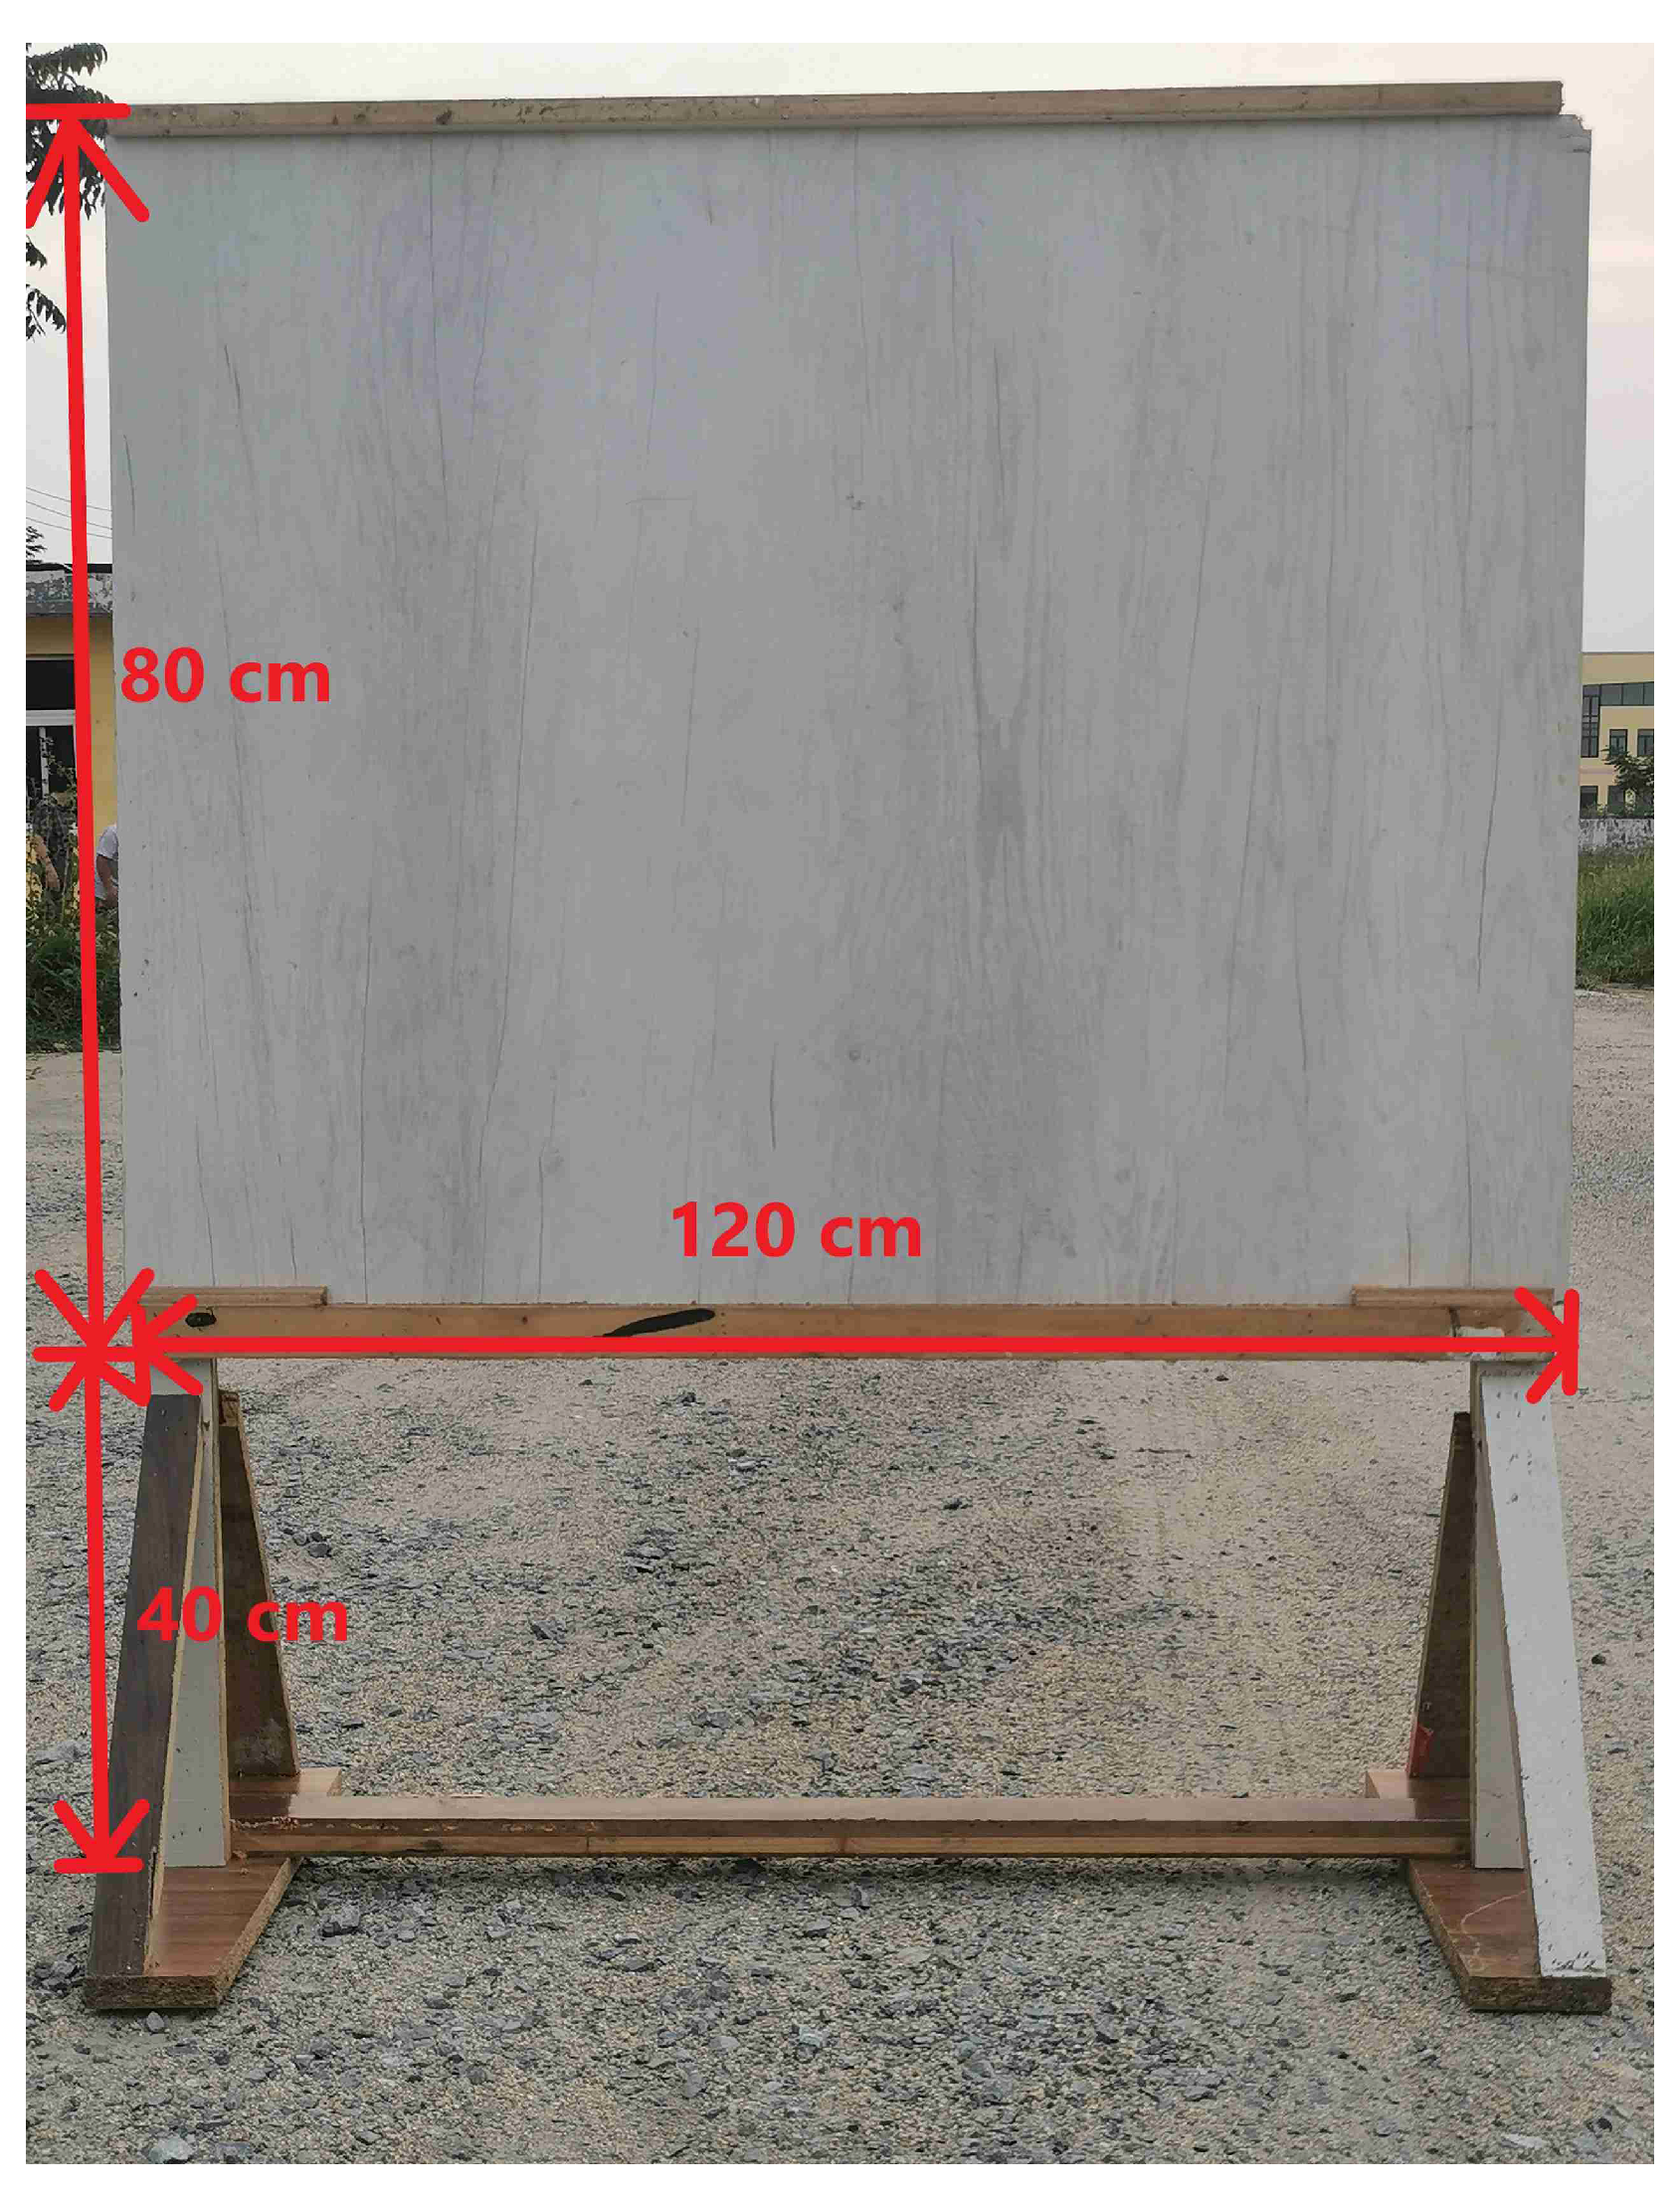
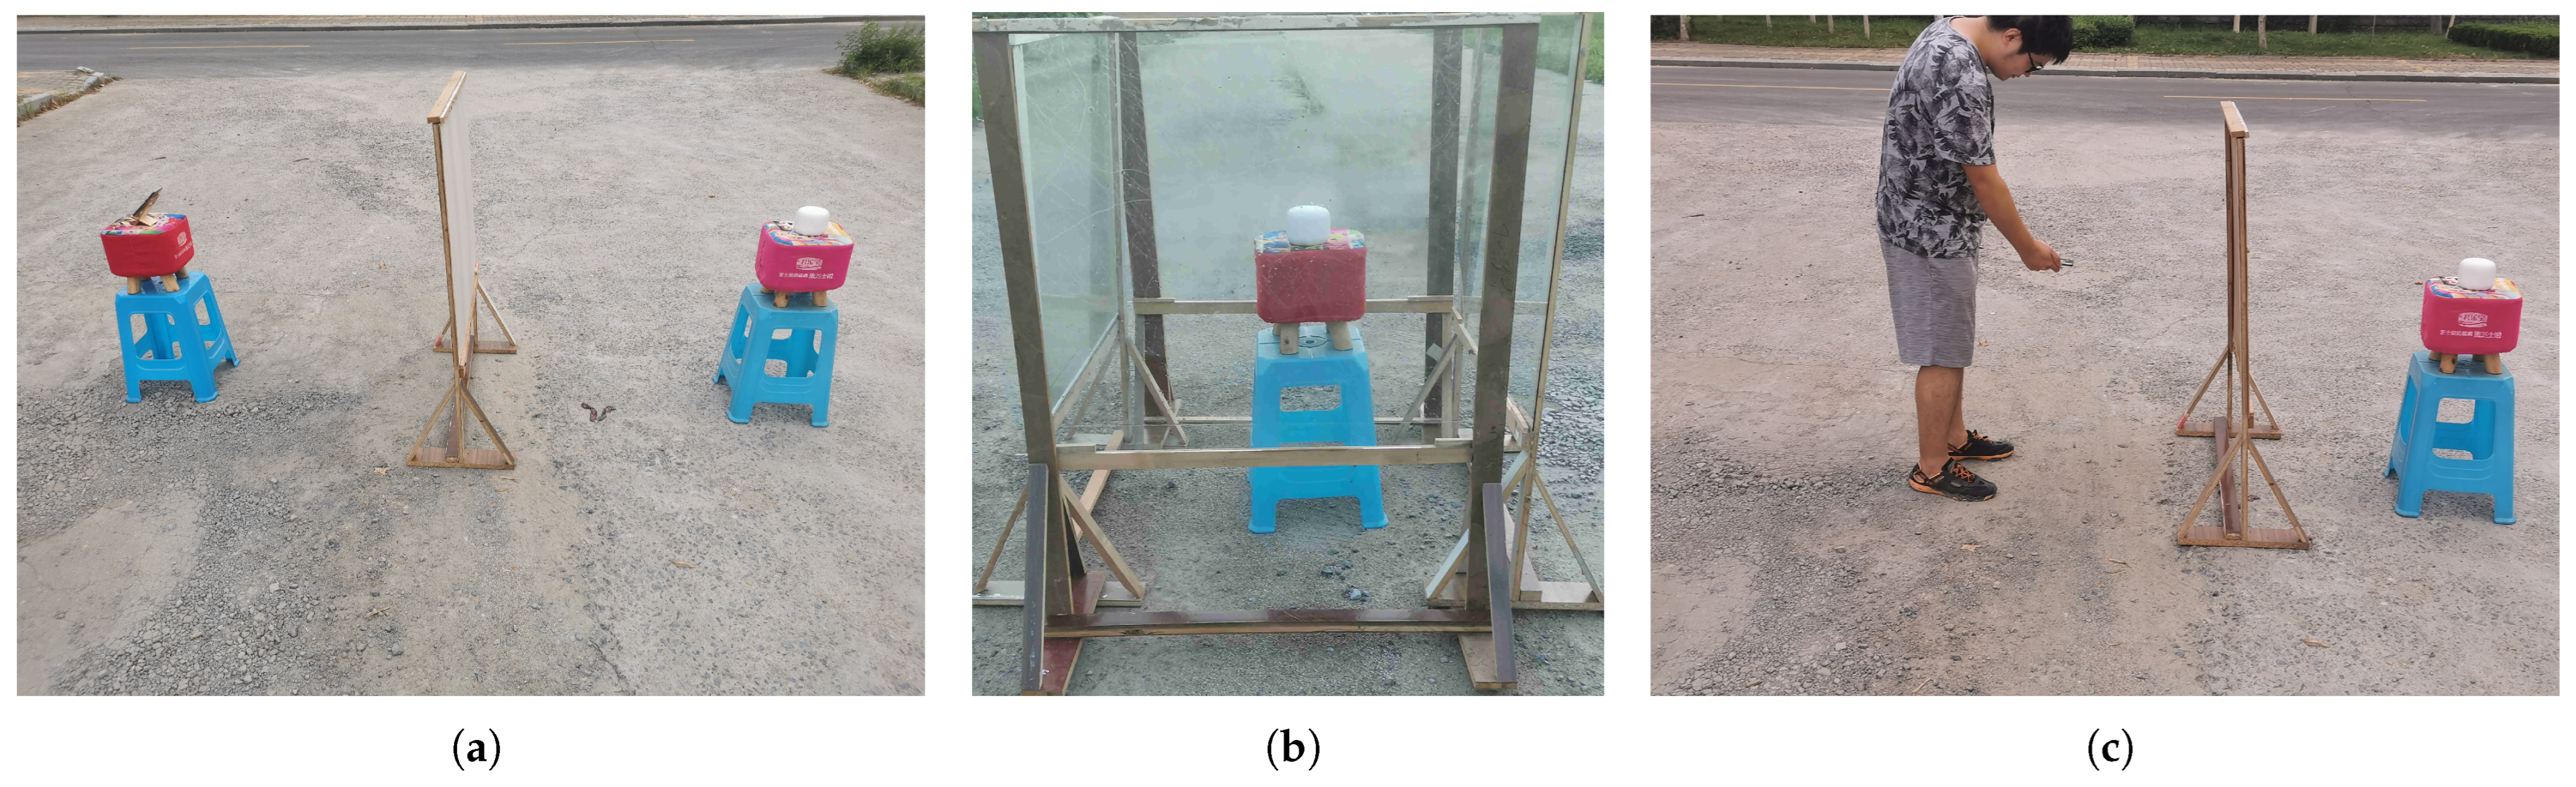
  • Different materials are used to block the signal path to evaluate the errors against complex NLOS conditions.
The rest of the paper is organized as follows. In Section 2, we introduce the background knowledge of using RTT signals to measure the distance between RTT-enabled smartphones and APs. Capable hardware and software proposed in recent years for such research topics are summarised. In Section 3, various experiments are set to investigate the errors in Wi-Fi RTT distance measurements. The experimental results are illustrated and analyzed in Section 4. Conclusions and future works are made in Section 5.

2. Related Works

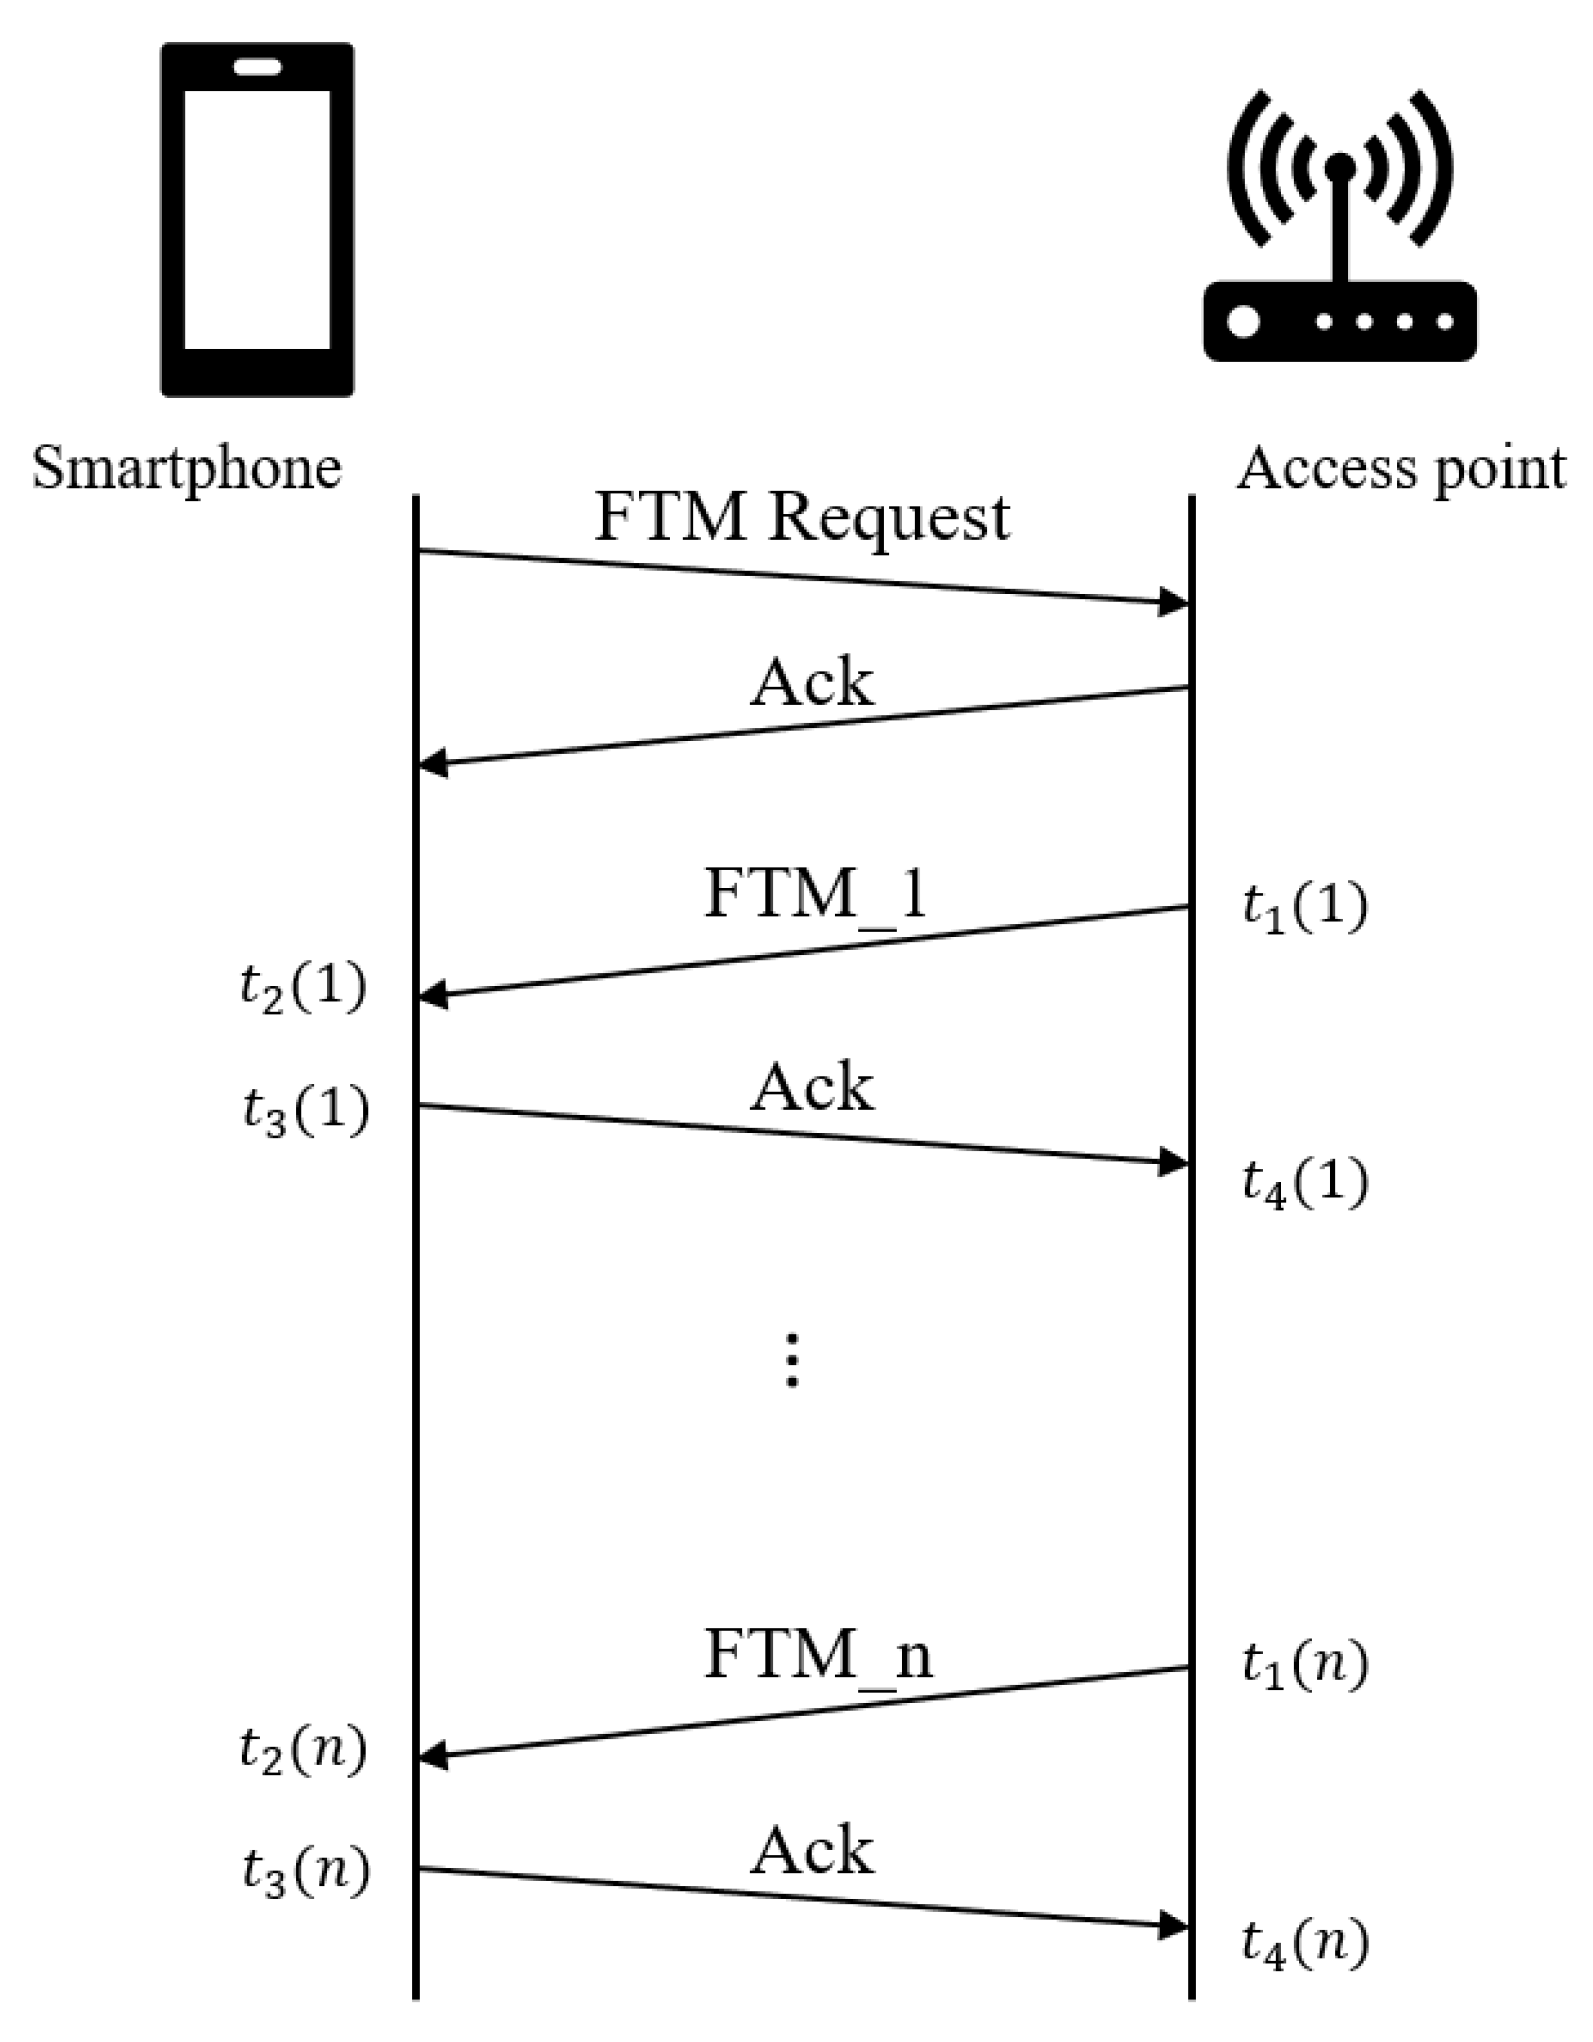
2.1. Fine Time Measurement Protocol

FTM protocol is able to estimate the distance between the smartphone and the AP by calculating the round-trip time of flight of the signal. As shown in Figure 1, the smartphone sends one Initial FTM Request (iFTMR) to the AP and receives an acknowledgment (ACK) at the beginning. Then, the AP gives a burst containing at most 31 FTMs (excluding the iFTMR) with the timestamps recording when the signal is sent and received. Based on this information, the round-trip time of flight of the signal can be calculated through the equation:
R T T = k = 1 n ( ( t 4 t 1 ) ( t 3 t 2 ) )
Hence the distance between the smartphone and the AP can be calculated by:
1 2 × R T T × c
where c denotes the speed of light ( c = 3 10 8 m/s).
Figure 1. Overview of FTM protocol (one FTM request gives one burst with n FTMs ( n 31 ) [20].
Algorithms 15 00464 g001

2.2. Ranging with Wi-Fi RTT in Android

The protocol of FTM has been implemented in Wi-Fi RTT API and introduced since Android 9 (API level 28). Such an API can estimate the distance from the RTT-enabled smartphones to RTT-enabled Wi-Fi access points [17] and other neighboring RTT-enabled smartphones [21]. As officially claimed by Google, more than 40 flagship models of smartphones from different manufacturers are RTT-enabled, such as Google, Xiaomi, LG, Samsung, and Sharp [17]. Particularly, all the phones from the Google Pixel series (from Google Pixel 1 to Google Pixel 6 Pro) support such functions. Moreover, there are also multiple retail, warehousing, and distribution center devices that support Wi-Fi RTT, such as Zebra PS20 and Skorpio X5 [17]. In contrast, the only three consumer APs that officially claim to support RTT are the APs from the Google Wi-Fi series, including Google Wi-Fi, Google Nest Wi-Fi Router, and Google Nest Wi-Fi Point [17]. Although Google also officially claims that Compulab WILD AP developed by Compulab [22] is RTT-capable, it is not recommended for new projects and is not available as advertised on its website [22]. There are also some other enterprise options from Aruba that are RTT-enabled. Nevertheless, only three models of Google APs have proven standard compatibility officially and are available to consumers at the moment, which narrows the options.
Besides the hardware, some apps have been introduced by Google and other developers for exploring the Wi-Fi RTT API with Android smartphones. The first app developed by Google, named WiFiRttScan, can discover nearby RTT-enabled APs and estimate the distance using Wi-Fi RTT API [23]. It can provide various information of the discovered AP, such as BSSID, SSID, RSSI, range, mean range, and range standard deviation. It also supports data logging by storing the measurements/estimations in an Excel file. The code of the original (old) version of this open-source project can be found in GitHub [24]. Israel and Enrica [25] developed a new app based on WiFiRttScan by adding some new functions, such as conducting sampling campaigns and showing RTT capabilities of all nearby APs. However, one major limitation of these two apps is they cannot handle the simultaneous reading of multiple nearby RTT-capable APs. Compulab released one app named WILD Minimal [26] which can read from multiple APs at the same time but with limited information, including BSSID, range, range standard deviation, and RSSI. In June 2021, Google released a new app named WiFiRttLocator to demonstrate indoor positioning with Wi-Fi RTT [27]. Rather than only providing distance estimations, such an app can even provide location information by calculating from multiple (at least three) Google APs. However, the complex configuration of the app should be completed before starting the Wi-Fi scanning. This includes locating the floor plan on the map, obtaining precise ground truth (latitude and longitude) of the APs, and so on. A new Android app named FTMRTT developed by Horn was released [28] in 2022. The location of the APs can be provided in any convenient Cartesian coordinate system (in meters) in the app, which is much easier to configure than WiFiRttLocator. Moreover, this app supports more functions, such as showing the measurement error and working with uncooperative APs in one-sided RTT mode [29].

3. Wi-Fi RTT Distance Error Measurements

3.1. Experiment Devices and Software

Many new Android-powered smartphones support the Wi-Fi RTT feature. This study chose three smartphones from different manufacturers as the initiator. This includes Google Pixel 2 (from Google), Xiaomi Redmi K20 (from Xiaomi), and LG V50S (from LG). All of them were embedded with an Android 9+ system to support the Wi-Fi RTT feature. More details can be found in Table 1.
However, as discussed in Section 2.2, Google Wi-Fi is the only standard with proven compatibility available to consumers at the moment. Therefore, we chose the latest Google Nest Wi-Fi in this study. The AP operated in simultaneous dual-band (2.4 GHz/5 GHz, only 5 GHz supports Wi-Fi RTT).
To collect Wi-Fi RTT measurement samples, we installed the Android app named WiFiRTTScan (developed by Google) on each smartphone to send ranging requests and receive ranging results.
All the data processing, analysis, and algorithms were operated using Python 3.8 and Matlab on a desktop with an Intel i7-9700 CPU (3.00 GHz) and 32 GB memory.

3.2. Experimental Sites

Our study mainly investigated the measurement error caused by blockers (with different materials), phones, communication distance, and motion. All the experiments were in open outdoor space to evaluate the single source of interference or some of their combinations on the accuracy of Wi-Fi-RTT distance measurements. In general, we had three different experimental sites:
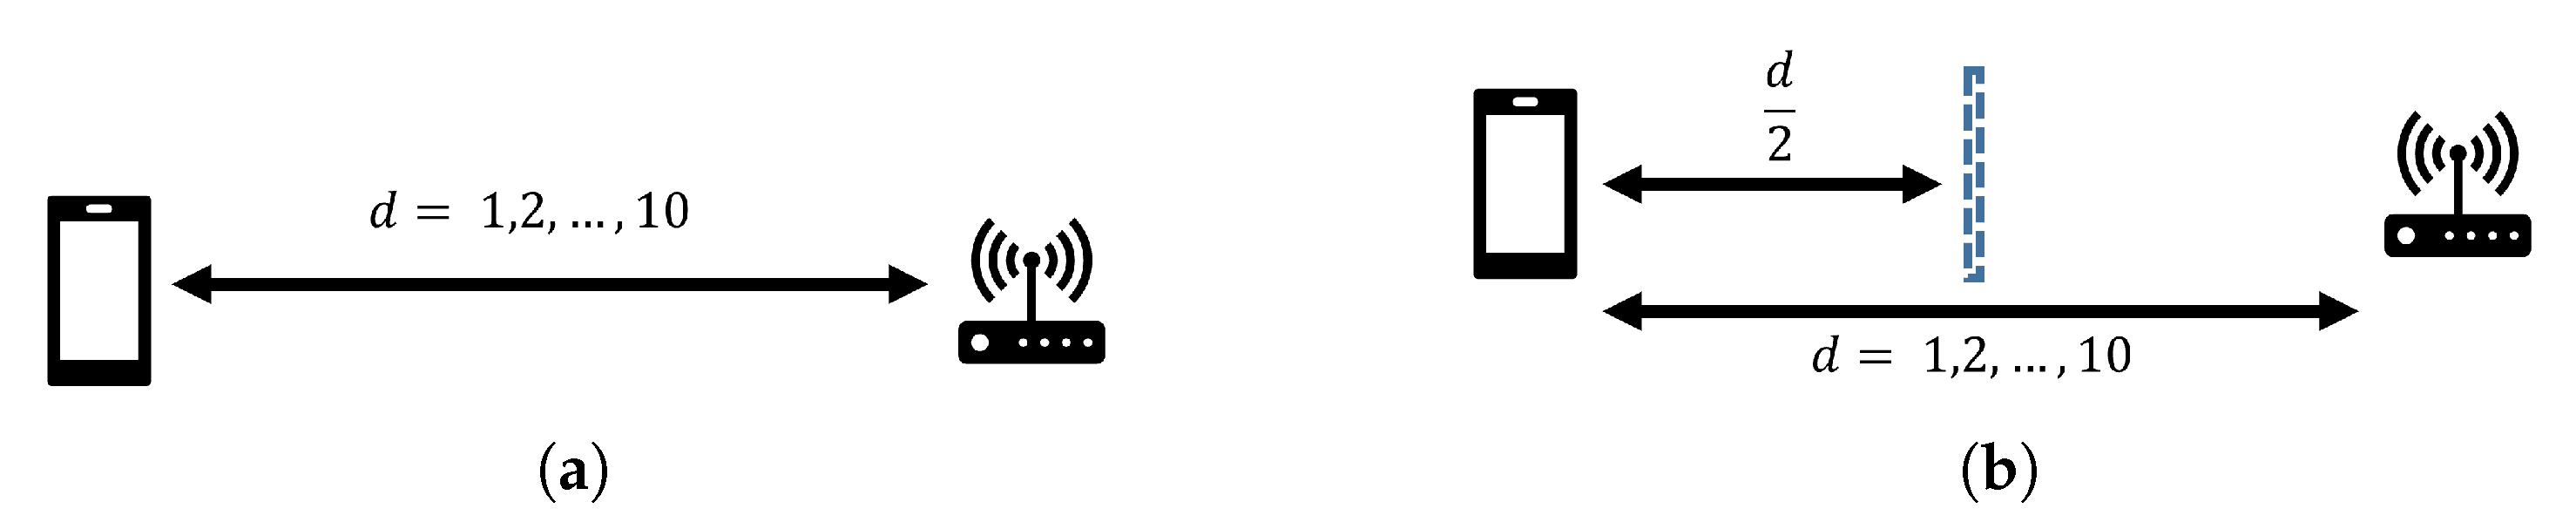
  • Range and position-fixed environment (RFPF): considering a sampling period of t s, the smartphone was fixed at a certain position at a distance d m to the AP.
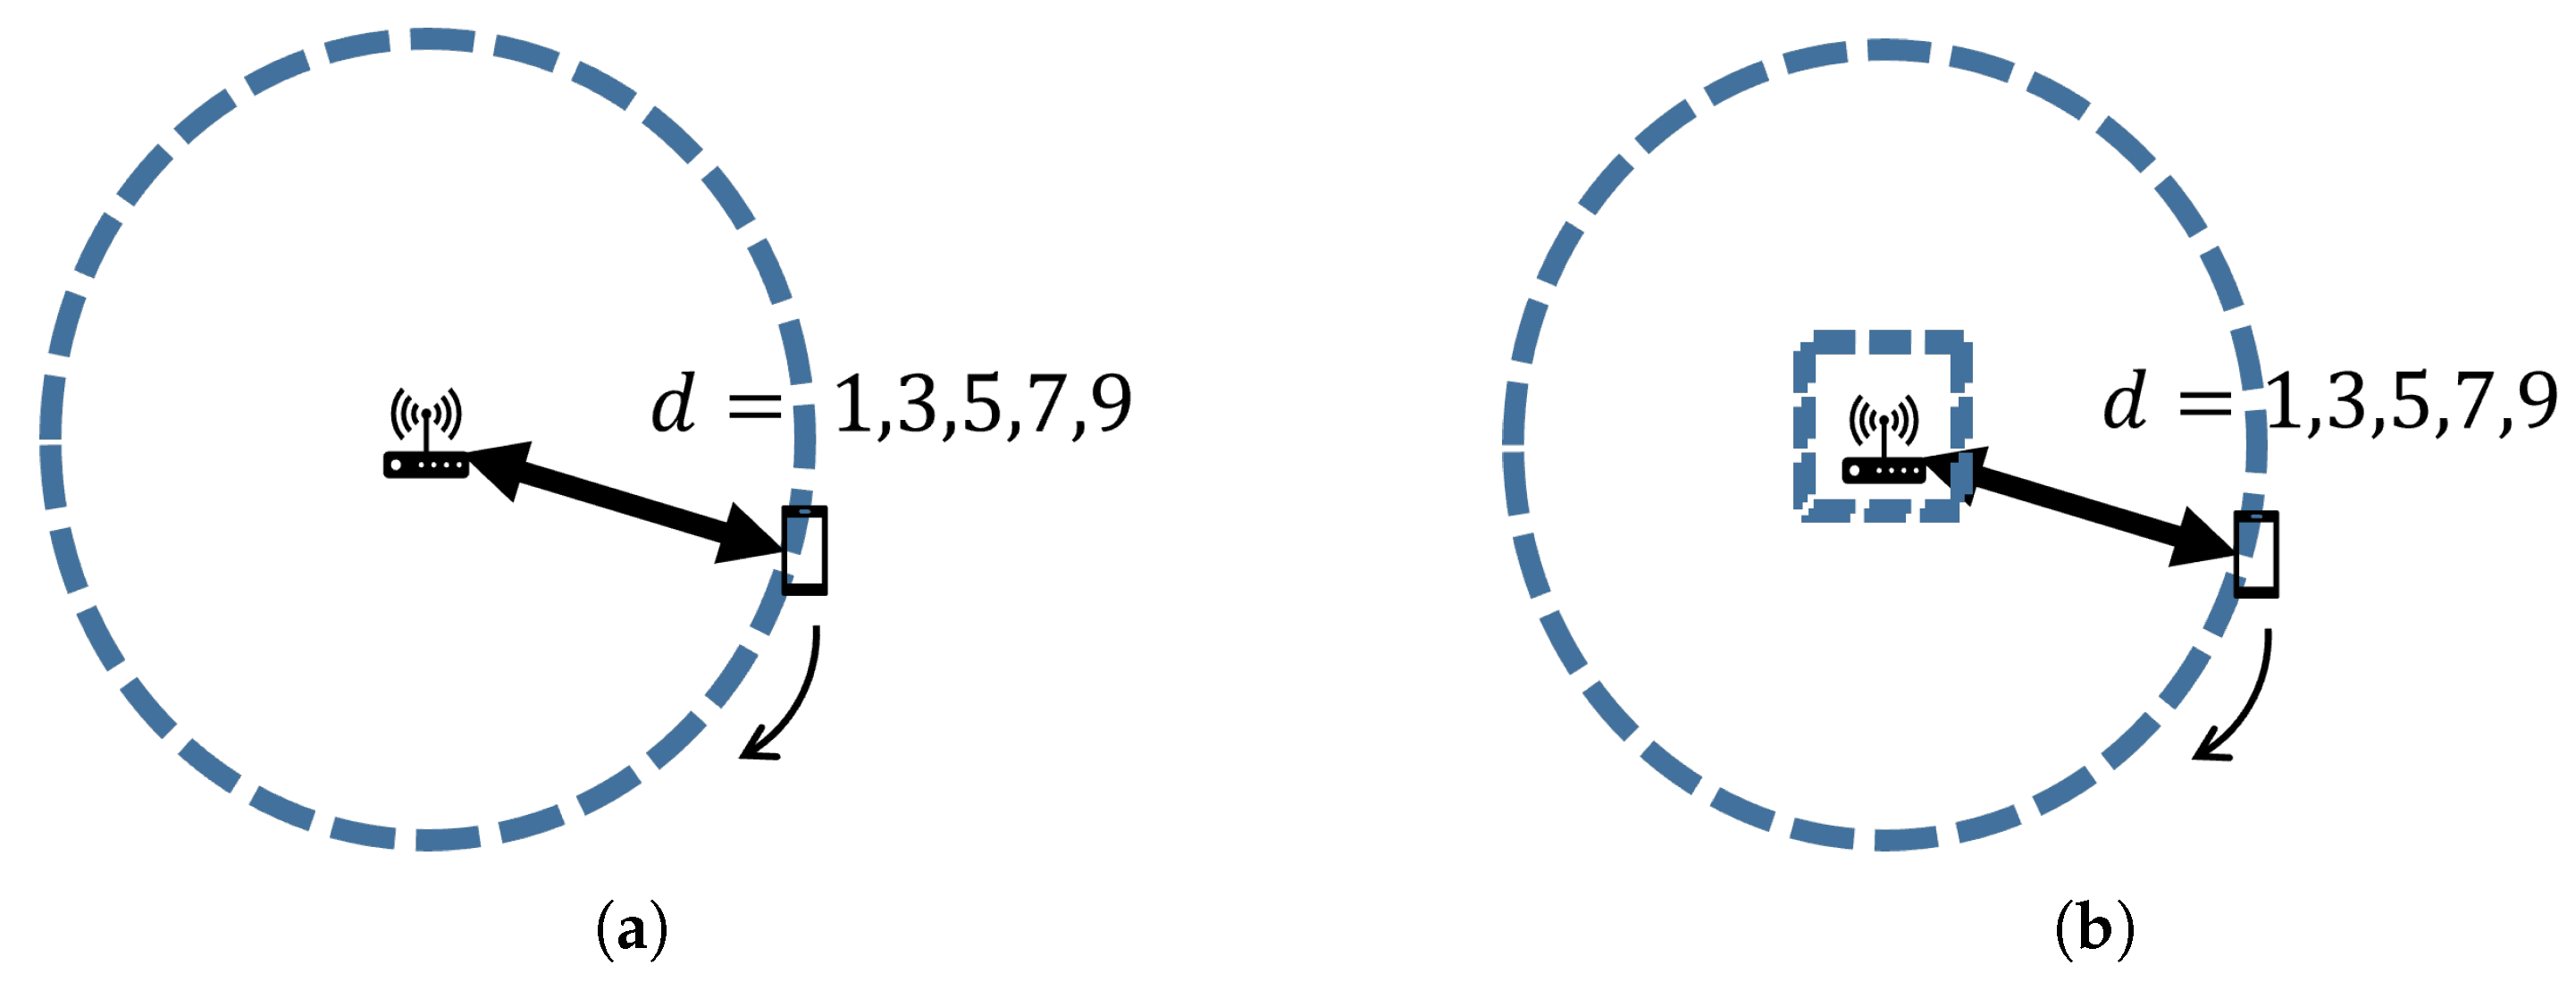
  • Range-fixed and position-varied environment (RFPV): considering a sampling period of t s, the smartphone was held by a pedestrian (volunteer) while the distance between the pedestrian and the AP remained at d m to the AP.
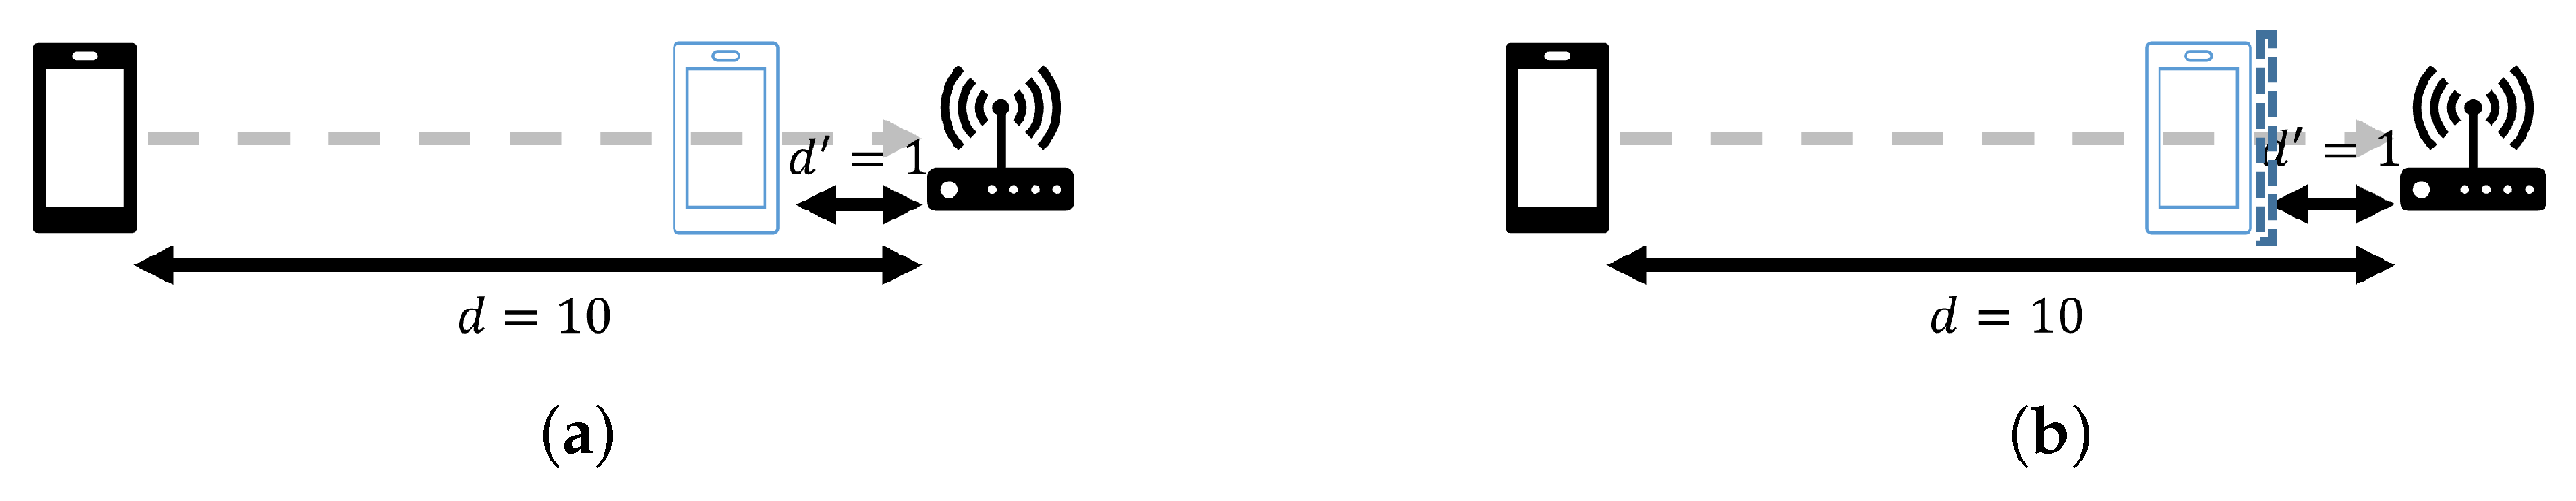
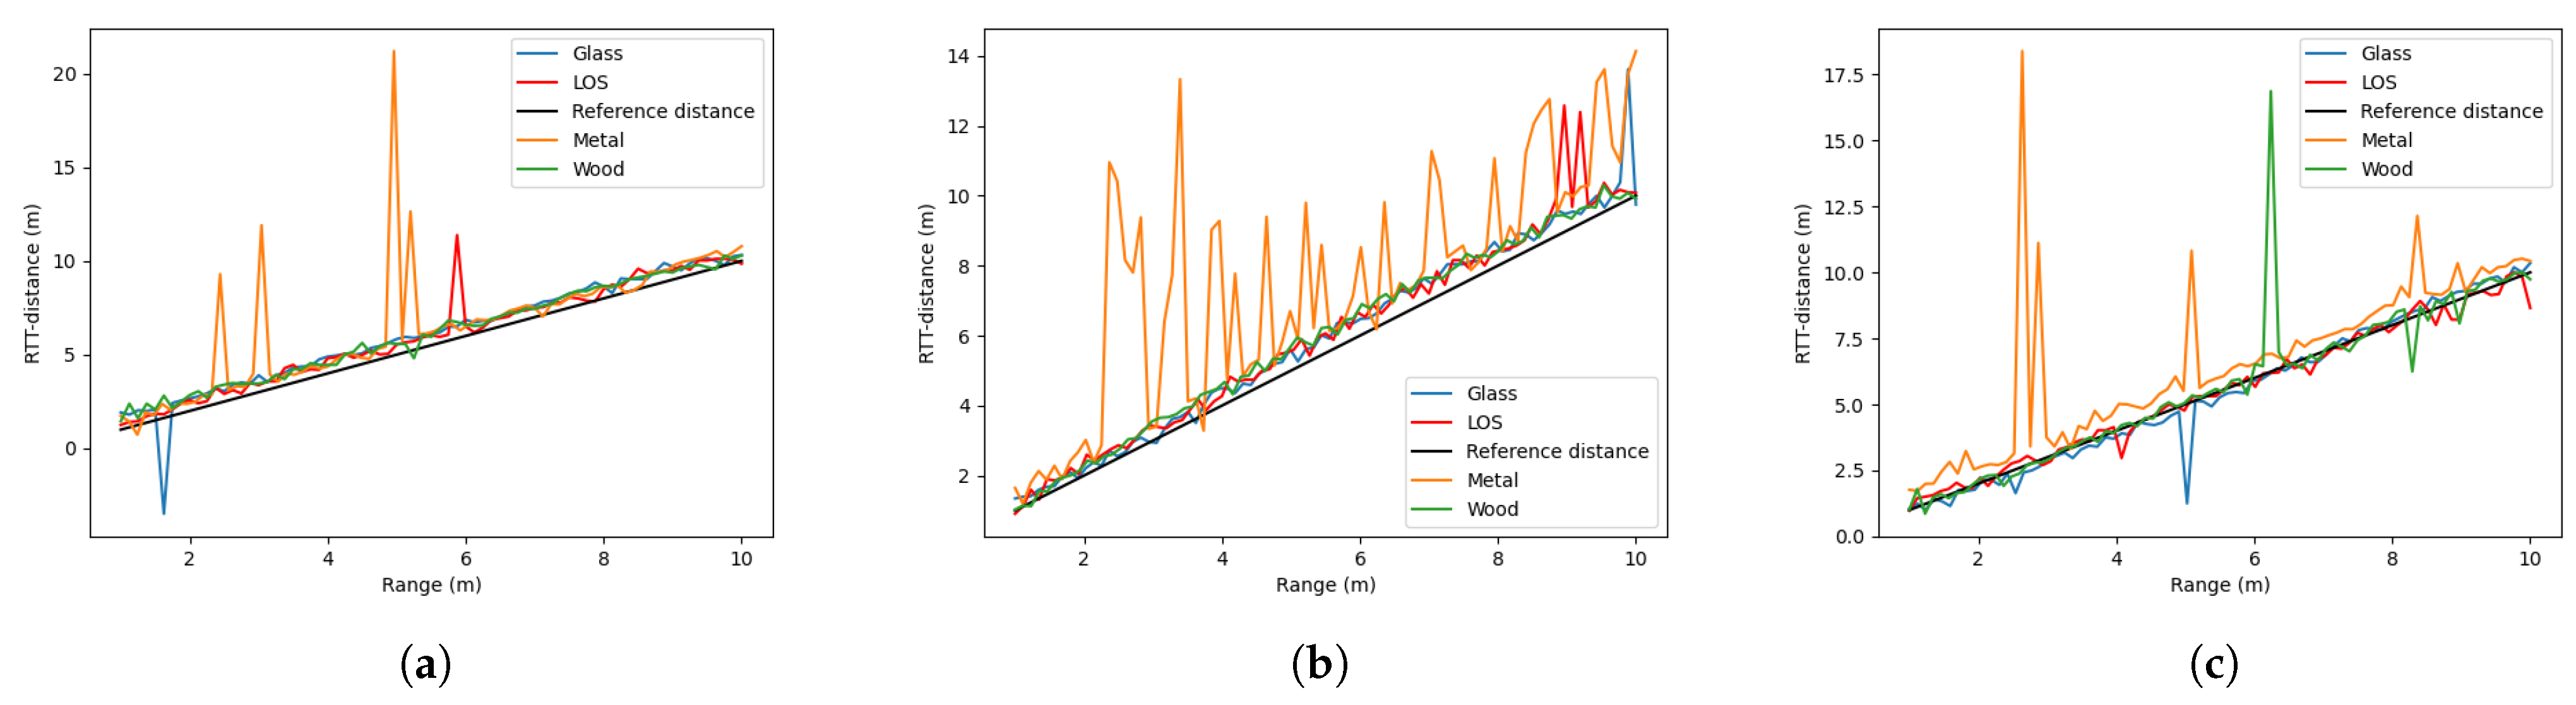
  • Range and position-varied environment (RVPV): considering a sampling period of t s, the smartphone was held by a pedestrian (volunteer) while the distance between the pedestrian and the AP varied between d m to d m.
All the experimental sites were set outdoors, away from other objects (except the ground). The samples were collected in both LOS and NLOS conditions by setting different blocks in each site. The LOS between the transmitter and receiver antenna is the central direct transmission path line of an ellipsoidal-shaped region in space. Such a long ellipsoidal-shaped region is also called the Fresnel zone. To ensure the LOS condition, the primary (first) Fresnel zone at the radius of R should be ideally 60–80% clear of obstacles. The radius R can be calculated as follows:
R ( d 1 d 2 ) / ( d 1 + d 2 ) λ
where d 1 and d 2 represent the distance from the transmitter to the blocker and the distance from the blocker to the receiver, and λ denotes the wavelength. As d 1 and d 2 are in the range of 1 m to 5 m and 1 m to 9 m, and d 1 + d 2 is less than 10 m in this study (will be illustrated later), the maximum R can be calculated to about 0.39 m when d 1 = d 2 = 5 m. So, the AP was placed 0.74 m above the ground to reduce the influence from the ground.
To obtain the NLOS condition, the ideal radius of the blocker should yield the maximum R of 0.39 m. As shown in Figure 2, the blocker was supported by a wooden frame and placed 0.4 m above the ground. The main body of the blocker was in the shape of a 1.2 m × 0.8 m rectangle with a thickness of 2 mm. With such a design, the blocker can sufficiently block the first Fresnel zone. We swapped the main body of the blocker to different materials, including glass, wood and metal for each experiment in each site.
The blockers’ settings in each environment are shown in Figure 3. The detailed illustration of each environment is as follows.

3.2.1. Range and Position-Fixed Environment

As shown in Figure 4a, a LOS condition in the RFPF environment was first constructed. The smartphone and the AP were placed 0.74 m above the ground to reduce the reflection. We can observe from the figure that no obstacle blocked the signal transmission between the smartphone and the AP. In addition, we placed the smartphone at a specific ground truth distance dm to the AP ( d = 1 , 2 , , 10 ). We collected at least 3000 samples at the sampling period of 250 ms at each distance.
Based on such settings, we then constructed an NLOS condition by adding a blocker at the transmission line between the smartphone and the AP, as shown in Figure 3a.
Similarly, at least 3000 samples at the same sampling period of 250 ms were collected at each distance as shown in Figure 4b. After collecting enough samples at all distances, the material of the blocker was changed, and the same sample collection procedure was repeated. In all environments in this paper, three different blockers were used: wood, glass, and metal.
In both LOS and NLOS conditions, the sample collection procedures were conducted repeatedly for all three smartphones.

3.2.2. Range-Fixed and Position-Varied Environment

A volunteer was employed to hold the smartphone and collect the samples following a specific route in this environment. Similarly, a LOS condition was first set in this environment. As shown in Figure 5a, a circular route was stipulated surrounding the AP at the radius of d m so that the range between the smartphone and the AP was fixed ( d = 1 , 3 , 5 , 7 , 9 ) while the smartphone’s position changed. At each distance, samples were collected at the sampling period of 200 ms for at least 250 s. This data collection provided us with more than 1000 samples in each case and ensured that the entire circular route could be finished at least once.
Then, an NLOS condition was constructed by setting the same blockers used in RFPF. As shown in Figure 3b, different from the NLOS settings in RFPF, we added three more blockers to entirely block the signal transmission to all directions. Identical to the LOS condition, we collected samples at the sampling period of 200 ms for at least 250 s for each circular route. Once all routes had been finished, the material of the blocker was changed and the same sample collection procedure was repeated.
Similarly, we adopted the same sample collection procedures for all three different smartphones in both LOS and NLOS conditions.

3.2.3. Range and Position-Varied Environment

The range between the smartphone and the AP was varied in this case. Specifically, the volunteer was asked to hold the phone and walk away from the AP from 1 m to 10 m. As shown in Figure 3c, the volunteer held the smartphone pointed toward the AP and kept this pose when collecting samples. One complete collection of samples from 10 m to 1 m with one smartphone took 20 s, while the walking speed of the volunteer remained approximately constant. The sampling period was set as 200 ms. Similar to the previous environments, we swapped the smartphones and the blockers to collect samples in both NLOS and LOS conditions. The schematic of this environment is shown in Figure 6.

3.3. Evaluation Metrics

Some metrics were used to quantify the error between the measurements (RTT-based distance measurements) and the ground truth to evaluate the measurement noise. Specifically, Root Mean Squared Error (RMSE) was chosen as the main metric for all evaluations. The RMSE of n samples is calculated by:
R M S E = 1 n i = 1 n d m , i d g , i 2
where d m , i denotes the ith measurement, and d g , i stands for the ith ground truth distance.

4. Experimental Results and Analysis

4.1. Verification of the Effectiveness of the Blockers

As illustrated in the experimental settings in Section 3.2, our calculation showed that the designed blockers should block the direct transmission path and attenuate the signal. To further verify the effectiveness of the blockers, we conducted a preliminary experiment by setting the smartphone and the AP at both sides and 5 m away from the blocker. We compared the RSSI values from the smartphone in LOS (no blocker) and NLOS (blocker with different materials) conditions. The mean RSSI is listed in Table 2. Note that the signal strength decreased in NLOS conditions with all blockers and smartphones. The results verify that the blocker’s design and settings can effectively create an NLOS condition to attenuate the signal.

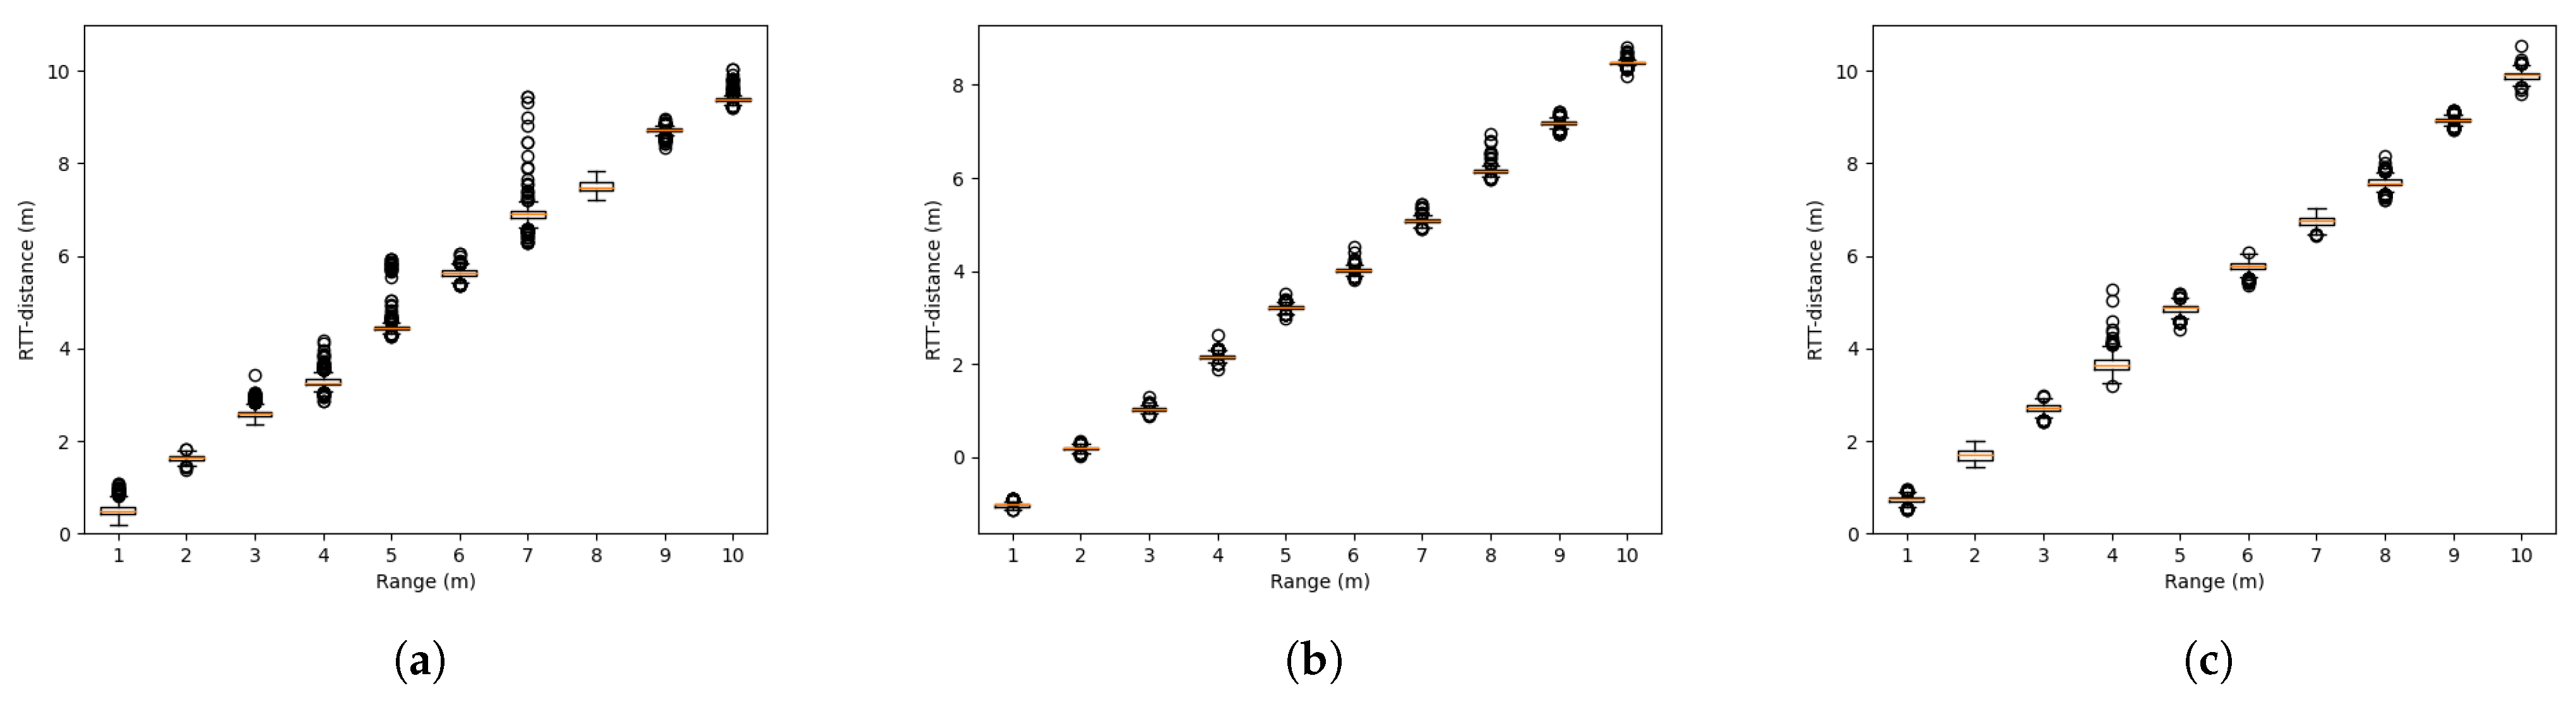
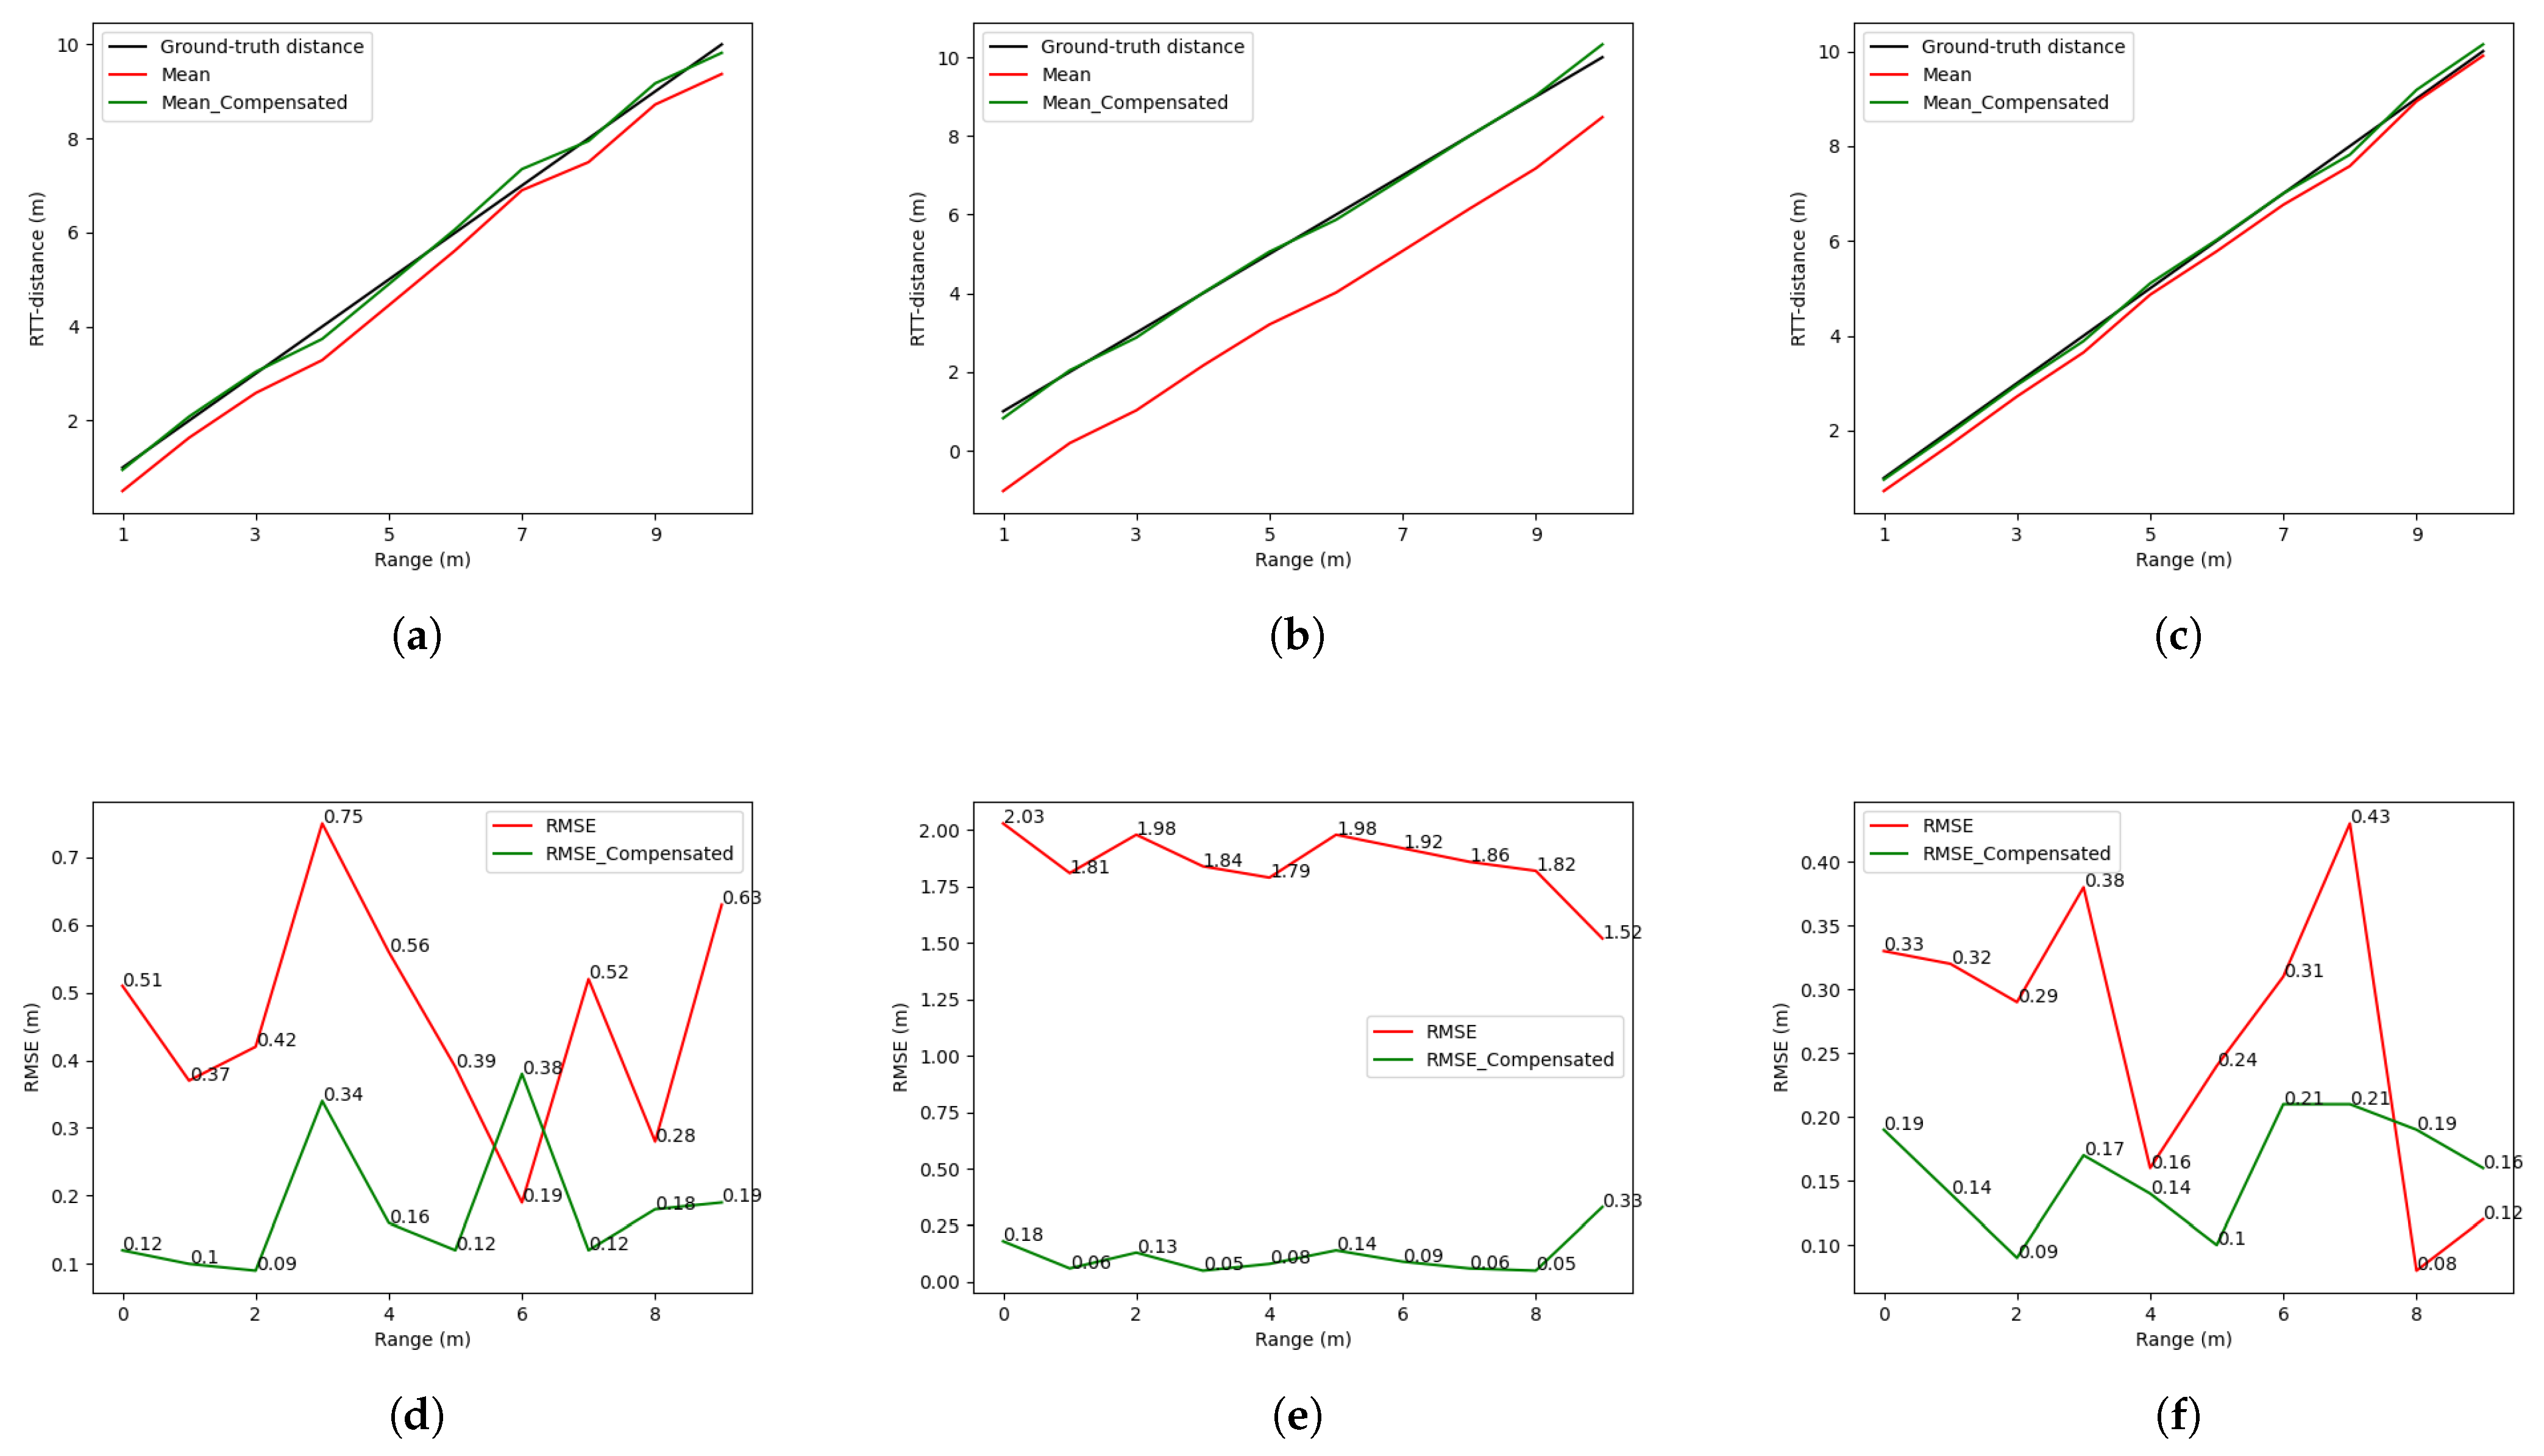
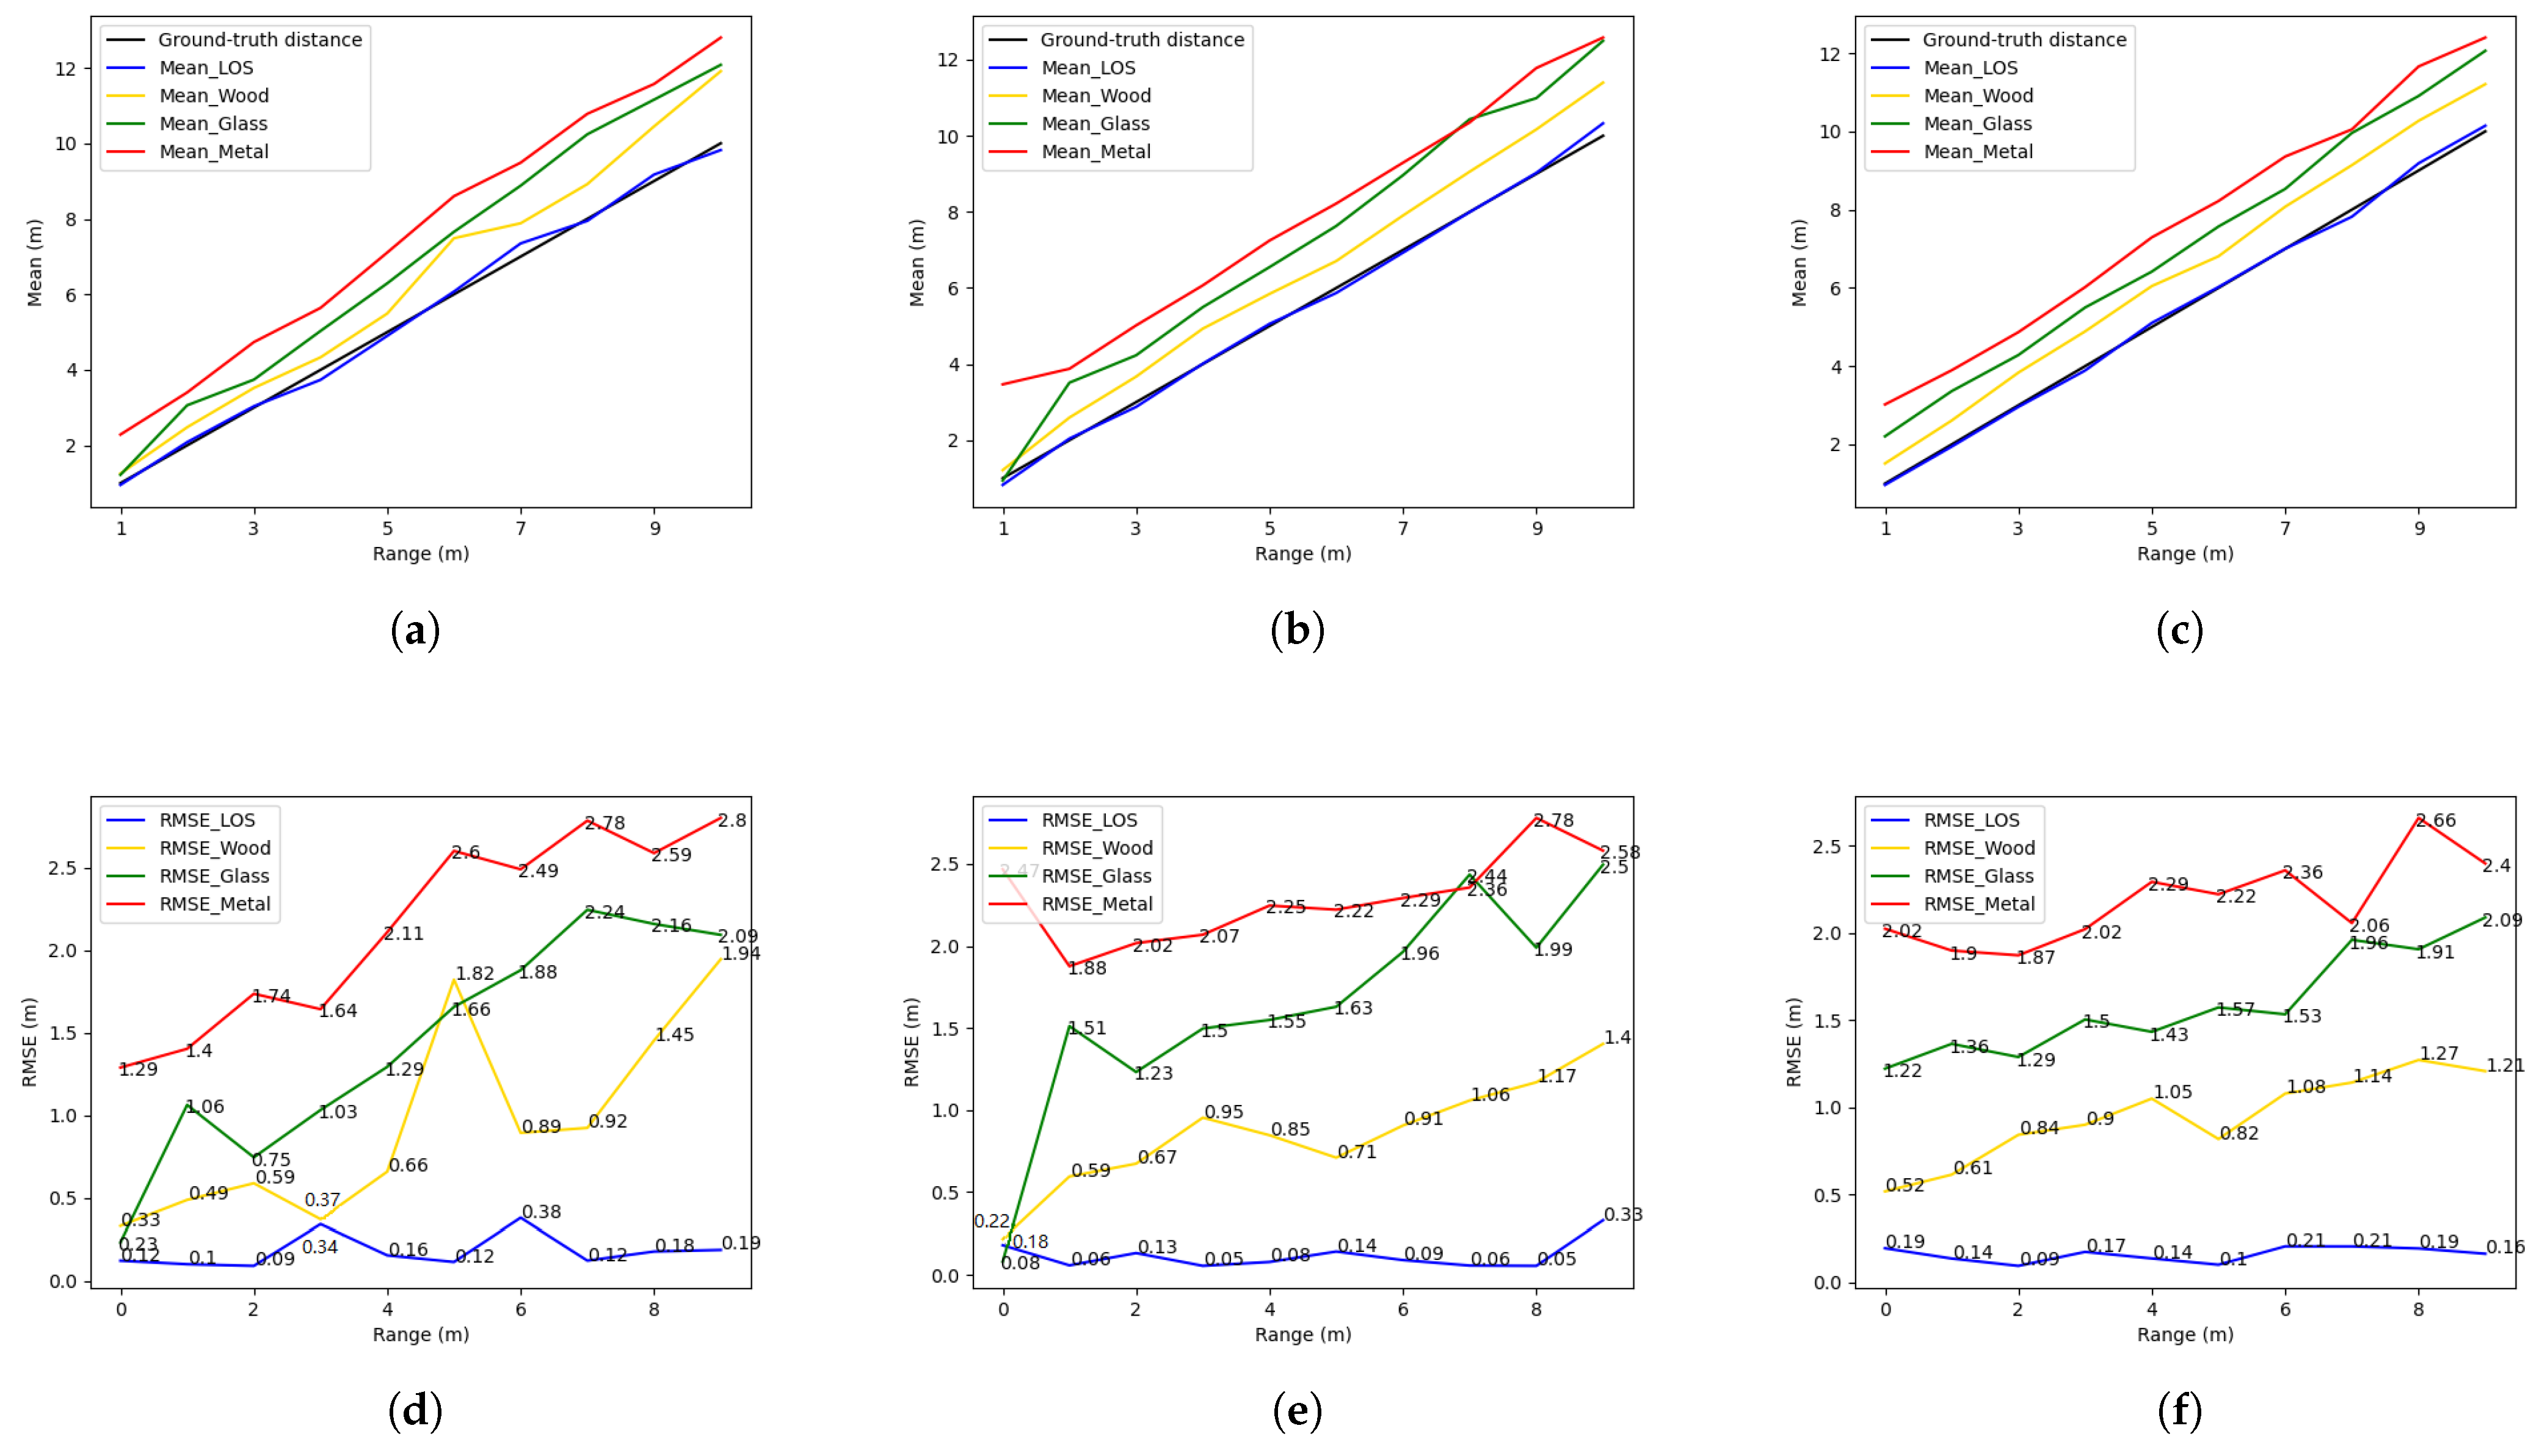
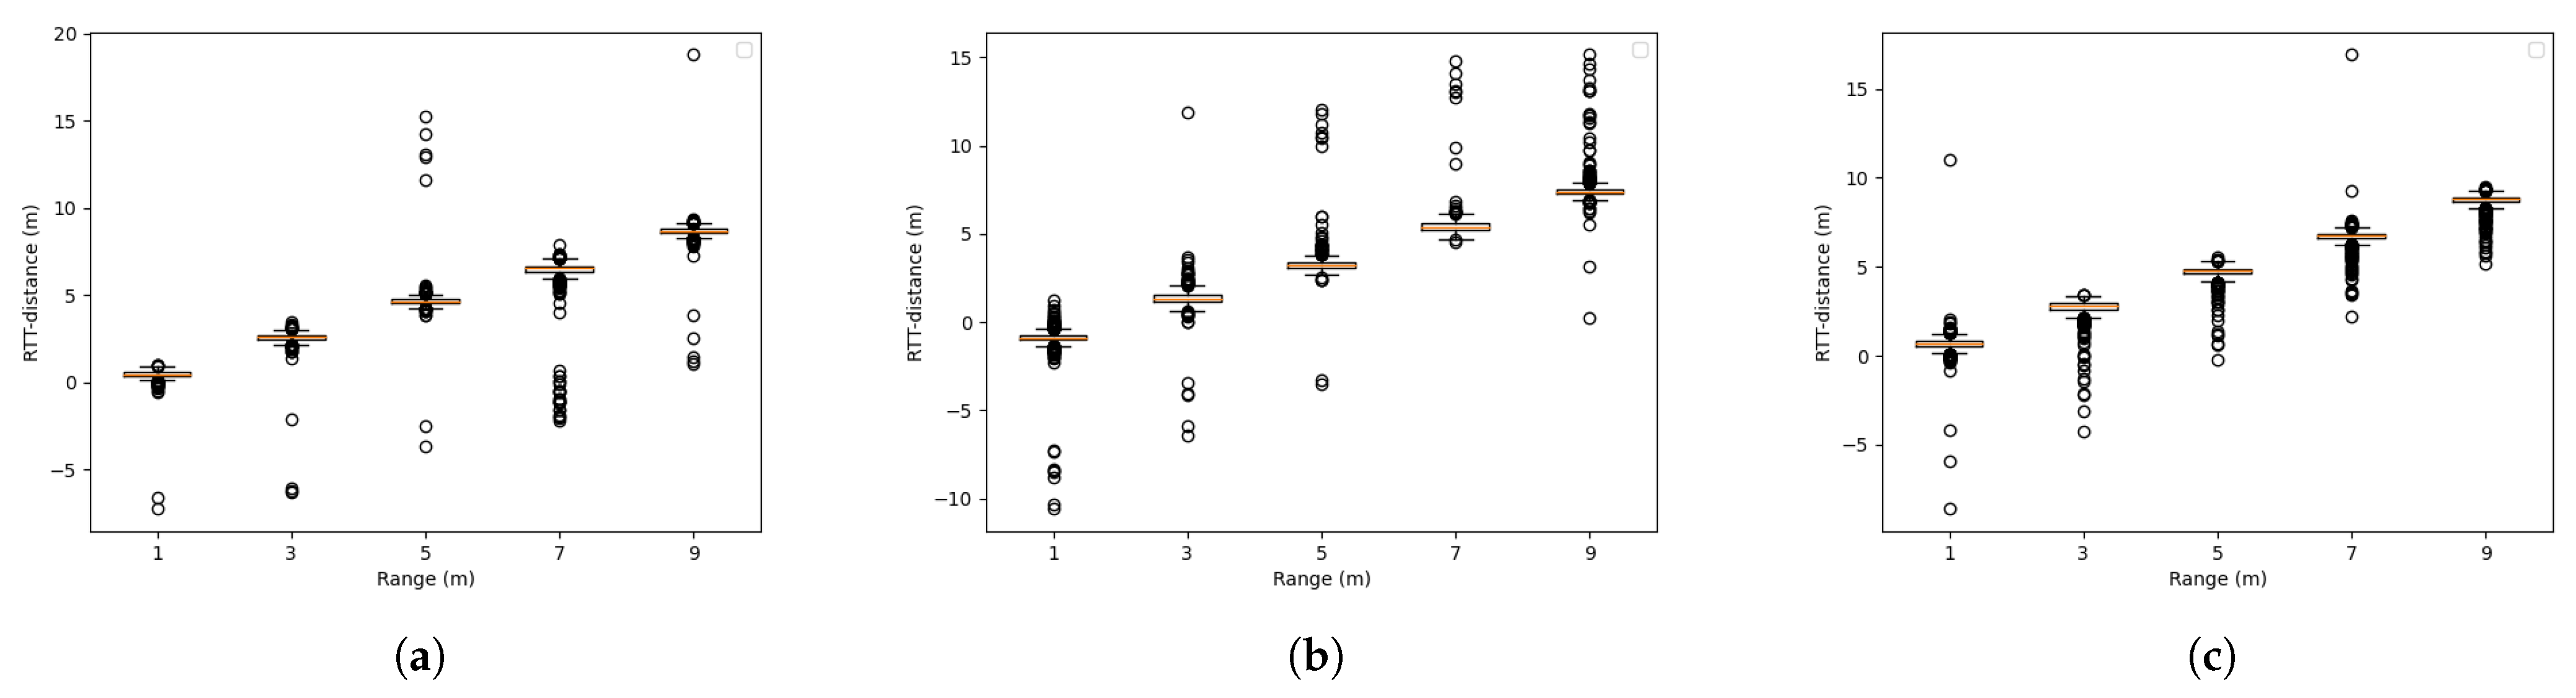
4.2. Range and Position-Fixed Environment

The samples collected in LOS in RFPF are shown in Figure 7. The Wi-Fi RTT distance usually has a negative bias to the ground truth distance. The mean of each set of Wi-Fi RTT distance at different ground truth distances was then calculated. It can be seen from Figure 8a–c that the slopes of the Wi-Fi RTT distance measured by all three smartphones are almost one. This means that the Wi-Fi RTT distance changes linearly with the ground truth distance. Hence, a positive offset was applied to each curve to compensate for such a negative bias. The offsets for Google Pixel 2, Xiaomi Redmi K20, and LG V50S were 0.45 m, 1.85 m, and 0.24 m, respectively. The RMSE between the Wi-Fi RTT distance and the ground truth distance at each distance was calculated. As it can be seen from Figure 8d–f, the RMSE of the compensated Wi-Fi RTT distance is very close to 0 m regardless of the change of the ground truth. The offsets were applied to all the measurements in the following experiments to better visualize and analyze the errors caused by the motion and NLOS effects.
Next, we investigated the NLOS effects on Wi-Fi RTT distance. As illustrated in the experimental settings, we set different materials of blockers, including wood, glass, and metal. We can observe from Figure 9a–c that the Wi-Fi RTT distance still varies linearly in NLOS but has a different bias with different blockers. One fact that leads to the bias could be the diffraction effects at the edges of the finite blocker. Since the blocker was set to block the primary Fresnel zone, the signal can diffract around the blocker, which causes losses. The reflections from the blockers and the ground should also be considered.
Moreover, we can observe from Figure 9d–e that the RMSE remained stable in LOS condition, while the RMSE increased as the ground truth went further in the NLOS condition. Moreover, for all smartphones, the metal blocker impeded the transmission of the RTT signal the most among the three materials. The glass blocker showed moderate effects on Wi-Fi RTT distance, while the Wi-Fi RTT distance blocked by wood showed the lowest RMSE. This could be caused by the skin effects. The Wi-Fi RTT signals propagate as electromagnetic waves in the air at approximately the speed of light. The skin effects mean when Wi-Fi signals carried by electromagnetic waves pass through some blockers or media, some will stay on the surface of the blockers, and the rest can pass through and keep propagating to the destination. Materials with better conductivity would attenuate more Wi-Fi signals.

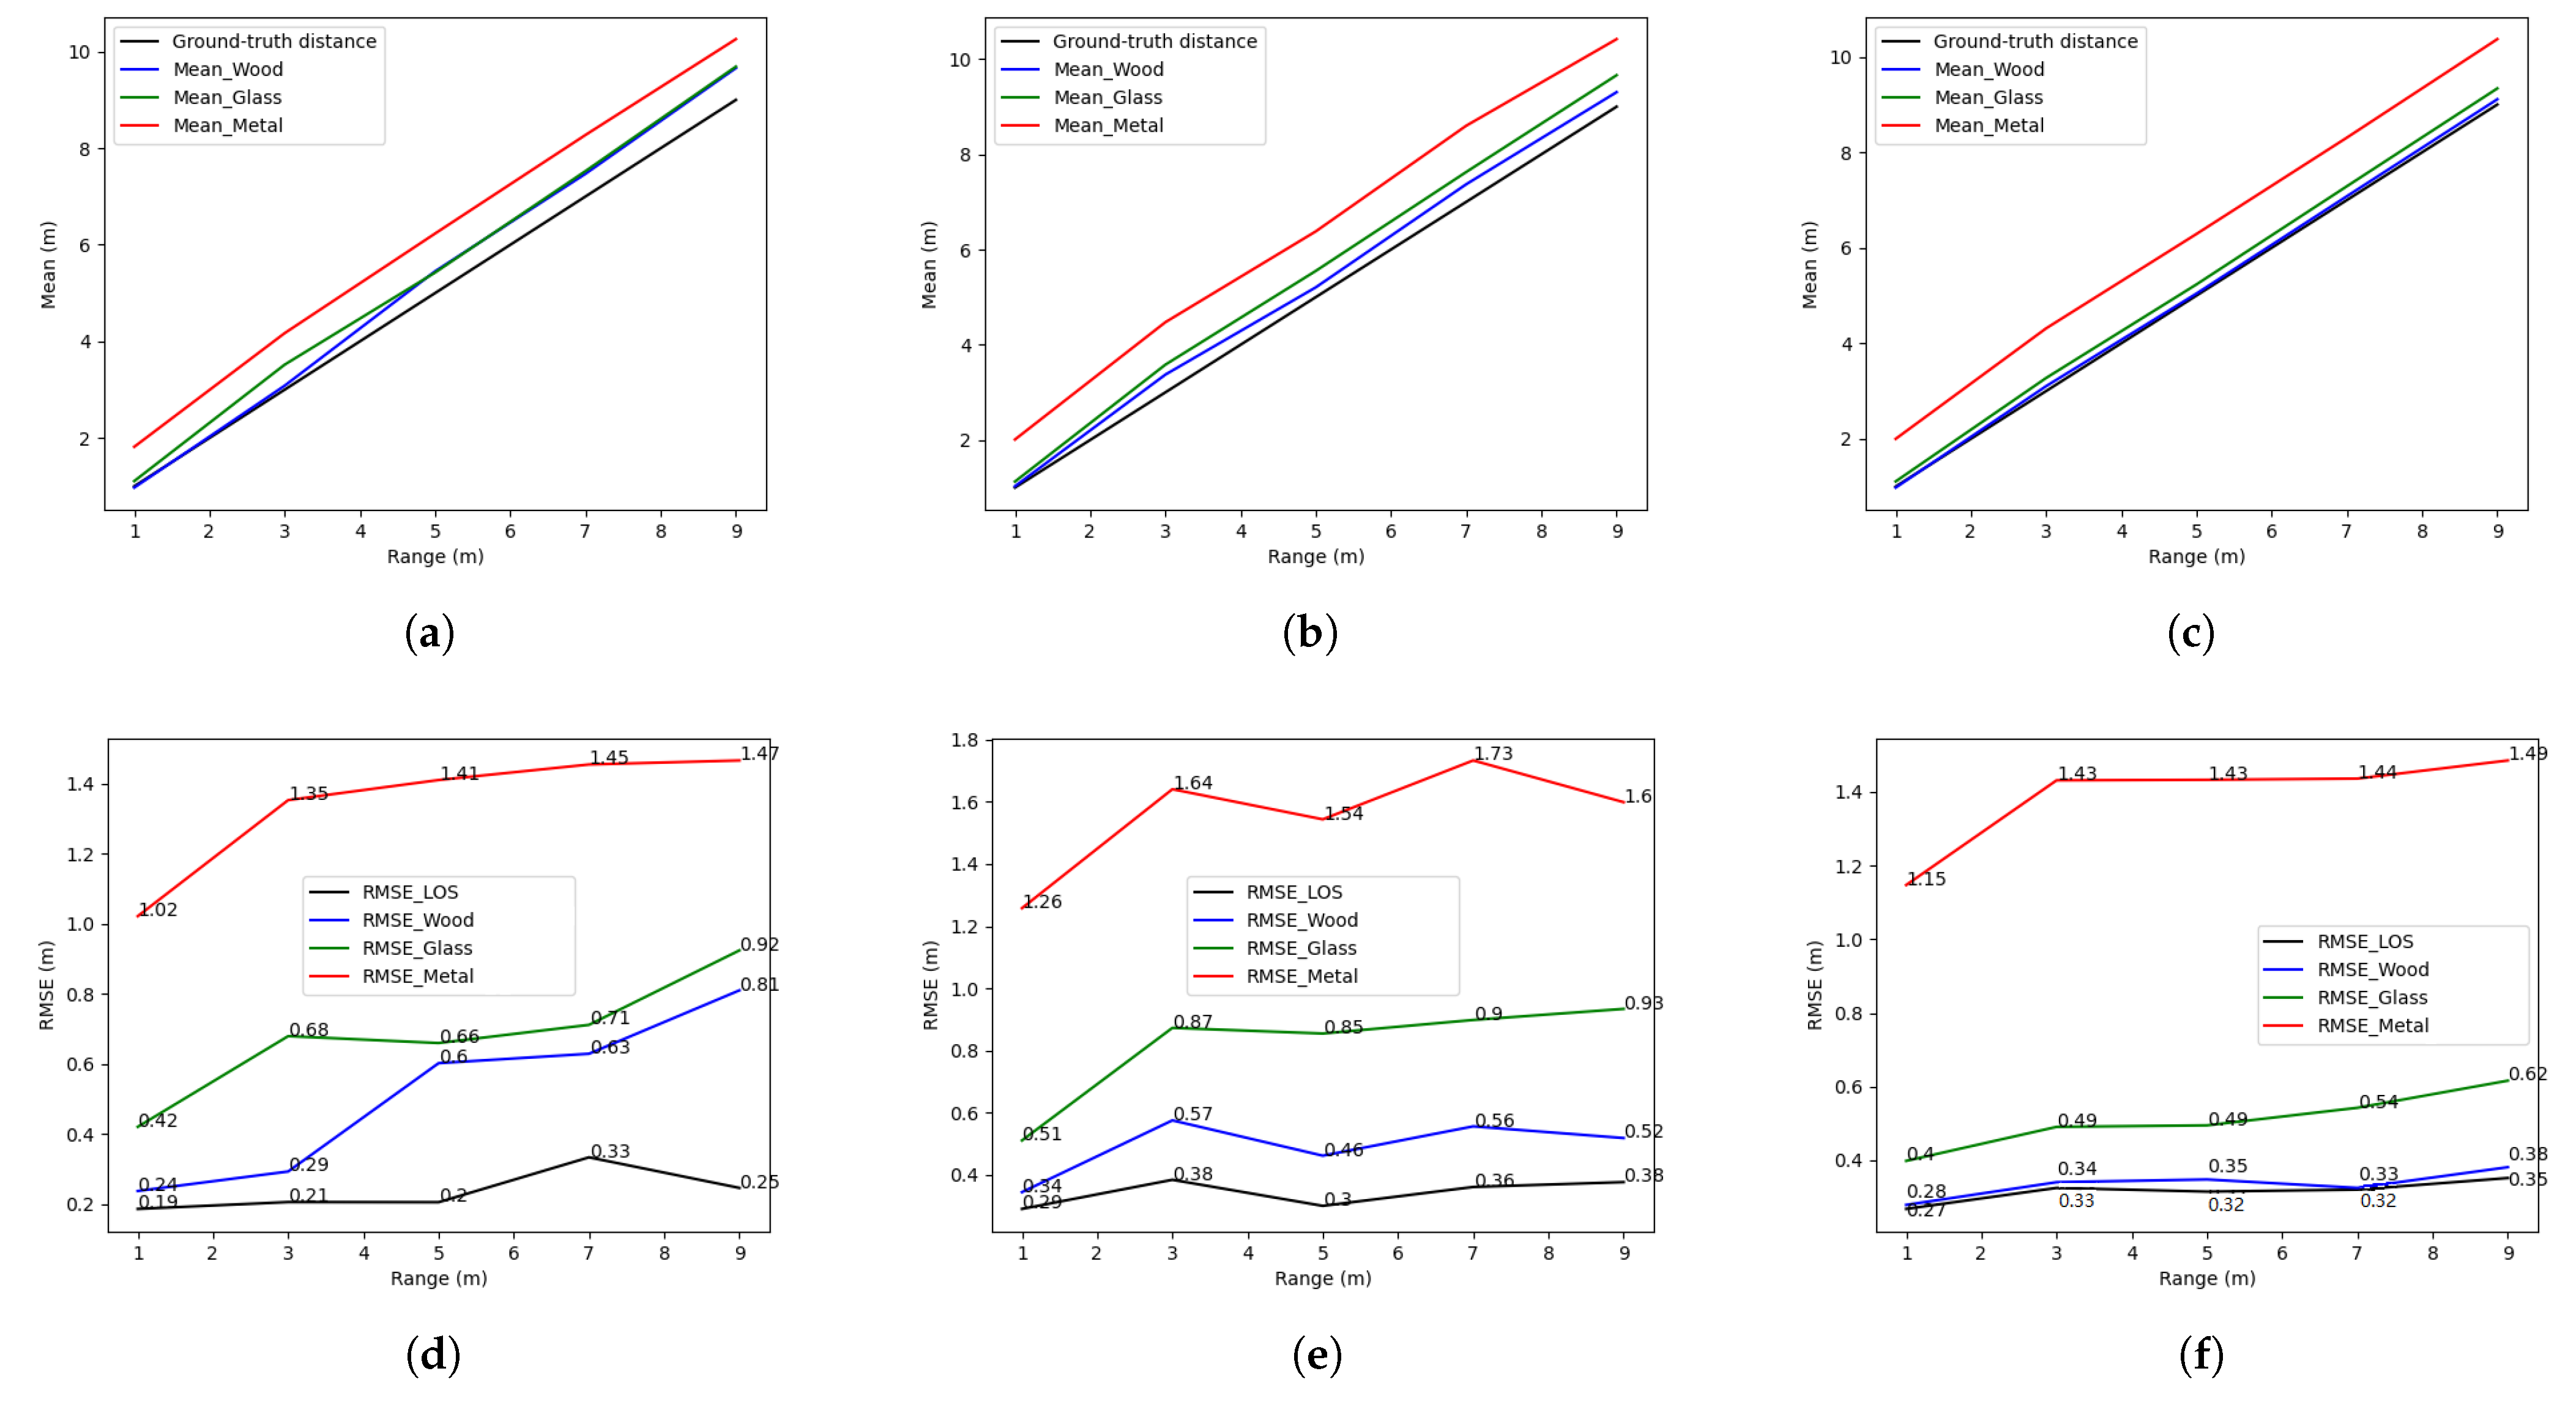
4.3. Range-Fixed and Position-Varied Environment

Figure 10 presents the raw Wi-Fi RTT distance measured in LOS condition in RFPV. It can be seen from the figure that there were severe fluctuations with many outliers in the measurements when the smartphone was moving and the ground truth was fixed. We can also infer that the noise here may not be Gaussian; hence, some compensation algorithms assuming Gaussian error may not apply (such as the Kalman filter). In addition, the outlier varies by phone. For example, as shown in the box plot, the outliers measured from LG V50S are closer to the box, while the outliers from the other two phones are further.
We then calculated the standard deviation of the measurements at each distance. As illustrated in Table 3, the standard deviations of the Wi-Fi RTT distance measured by all three smartphones from the motion are usually much higher than in static environments. It can be observed that the standard deviations of the Wi-Fi RTT distance measured by the same smartphone at different ground truth distances are similar when the phones are in the same status (either position-fixed or position-varied).
We then added different blockers to evaluate the Wi-Fi RTT distance measurements in the NLOS condition. Similarly, we applied the offsets to the Wi-Fi RTT distance to better visualize the errors and further analysis. As shown in Figure 11, the Wi-Fi RTT distance showed the most significant error when the signal was blocked by the metal blockers and the lowest error when wooden blockers blocked the signal. As illustrated in the previous analysis, this could be caused by the skin effects that metal has better conductivity than the other two materials. We can also observe that the RMSE increased gradually as the ground truth between the AP and the smartphone went further in NLOS conditions.

4.4. Range and Position-Varied Environment

The volunteer was asked to hold the smartphone and walk away from the AP in this experiment so that both the position and the distance between the smartphone and the AP were varied. In this condition, the ground truth distance was not available as it varied according to the time even though we controlled the walking speed of the volunteer as uniformly (stable) as possible. Hence, Wi-Fi RTT distance was compared to the reference distance. Similar to previous experiments, the offsets were applied to the Wi-Fi RTT distance. The RMSE between the Wi-Fi RTT distance and the reference distance were calculated and listed in Table 4. It can be seen that the RMSE is similar when the signal is in LOS condition or blocked by wooden and glass blockers. However, a huge error occurs when the blocker is metal. As visualized in Figure 12, compared to the reference distance, the Wi-Fi RTT distance shows some acceptable variations when the smartphone is moving away from the AP in LOS condition. There are also some expected outliers shown in NLOS condition with wooden and glass blockers. Nevertheless, it can be seen that there is a significant number of outliers in the NLOS condition with metal blockers. As the standard deviations are listed in Table 5, the outliers show a severe impact on the stability of the Wi-Fi RTT distance measured by all three smartphones when the metal blocker blocks the signal. Unlike the fluctuations caused by the motion of smartphones, such variations are mainly caused by the outliers, which are far from the ground truth. Although such outliers are usually the minority in the measured Wi-Fi RTT distance in one journey of each smartphone, their impact on average error is huge.
It can be concluded that when the smartphone is in this environment, the dominant error becomes the outliers rather than the fluctuations. It can also be inferred that the NLOS effects could be exacerbated by the motion effects, which lead to high Wi-Fi RTT distance dispersion. In addition, according to the skin effects in the NLOS condition, the higher the conductivity of the blocker, the more outliers would appear in Wi-Fi RTT distance. Moreover, it can be seen from the results that LG V50S provides the lowest error in most of the cases. We infer that the phone embedded with a better CPU performance could provide more stable and accurate measurements in such a critical environment.

4.5. Summary

To sum up, the errors caused by the hardware, motion effects, and NLOS effects have been investigated. In different conditions, the errors show distinct effects on the Wi-Fi RTT distance from several aspects, including fixed biases, fluctuations, outliers, and their mixture. As summarized in Table 6, the bias always exists in all conditions and varies according to different hardware/manufacturers. Additional bias occurs when the smartphone is in NLOS condition. Particularly, the bias would be larger when the blocker has better conductivity. Moreover, the Wi-Fi RTT distance shows higher fluctuations when the smartphone is moving rather than in static mode. The motion effects usually lead to moderate fluctuations regardless of the ground truth distance in LOS conditions. However, the motion effects exacerbate the NLOS impact on the Wi-Fi RTT distance, resulting in severe outliers. All the errors except the hardware-dependent bias increase when the blocker has better conductivity in all circumstances. In addition, we infer that the phone with a better CPU could provide better RTT performance against the fluctuations and outliers when the phone is moving in an NLOS environment.

5. Conclusions and Future Works

This study has fully explored, analyzed, and categorized the errors in Wi-Fi RTT distance with commercial consumer RTT-enabled smartphones and APs for mobile localization algorithms. The paper first summarized and compared the supporting hardware and software for development and research in recent years. Then, multiple experiments were conducted to investigate the errors in Wi-Fi RTT distance measurements with smartphones. Various experimental settings were made to evaluate the impact of hardware, motion status, and NLOS/LOS conditions on the errors in Wi-Fi RTT distance measurements. Through the comprehensive analysis of the experimental results in different sites, this paper summarized four errors in Wi-Fi RTT distance. The errors include hardware-dependent bias, blocker-dependent bias, fluctuations, and outliers. The hardware-dependent bias varies according to different hardware/manufacturers of the smartphones; the blocker-dependent bias is caused by NLOS effects; high fluctuations usually exist when the smartphone is moving, while the mixture of NLOS and motion effects results in severe outliers. In addition, experiments with different materials of blockers showed that all nonhardware-dependent errors increase when the blocker has better conductivity.
Our future work will mitigate such errors to provide better distance estimation and positioning accuracy in complex indoor environments.

Author Contributions

Conceptualization, Y.D.; Methodology, Y.D.; Validation, D.S.; Formal analysis, Y.D.; Investigation, D.S.; Resources, Y.D.; Data curation, Y.D. and D.S.; Writing—original draft, Y.D. and D.S.; Writing—review & editing, T.A. and Y.Y.; Visualization, D.S.; Supervision, T.A. All authors have read and agreed to the published version of the manuscript.

Funding

This research received no external funding.

Data Availability Statement

Data available on request from the authors.

Conflicts of Interest

The authors declare no conflict of interest.

References

  1. Cheikhrouhou, O.; MBhatti, G.; Alroobaea, R. A hybrid DV-hop algorithm using RSSI for localization in large-scale wireless sensor networks. Sensors 2018, 18, 1469. [Google Scholar] [CrossRef] [PubMed] [Green Version]
  2. Wang, J.; Park, J. An Enhanced Indoor Positioning Algorithm Based on Fingerprint Using Fine-Grained CSI and RSSI Measurements of IEEE 802.11n WLAN. Sensors 2021, 21, 2769. [Google Scholar] [CrossRef] [PubMed]
  3. Hu, Y.; Peng, A.; Tang, B.; Ou, G.; Lu, X. The Time-of-Arrival Offset Estimation in Neural Network Atomic Denoising in Wireless Location. Sensors 2022, 22, 5364. [Google Scholar] [CrossRef] [PubMed]
  4. Monfared, S.; Copa, E.I.P.; Doncker, P.D.; Horlin, F. AoA-Based Iterative Positioning of IoT Sensors With Anchor Selection in NLOS Environments. IEEE Trans. Veh. Technol. 2021, 70, 6211–6216. [Google Scholar]
  5. IEEE 802.11 Working Group. IEEE Std 802.11-2016 (Revision of IEEE Std 802.11-2012); IEEE Standard for Information Technology-Telecommunications and Information Exchange between Systems Local and Metropolitan Area Networks–Specific Requirements—Part 11: Wireless LAN Medium Access Control (MAC) and Physical Layer (PHY) Specifications. IEEE: Piscataway, NJ, USA, 2016; pp. 1–3534.
  6. Huang, L.; Yu, B.; Li, H.; Zhang, H.; Li, S.; Zhu, R.; Li, Y. HPIPS: A High-Precision Indoor Pedestrian Positioning System Fusing WiFi-RTT, MEMS, and Map Information. Sensors 2020, 20, 6795. [Google Scholar] [CrossRef] [PubMed]
  7. Seong, J.-H.; Lee, S.-H.; Kim, W.-Y.; Seo, D.-H. High-Precision RTT-Based Indoor Positioning System Using RCDN and RPN. Sensors 2021, 21, 3701. [Google Scholar] [CrossRef] [PubMed]
  8. Horn, B.K.P. Indoor Localization Using Uncooperative Wi-Fi Access Points. Sensors 2022, 22, 3091. [Google Scholar] [CrossRef] [PubMed]
  9. Bullmann, M.; Fetzer, T.; Ebner, F.; Ebner, M.; Deinzer, F.; Grzegorzek, M. Comparison of 2.4 GHz WiFi FTM- and RSSI-Based Indoor Positioning Methods in Realistic Scenarios. Sensors 2020, 20, 4515. [Google Scholar] [CrossRef] [PubMed]
  10. Horn, B.K.P. Observation Model for Indoor Positioning. Sensors 2020, 20, 4027. [Google Scholar] [CrossRef] [PubMed]
  11. Yan, S.; Luo, H.; Zhao, F.; Crivello, A. Wi-Fi RTT based indoor positioning with dynamic weighted multidimensional scaling. In Proceedings of the 2019 International Conference on Indoor Positioning and Indoor Navigation (IPIN), Pisa, Italy, 30 September–3 October 2019. [Google Scholar]
  12. Cao, H.; Wang, Y.; Bi, J.; Xu, S.; Si, M.; Qi, H. Indoor Positioning Method Using WiFi RTT Based on LOS Identification and Range Calibration. ISPRS Int. J. Geo-Inf. 2020, 9, 627. [Google Scholar] [CrossRef]
  13. So, M.; Wang, Y.; Xu, S.; Cao, H. A Wi-Fi FTM-Based Indoor Positioning Method with LOS/NLOS Identification. Appl. Sci. 2020, 10, 956. [Google Scholar]
  14. Garcia-Fernandez, M.; Hoyas-Ester, I.; Lopez-Cruces, A.; Siutkowska, M.; Banqué-Casanovas, X. Accuracy in WiFi Access Point Position Estimation Using Round Trip Time. Sensors 2021, 21, 3828. [Google Scholar] [CrossRef] [PubMed]
  15. Álvarez-Merino, C.S.; Luo-Chen, H.Q.; Khatib, E.J.; Barco, R. WiFi FTM, UWB and Cellular-Based Radio Fusion for Indoor Positioning. Sensors 2021, 21, 7020. [Google Scholar] [CrossRef] [PubMed]
  16. Martin-Escalona, I.; Zola, E. Passive Round-Trip-Time Positioning in Dense IEEE 802.11 Networks. Electronics 2020, 9, 1193. [Google Scholar] [CrossRef]
  17. Google. Wi-Fi Location: Ranging with RTT. 2022. Available online: https://developer.android.com/guide/topics/connectivity/wifi-rtt (accessed on 18 February 2022).
  18. Horn, B.K.P. Doubling the Accuracy of Indoor Positioning: Frequency Diversity. Sensors 2020, 5, 1489. [Google Scholar] [CrossRef] [PubMed] [Green Version]
  19. Yu, Y.; Chen, R.; Liu, Z.; Guo, G.; Chen, L. Wi-Fi fine time measurement: Data analysis and processing for indoor localisation. J. Navig. 2020, 73, 1–23. [Google Scholar] [CrossRef]
  20. Dong, Y.; Arslan, T.; Yang, Y. Real-time NLOS/LOS Identification for Smartphone-based Indoor Positioning Systems using WiFi RTT and RSS. IEEE Sens. J. 2021, 22, 5199–5209. [Google Scholar] [CrossRef]
  21. Google. Wi-Fi Aware Overview. 2022. Available online: https://developer.android.com/guide/topics/connectivity/wifi-aware (accessed on 18 February 2022).
  22. Compulab. WiFi Indoor Location Device. 2022. Available online: https://fit-iot.com/web/products/wild/ (accessed on 18 February 2022).
  23. Google Play. WifiRttScan App. 2022. Available online: https://play.google.com/store/apps/details?id=com.google.android.apps.location.rtt.wifirttscan (accessed on 18 February 2022).
  24. Google. Android WifiRttScan Sample. Available online: https://github.com/googlearchive/android-WifiRttScan (accessed on 18 February 2022).
  25. Martin-Escalona, I.; Zola, E. Ranging Estimation Error in WiFi Devices Running IEEE 802.11mc. In Proceedings of the GLOBECOM 2020–2020 IEEE Global Communications Conference, Taipei, Taiwan, 7–11 December 2020; pp. 1–7. [Google Scholar]
  26. Compulab. WILD Minimal. Available online: https://github.com/Compulab-WILD/WILD-minimal (accessed on 18 February 2022).
  27. Google. WifiRttLocator. Available online: https://play.google.com/store/apps/details?id=com.google.android.apps.location.rtt.wifirttlocator (accessed on 18 February 2022).
  28. Google Play FTMRTT App. 2022. Available online: https://play.google.com/store/apps/details?id=com.welwitschia.ftmrtt (accessed on 15 November 2022).
  29. FTMRTT. 2022. Available online: https://people.csail.mit.edu/bkph/FTMRTT_app (accessed on 15 November 2022).
Figure 2. Specification of the frame and the blocker (metal in this figure).
Algorithms 15 00464 g002
Figure 3. Blockers’ settings in all environments: (a) range and position-fixed environment; (b) range-fixed and position-varied environment; (c) range-varied and position-varied environment.
Algorithms 15 00464 g003
Figure 4. Schematic of the RFPF environment: (a) LOS condition; (b) NLOS condition.
Algorithms 15 00464 g004
Figure 5. Schematic of the RFPV environment: (a) LOS condition; (b) NLOS condition.
Algorithms 15 00464 g005
Figure 6. Schematic of the RVPV environment: (a) LOS condition; (b) NLOS condition.
Algorithms 15 00464 g006
Figure 7. Raw Wi-Fi RTT distance measured by the three smartphones in RFPF and LOS condition: (a) Google Pixel 2; (b) Xiaomi Redmi K20; (c) LG V50S.
Algorithms 15 00464 g007
Figure 8. Wi-Fi RTT distance and error in RFPF and LOS condition: (a) Wi-Fi RTT distance from Google Pixel 2; (b) Wi-Fi RTT distance from Xiaomi Redmi K20; (c) Wi-Fi RTT distance from LG V50S; (d) RMSE of Wi-Fi RTT distance from Google Pixel 2; (e) RMSE of Wi-Fi RTT distance from Xiaomi Redmi K20; (f) RMSE of Wi-Fi RTT distance from LG V50S.
Algorithms 15 00464 g008
Figure 9. Wi-Fi RTT distance and error in RFPF and NLOS condition: (a) Wi-Fi RTT distance from Google Pixel 2; (b) Wi-Fi RTT distance from Xiaomi Redmi K20; (c) Wi-Fi RTT distance from LG V50S; (d) RMSE of Wi-Fi RTT distance from Google Pixel 2; (e) RMSE of Wi-Fi RTT distance from Xiaomi Redmi K20; (f) RMSE of Wi-Fi RTT distance from LG V50S.
Algorithms 15 00464 g009
Figure 10. Raw Wi-Fi RTT distance measured by the three smartphones in RFPV and LOS condition: (a) Google Pixel 2; (b) Xiaomi Redmi K20; (c) LG V50S.
Algorithms 15 00464 g010
Figure 11. Wi-Fi RTT distance and error in RFPV and NLOS condition: (a) Wi-Fi RTT distance from Google Pixel 2; (b) Wi-Fi RTT distance from Xiaomi Redmi K20; (c) Wi-Fi RTT distance from LG V50S; (d) RMSE of Wi-Fi RTT distance from Google Pixel 2; (e) RMSE of Wi-Fi RTT distance from Xiaomi Redmi K20; (f) RMSE of Wi-Fi RTT distance from LG V50S.
Algorithms 15 00464 g011
Figure 12. Wi-Fi RTT distance in RVPV: (a) Wi-Fi RTT distance from Google Pixel 2; (b) Wi-Fi RTT distance from Xiaomi Redmi K20; (c) Wi-Fi RTT distance from LG V50S.
Algorithms 15 00464 g012
Table 1. Specifications of the selected smartphones.
Model* ChipsetOS
Google Pixel 2Snapdragon 835Android 10 (upgradable to Android 11)
Xiaomi Redmi K20Snapdragon 730Android 10
LG V50Snapdragon 855Android 10 (upgradable to Android 12)
* Performance: Snapdragon 855 > Snapdragon 835 > Snapdragon 730.
Table 2. Preliminary experimental results of the average RSSI (dBm).
LOSWood BlockerGlass BlockerMetal Blocker
Google Pixel 2−74.3364−80.2417−79.5688−84.3012
Xiaomi Redmi K20−68.2389−72.9978−71.9982−79.3582
LG V50−73.0837−82.3104−77.9049−83.4068
Table 3. Comparison of standard deviation of raw Wi-Fi RTT distance in RFPF and RFPV at different range.
1 m3 m5 m7 m9 m
GP2 static0.115 m0.086 m0.121 m0.155 m0.056 m
GP2 dynamic 0.367 m 0.520 m 0.708 m 1.135 m 0.585 m
XM static0.038 m0.038 m0.052 m0.051 m0.047 m
XM dynamic 0.672 m 0.573 m 0.669 m 0.620 m 0.679 m
LG static0.191 m0.084 m0.087 m0.205 m0.059 m
LG dynamic 0.514 m 0.509 m 0.411 m 0.477 m 0.375 m
The bold number denotes better performance.
Table 4. Comparison of the RMSE in RVPV environment.
LOSNLOS (Metal)NLOS (Glass)NLOS (Wood)
GP20.822 m 2.487 m0.899 m0.668 m
XM0.717 m 2.936 m0.593 m0.543 m
LG0.318 m 2.264 m0.499 m1.247 m
The bold number denotes better performance.
Table 5. Comparison of the standard deviation of the Wi-Fi RTT distance in RVPV environment.
LOSNLOS (Metal)NLOS (Glass)NLOS (Wood)
GP22.724 m 3.303 m2.778 m2.549 m
XM2.852 m 3.327 m2.821 m2.703 m
LG2.541 m 3.062 m2.831 m2.937 m
The bold number denotes better performance.
Table 6. Summary of different errors and their impacts on Wi-Fi RTT distance.
Hardware-Dependent Bias Blocker-Dependent BiasFluctuationsOutliers
Range-fixed, position-fixed, LOS--
Range-fixed, position-varied, LOS-✓✓
Range-varied, position-varied, LOS-✓✓
Range-fixed, position-fixed, NLOS *
Range-fixed, dynamic, NLOS *✓✓✓✓
Range-varied, position-varied, NLOS *✓✓✓✓✓
This bias varies depending on different manufacturers (hardware). * In the NLOS case, the bias, fluctuations, and outliers may be related to the skin effect (conductivity) of the blockers. In this study, we infer that higher conductivity usually results in a higher error in Wi-Fi RTT distance. The number of ✓ denotes the error level (the more the higher).
Publisher’s Note: MDPI stays neutral with regard to jurisdictional claims in published maps and institutional affiliations.

