
Cell Fault Identification and Localization Procedure for Lithium-Ion Battery System of Electric Vehicles Based on Real Measurement Data


Abstract
1. Introduction
2. Materials and Methods
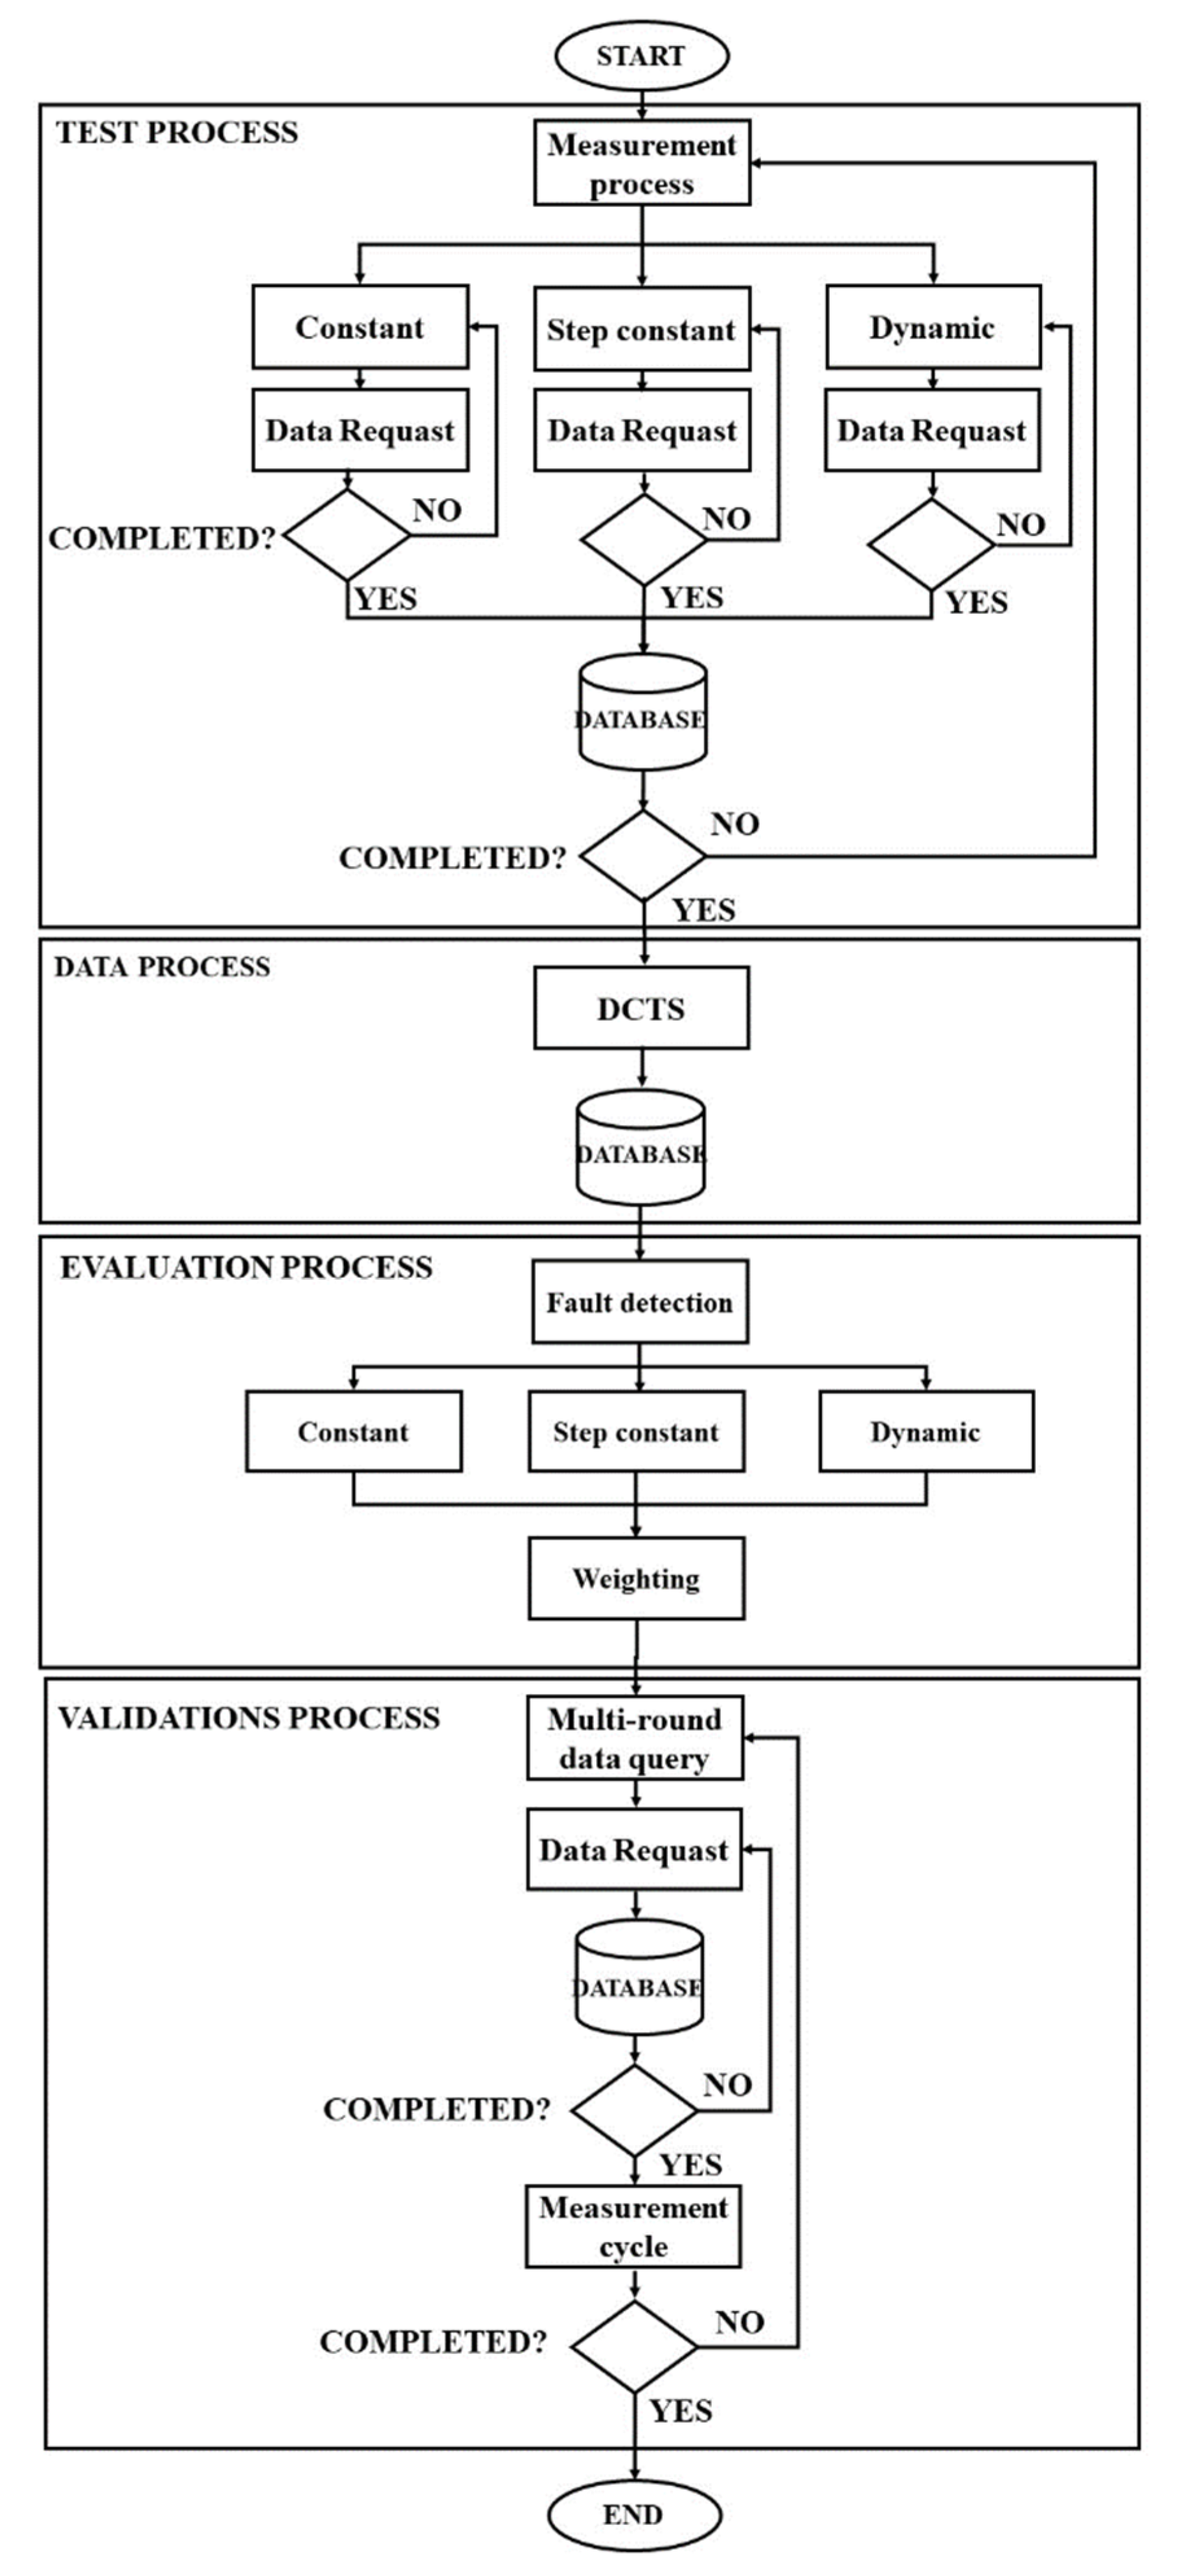
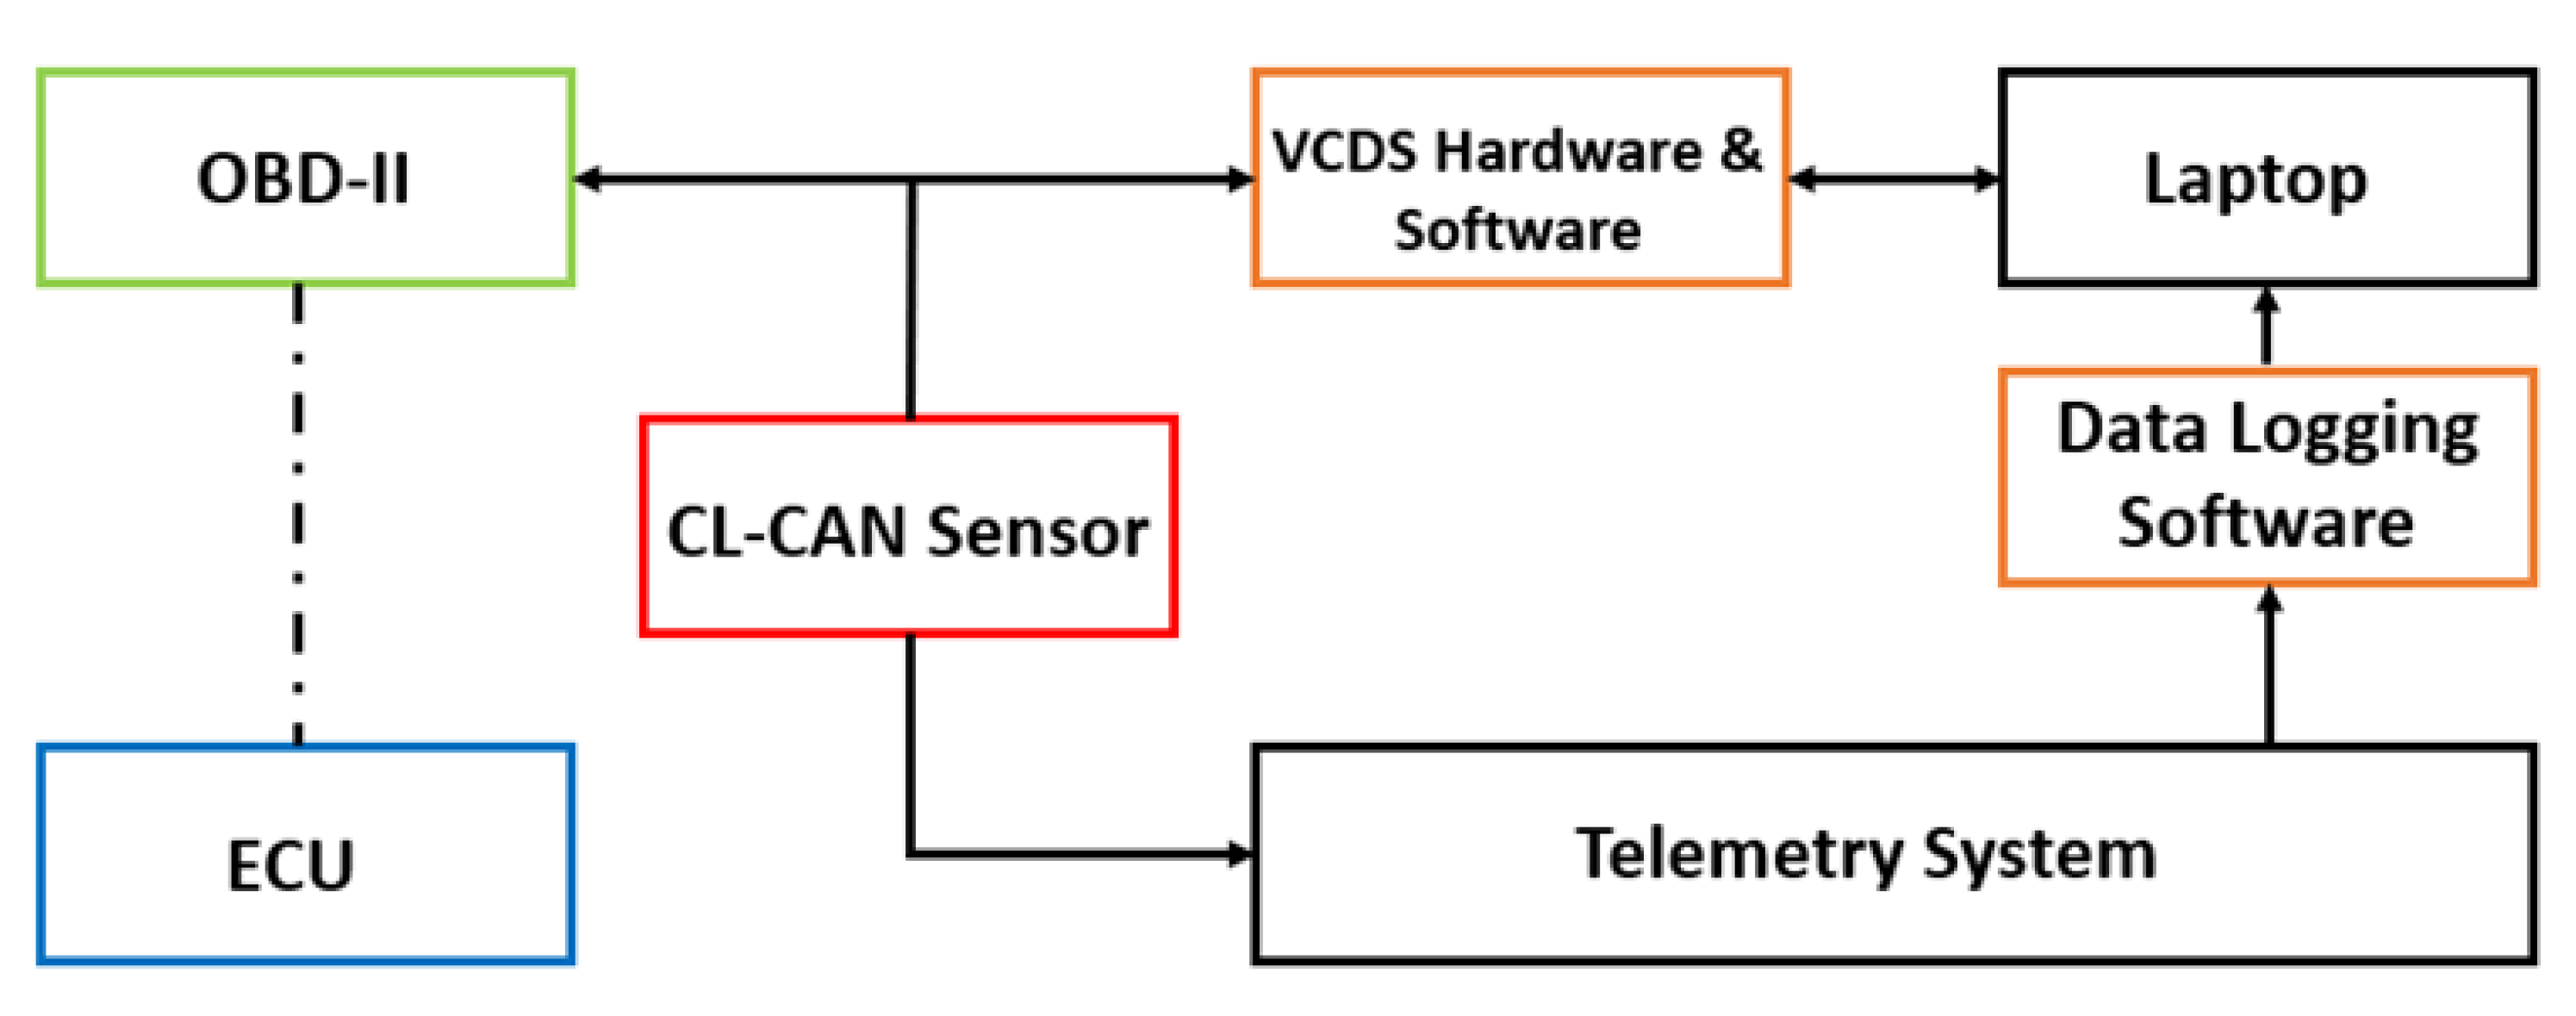
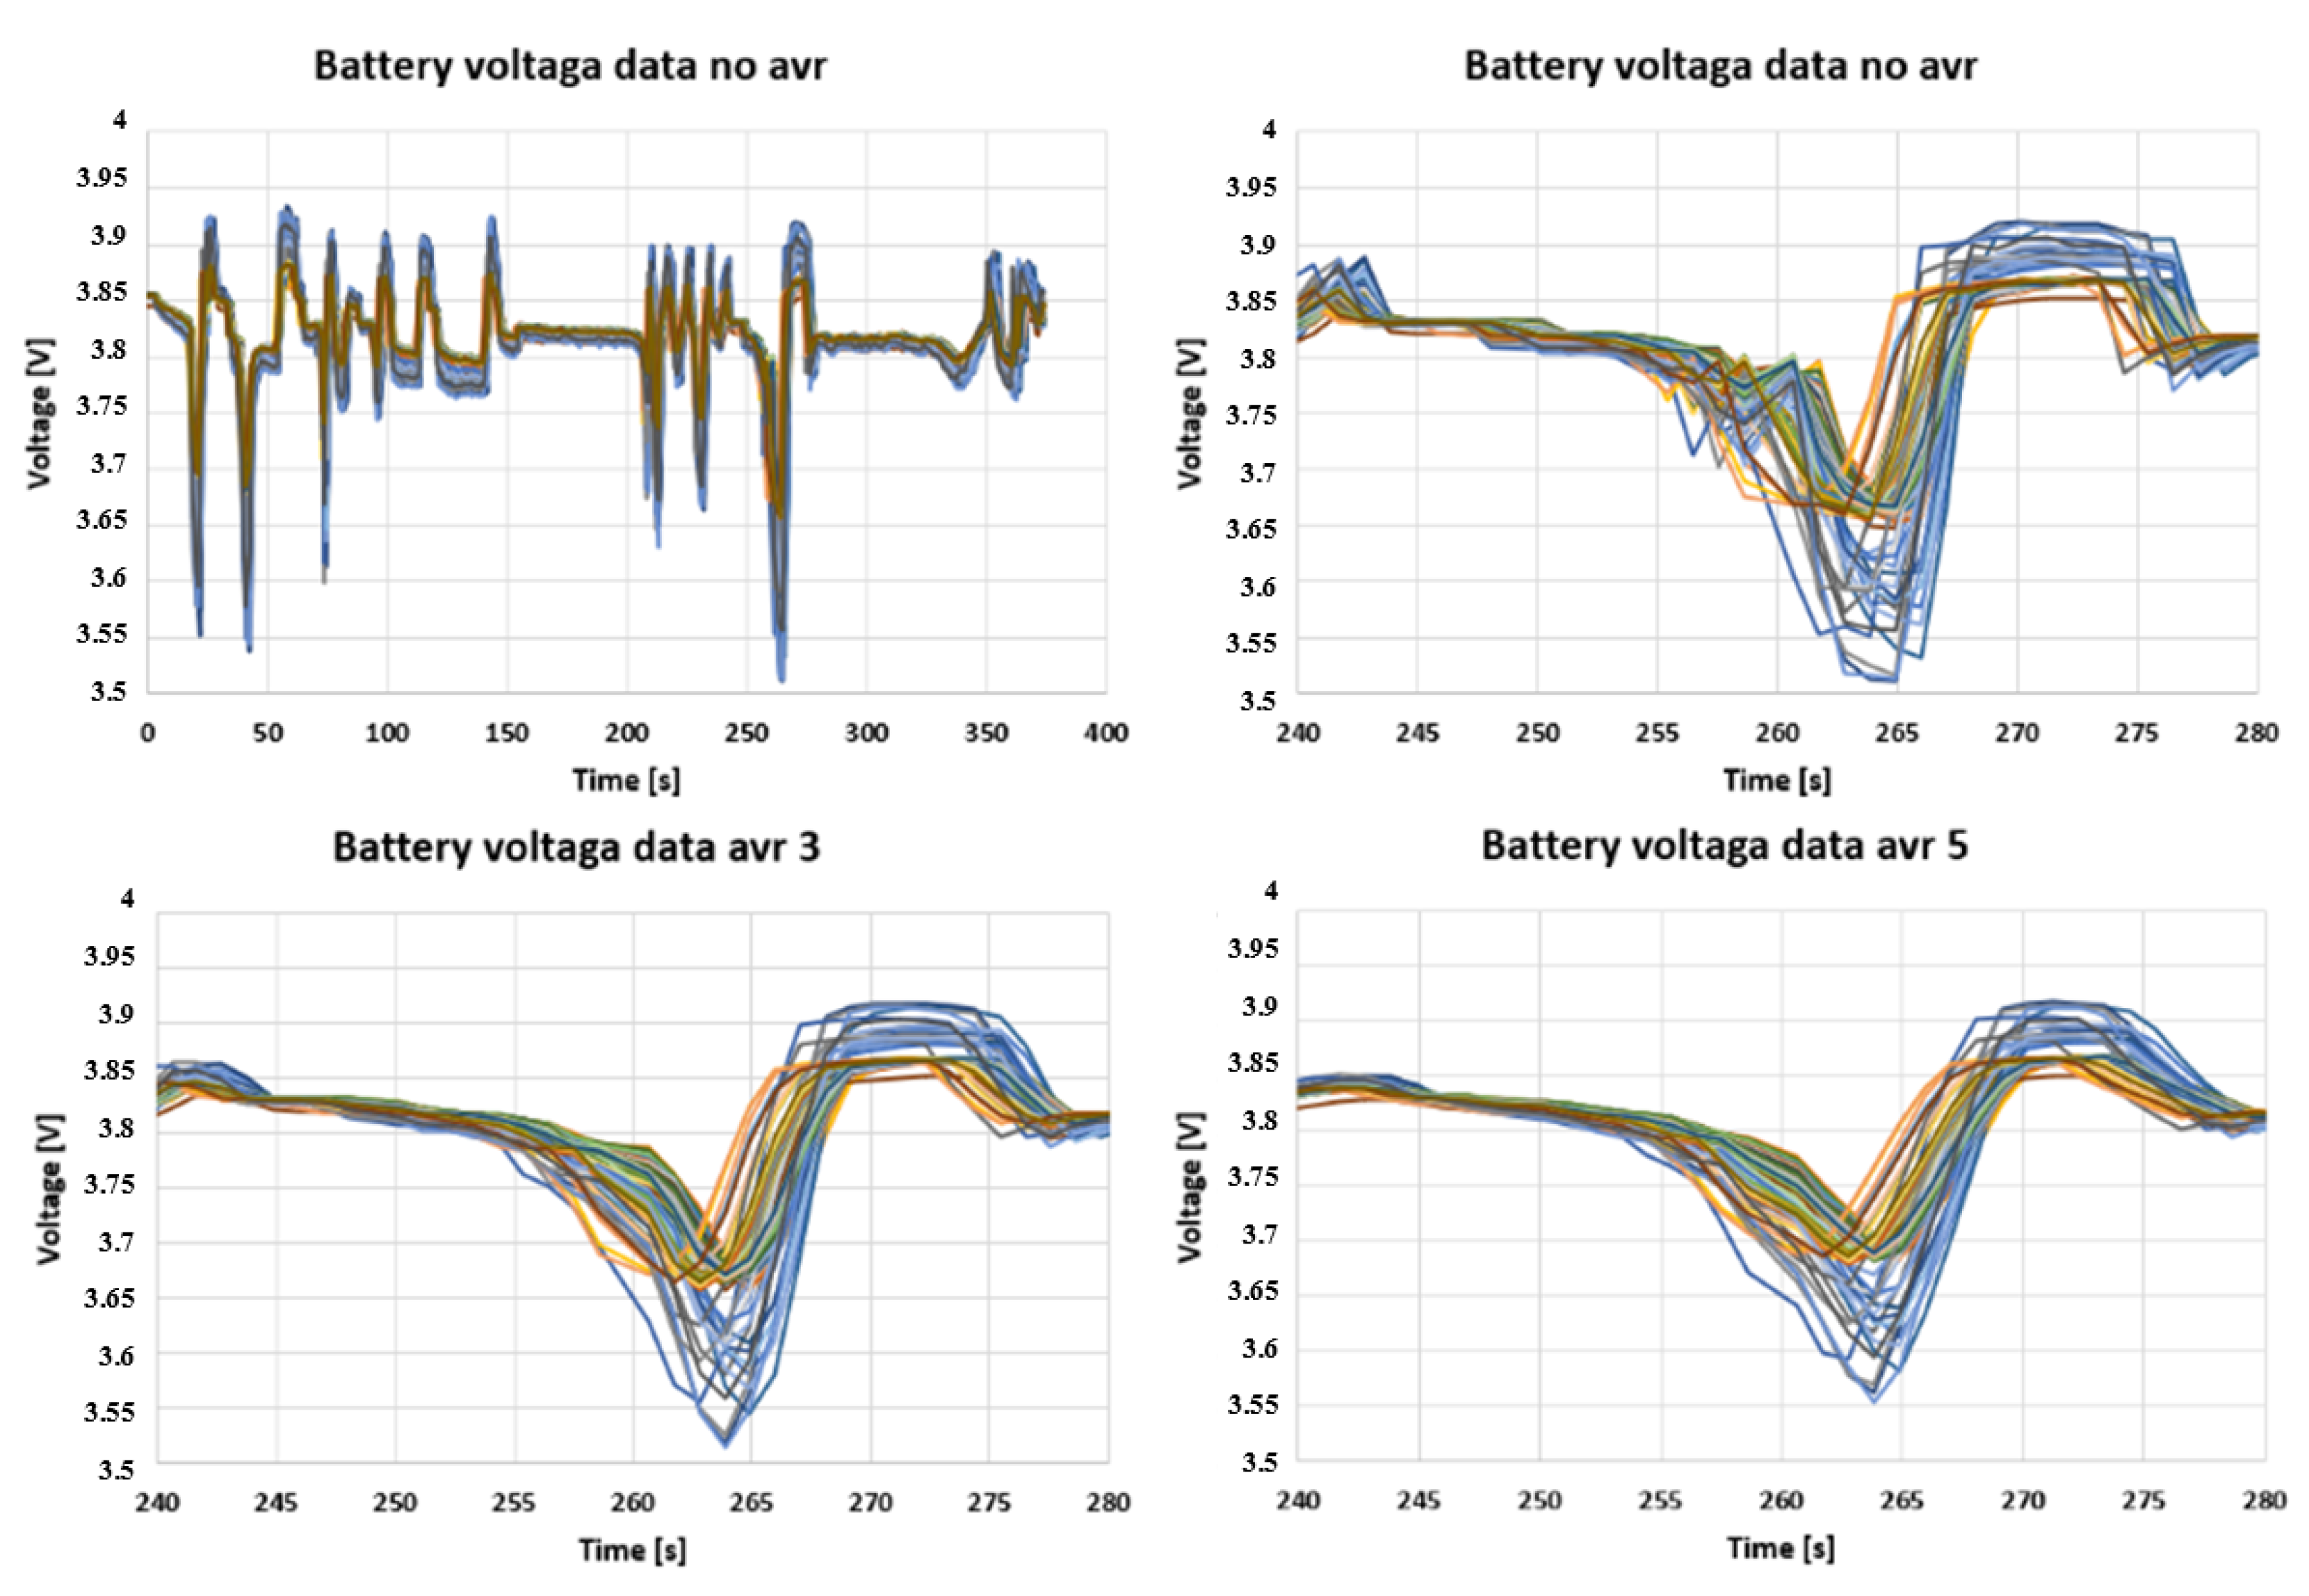
2.1. Test Process
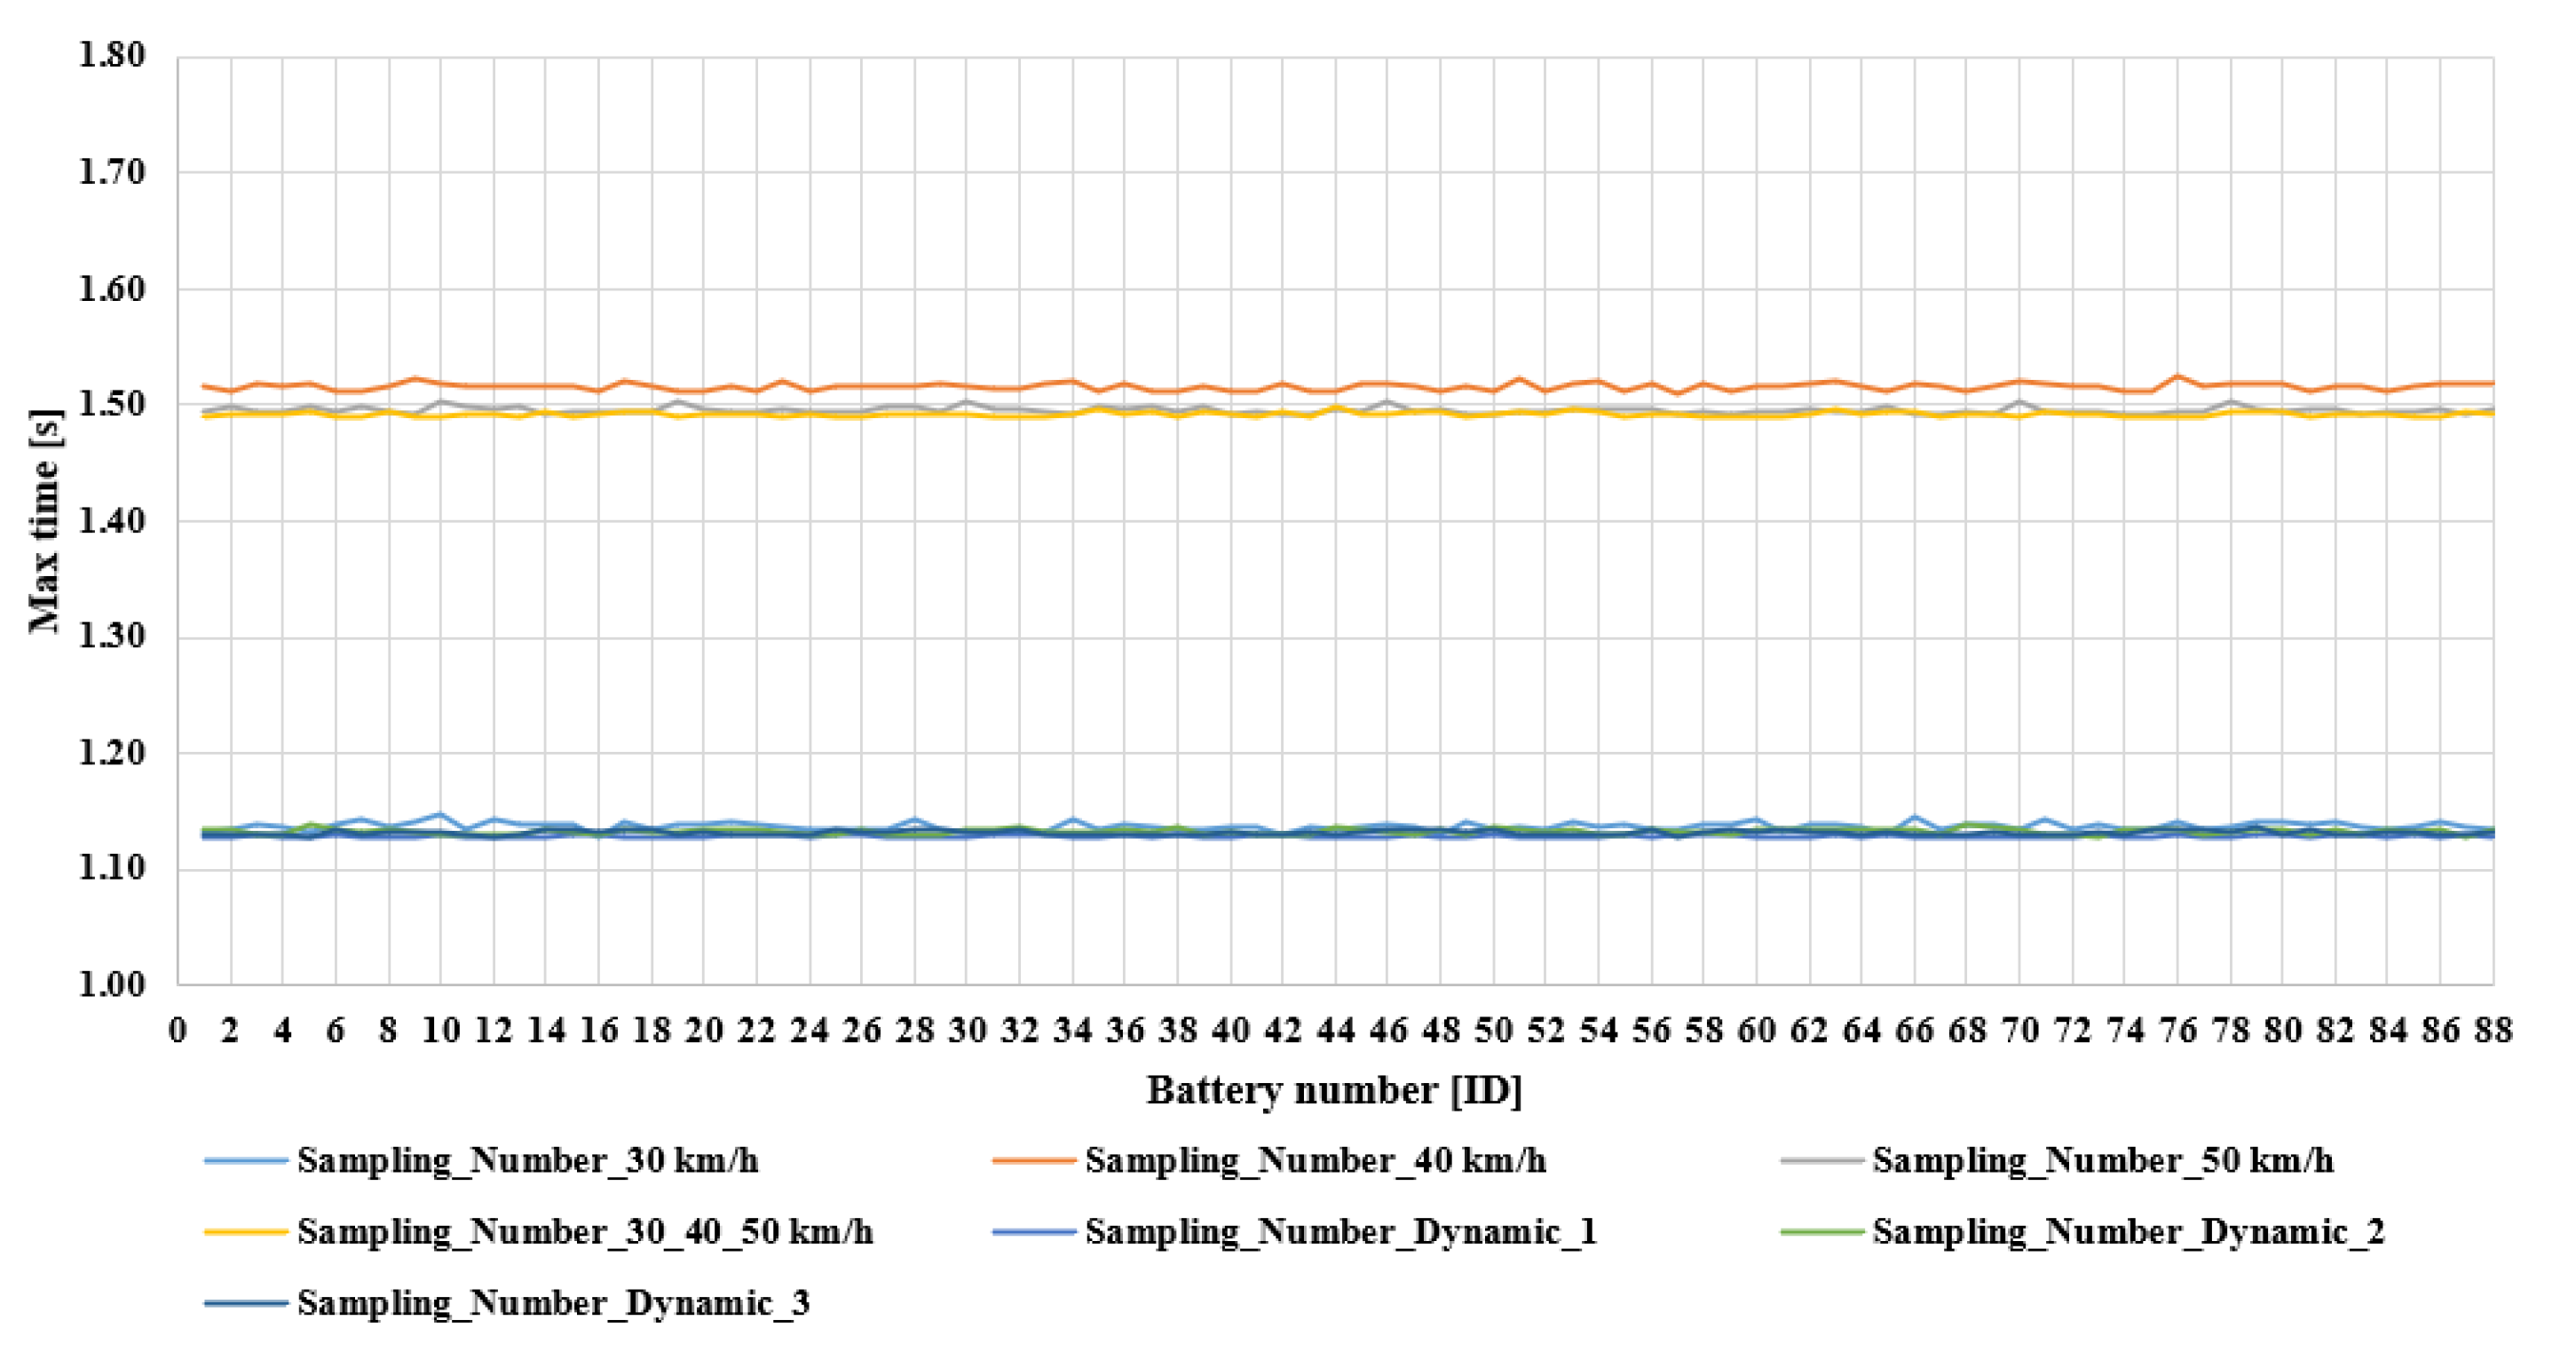
- constant speed: 30 km/h, 40 km/h, and 50 km/h;
- stepped constant: 30–40–50 km/h;
- dynamically variable speed.
- system voltage [V];
- current [A];
- 88 cell voltages [V];
- four separated battery temperature values [°C];
- vehicle speed [km/h];
- GPS (Global Positioning System) speed [km/h].
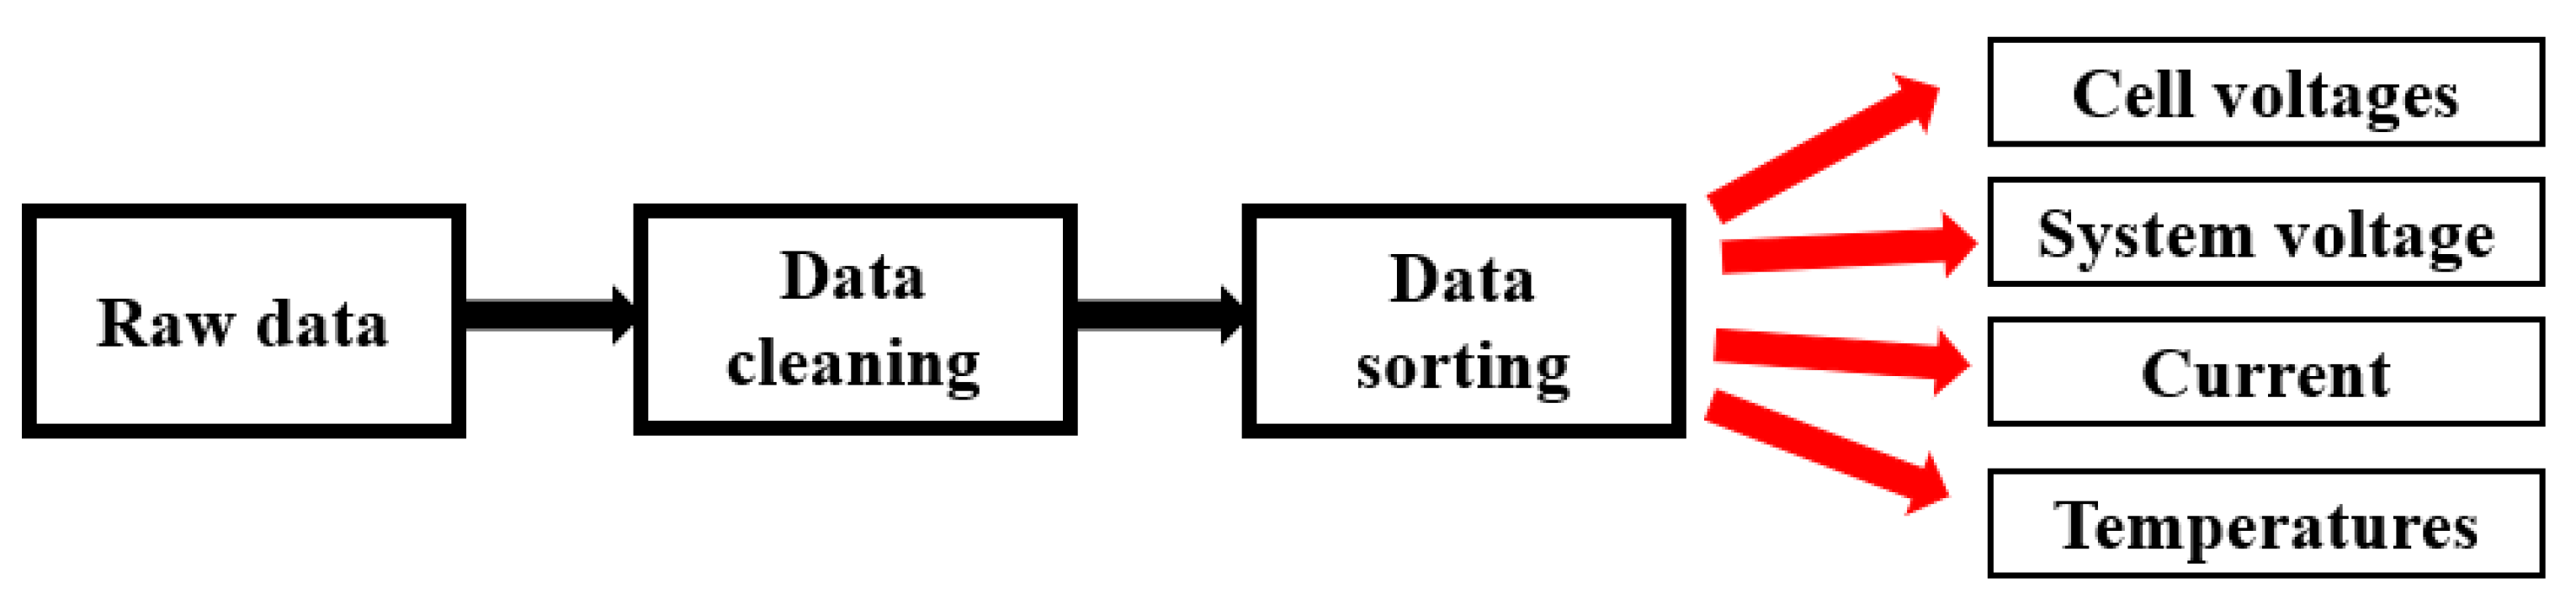
2.2. Data Process
3. Results
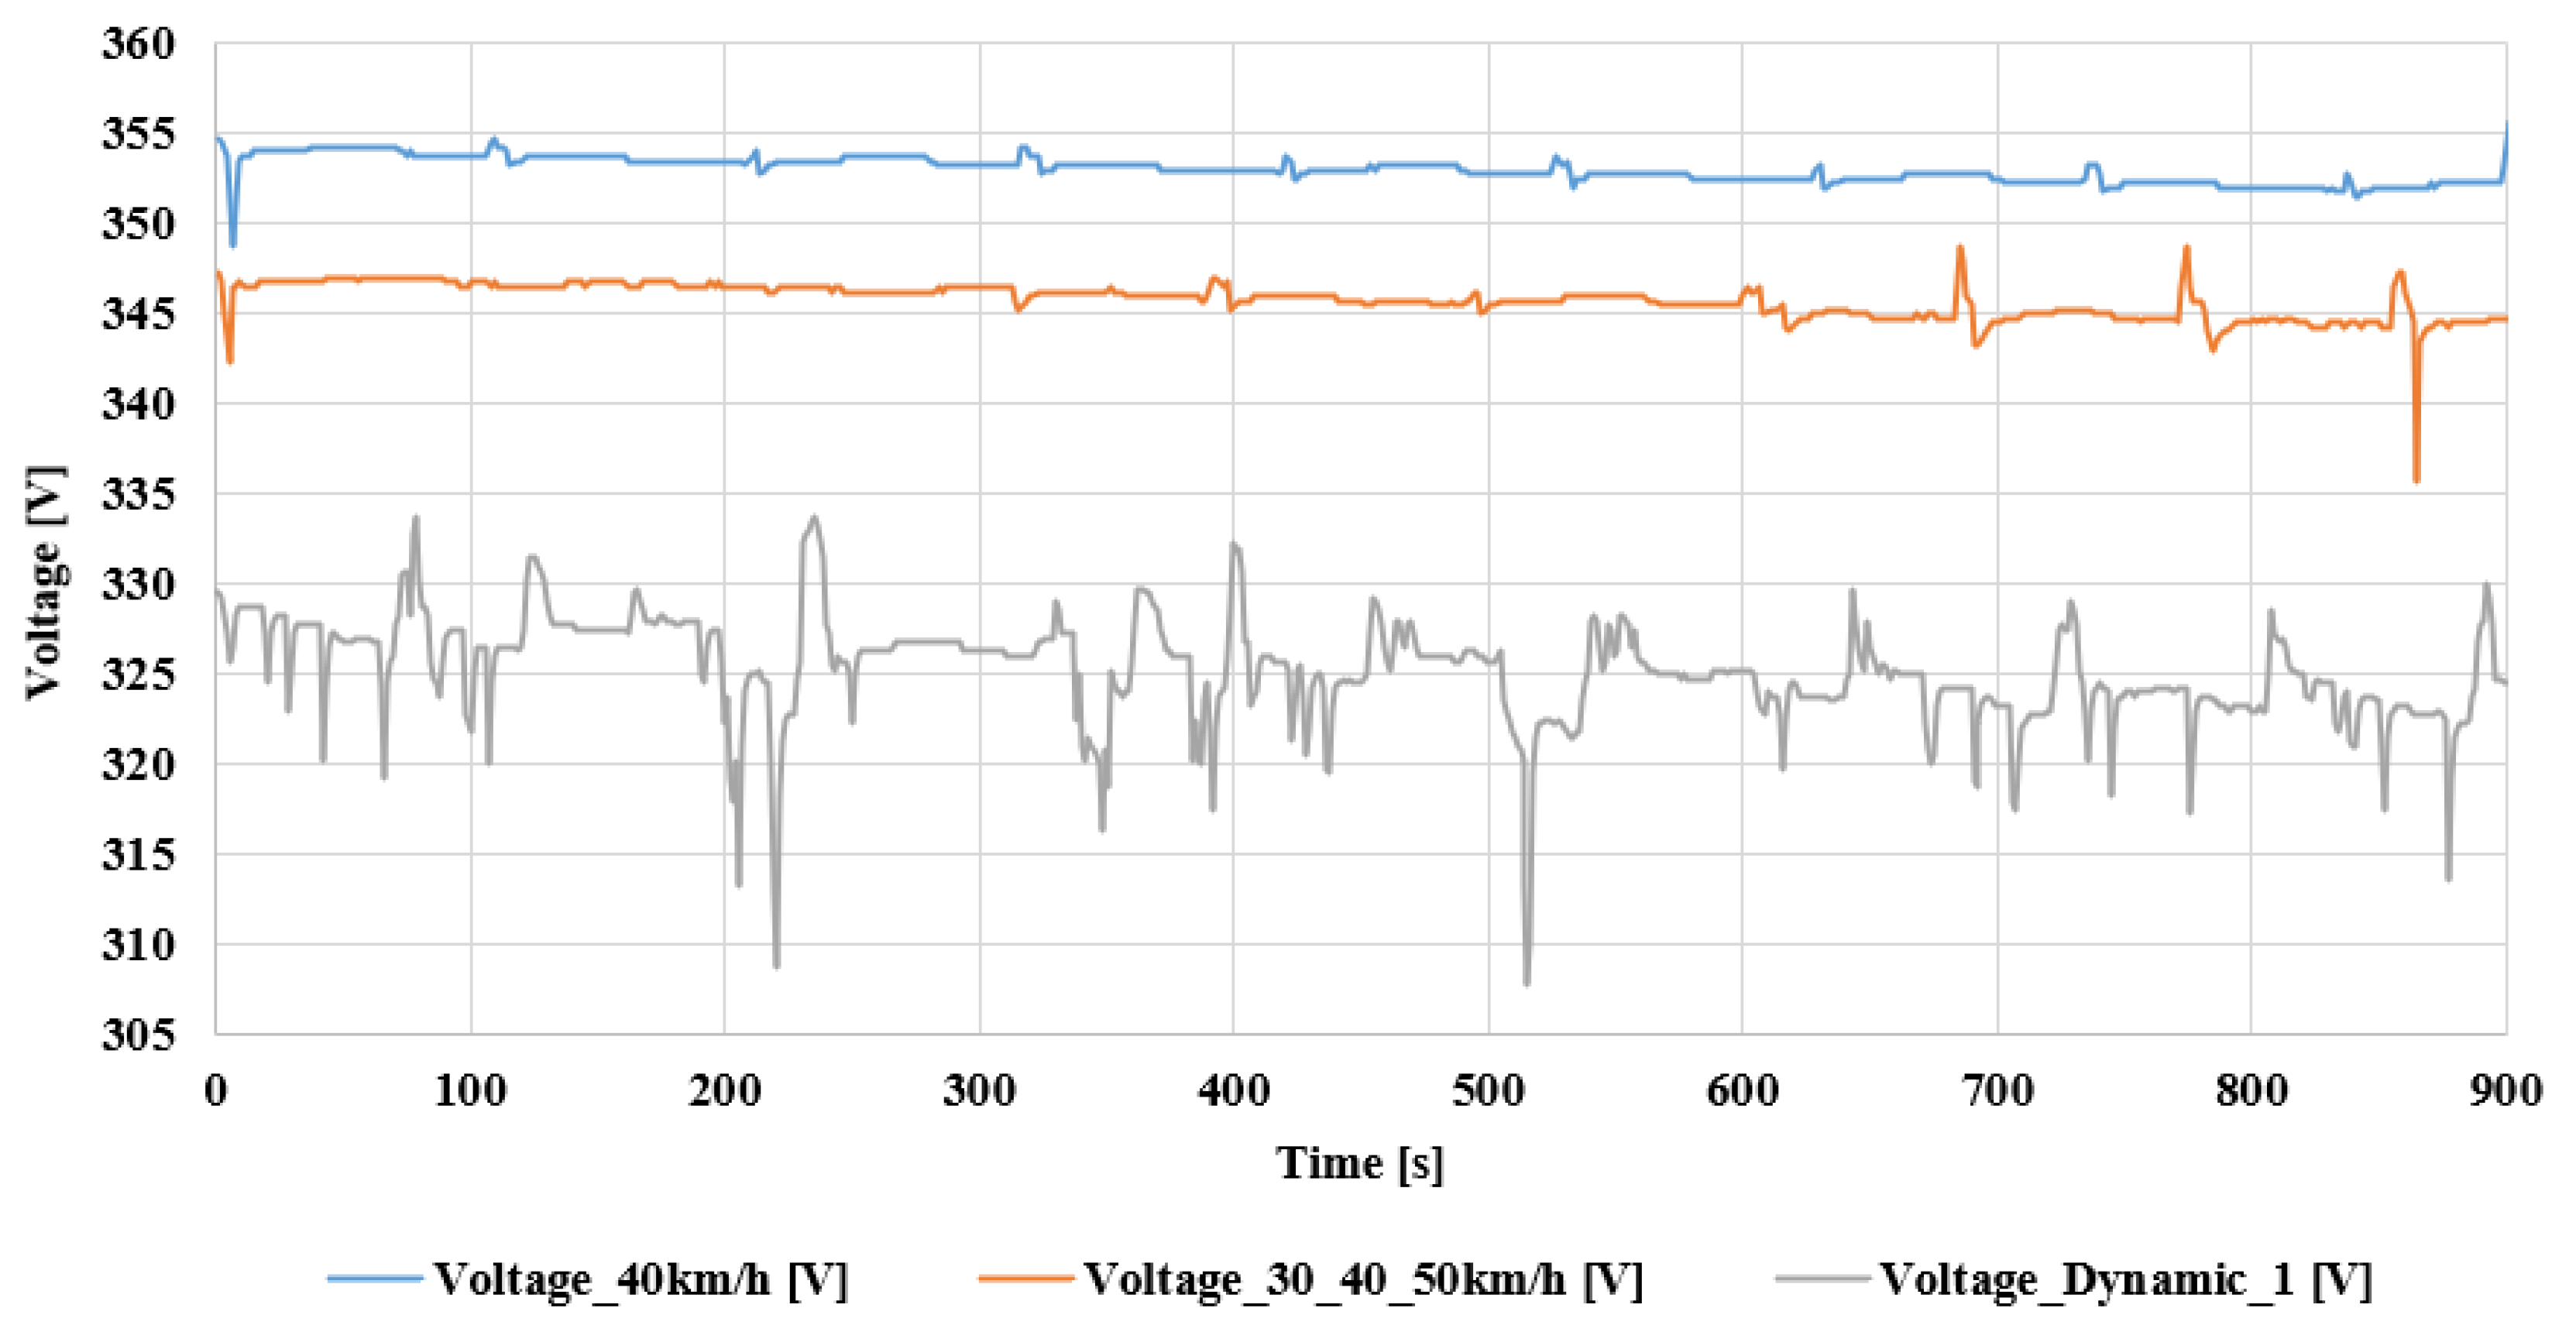
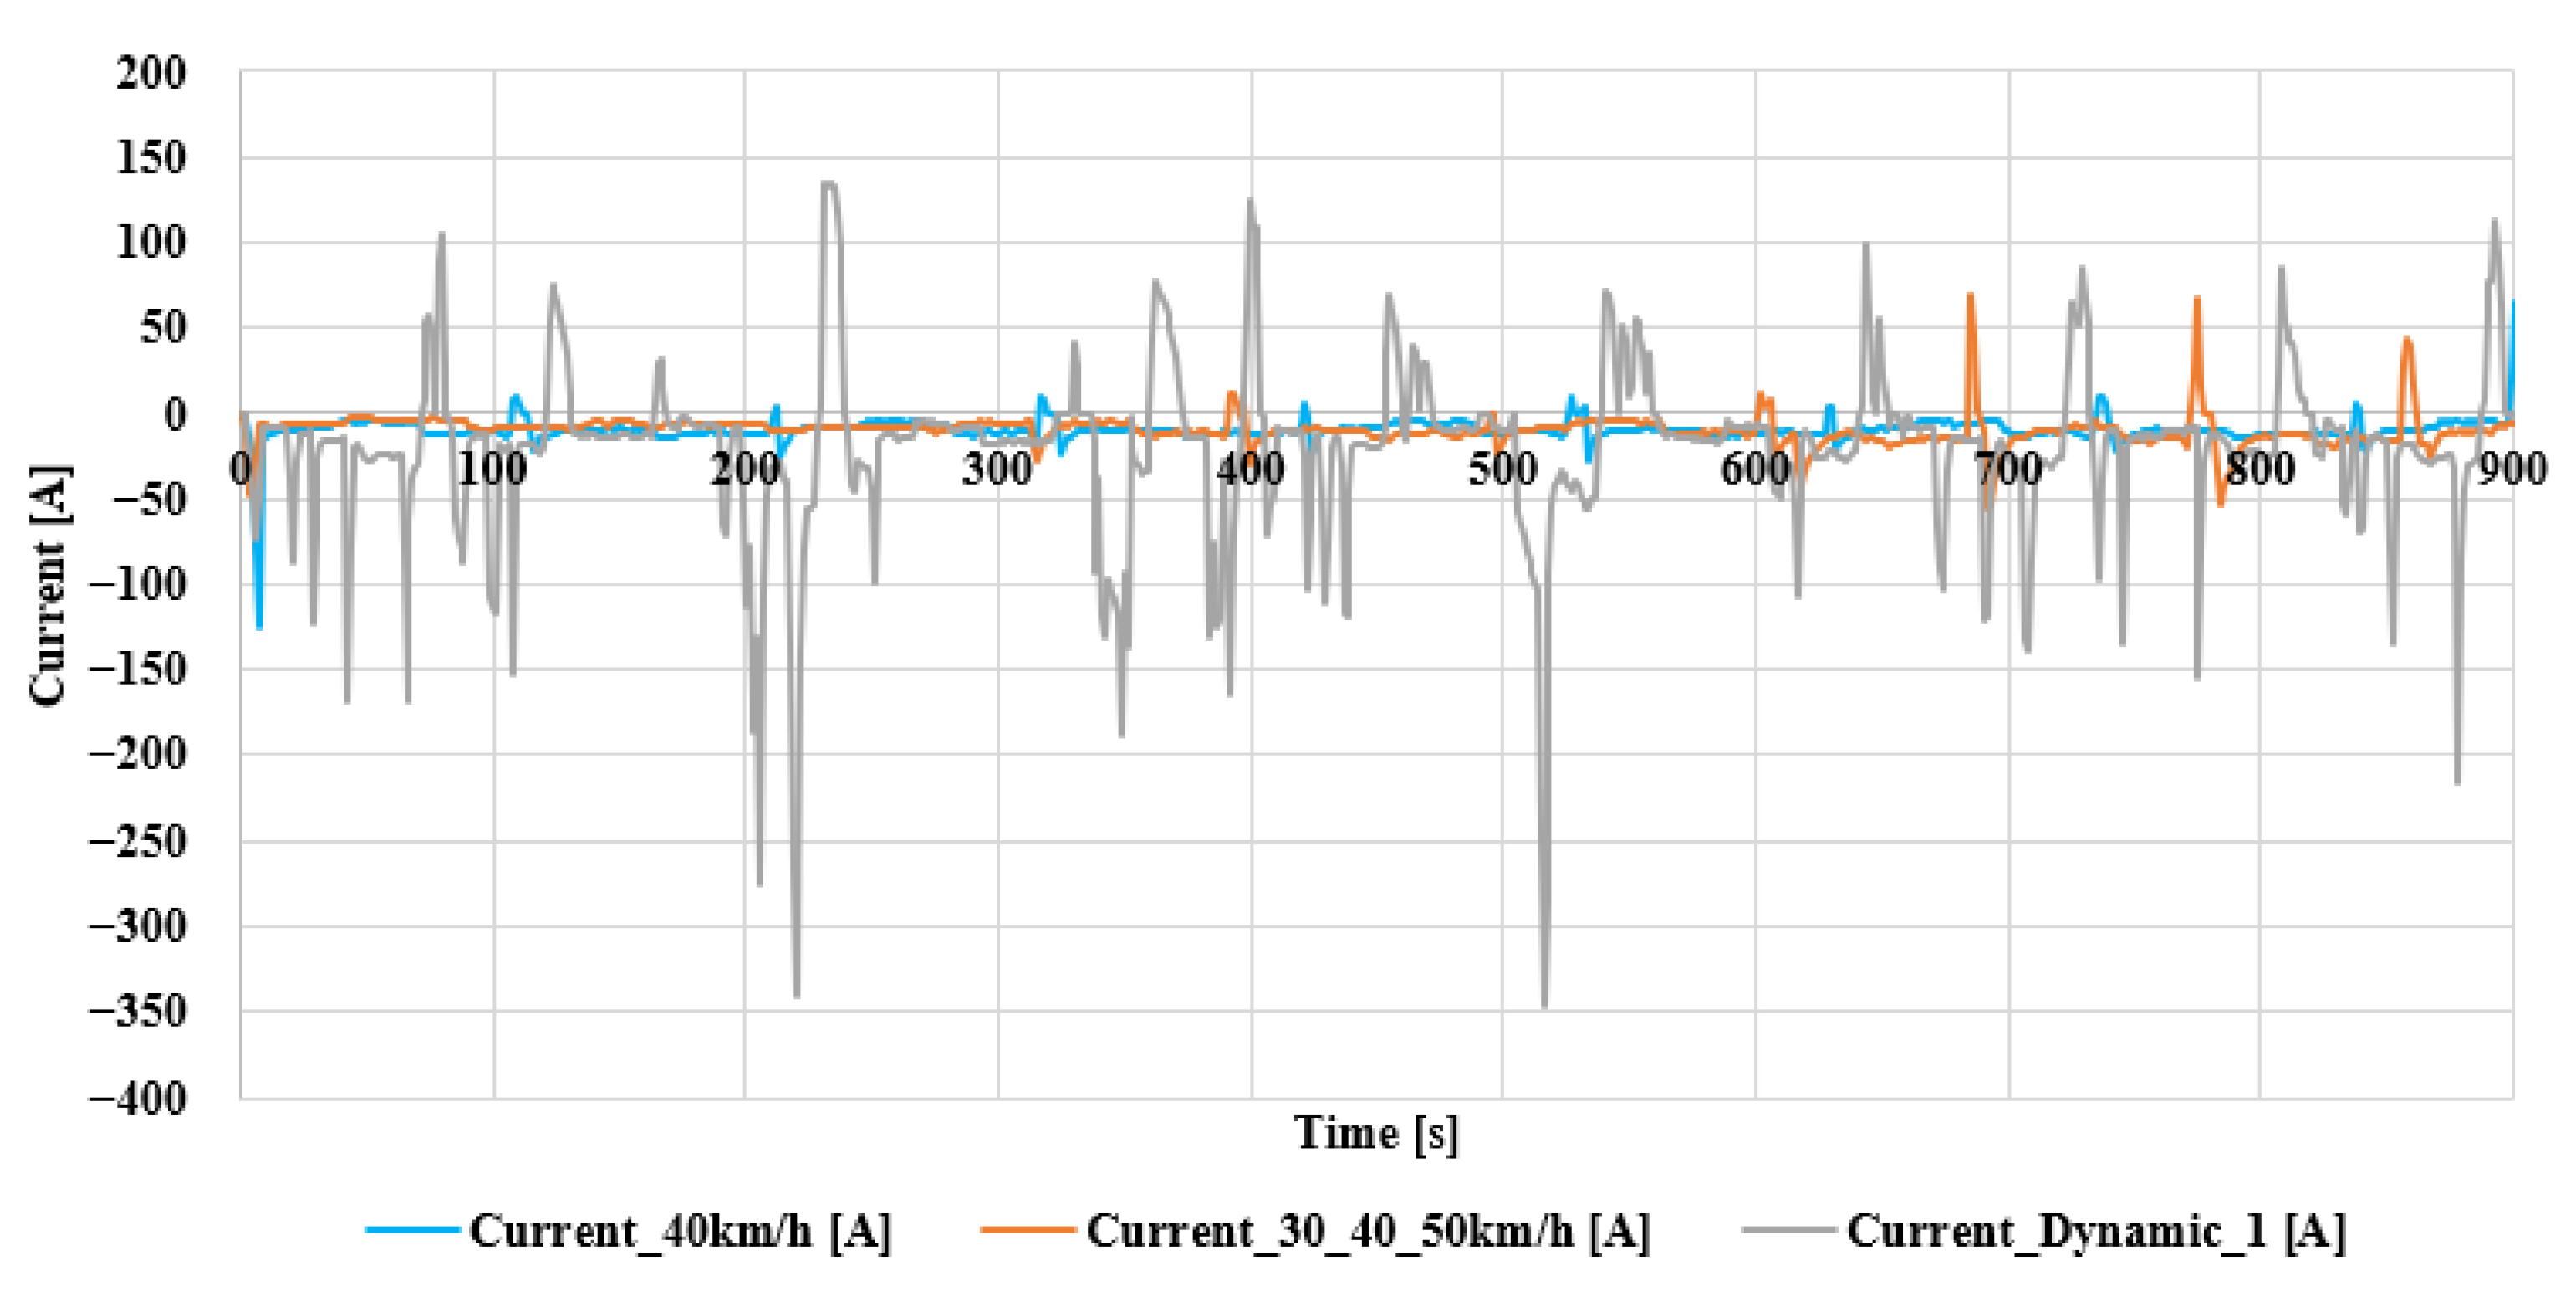
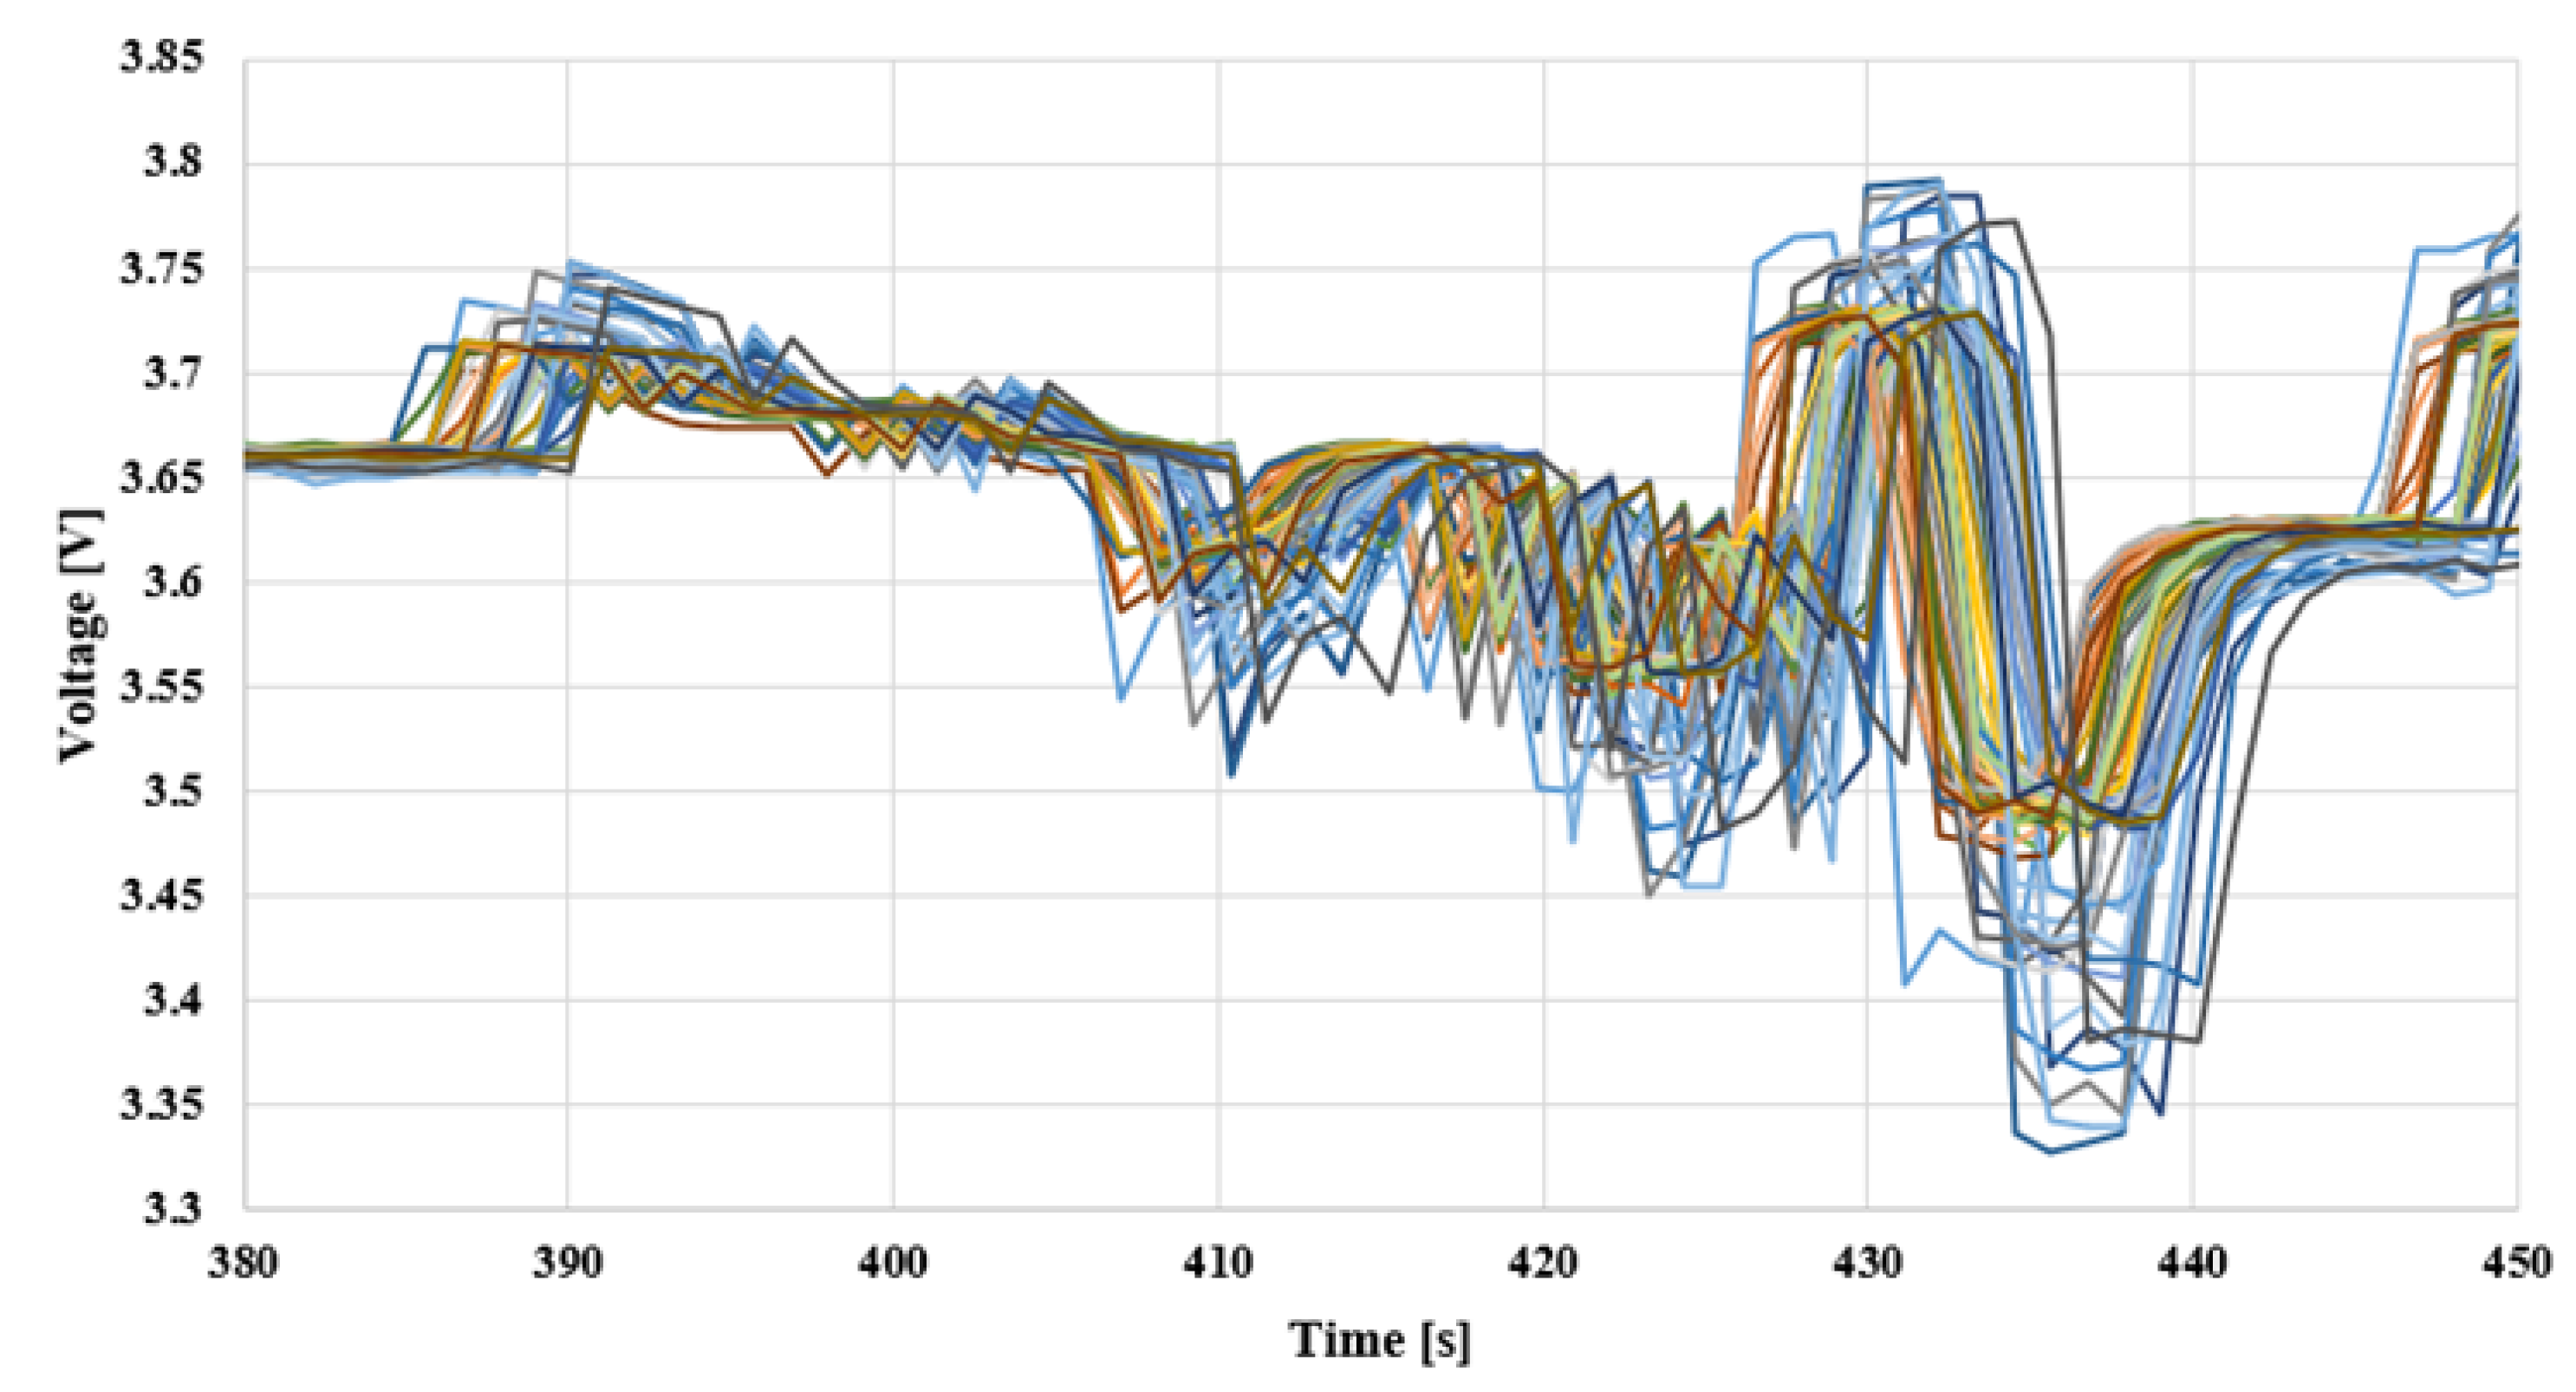
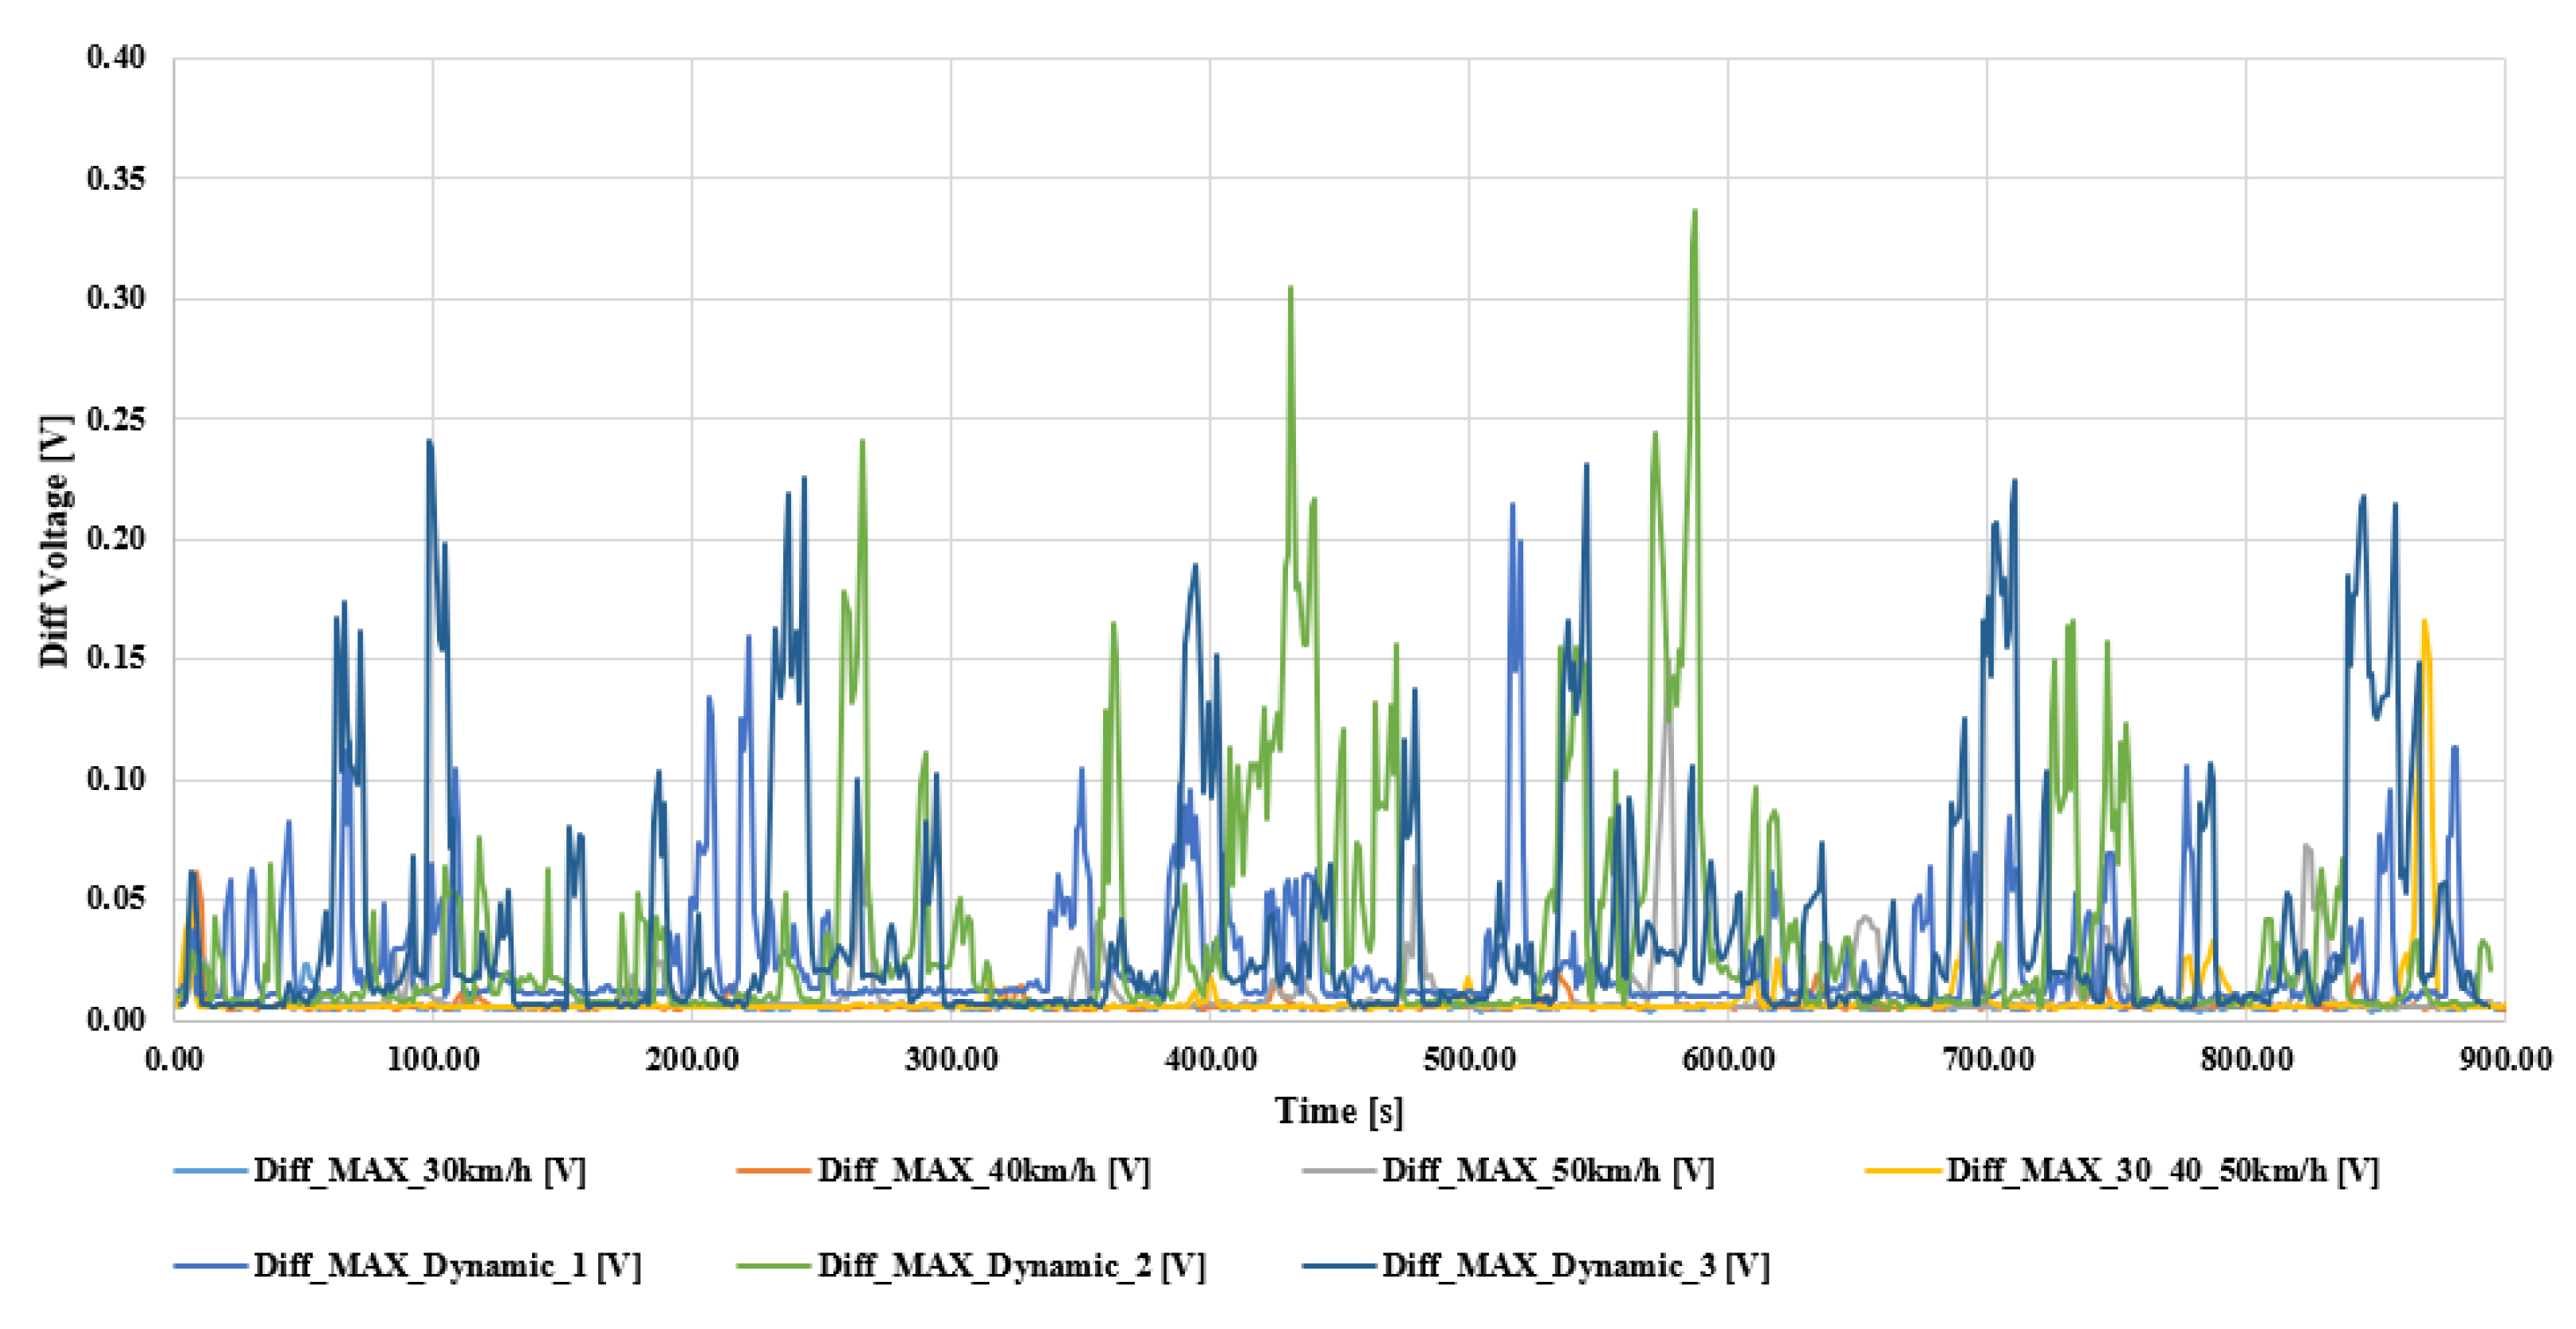
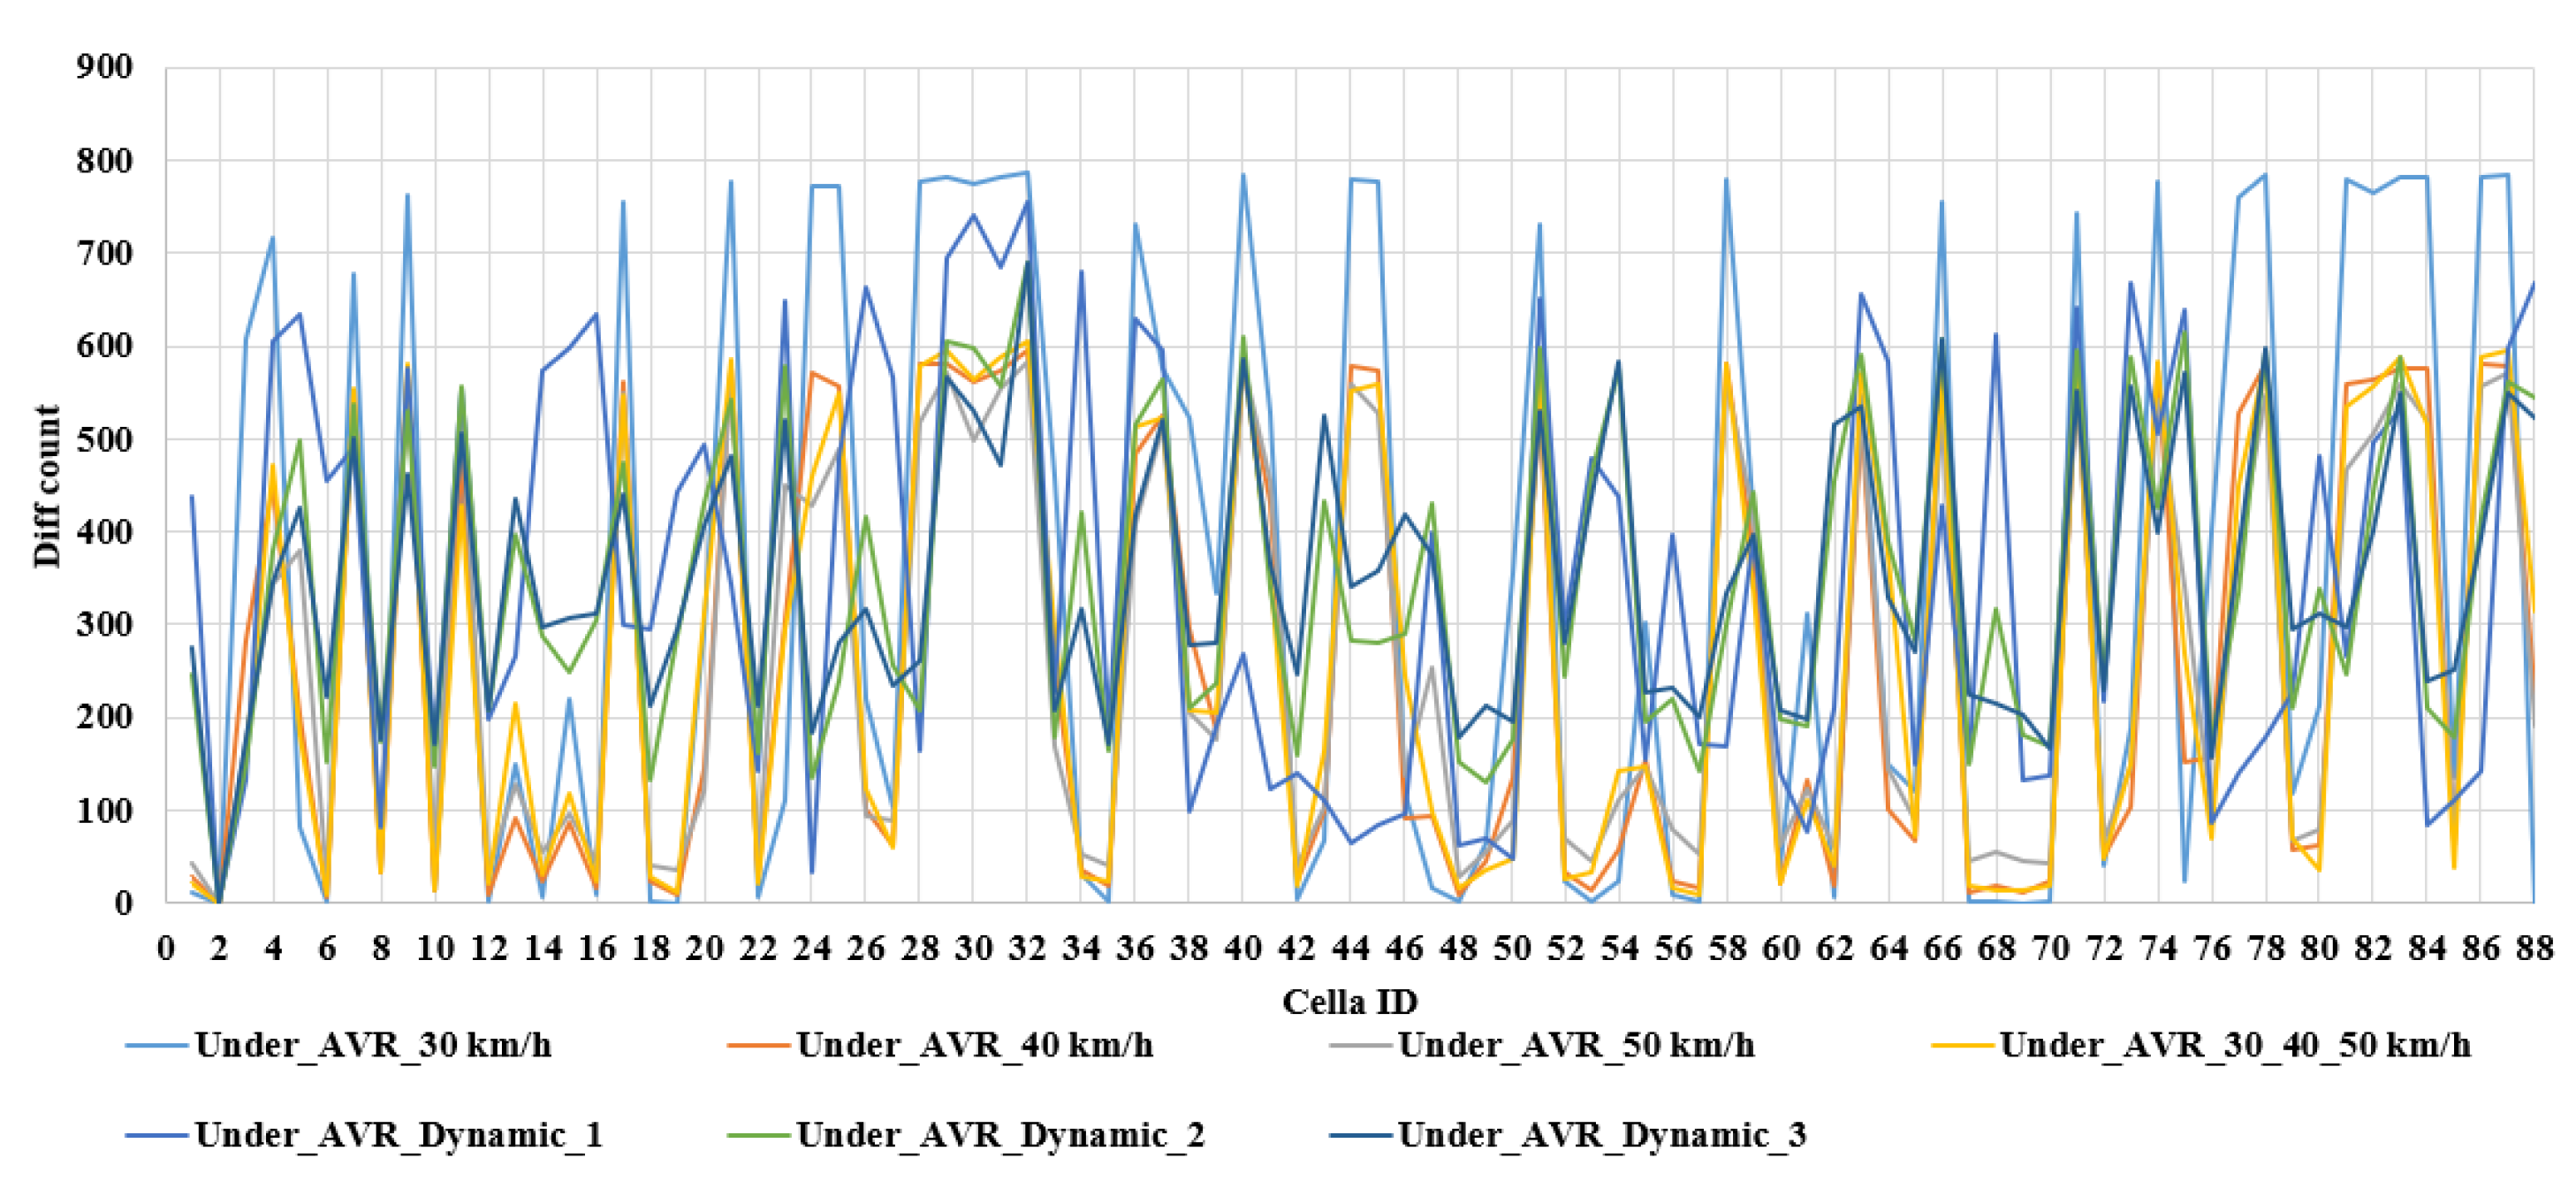
3.1. Data Analysis—Evaluation Process
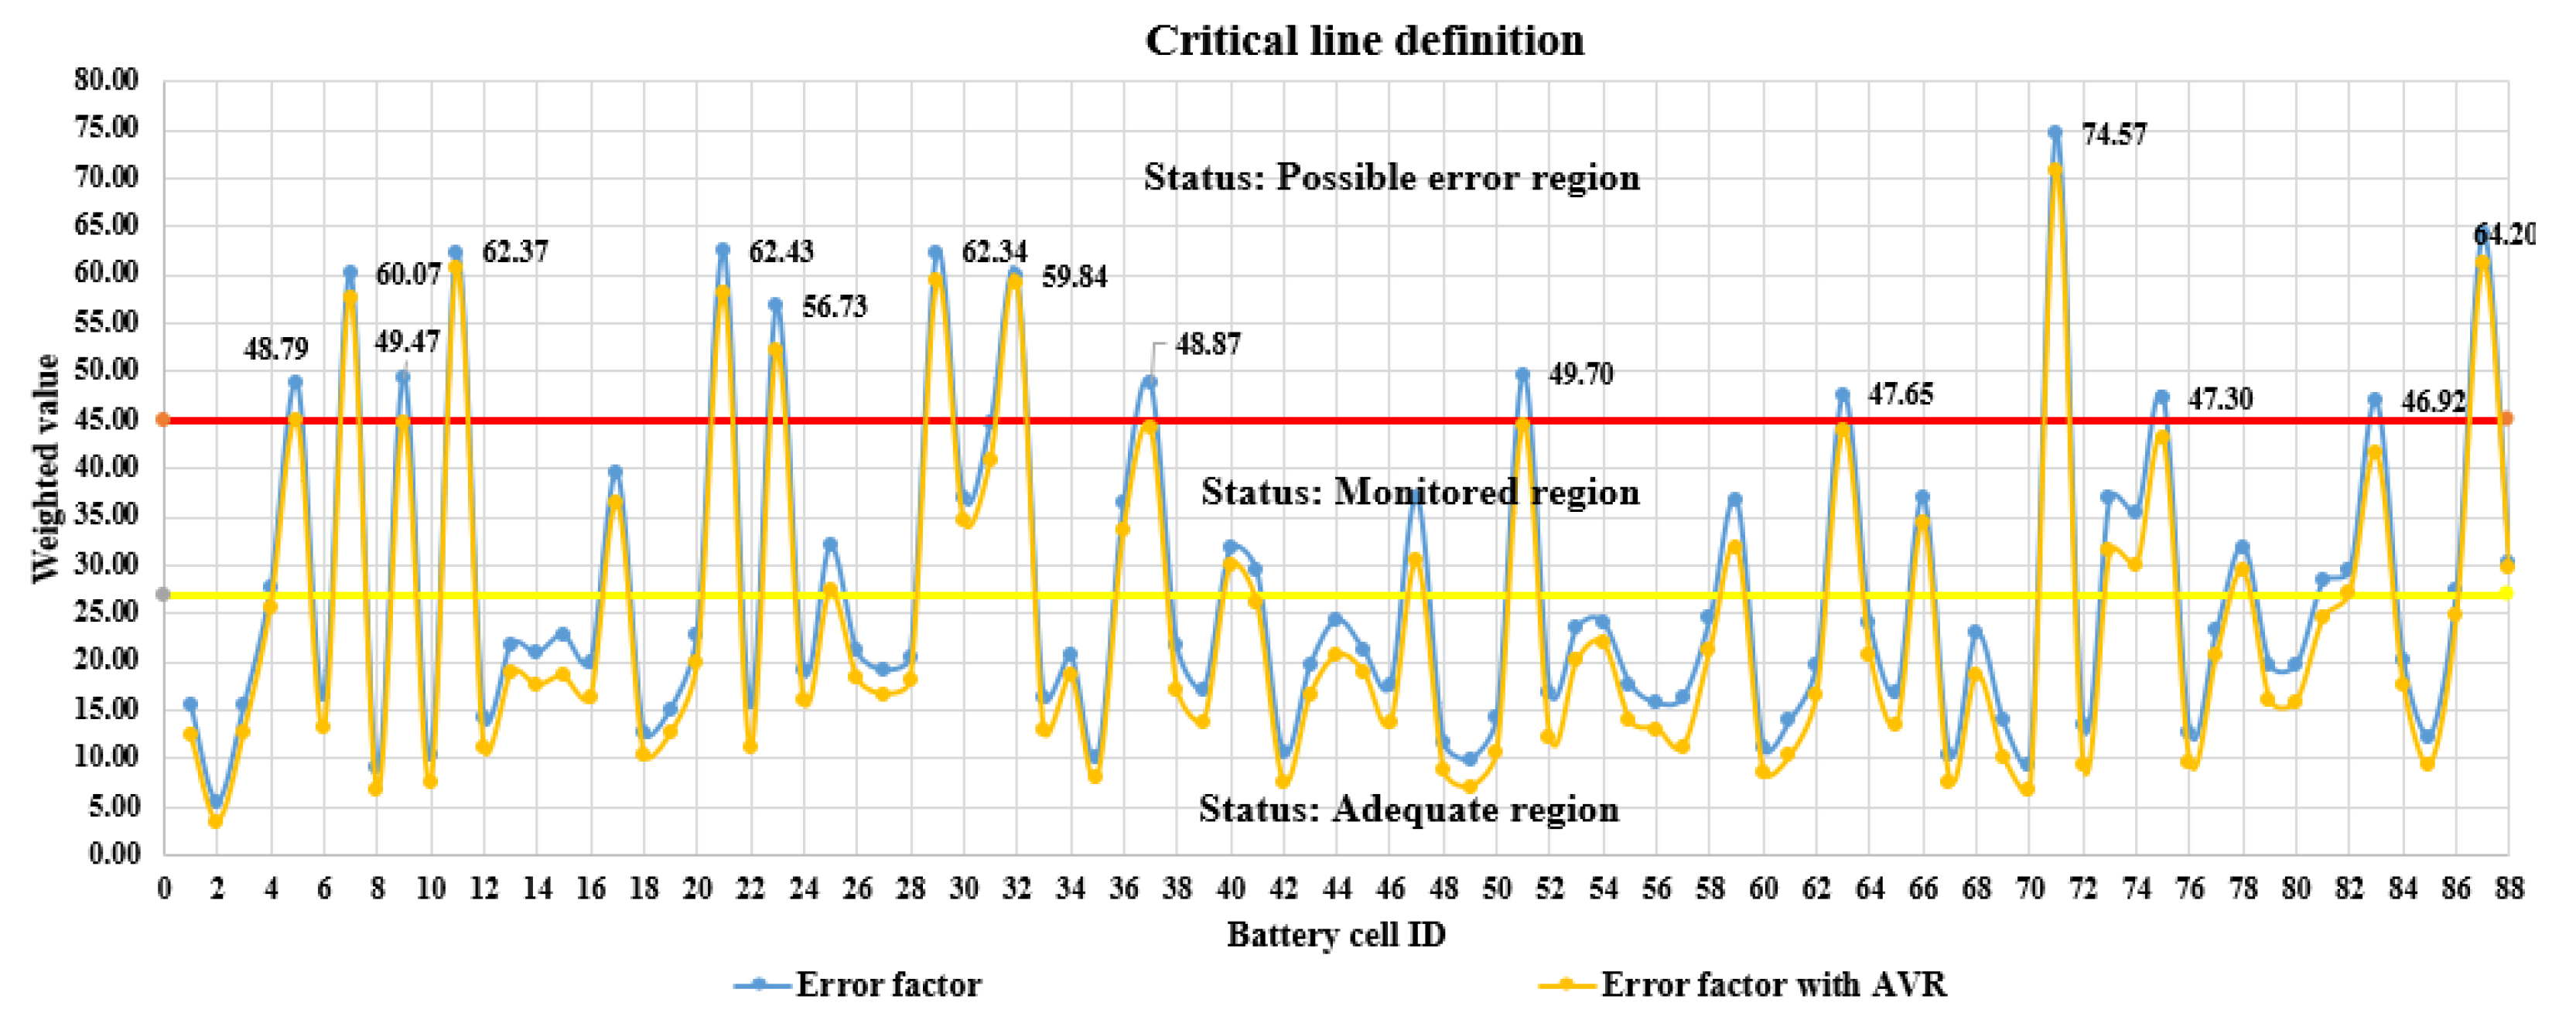
3.2. Faulty Cell Localization
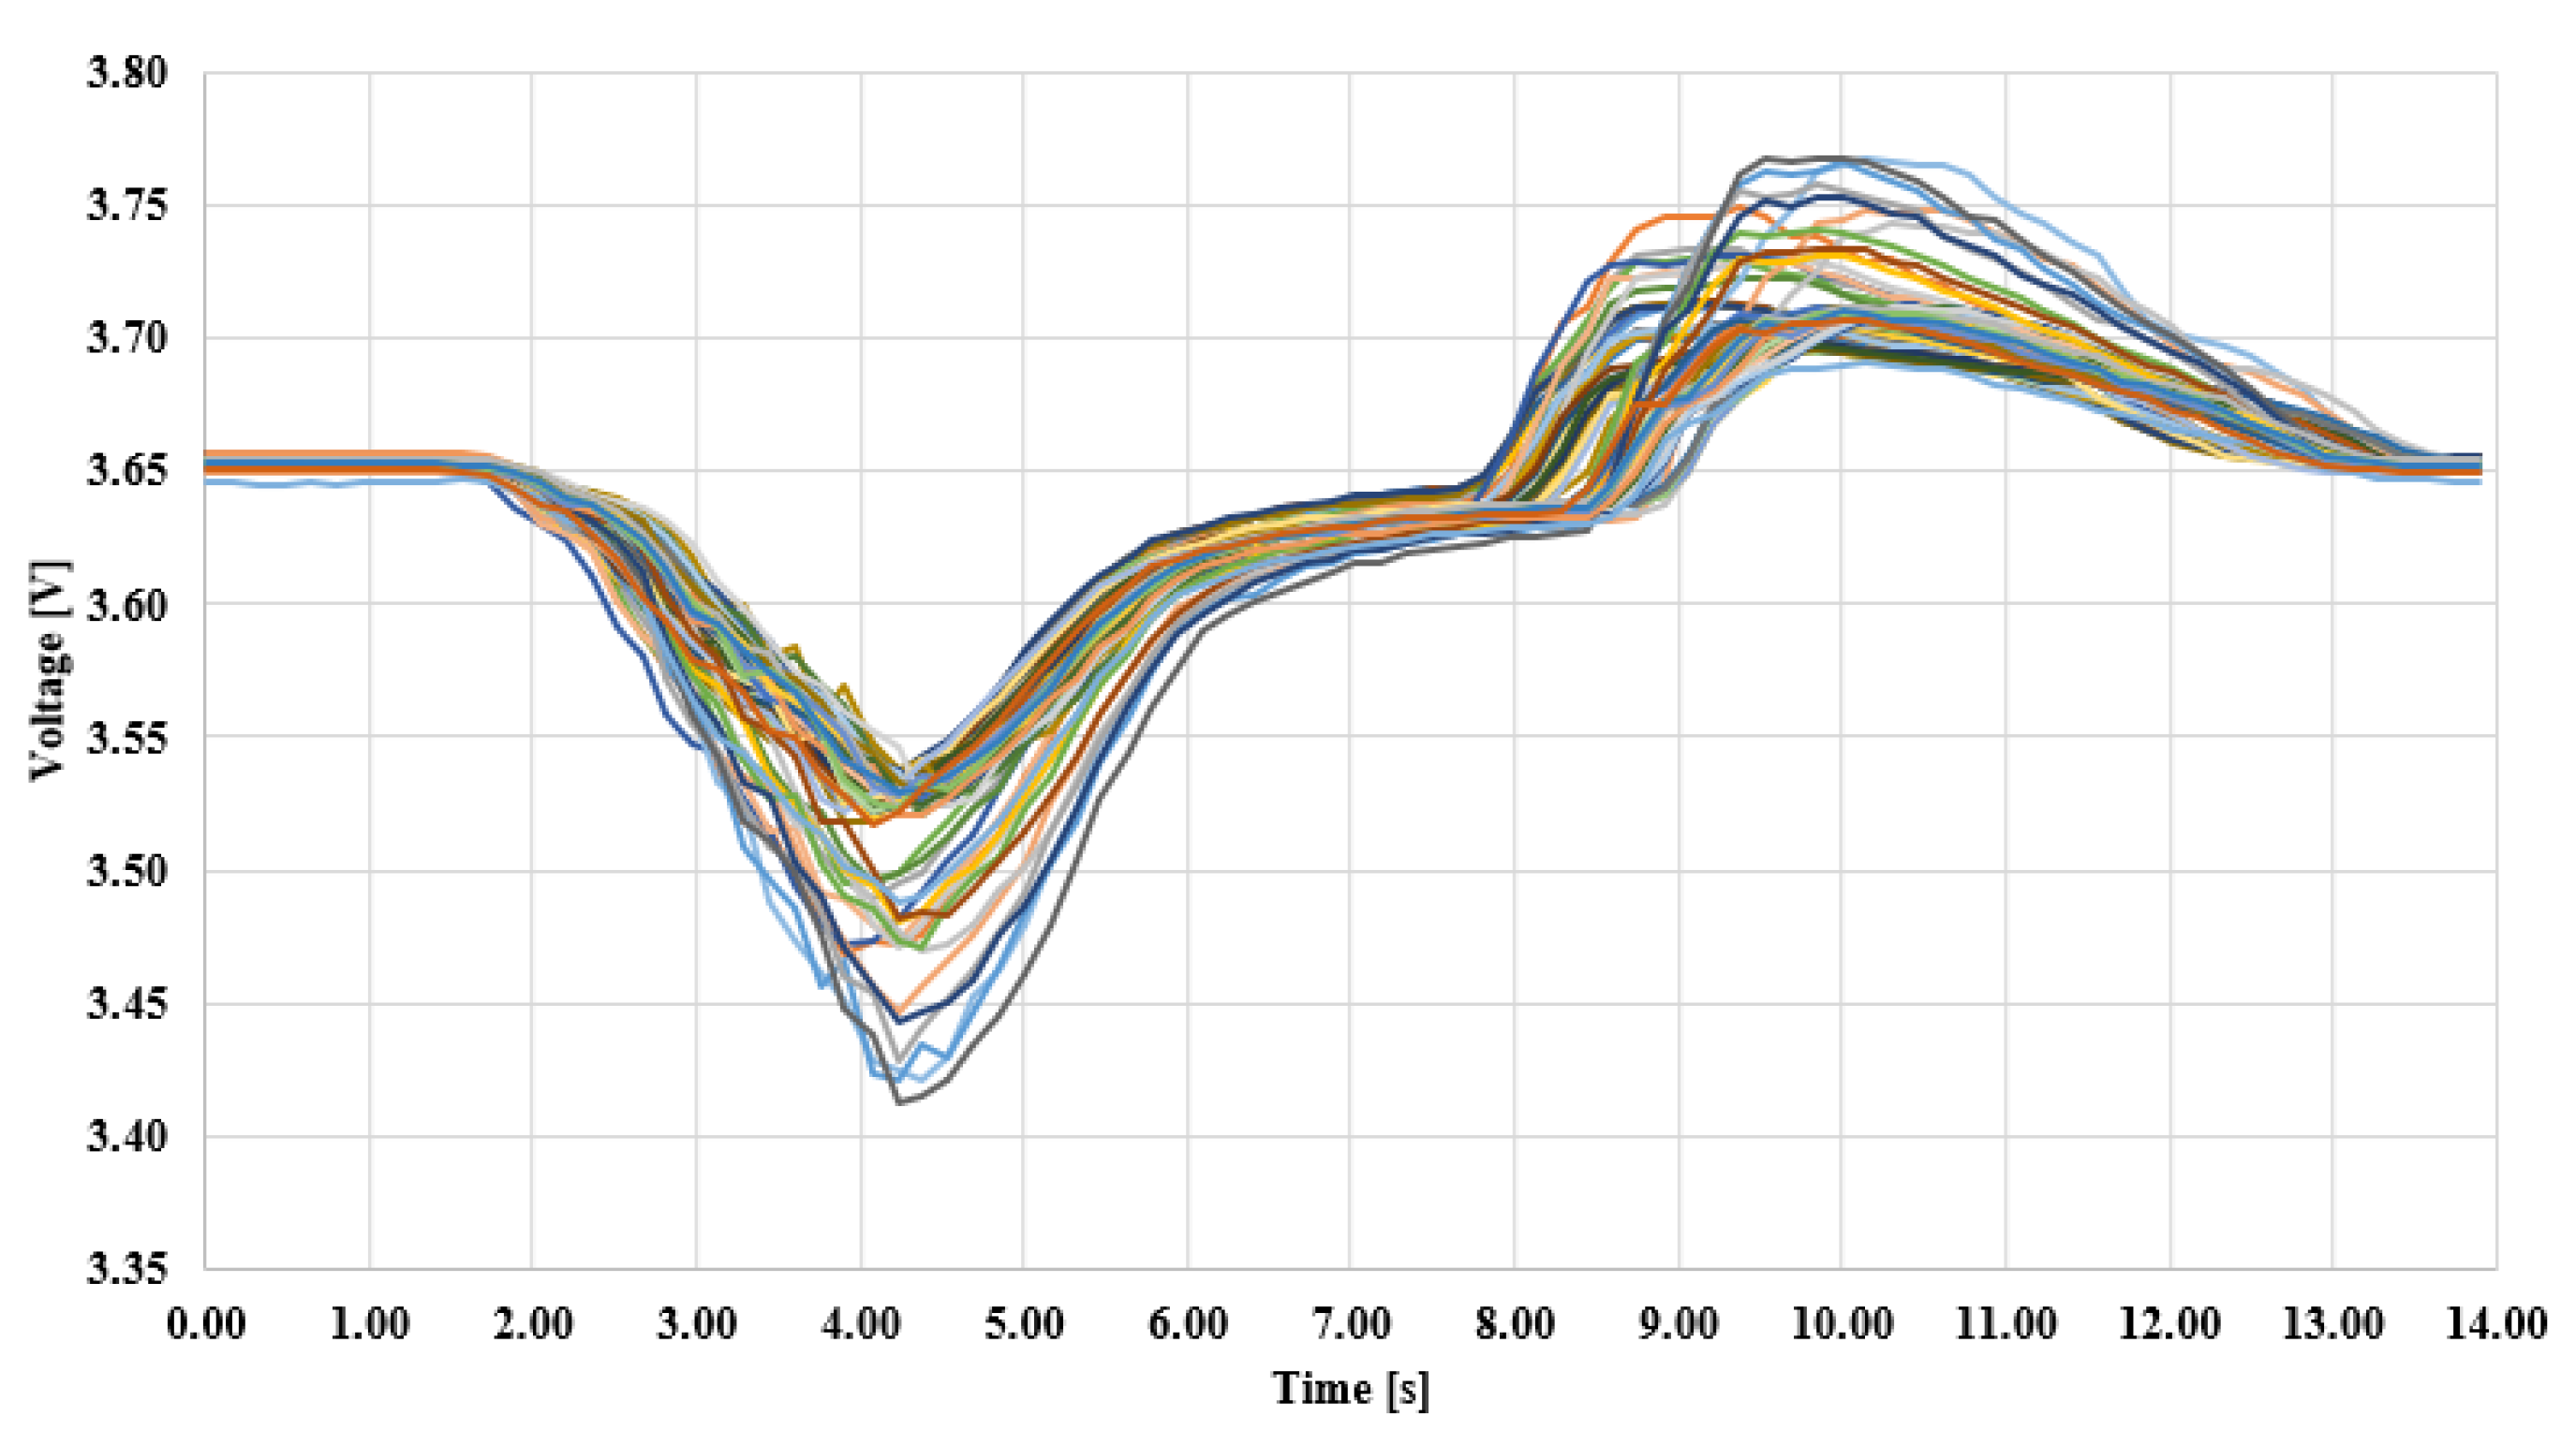
3.3. Validation Process
4. Discussion
5. Conclusions
Author Contributions
Funding
Data Availability Statement
Conflicts of Interest
Abbreviations
| BMS | Battery Management System |
| CAN | Controller Area Network |
| CAN BUS | Controller Area Network BUS |
| DCTS | Data Cleaning Transformation and Shorting |
| ECU | Electronic Control Unit |
| EPA | US Environmental Protection Agency |
| ETL | Extract, Transform, Load |
| GPS | Global Positioning System |
| ID | Identification number |
| NEDC | New European Driving Cycle |
| OBD | On-Board Diagnostics port |
| SOC | State of Charge |
| SOH | State of Health |
| WLTP | World harmonized Light vehicle Test Procedure |
References
- Kihm, A.; Trommer, S. The new car market for electric vehicles and the potential for fuel substitution. Energy Policy 2014, 73, 147–157. [Google Scholar] [CrossRef]
- Goetzel, N.; Hasanuzzaman, M. An empirical analysis of electric vehicle cost trends: A case study in Germany. Res. Transp. Bus. Manag. 2022, 43, 100825. [Google Scholar] [CrossRef]
- Ma, S.C.; Xu, J.H.; Fan, Y. Characteristics and key trends of global electric vehicle technology development: A multi-method patent analysis. J. Clean. Prod. 2022, 338, 130502. [Google Scholar] [CrossRef]
- Beltrami, D.; Iora, P.; Tribioli, L.; Uberti, S. Electrification of Compact Off-Highway Vehicles—Overview of the Current State of the Art and Trends. Energies 2021, 14, 5565. [Google Scholar] [CrossRef]
- International Energy Agency. Global EV Outlook 2022 Securing Supplies for an Electric Future. 2022. Available online: www.iea.org/t&c/ (accessed on 15 November 2022).
- Sanguesa, J.; Torres-Sanz, V.; Garrido, P.; Martinez, F.; Marquez-Barja, J. A Review on Electric Vehicles: Technologies and Challenges. Smart Cities 2021, 4, 372–404. [Google Scholar] [CrossRef]
- Lai, X.; Chen, Q.; Tang, X.; Zhou, Y.; Gao, F.; Guo, Y.; Bhagat, R.; Zheng, Y. Critical review of life cycle assessment of lithium-ion batteries for electric vehicles: A lifespan perspective. Etransportation 2022, 12, 100169. [Google Scholar] [CrossRef]
- Przekota, G. Do High Fuel Prices Pose an Obstacle to Economic Growth? A Study for Poland. Energies 2022, 15, 6606. [Google Scholar] [CrossRef]
- Lipu, M.H.; Hannan, M.; Karim, T.F.; Hussain, A.; Saad, M.H.M.; Ayob, A.; Miah, S.; Mahlia, T.I. Intelligent algorithms and control strategies for battery management system in electric vehicles: Progress, challenges and future outlook. J. Clean. Prod. 2021, 292, 126044. [Google Scholar] [CrossRef]
- How, D.N.T.; Hannan, M.A.; Hossain Lipu, M.S.; Ker, P.J. State of Charge Estimation for Lithium-Ion Batteries Using Model-Based and Data-Driven Methods: A Review. IEEE Access 2019, 7, 136116–136136. [Google Scholar] [CrossRef]
- Shah, F.A.; Sheikh, S.S.; Mir, U.I.; Athar, S.O. Battery Health Monitoring for Commercialized Electric Vehicle Batteries: Lithium-Ion. In Proceedings of the 2019 International Conference on Power Generation Systems and Renewable Energy Technologies (PGSRET), Istanbul, Turkey, 26–27 August 2019; pp. 1–6. [Google Scholar] [CrossRef]
- Santhanagopalan, S.; Zhang, Q.; Kumaresan, K.; White, R.E. Parameter Estimation and Life Modeling of Lithium-Ion Cells. J. Electrochem. Soc. 2008, 155, A345. [Google Scholar] [CrossRef]
- Shekhovtsov, A.; Więckowski, J.; Kizielewicz, B.; Sałabun, W. Towards Reliable Decision-Making in the Green Urban Transport Domain. Facta Univ. Ser. Mech. Eng. 2022, 20, 381–398. [Google Scholar] [CrossRef]
- Cipek, M.; Pavković, D.; Krznar, M.; Kljaić, Z.; Mlinarić, T.J. Comparative analysis of conventional diesel-electric and hypothetical battery-electric heavy haul locomotive operation in terms of fuel savings and emissions reduction potentials. Energy 2021, 232, 121097. [Google Scholar] [CrossRef]
- García, A.; Monsalve-Serrano, J.; Sari, R.L.; Tripathi, S. Life cycle CO₂ footprint reduction comparison of hybrid and electric buses for bus transit networks. Appl. Energy 2022, 308, 118354. [Google Scholar] [CrossRef]
- Elliott, M.; Swan, L.G.; Dubarry, M.; Baure, G. Degradation of electric vehicle lithium-ion batteries in electricity grid services. J. Energy Storage 2020, 32, 101873. [Google Scholar] [CrossRef]
- Vezzini, A. 15—Lithium-Ion Battery Management. In Lithium-Ion Batteries; Pistoia, G., Ed.; Elsevier: Amsterdam, The Netherlands, 2014; pp. 345–360. Available online: https://www.sciencedirect.com/science/article/pii/B9780444595133000157 (accessed on 15 November 2022).
- Wang, Y.; Tian, J.; Sun, Z.; Wang, L.; Xu, R.; Li, M.; Chen, Z. A comprehensive review of battery modeling and state estimation approaches for advanced battery management systems. Renew. Sustain. Energy Rev. 2020, 131, 110015. [Google Scholar] [CrossRef]
- Pattipati, B.; Sankavaram, C.; Pattipati, K. System Identification and Estimation Framework for Pivotal Automotive Battery Management System Characteristics. IEEE Trans. Syst. Man Cybern. Part C Appl. Rev. 2011, 41, 869–884. [Google Scholar] [CrossRef]
- Pillai, P.; Sundaresan, S.; Kumar, P.; Pattipati, K.R.; Balasingam, B. Open-Circuit Voltage Models for Battery Management Systems: A Review. Energies 2022, 15, 6803. [Google Scholar] [CrossRef]
- Komsiyska, L.; Buchberger, T.; Diehl, S.; Ehrensberger, M.; Hanzl, C.; Hartmann, C.; Hölzle, M.; Kleiner, J.; Lewerenz, M.; Liebhart, B.; et al. Critical Review of Intelligent Battery Systems: Challenges, Implementation, and Potential for Electric Vehicles. Energies 2021, 14, 5989. [Google Scholar] [CrossRef]
- Li, Y.; Guo, J.; Pedersen, K.; Gurevich, L.; Stroe, D.-I. Recent Health Diagnosis Methods for Lithium-Ion Batteries. Batteries 2022, 8, 72. [Google Scholar] [CrossRef]
- Chen, W.; Liang, J.; Yang, Z.; Li, G. A Review of Lithium-Ion Battery for Electric Vehicle Applications and Beyond. Energy Procedia 2019, 158, 4363–4368. [Google Scholar] [CrossRef]
- Földesi, P.; Kóczy, L.T.; Szauter, F.; Csikor, D.; Szürke, S.K. Hierarchical Diagnostics and Risk Assessment for Energy Supply in Military Vehicles. Energies 2022, 15, 4791. [Google Scholar] [CrossRef]
- Wang, Z.; Hong, J.; Liu, P.; Zhang, L. Voltage fault diagnosis and prognosis of battery systems based on entropy and Z -score for electric vehicles. Appl. Energy 2017, 196, 289–302. [Google Scholar] [CrossRef]
- Tran, M.-K.; Fowler, M. A Review of Lithium-Ion Battery Fault Diagnostic Algorithms: Current Progress and Future Challenges. Algorithms 2020, 13, 62. [Google Scholar] [CrossRef]
- Fotouhi, A.; Auger, D.J.; Propp, K.; Longo, S.; Wild, M. A review on electric vehicle battery modelling: From Lithium-ion toward Lithium–Sulphur. Renew. Sustain. Energy Rev. 2016, 56, 1008–1021. [Google Scholar] [CrossRef]
- Wu, Y.; Saxena, S.; Xing, Y.; Wang, Y.; Li, C.; Yung, W.K.C.; Pecht, M. Analysis of Manufacturing-Induced Defects and Structural Deformations in Lithium-Ion Batteries Using Computed Tomography. Energies 2018, 11, 925. [Google Scholar] [CrossRef]
- Szalai, S.; Szürke, S.K.; Harangozó, D.; Fischer, S. Investigation of deformations of a lithium polymer cell using the Digital Image Correlation Method (DICM). Rep. Mech. Eng. 2022, 3, 206–224. [Google Scholar] [CrossRef]
- Rieger, B.; Schlueter, S.; Erhard, S.; Schmalz, J.; Reinhart, G.; Jossen, A. Multi-scale investigation of thickness changes in a commercial pouch type lithium-ion battery. J. Energy Storage 2016, 6, 213–221. [Google Scholar] [CrossRef]
- Li, X.; Wang, Z. A novel fault diagnosis method for lithium-Ion battery packs of electric vehicles. Measurement 2018, 116, 402–411. [Google Scholar] [CrossRef]
- Liu, Z.; Zhang, Z.; Li, D.; Liu, P.; Wang, Z. Battery Fault Prognosis for Electric Vehicles Based on AOM-ARIMA-LSTM in Real Time. In Proceedings of the 2022 5th International Conference on Energy, Electrical and Power Engineering (CEEPE), Chongqing, China, 22–24 April 2022; pp. 476–483. [Google Scholar] [CrossRef]
- Lin, T.; Chen, Z.; Zhou, S. Voltage-correlation based multi-fault diagnosis of lithium-ion battery packs considering inconsistency. J. Clean. Prod. 2022, 336, 130358. [Google Scholar] [CrossRef]
- Fang, W.; Chen, H.; Zhou, F. Fault diagnosis for cell voltage inconsistency of a battery pack in electric vehicles based on real-world driving data. Comput. Electr. Eng. 2022, 102, 108095. [Google Scholar] [CrossRef]
- Xue, Q.; Li, G.; Zhang, Y.; Shen, S.; Chen, Z.; Liu, Y. Fault diagnosis and abnormality detection of lithium-ion battery packs based on statistical distribution. J. Power Sources 2020, 482, 228964. [Google Scholar] [CrossRef]
- Fang, W.; Jiang, Y.; Lv, H. Implementation of Power Battery Voltage Fault Diagnosis System Based on Improved Shannon Entropy Algorithm. In Proceedings of the 2021 IEEE International Conference on Networking, Sensing and Control (ICNSC), Xiamen, China, 3–5 December 2021; Volume 1, pp. 1–6. [Google Scholar] [CrossRef]
- Freedom, C.A.R. Battery Test Manual for Power-Assist Hybrid Electric Vehicles; INEEL: Cuernavaca, Mexico, 2003. [Google Scholar]
- Castillo, E.C. Standards for electric vehicle batteries and associated testing procedures. In Advances in Battery Technologies for Electric Vehicles; Woodhead: Sawston, UK, 2015; pp. 469–494. [Google Scholar] [CrossRef]
- Ruiz, V.; Pfrang, A.; Kriston, A.; Omar, N.; Van Den Bossche, P.; Boon-Brett, L. A review of international abuse testing standards and regulations for lithium ion batteries in electric and hybrid electric vehicles. Renew. Sustain. Energy Rev. 2018, 81, 1427–1452. [Google Scholar] [CrossRef]
- Liu, X.; Zhao, F.; Hao, H.; Chen, K.; Liu, Z. From NEDC to WLTP: Effect on the Energy Consumption, NEV Credits, and Subsidies Policies of PHEV in the Chinese Market. Sustainability 2020, 12, 5747. [Google Scholar] [CrossRef]
- Barré, A.; Suard, F.; Gérard, M.; Montaru, M.; Riu, D. Statistical analysis for understanding and predicting battery degradations in real-life electric vehicle use. J. Power Sources 2014, 245, 846–856. [Google Scholar] [CrossRef]
- Zhao, Y.; Liu, P.; Wang, Z.; Hong, J. Electric Vehicle Battery Fault Diagnosis Based on Statistical Method. Energy Procedia 2017, 105, 2366–2371. [Google Scholar] [CrossRef]
- Zhao, Y.; Liu, P.; Wang, Z.; Zhang, L.; Hong, J. Fault and defect diagnosis of battery for electric vehicles based on big data analysis methods. Appl. Energy 2017, 207, 354–362. [Google Scholar] [CrossRef]
- Merkle, L.; Pöthig, M.; Schmid, F. Estimate e-Golf Battery State Using Diagnostic Data and a Digital Twin. Batteries 2021, 7, 15. Available online: https://www.researchgate.net/publication/348415206_Estimate_e-Golf_Battery_State_Using_Diagnostic_Data_and_a_Digital_Twin (accessed on 15 November 2022). [CrossRef]
- Llerandi, J.D.L.P.; de Mingo, C.S.; Ibáñez, J.C. Continuous Battery Health Diagnosis by On-Line Internal Resistance Measuring. Energies 2019, 12, 2836. [Google Scholar] [CrossRef]
- Cao, H.; Zöldy, M. An Investigation of Autonomous Vehicle Roundabout Situation. Period. Polytech. Transp. Eng. 2019, 48, 236–241. [Google Scholar] [CrossRef]
- Gangel, K.; Hamar, Z.; Háry, A.; Horváth, Á.; Jandó, G.; Könyves, B.; Panker, D.; Pintér, K.; Pataki, M.; Szalai, M.; et al. Modelling the ZalaZONE Proving Ground: A benchmark of State-of-the-art Automotive Simulators PreScan, IPG CarMaker, and VTD Vires. Acta Tech. Jaurinensis 2021, 14, 488–507. [Google Scholar] [CrossRef]


| Cycle #1 | Cycle #2 | Cycle #3 | Cycle #4 | Cycle #5 | Cycle #6 | Cycle #7 | Cycle #8 |
|---|---|---|---|---|---|---|---|
| voltage | voltage | voltage | voltage | voltage | voltage | voltage | voltage |
| current | current | current | current | current | current | current | current |
| 1 | 2 | 3 | 4 | 5 | 6 | 7 | 8 |
| 9 | 10 | 11 | 12 | 13 | 14 | 15 | 16 |
| 17 | 18 | 19 | 20 | 21 | 22 | 23 | 24 |
| 25 | 26 | 27 | 28 | 29 | 30 | 31 | 32 |
| 33 | 34 | 35 | 36 | 37 | 38 | 39 | 40 |
| 41 | 42 | 43 | 44 | 45 | 46 | 47 | 48 |
| 49 | 50 | 51 | 52 | 53 | 54 | 55 | 56 |
| 57 | 58 | 59 | 60 | 61 | 62 | 63 | 64 |
| 65 | 66 | 67 | 68 | 69 | 70 | 71 | 72 |
| 73 | 74 | 75 | 76 | 77 | 78 | 79 | 80 |
| 81 | 82 | 83 | 84 | 85 | 86 | 87 | 88 |
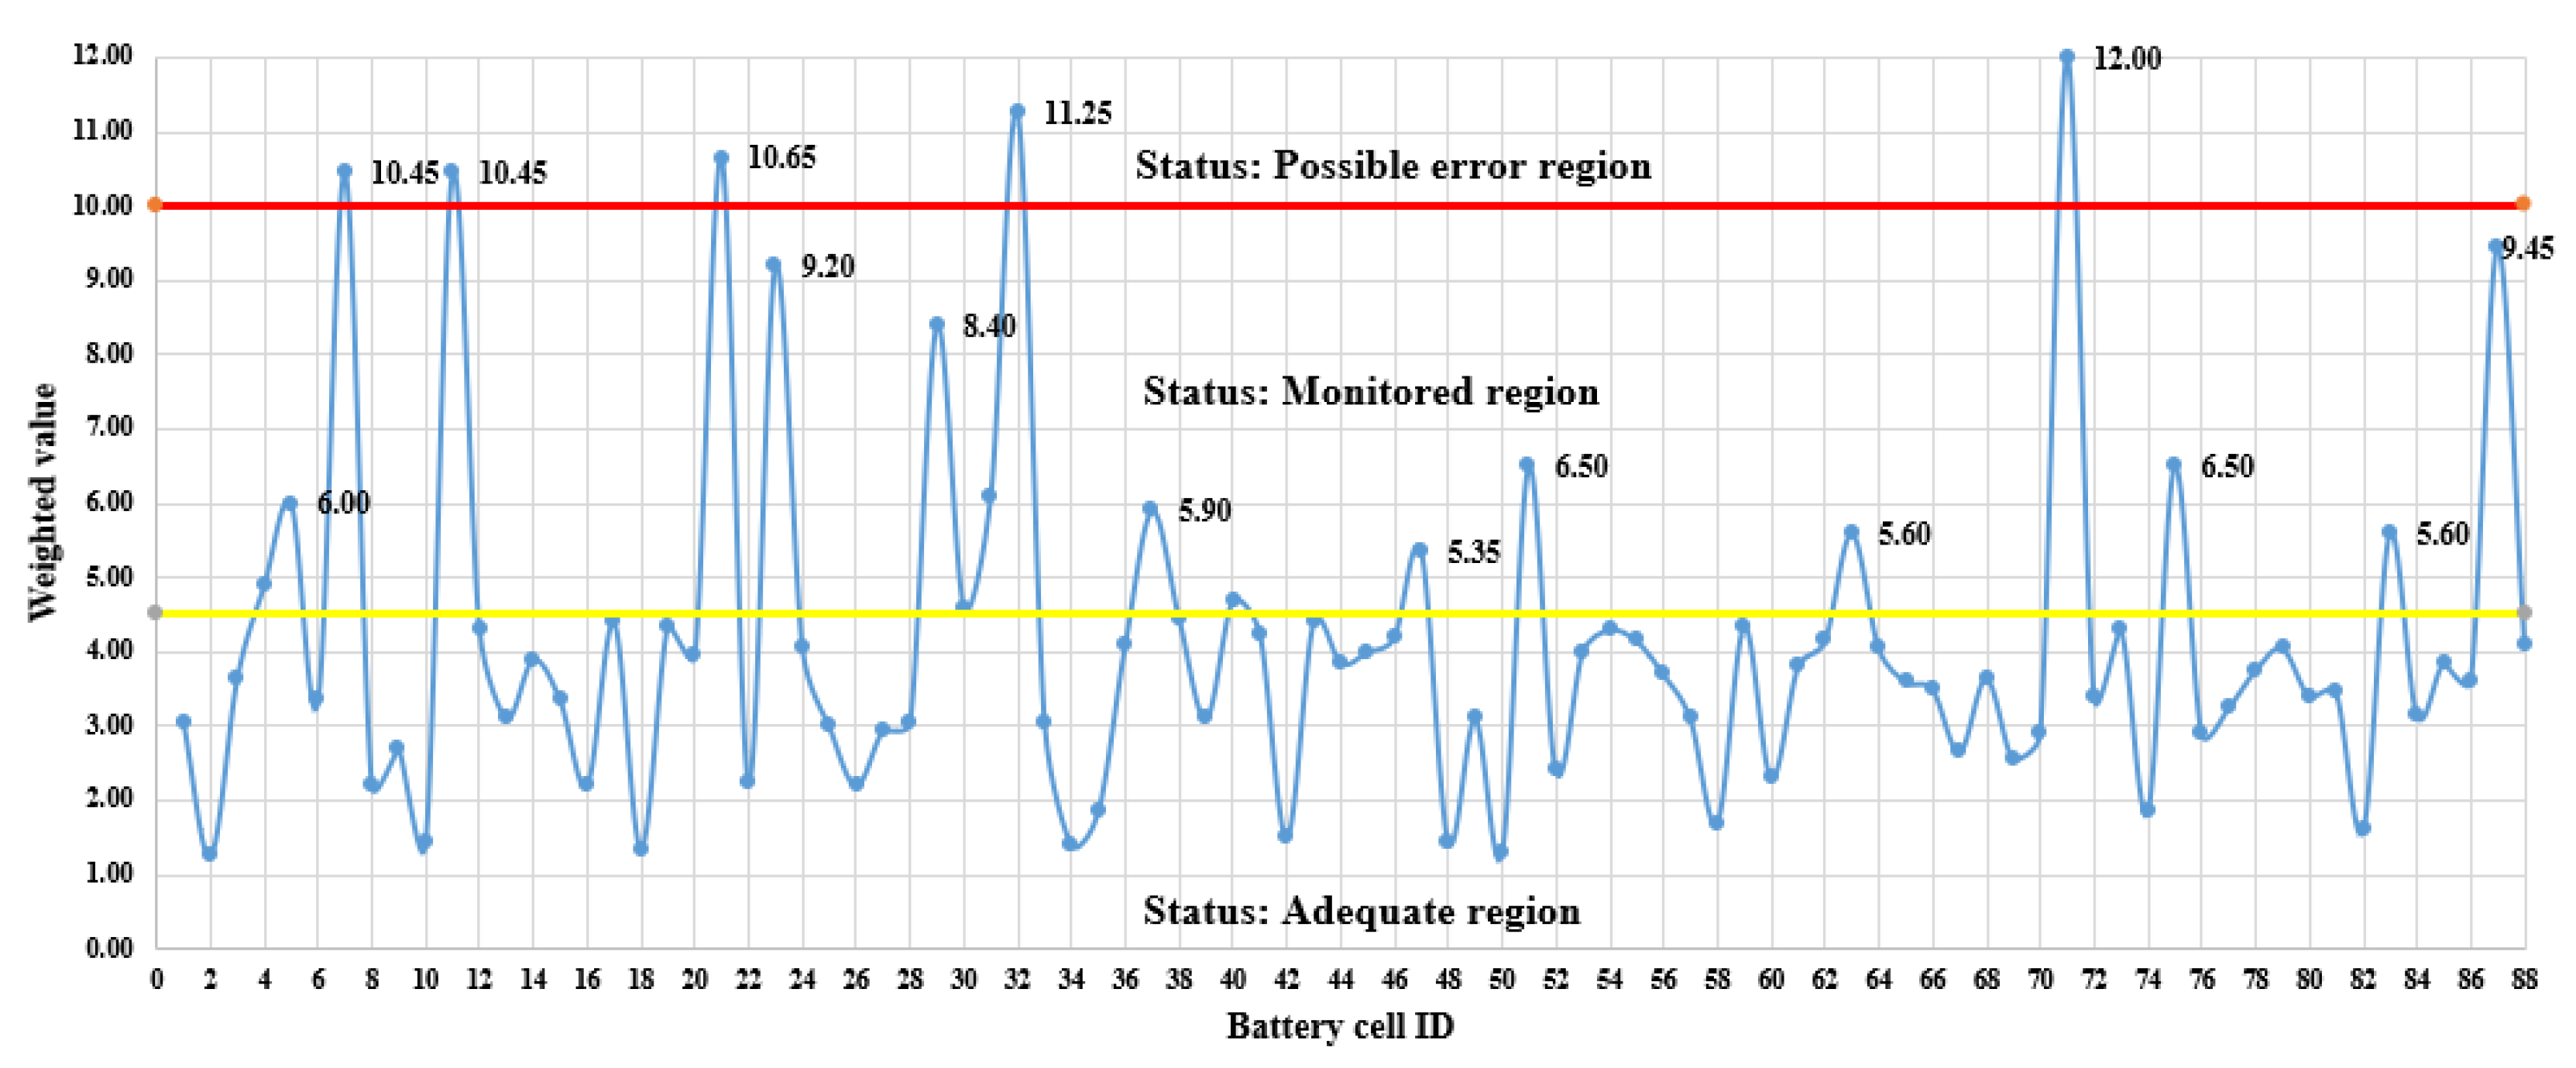
| Cell_ID | Measurement | Measurement_AVR | Validation Test |
|---|---|---|---|
| 4 | 27.60 | 12.45 | 4.90 |
| 5 | 48.79 | 3.54 | 6.00 |
| 7 | 60.07 | 12.72 | 10.45 |
| 11 | 62.37 | 44.90 | 10.45 |
| 21 | 62.43 | 57.66 | 10.65 |
| 23 | 56.73 | 6.72 | 9.20 |
| 29 | 62.34 | 7.44 | 8.40 |
| 32 | 59.84 | 11.27 | 11.25 |
| 37 | 48.87 | 17.59 | 5.90 |
| 40 | 31.70 | 18.54 | 4.70 |
| 47 | 36.95 | 36.41 | 5.35 |
| 63 | 47.65 | 19.88 | 5.60 |
| 71 | 74.57 | 11.20 | 12.00 |
| 75 | 47.30 | 27.31 | 6.50 |
| 83 | 46.92 | 59.33 | 5.60 |
| 87 | 64.20 | 40.85 | 9.45 |
Publisher’s Note: MDPI stays neutral with regard to jurisdictional claims in published maps and institutional affiliations. |
© 2022 by the authors. Licensee MDPI, Basel, Switzerland. This article is an open access article distributed under the terms and conditions of the Creative Commons Attribution (CC BY) license (https://creativecommons.org/licenses/by/4.0/).
Share and Cite
Kocsis Szürke, S.; Sütheö, G.; Apagyi, A.; Lakatos, I.; Fischer, S. Cell Fault Identification and Localization Procedure for Lithium-Ion Battery System of Electric Vehicles Based on Real Measurement Data. Algorithms 2022, 15, 467. https://doi.org/10.3390/a15120467
Kocsis Szürke S, Sütheö G, Apagyi A, Lakatos I, Fischer S. Cell Fault Identification and Localization Procedure for Lithium-Ion Battery System of Electric Vehicles Based on Real Measurement Data. Algorithms. 2022; 15(12):467. https://doi.org/10.3390/a15120467
Chicago/Turabian StyleKocsis Szürke, Szabolcs, Gergő Sütheö, Antal Apagyi, István Lakatos, and Szabolcs Fischer. 2022. "Cell Fault Identification and Localization Procedure for Lithium-Ion Battery System of Electric Vehicles Based on Real Measurement Data" Algorithms 15, no. 12: 467. https://doi.org/10.3390/a15120467
APA StyleKocsis Szürke, S., Sütheö, G., Apagyi, A., Lakatos, I., & Fischer, S. (2022). Cell Fault Identification and Localization Procedure for Lithium-Ion Battery System of Electric Vehicles Based on Real Measurement Data. Algorithms, 15(12), 467. https://doi.org/10.3390/a15120467