Author Contributions
Conceptualization, A.N.; methodology, A.N.; software and coding, M.A.S. and A.N.; validation, A.N. and M.A.S.; formal analysis, M.A.S. and A.N.; model and algorithm design, M.A.S. and A.N.; investigation, A.N.; resources, A.N.; data curation, A.N.; writing—original draft preparation, M.A.S. and A.N.; writing—review and editing, A.N. and M.A.S.; visualization, M.A.S. and A.N.; supervision, A.N. and T.S.D.; project administration, A.N. and T.S.D. All authors have read and agreed to the published version of the manuscript.
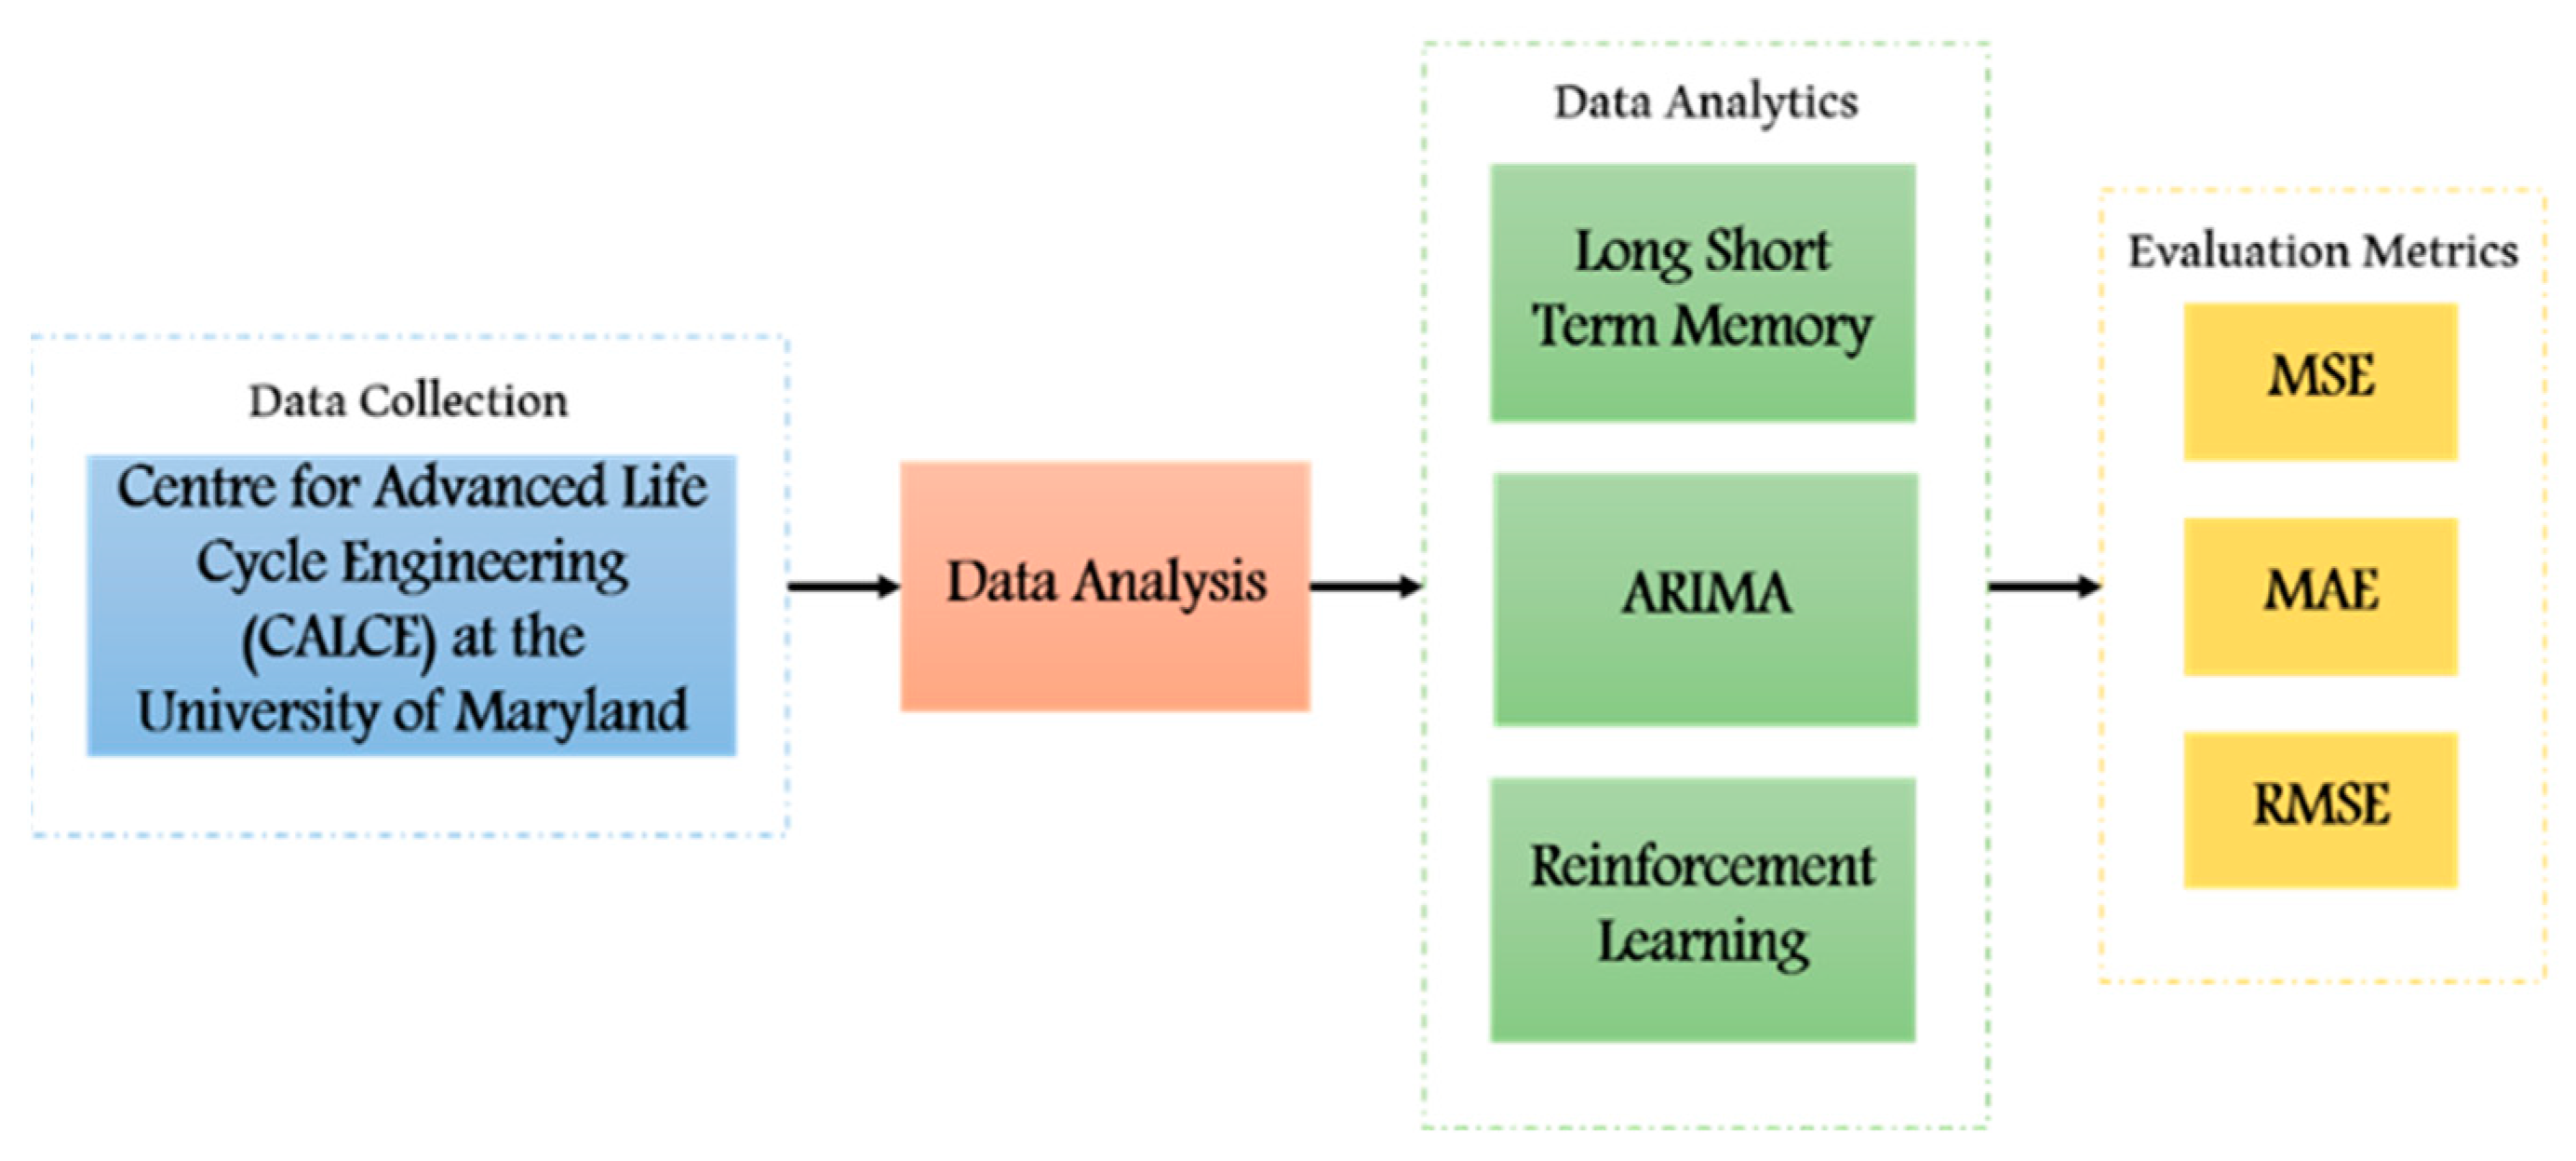
Figure 1.
Prediction system for the lithium-ion batteries.
Figure 1.
Prediction system for the lithium-ion batteries.
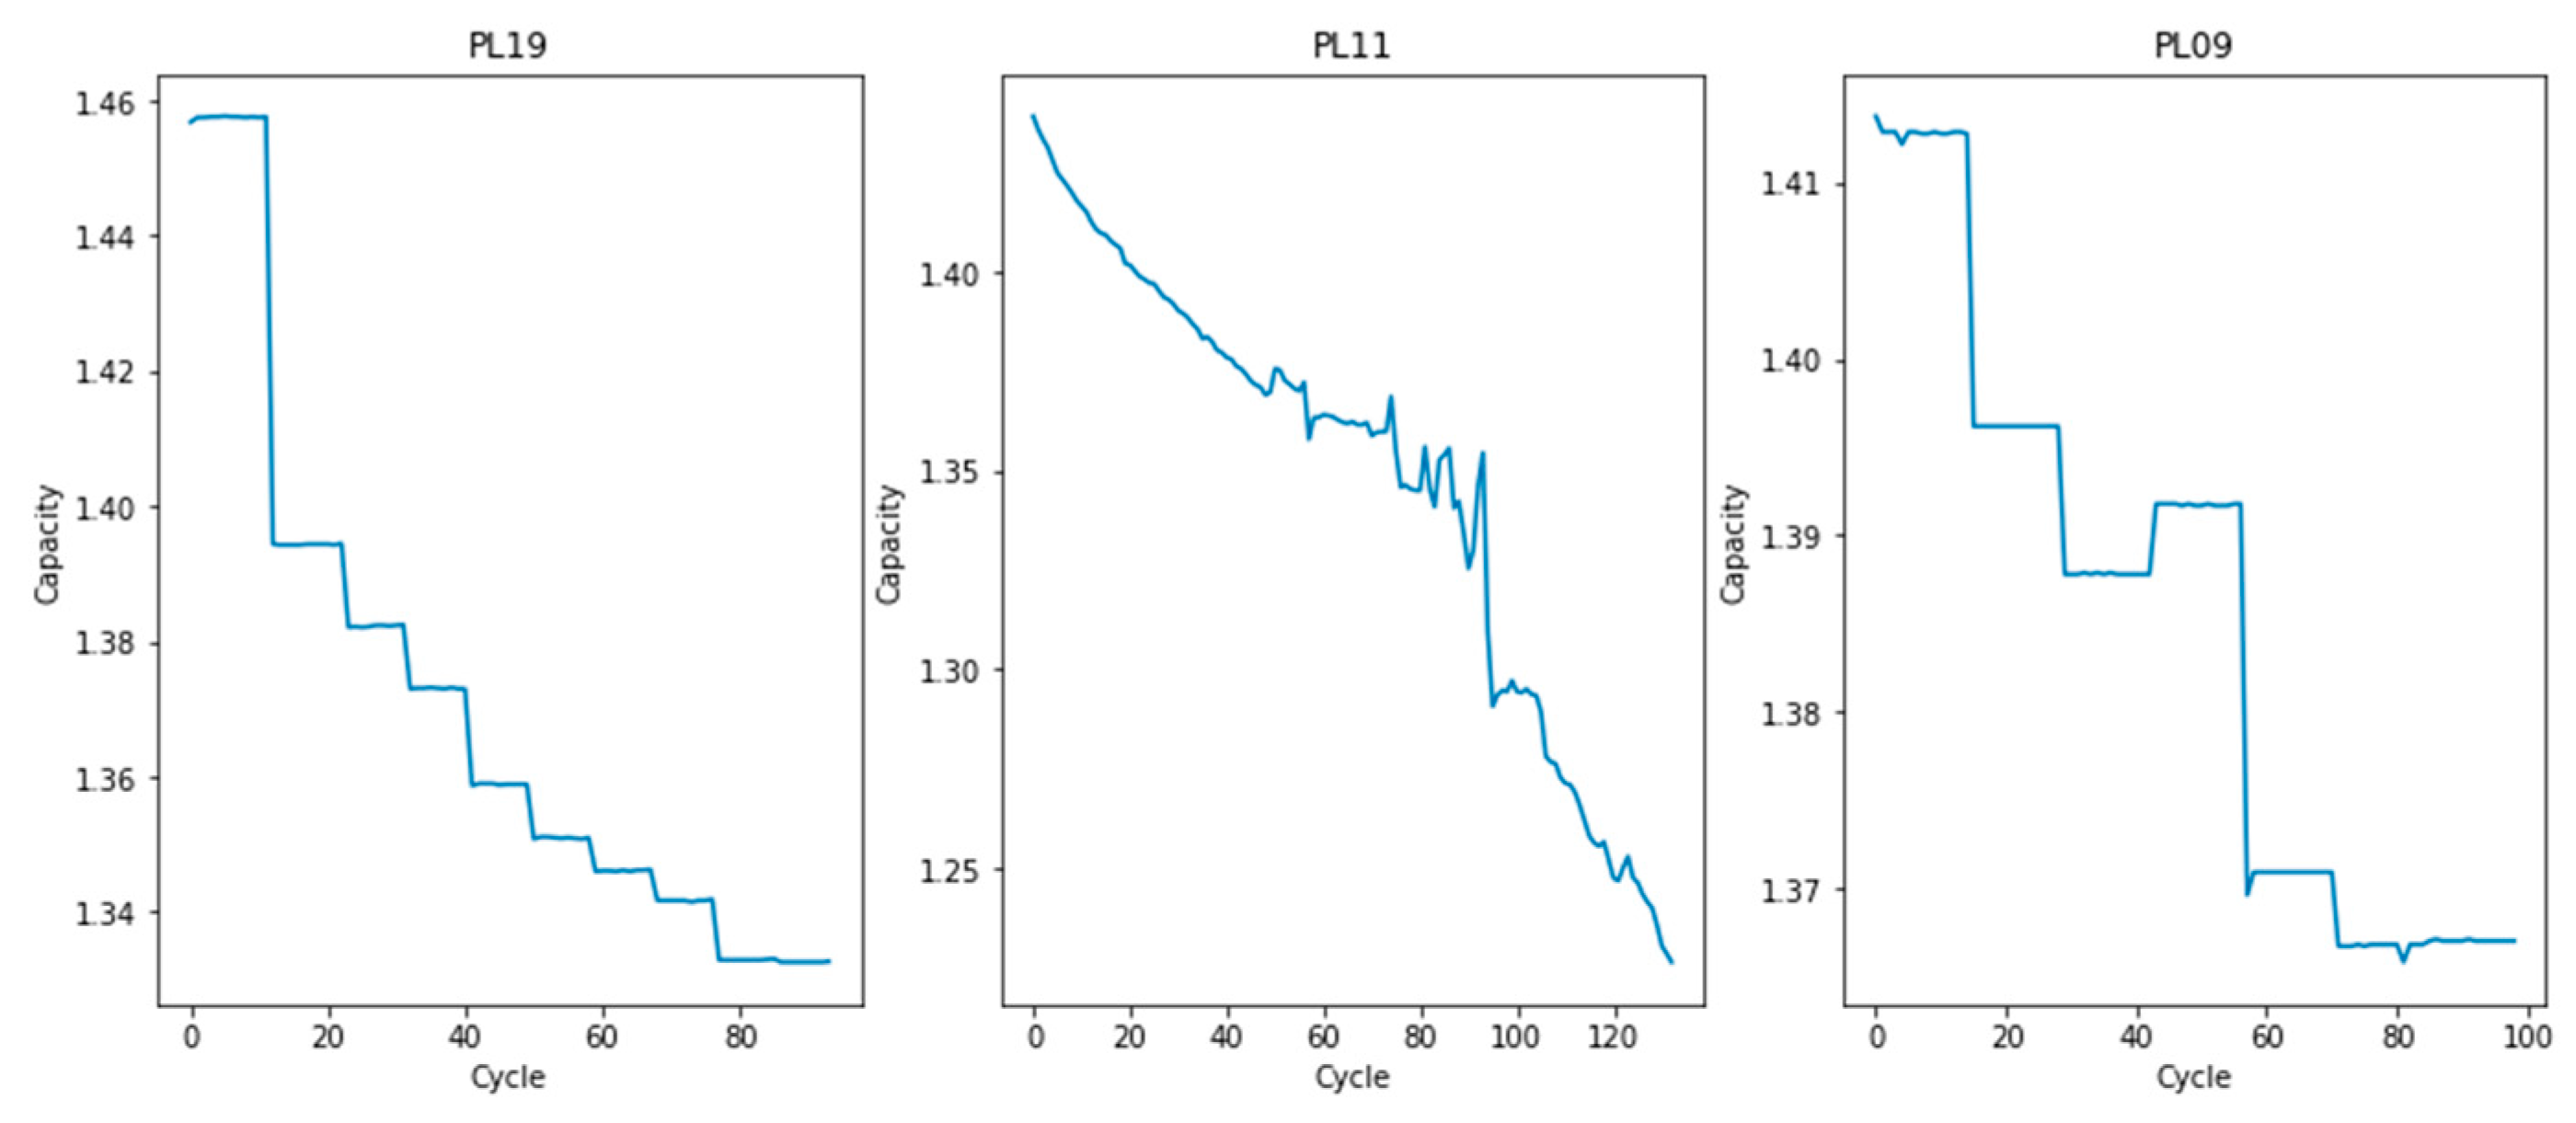
Figure 2.
Capacity vs. Cycle for PL11, PL19, and PL09.
Figure 2.
Capacity vs. Cycle for PL11, PL19, and PL09.
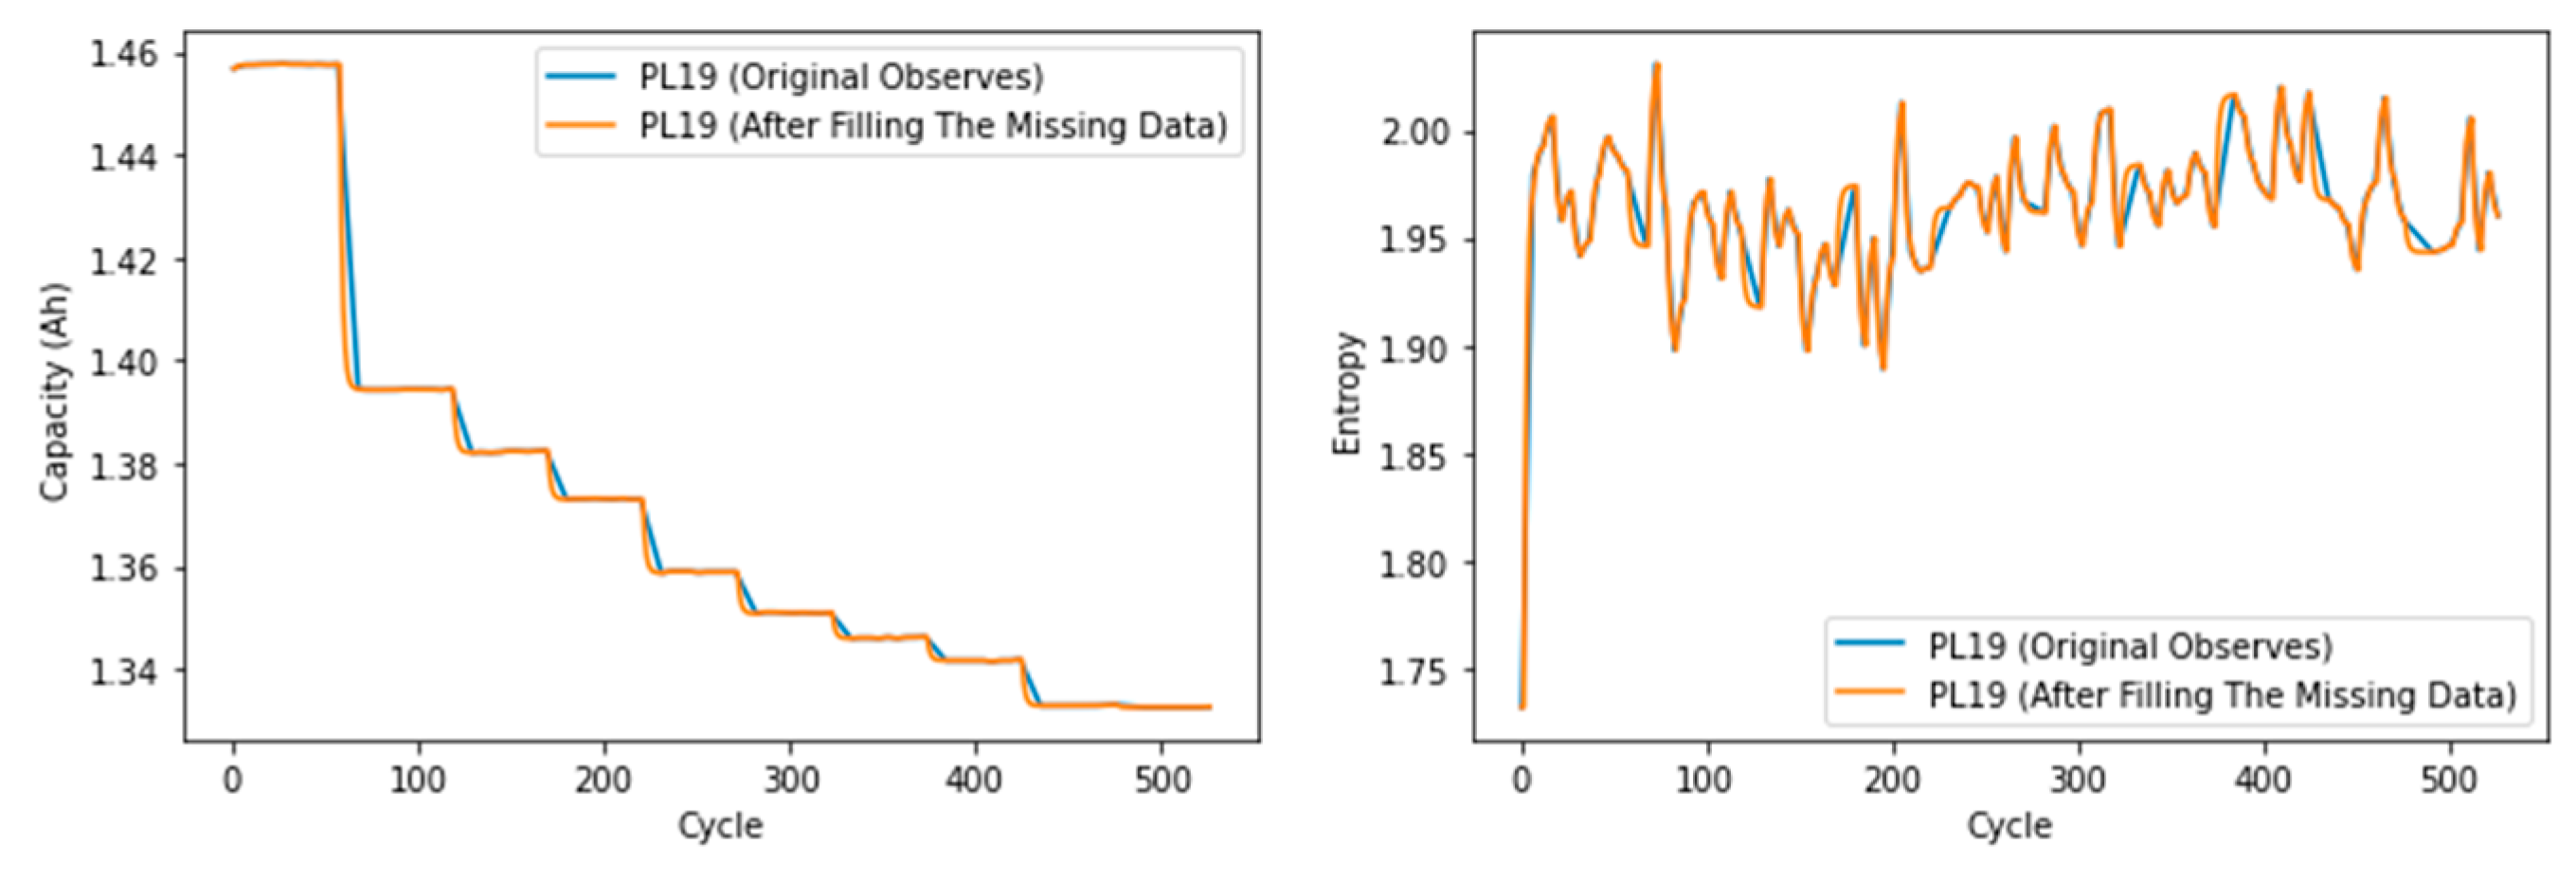
Figure 3.
Capacity vs. Cycle (left) and Entropy vs. Cycle (right) for PL19.
Figure 3.
Capacity vs. Cycle (left) and Entropy vs. Cycle (right) for PL19.
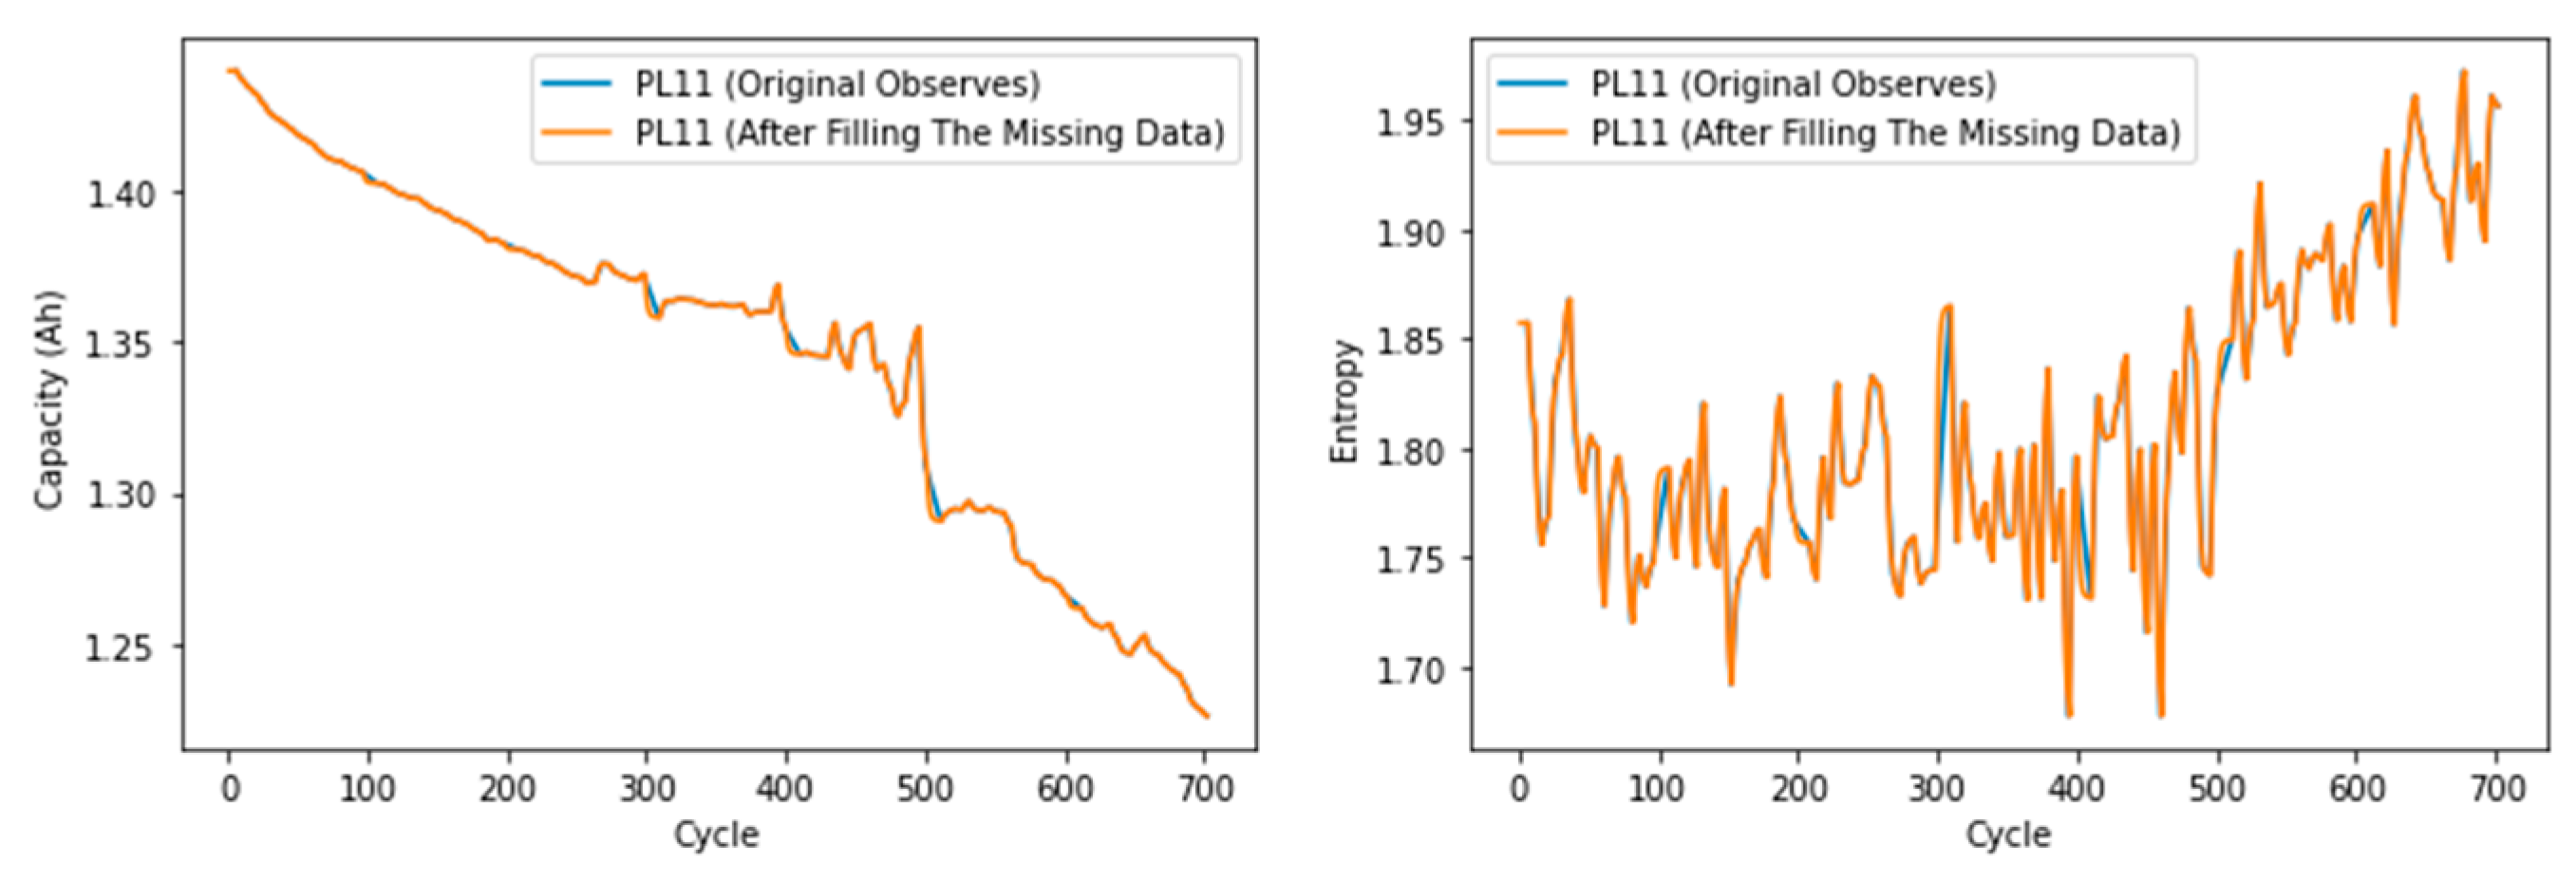
Figure 4.
Capacity vs. Cycle (left) and Entropy vs. Cycle (right) for PL11.
Figure 4.
Capacity vs. Cycle (left) and Entropy vs. Cycle (right) for PL11.
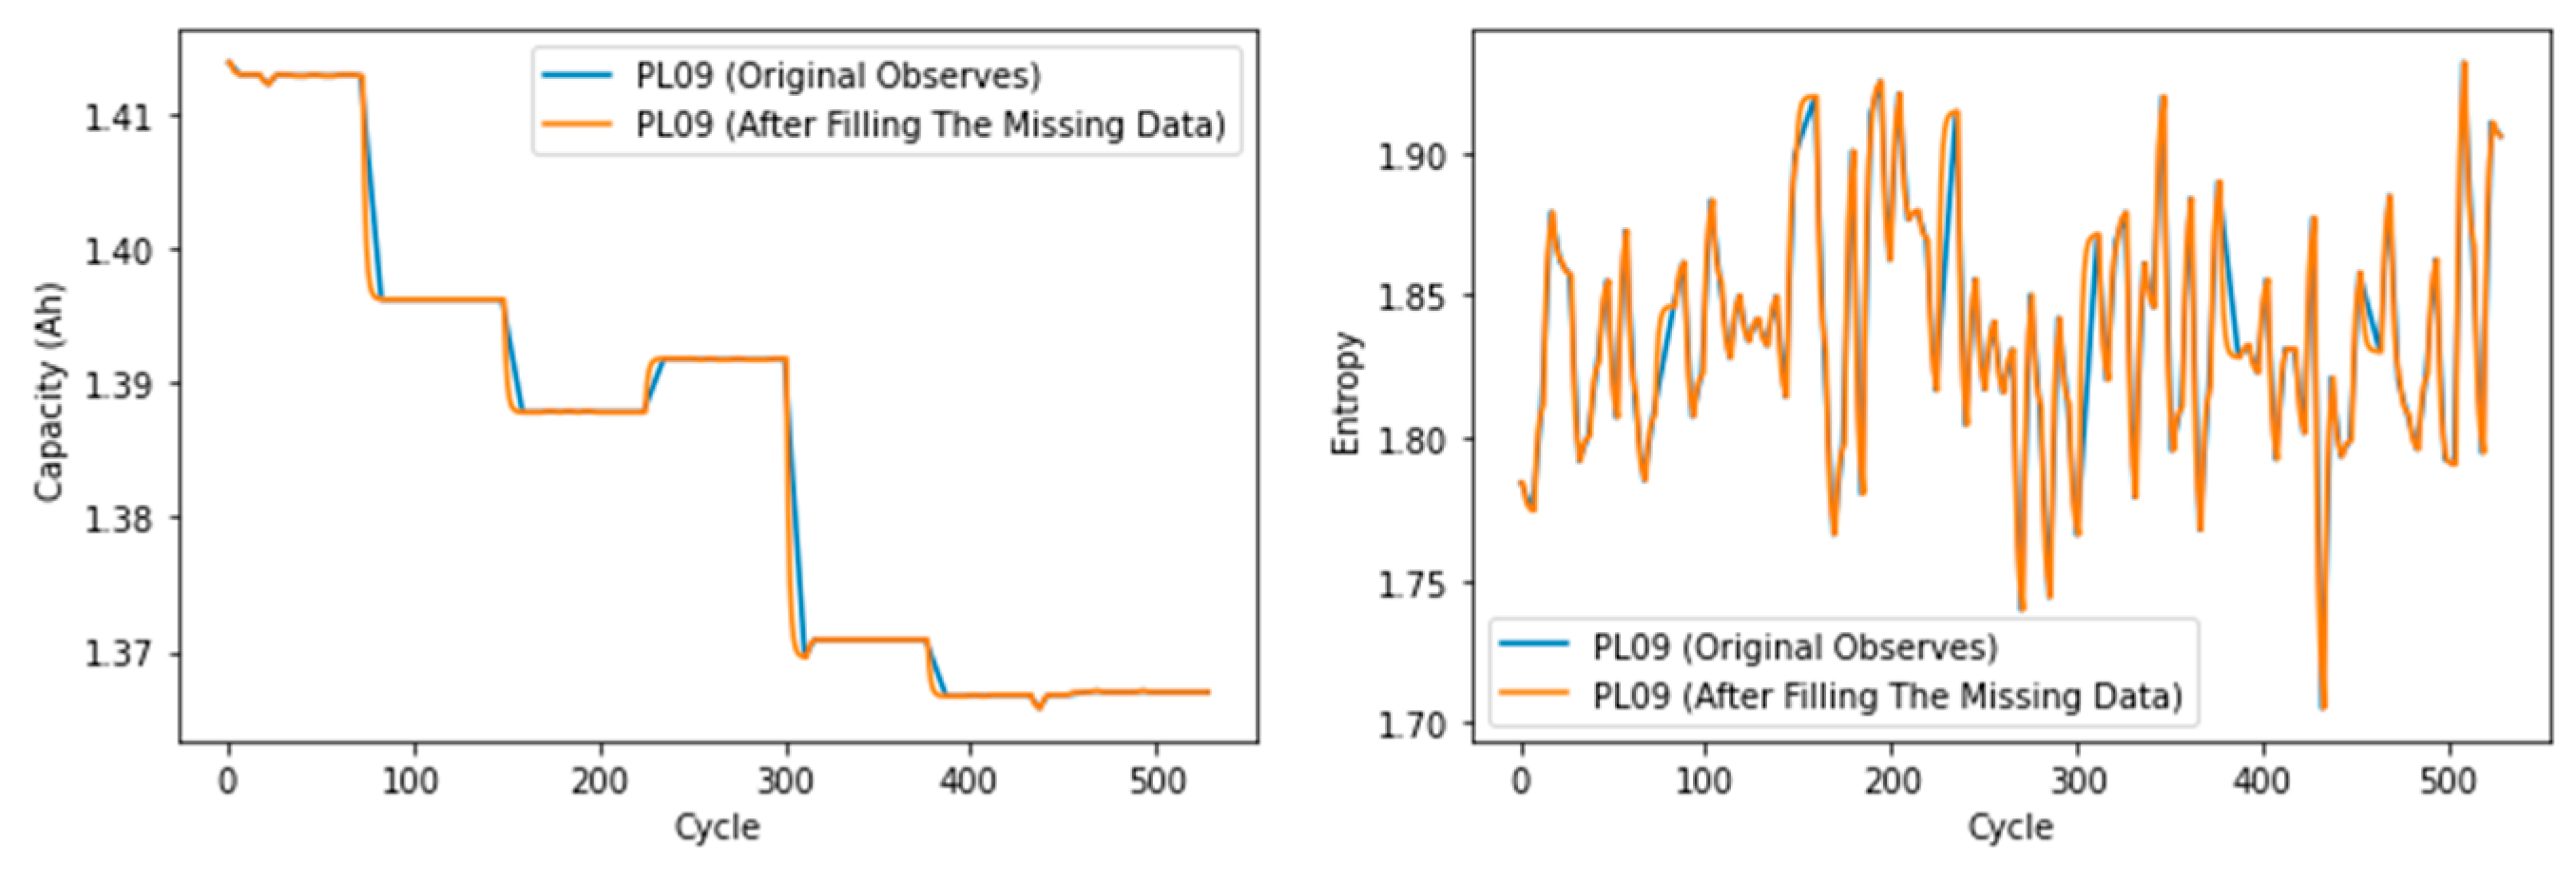
Figure 5.
Capacity vs. Cycle (left) and Entropy vs. Cycle (right) for PL09.
Figure 5.
Capacity vs. Cycle (left) and Entropy vs. Cycle (right) for PL09.
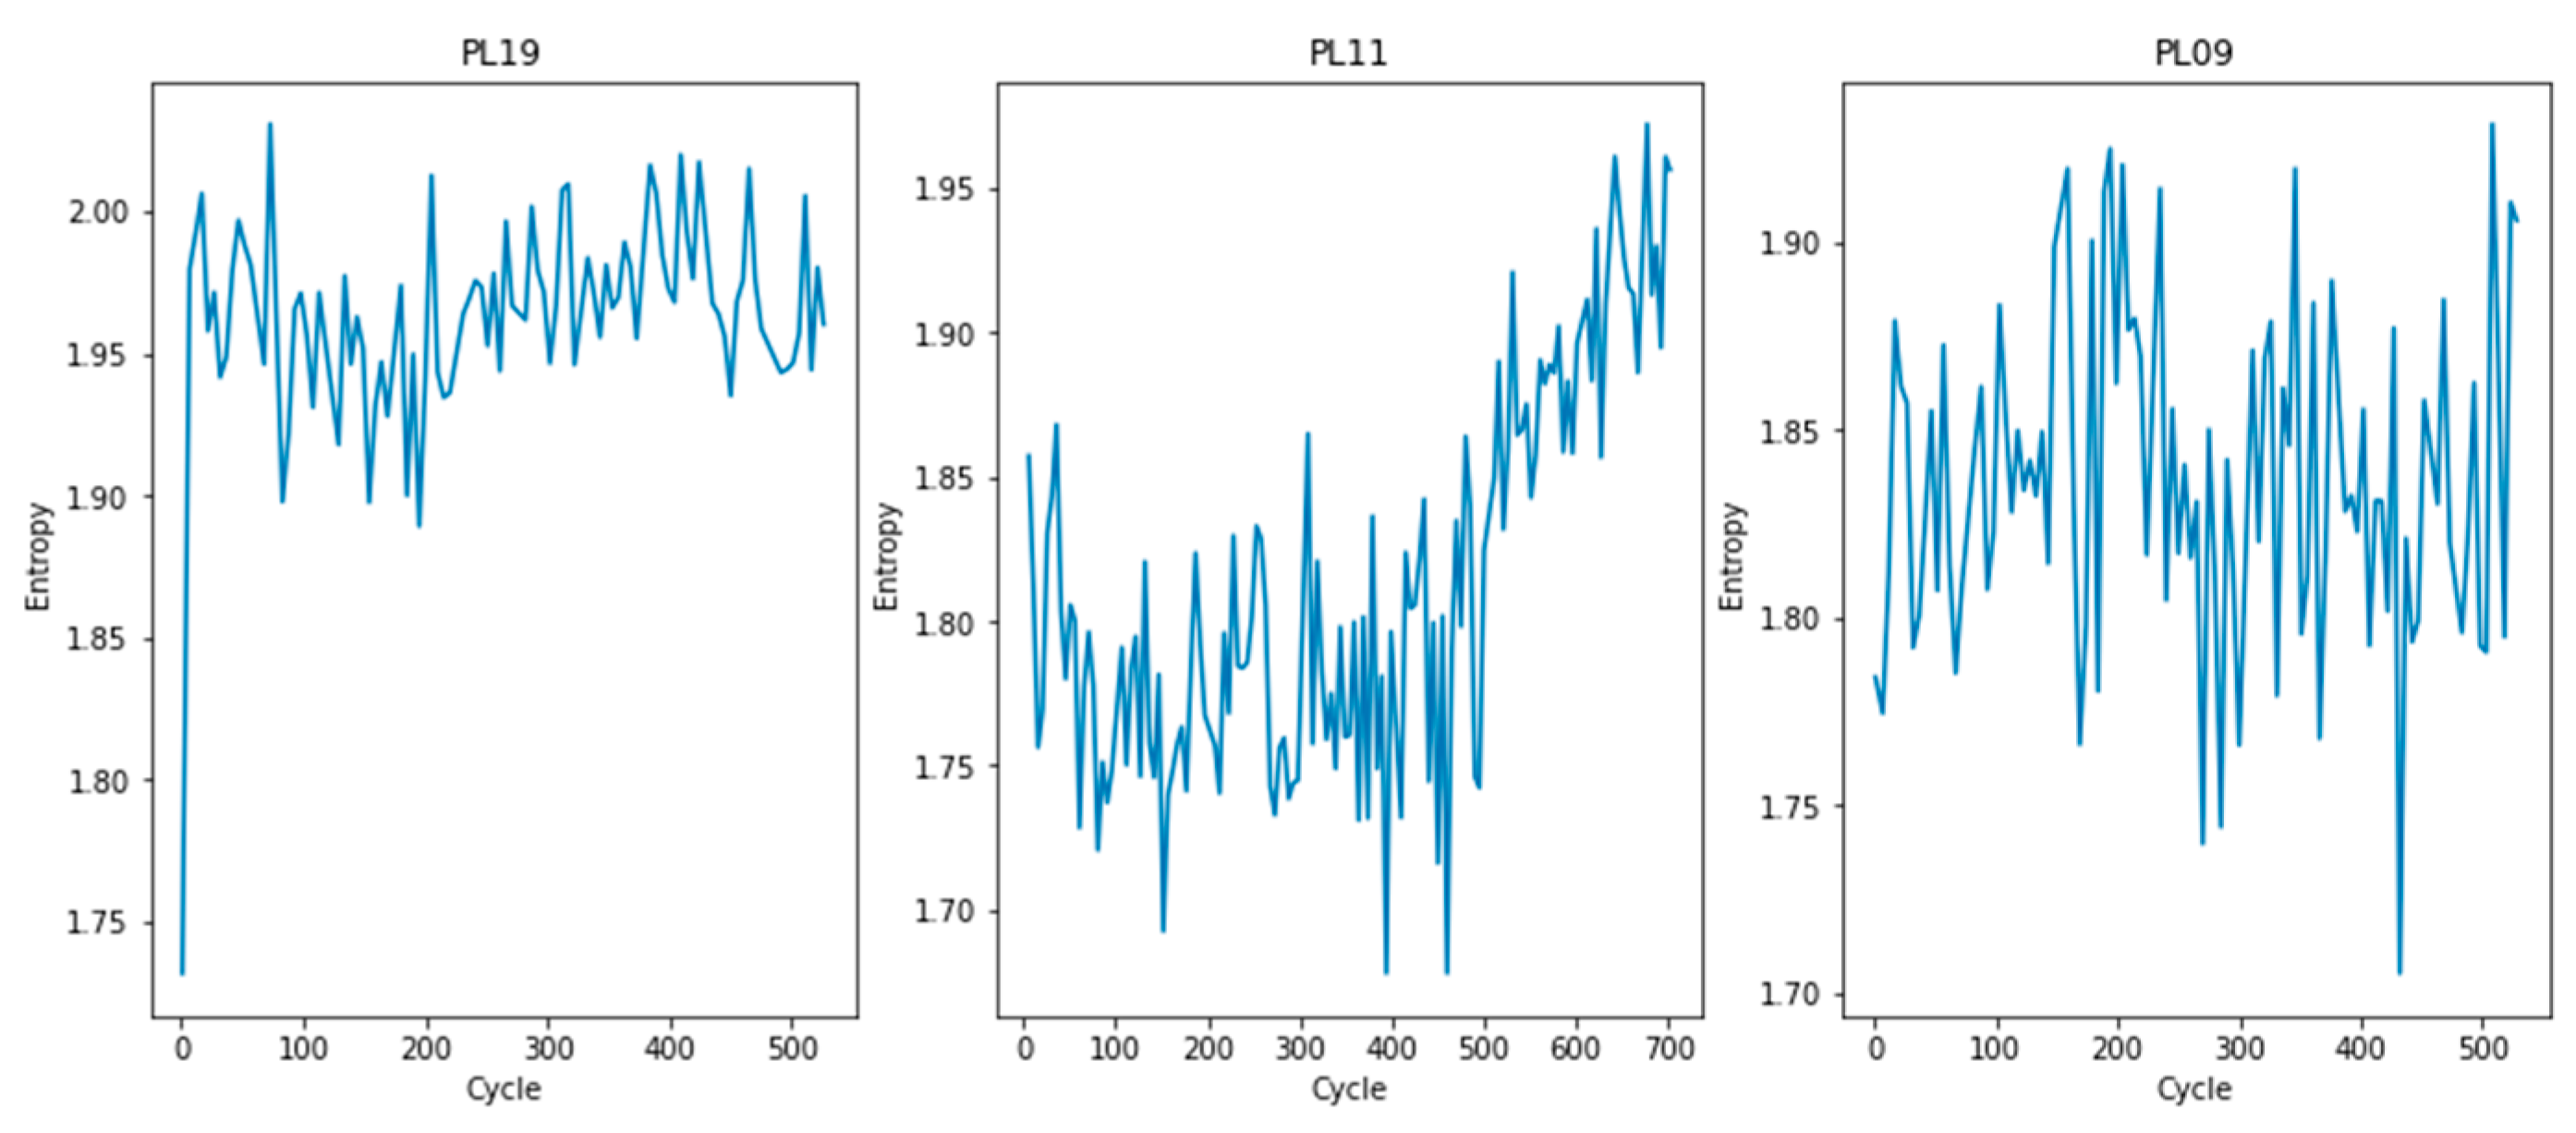
Figure 6.
Entropy vs. Cycles for PL11, PL19, and PL09.
Figure 6.
Entropy vs. Cycles for PL11, PL19, and PL09.
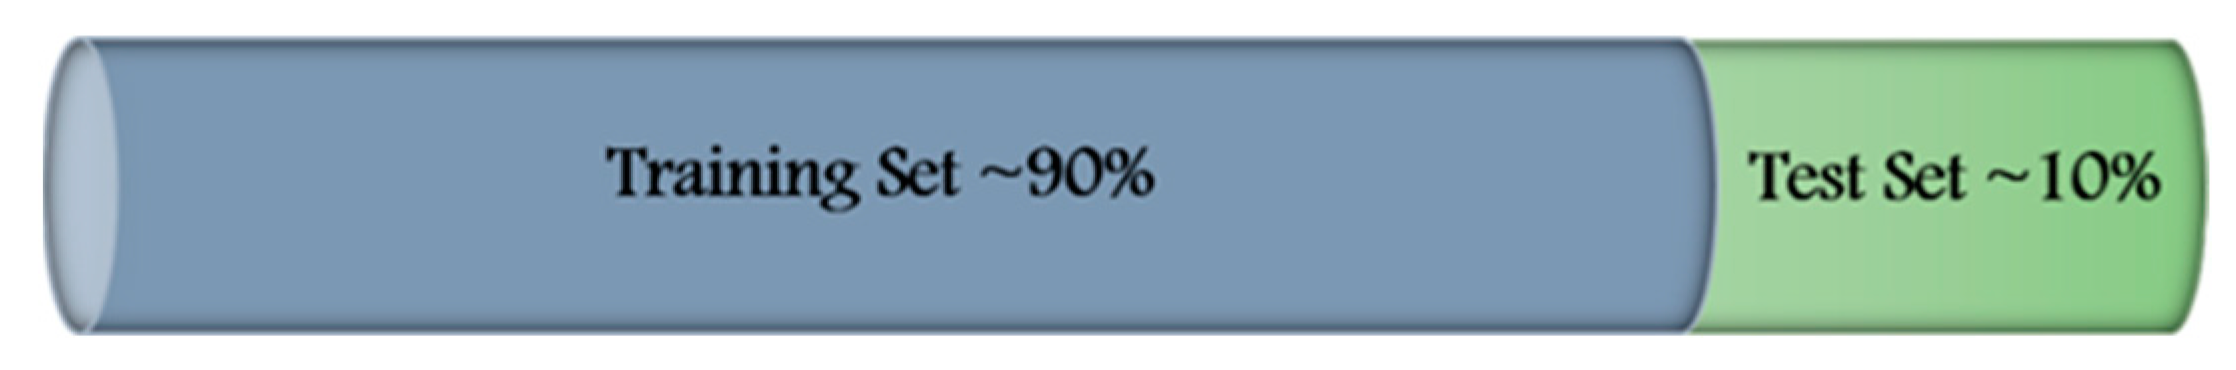
Figure 7.
Train–Test split schematic.
Figure 7.
Train–Test split schematic.
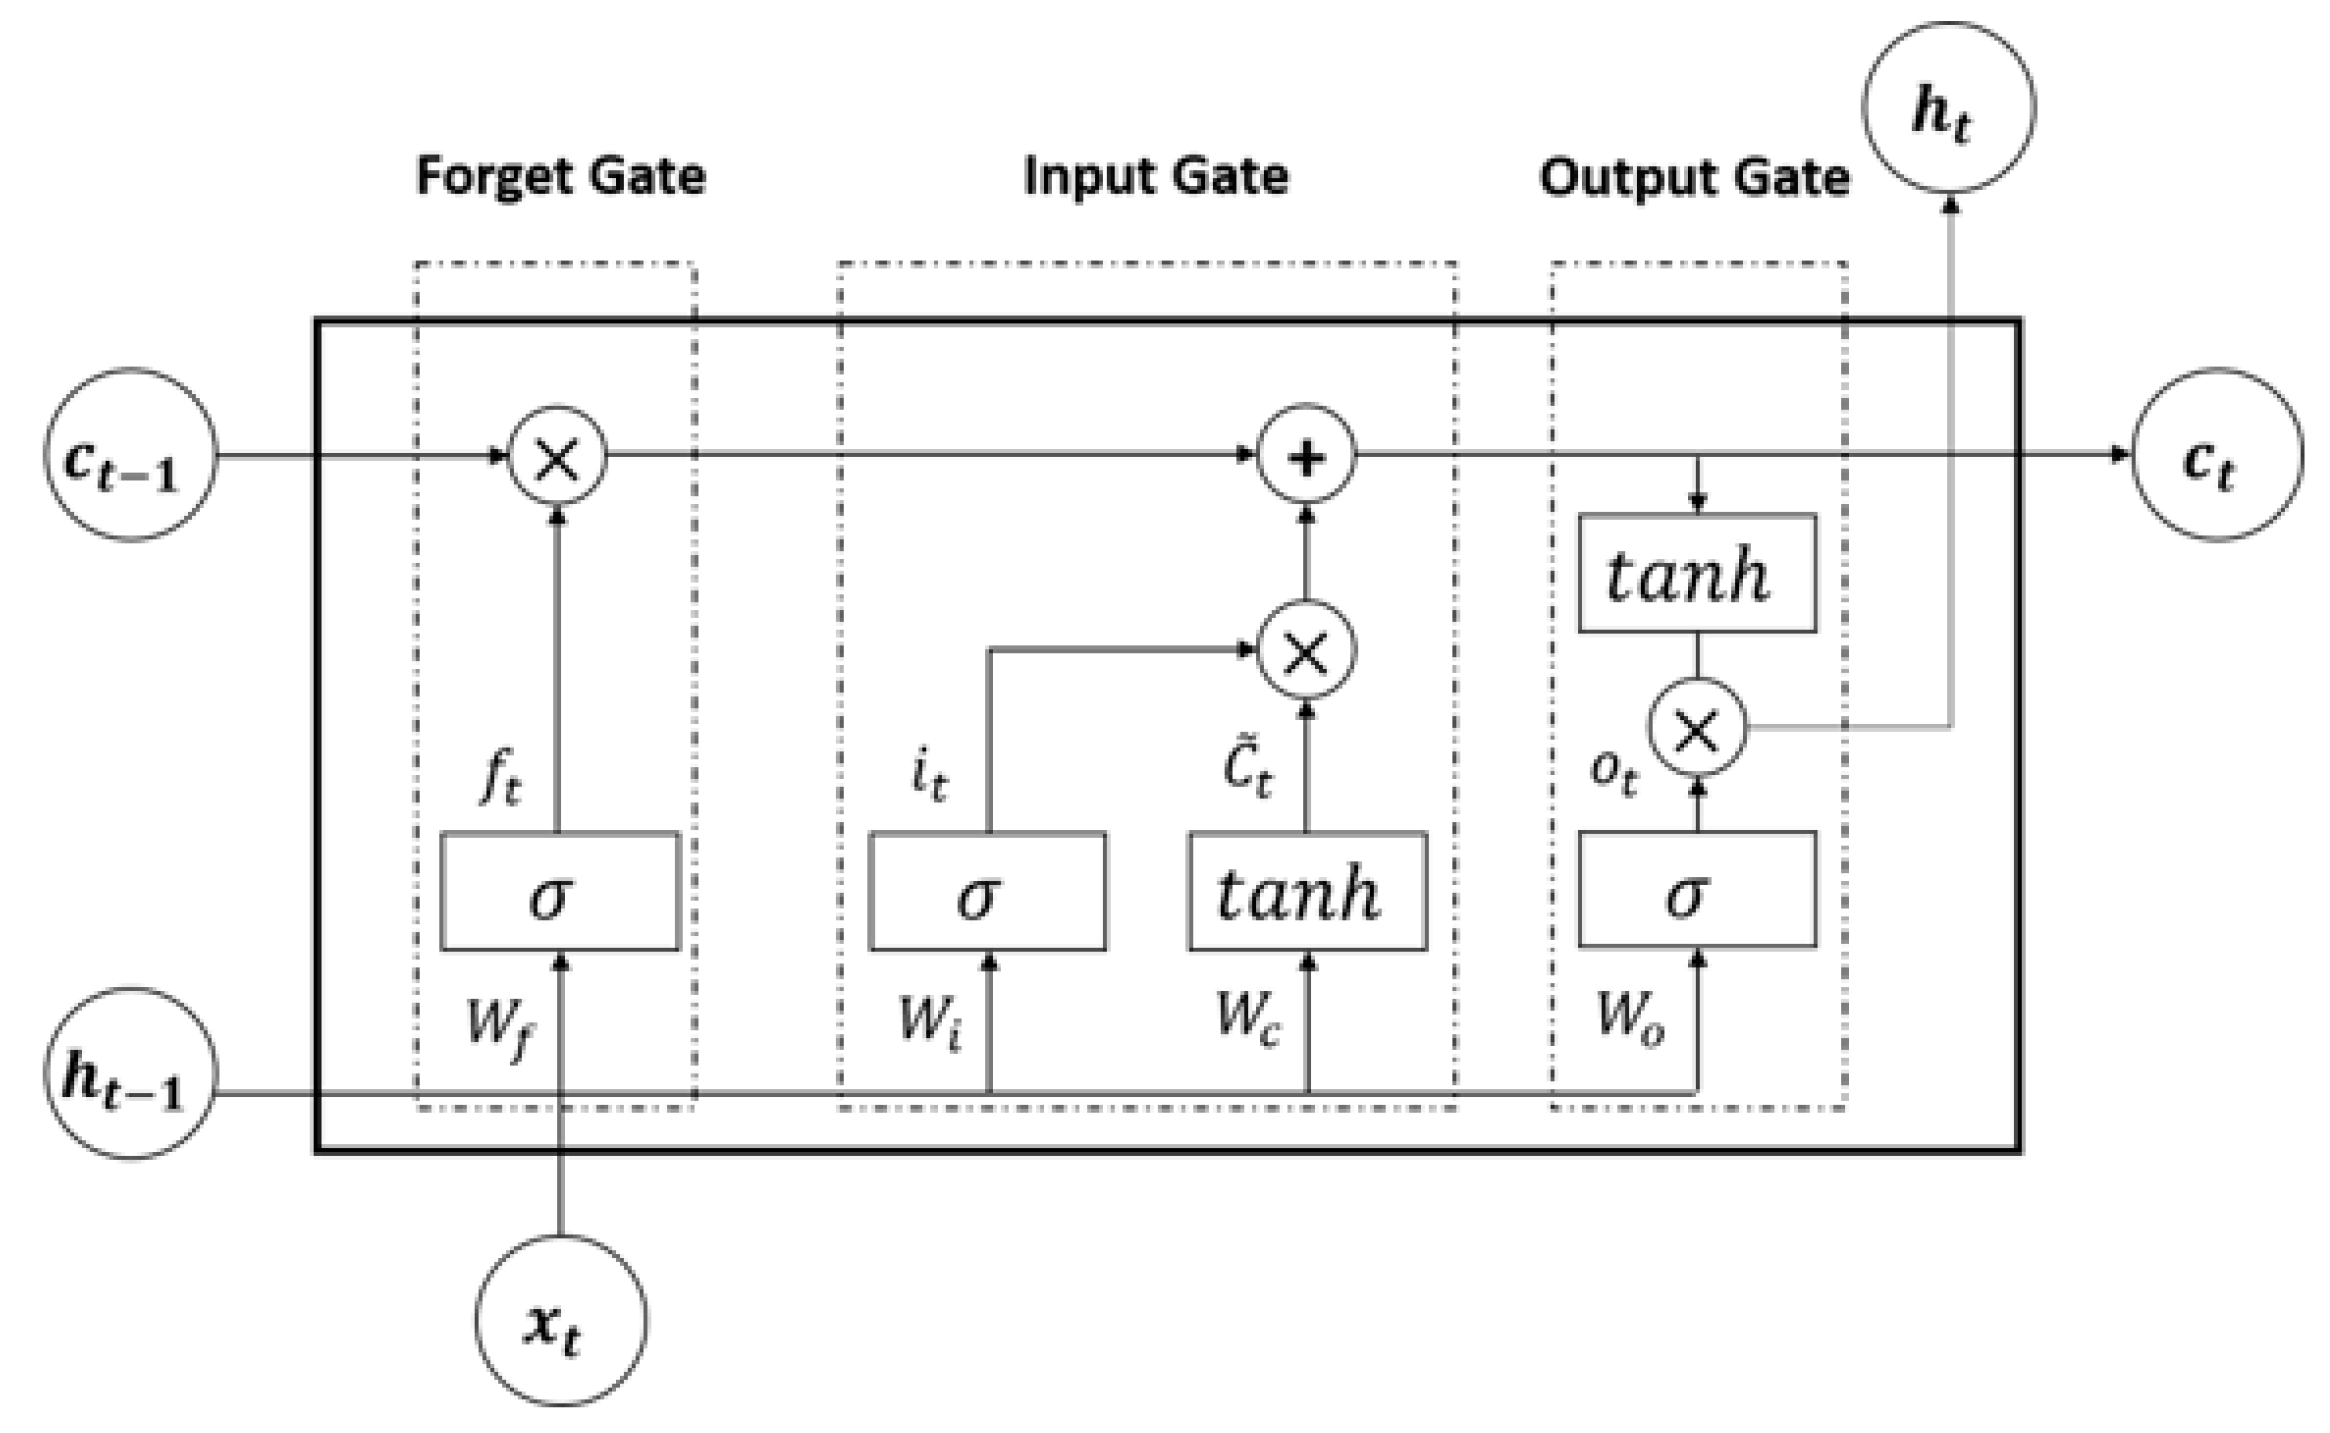
Figure 8.
Schematic of a unit LSTM cell.
Figure 8.
Schematic of a unit LSTM cell.
Figure 9.
ARIMA framework.
Figure 9.
ARIMA framework.
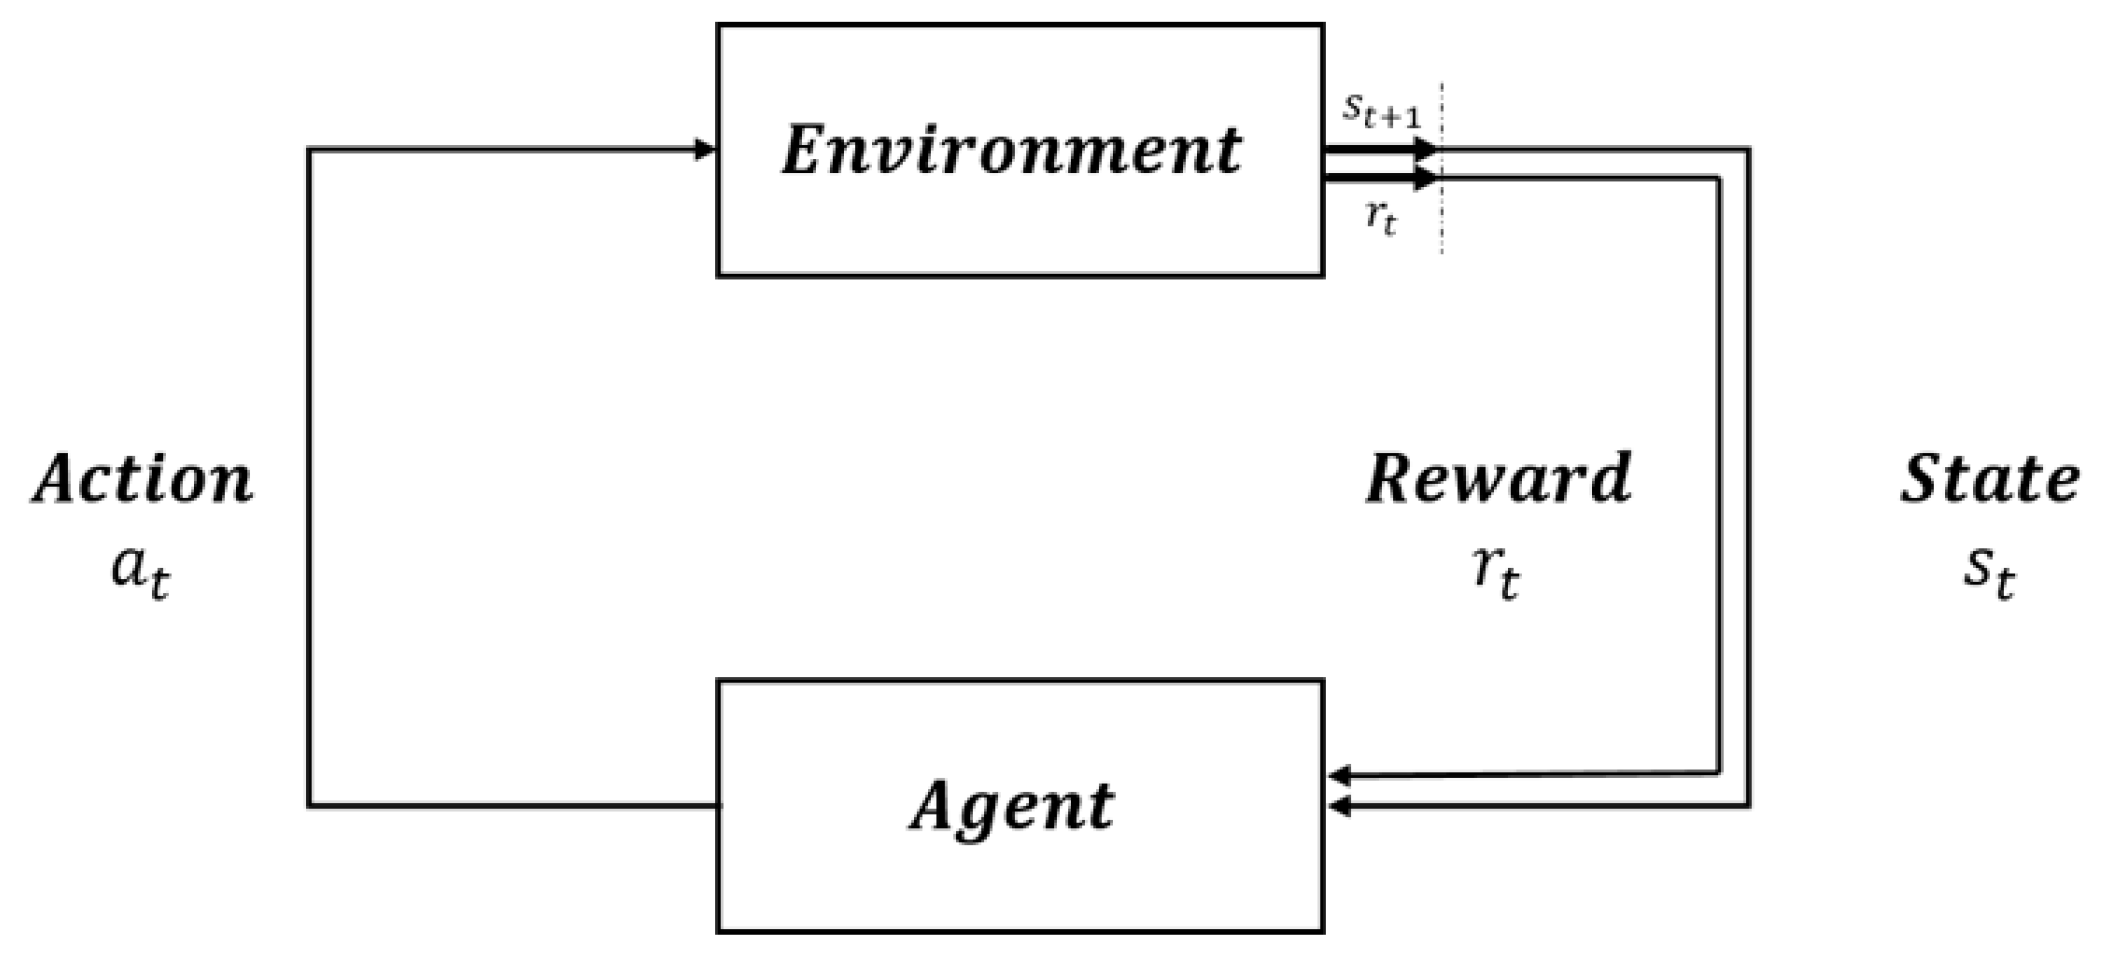
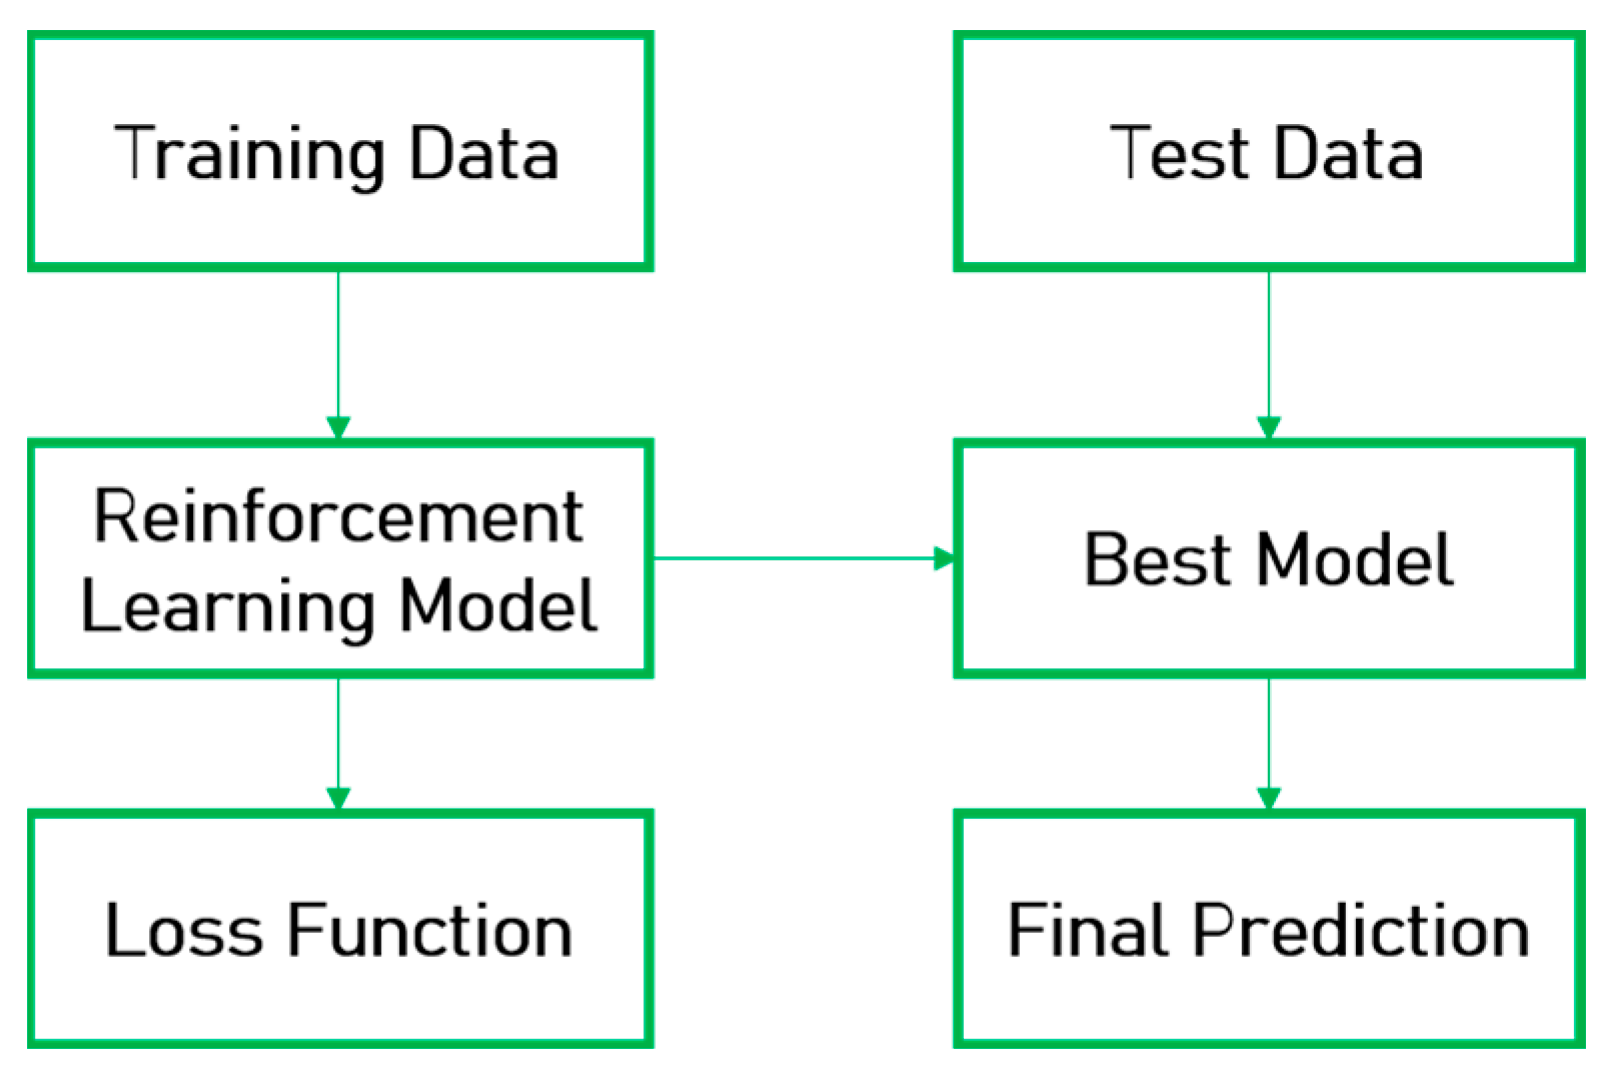
Figure 10.
Reinforcement Learning Schematic.
Figure 10.
Reinforcement Learning Schematic.
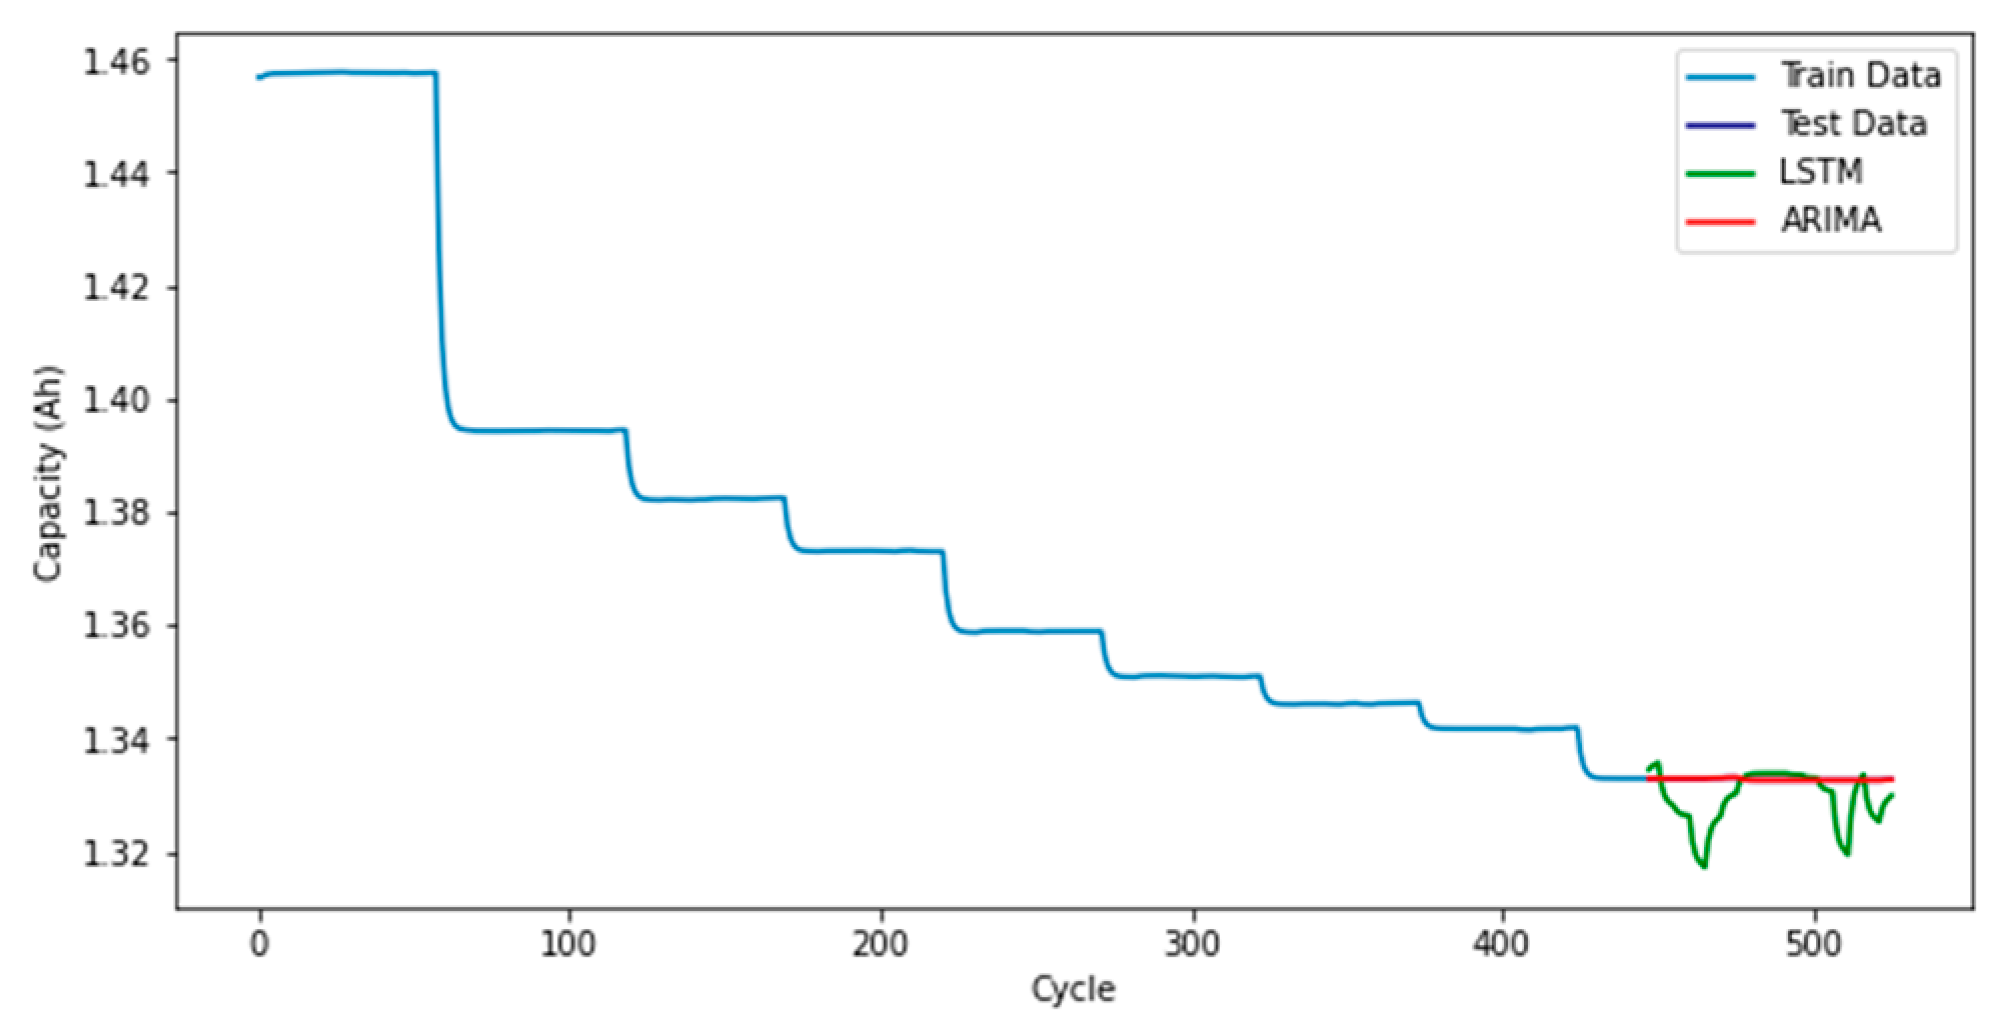
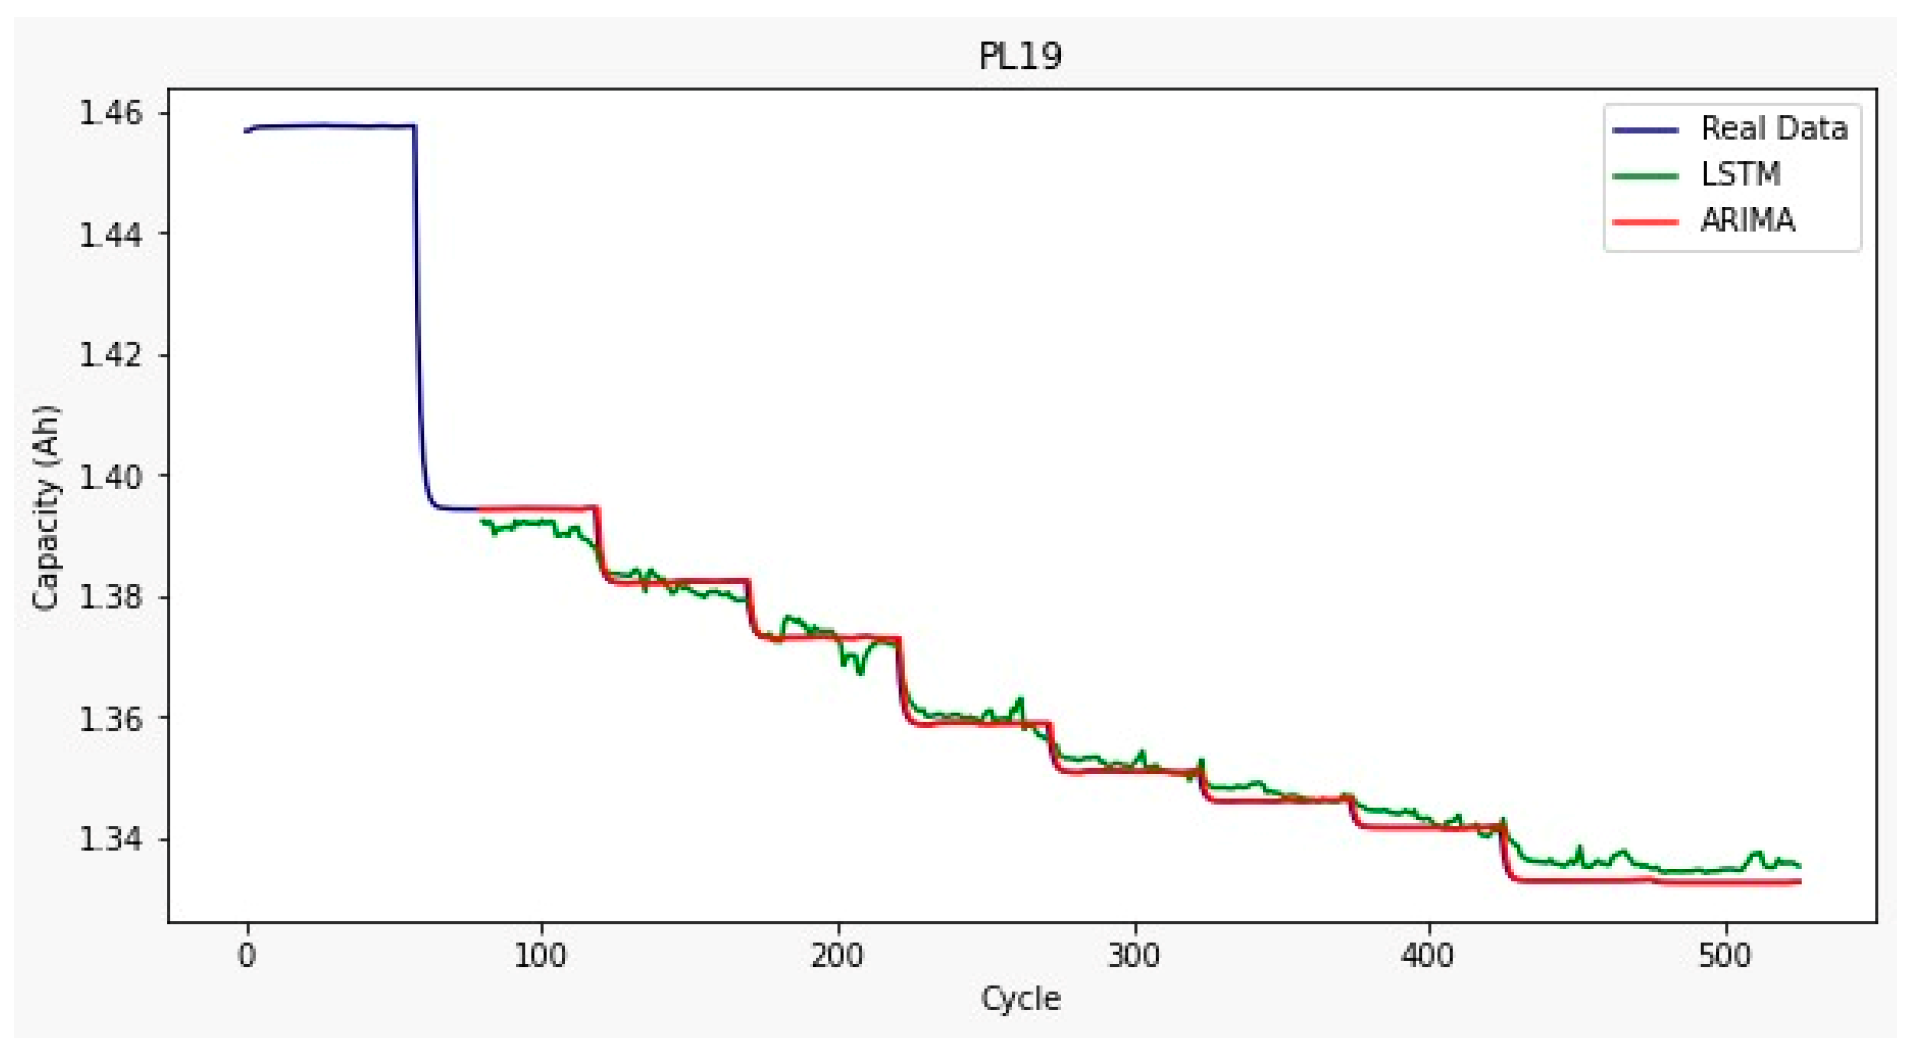
Figure 11.
Train, test, and predicted data results from ARIMA and LSTM models for PL19.
Figure 11.
Train, test, and predicted data results from ARIMA and LSTM models for PL19.
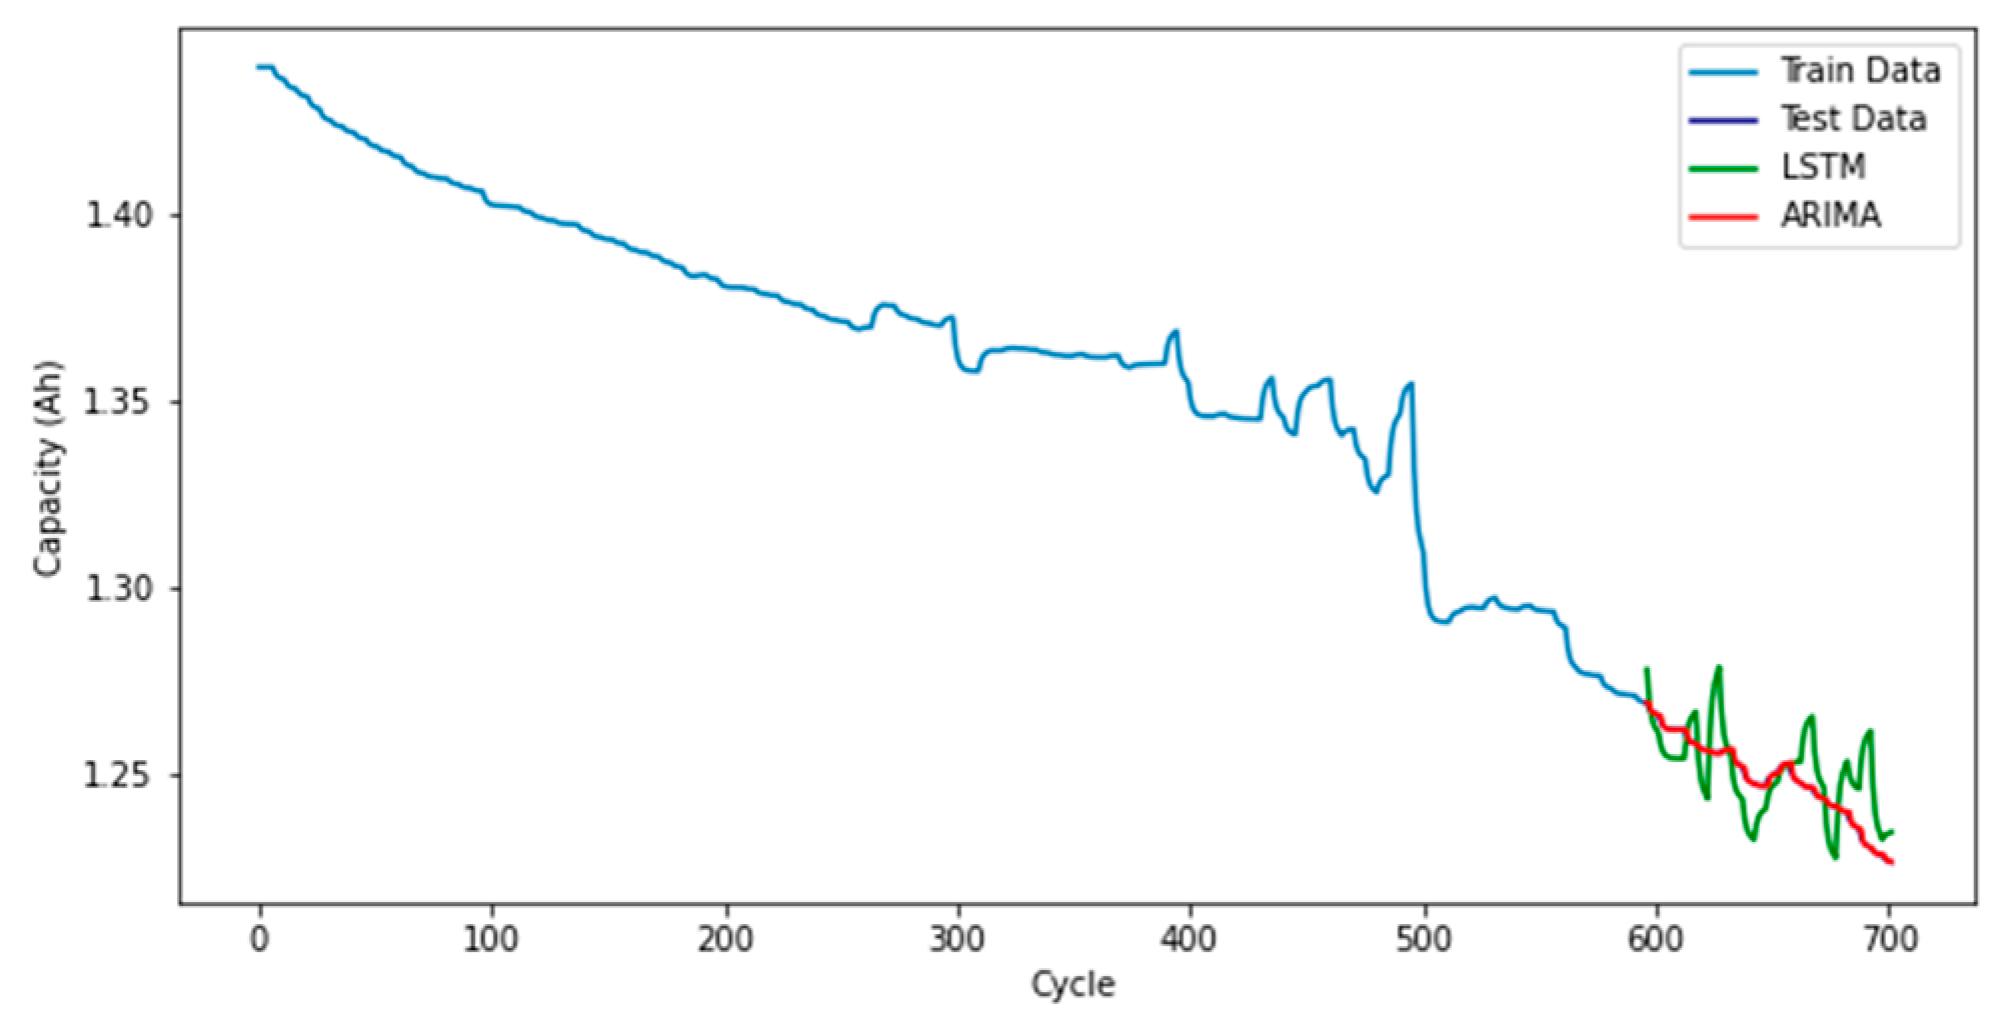
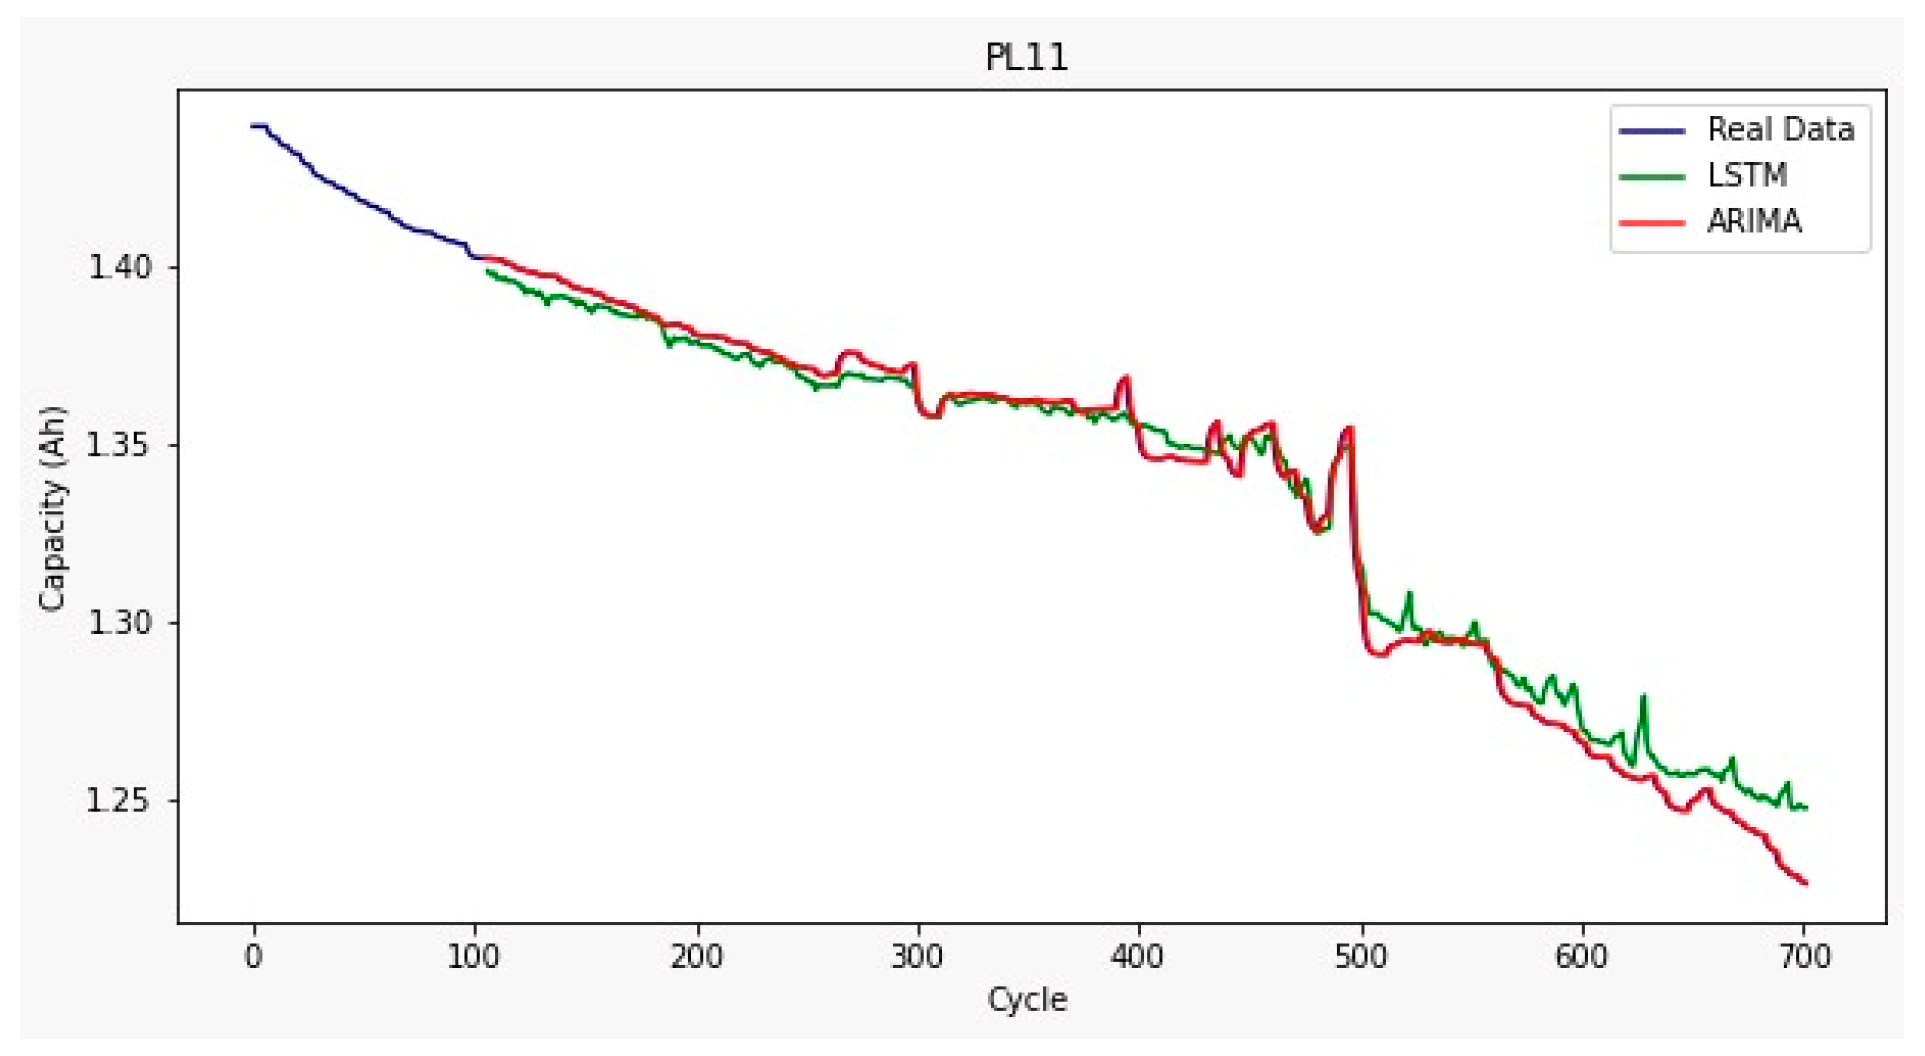
Figure 12.
Train, test, and predicted data results from ARIMA and LSTM models for PL11.
Figure 12.
Train, test, and predicted data results from ARIMA and LSTM models for PL11.
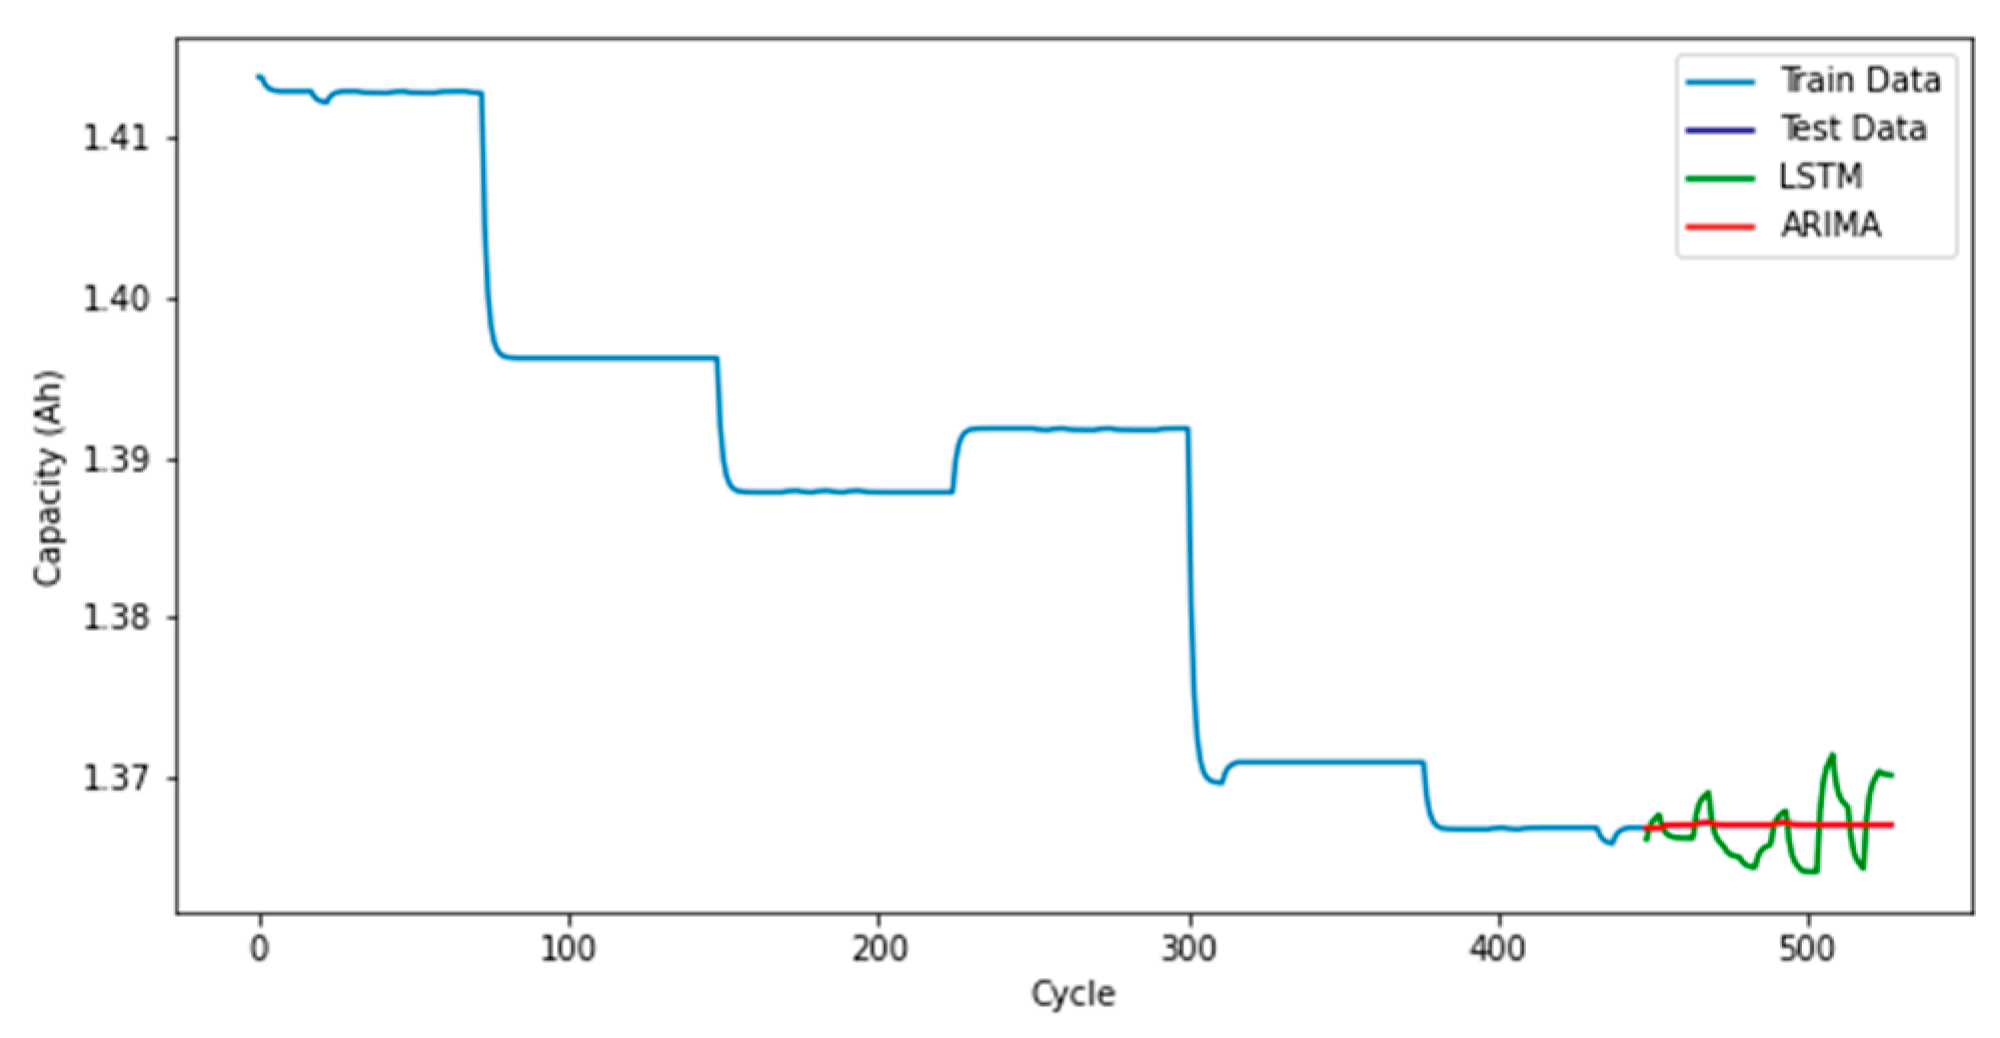
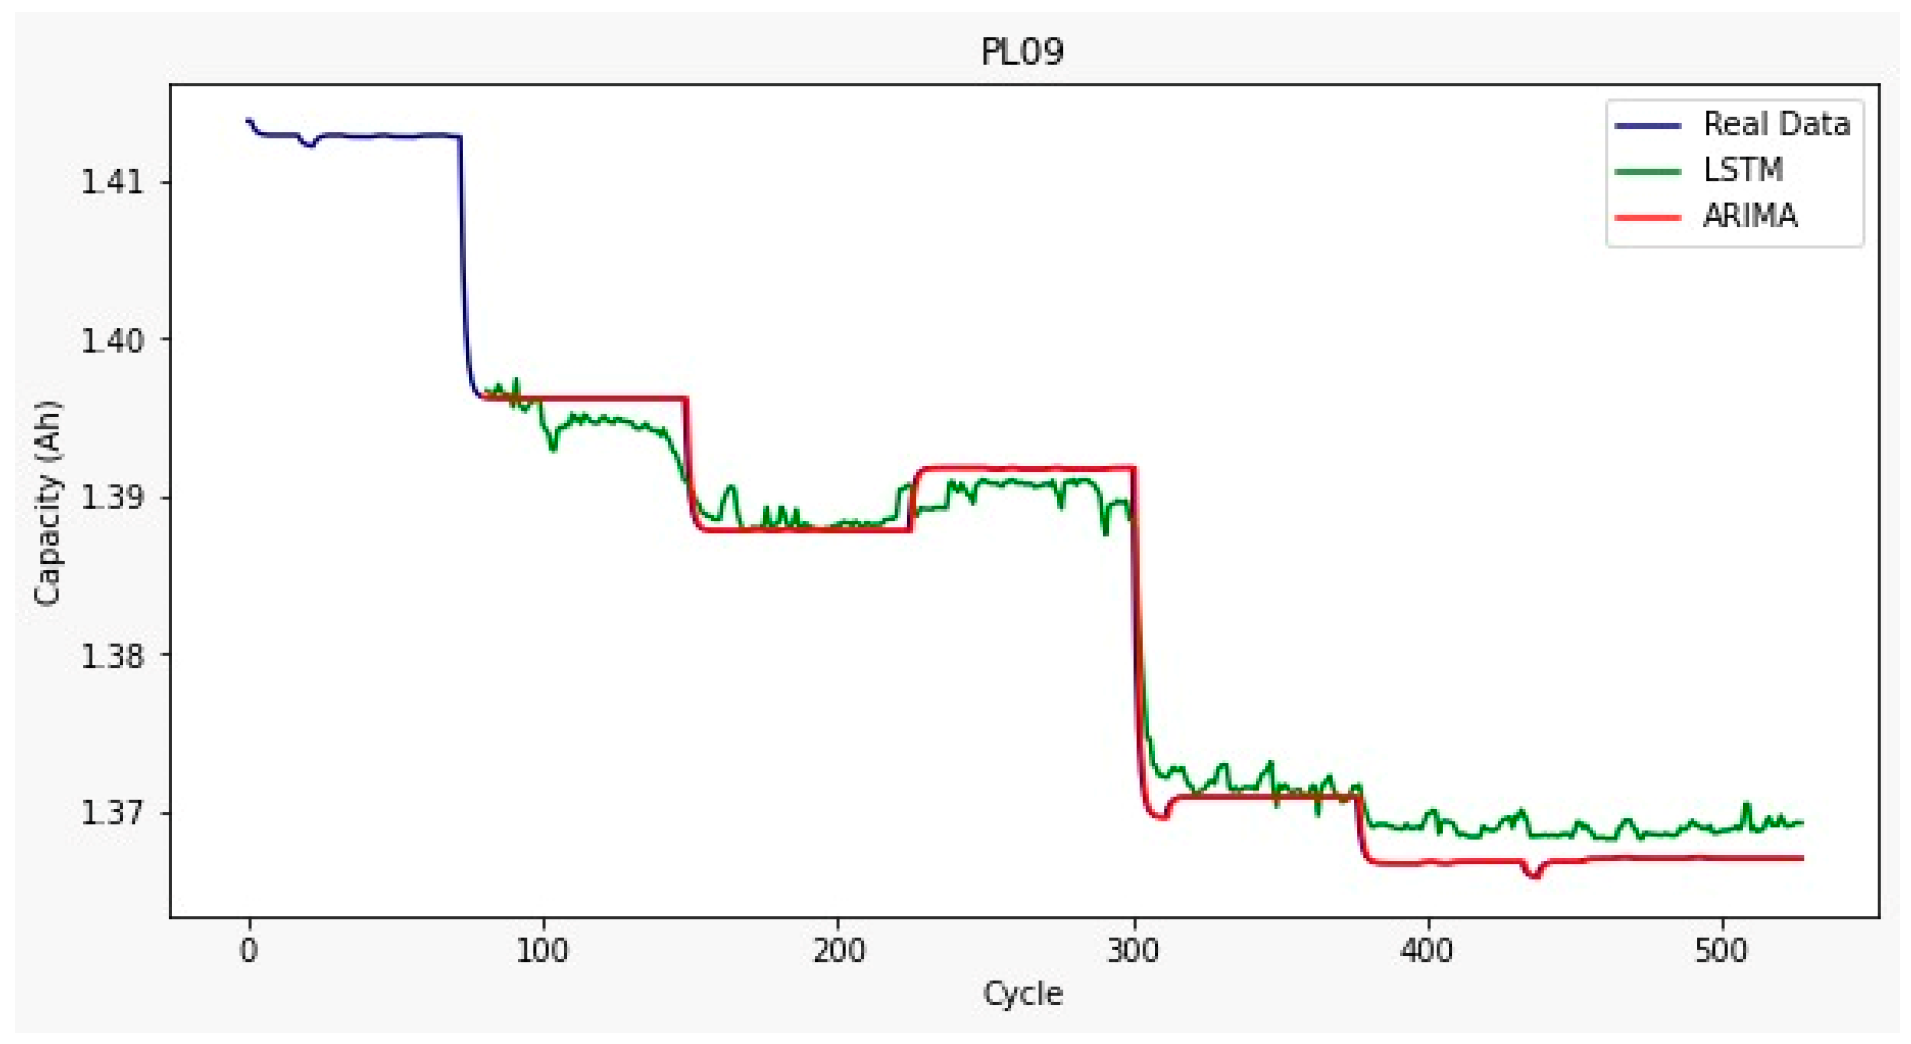
Figure 13.
Train, test, and predicted data results from ARIMA and LSTM models for PL09.
Figure 13.
Train, test, and predicted data results from ARIMA and LSTM models for PL09.
Figure 14.
Train, test, and predicted data results from ARIMA and LSTM models for PL19.
Figure 14.
Train, test, and predicted data results from ARIMA and LSTM models for PL19.
Figure 15.
Train, test, and predicted data results from ARIMA and LSTM models for PL11.
Figure 15.
Train, test, and predicted data results from ARIMA and LSTM models for PL11.
Figure 16.
Train, test, and predicted data results from ARIMA and LSTM models for PL09.
Figure 16.
Train, test, and predicted data results from ARIMA and LSTM models for PL09.
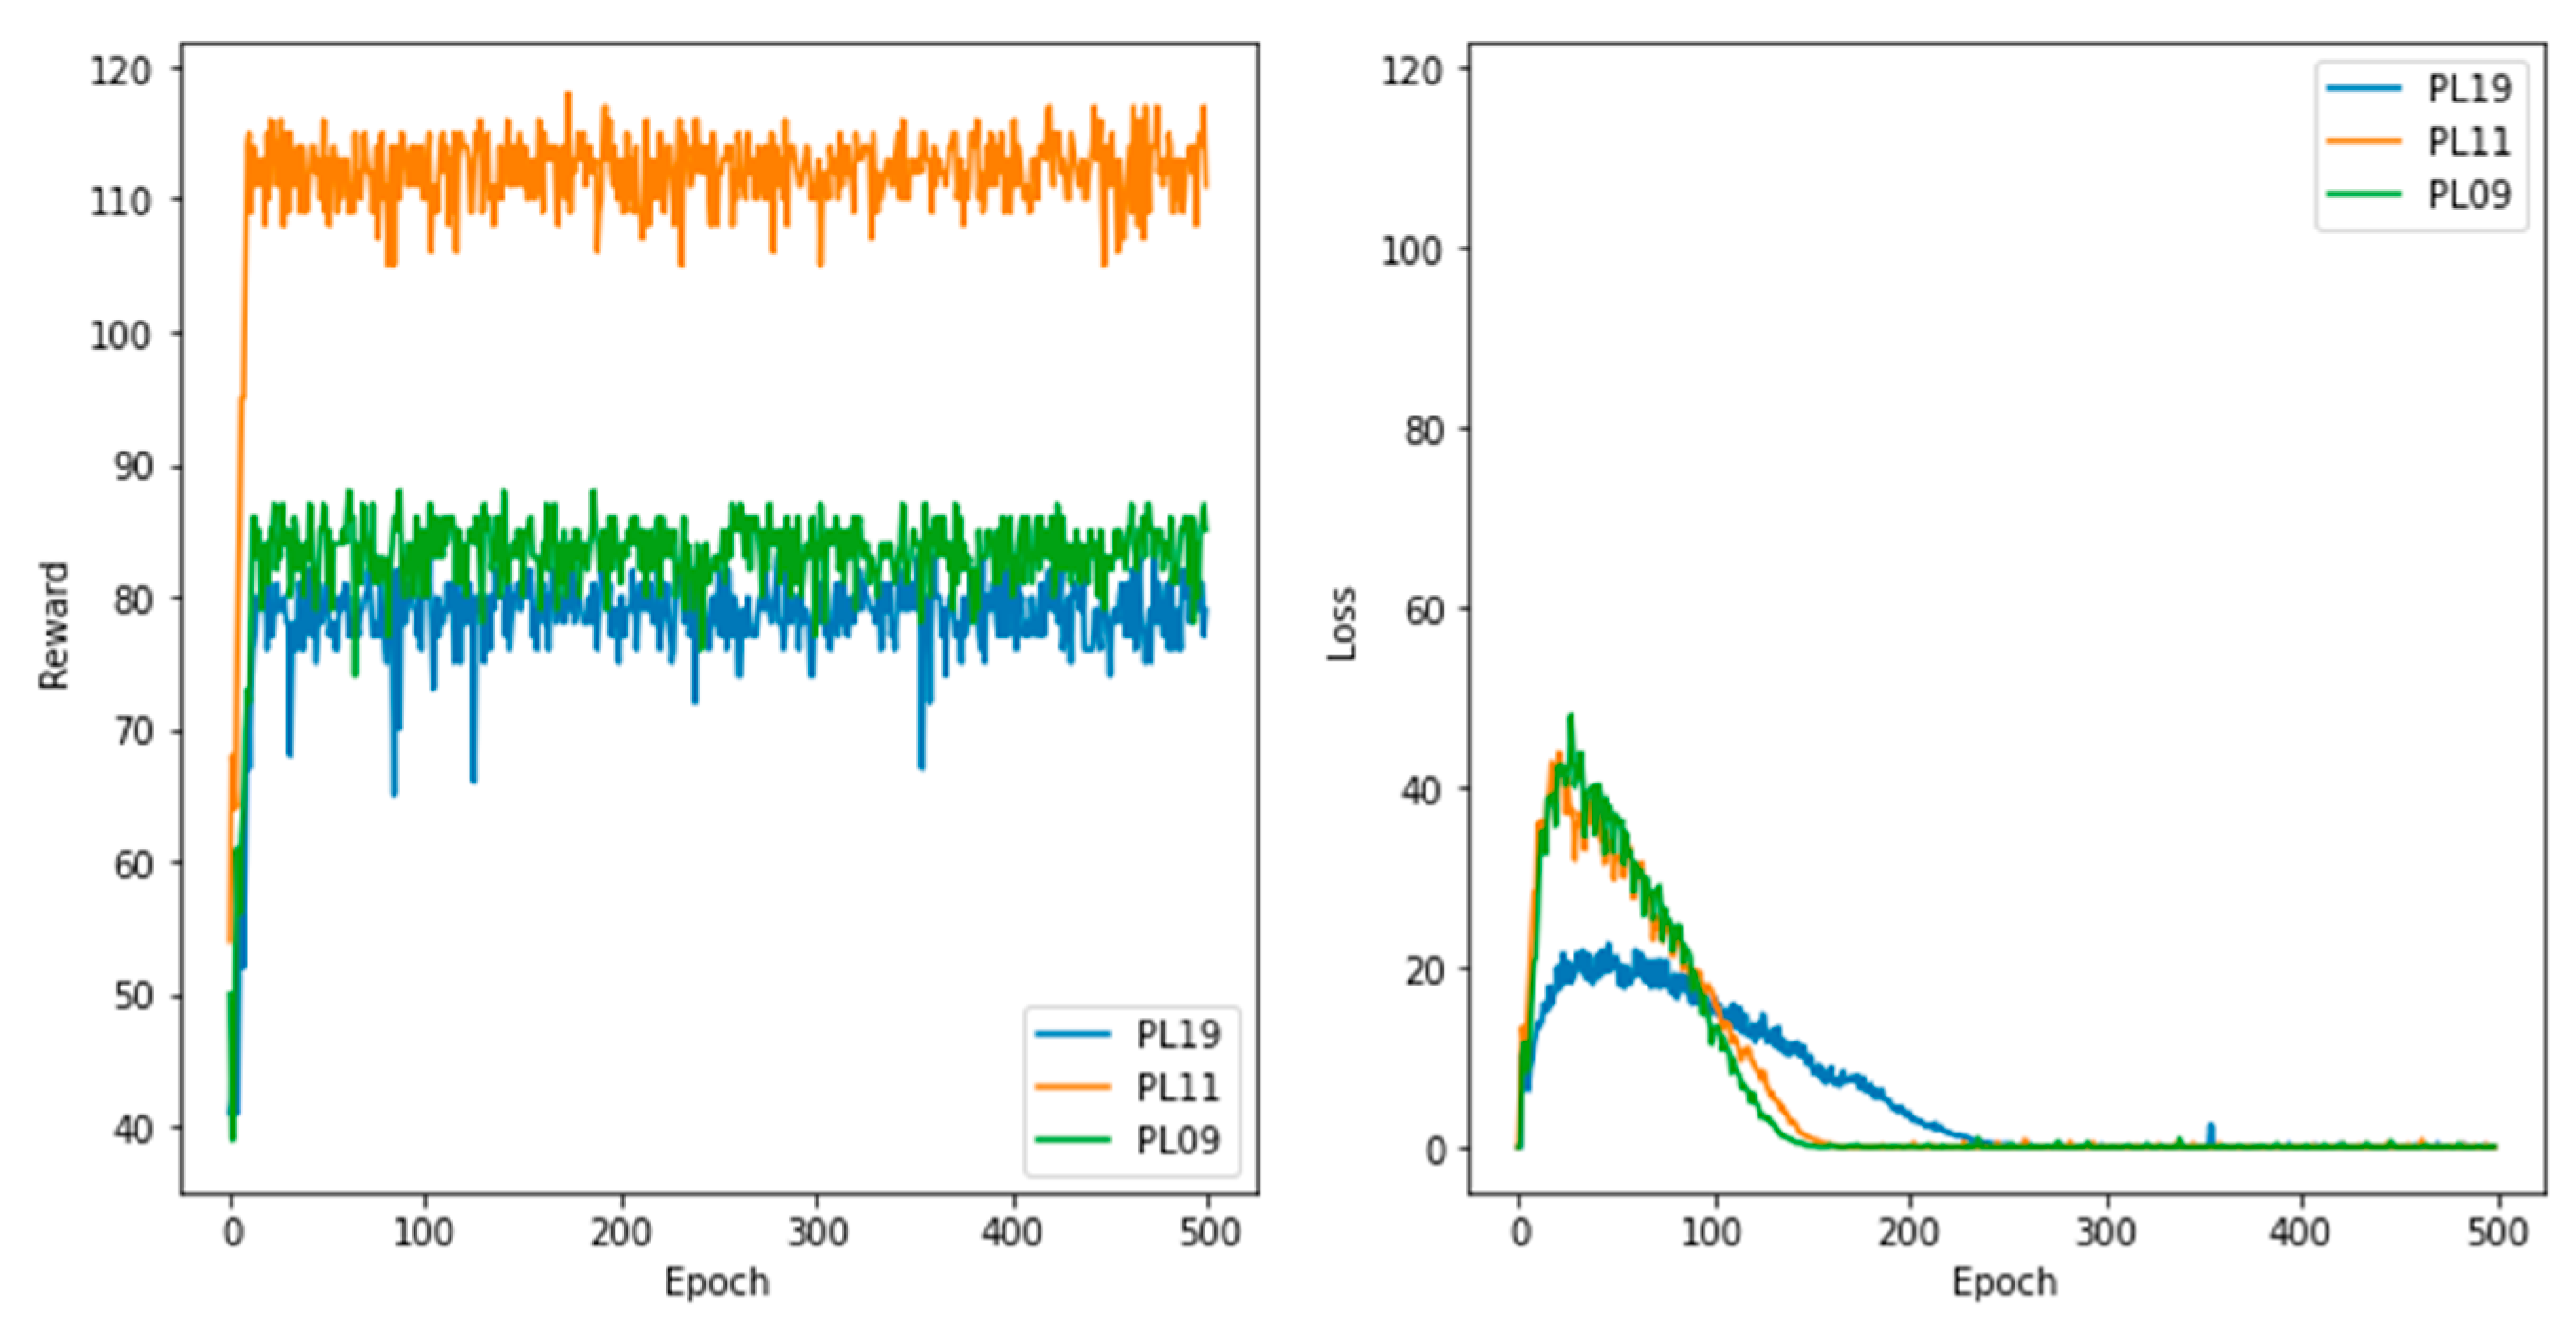
Figure 17.
Reward and Loss Function (RL model).
Figure 17.
Reward and Loss Function (RL model).
Figure 18.
Finding the best Train–Test Split.
Figure 18.
Finding the best Train–Test Split.
Table 1.
An overview of different approaches to lithium-ion battery prognostics.
Table 1.
An overview of different approaches to lithium-ion battery prognostics.
| Ref. | Data | Methods | Results |
|---|
| [17] | NASA Ames Prognostics Center of Excellence (PCoE) database | Deep neural networks
(DNN) | The proposed model successfully predicts the SOH and RUL of the lithium-ion battery but is less effective when real-time processing comes into play. |
| [18] | Center for Advanced Life Cycle Engineering (CALCE) at the University of Maryland | Deep neural networks
(DNN) | The ANN predicts the battery State of Charge values with accuracy using only voltage, current, and charge/discharge time as inputs and achieves an MSE of 3.11 × 10⁻⁶. |
| [19] | NASA Ames | Long short-term memory (LSTM) | The proposed model has a better performance for the time series problem of li-ion battery prognostics and a stronger learning ability of the degradation process when compared to other ANN algorithms. |
| [20] | NASA lithium-ion battery dataset | Long short-term memory (LSTM) | The method produces exceptional performances for RUL prediction under different loading and operating conditions. |
| [21] | Data repository of the NASA Ames Prognostics Center of Excellence (PCoE) | Autoregressive integrated moving average (ARIMA) | The RMSE of the model for the RUL prognostics varies in the range of 0.0026 to 0.1065. |
| [22] | Lithium-ion battery packs from forklifts in commercial operations | Autoregressive integrated moving average (ARIMA) | The ARIMA method can be used for SOH prognostics, but the loss function indicates further enhancement is needed for the environmental conditions. |
| [23] | NASA prognostic model library | Reinforcement Learning (RL) | RL model enables accurate calibration of the battery prognostics but has only been tested on simulated data and sim-to-real transfer needs to be made to test the proposed algorithm on real data. |
| [24] | SPMeT | Reinforcement Learning (RL) | The proposed method can extend the battery life effectively and ensure end-user convenience. However, experimental validation needs to be implemented for the optimal charging strategy. |
| [25] | Simulated datasets | Ensemble Learning | A data-driven method known as Ensemble Learning is presented for predicting degradation in a time-varying environment. |
| [26] | Experimental data from multiple lithium-ion battery cells at three different temperatures | Sparse Bayesian | The authors present a Sparse Bayesian model based on sample entropy of voltages for estimating SOH and RUL. It is shown that the Sparse Bayesian model outperforms the Polynomial model with the same input and target data. |
| [27] | Collected data through an experimental study | Unscented Particle Filter and Support Vector Regression | A hybrid model based on a combination of a data-driven method and a model-based approach is presented, which results in higher accuracy compared to each model individually. |
Table 2.
Battery Cycles.
| Batteries | # of Cycles |
|---|
| PL19 | 526 |
| PL11 | 702 |
| PL09 | 528 |
Table 3.
Glossary.
| Indices | |
|---|
| n | Number of time series data |
| T | Number of times the permutation is found in time series data |
| Variables | |
| Input variable (permutation entropy of battery voltage) at step |
| Observed battery capacity at step |
| Output variable (predicted battery capacity) at step |
| Previous state at step |
| Current state at step |
| Intermediate cell state at step |
| Input gate at step |
| Forget gate at step |
| Output gate at step |
| Order of auto-regression |
| Order of difference |
| Order of moving average |
| State at step |
| Action at step |
| Reward at step |
| Sum of the rewards |
| Learning rate |
| Discount factor |
| Q Table for states and actions at step |
| Parameters | |
| PE | Permutation entropy |
| D | Order of permutation entropy |
| Time delay in data series |
| V | Time series data matrix |
| Columns in V |
| Permutation pattern |
| Relative probability of each permutation |
| Weights in LSTM cells |
| bias vectors in LSTM cells |
| ARIMA coefficients |
| Normal white noise with zero mean |
Table 4.
MSE Value for Different Training Ratios for the RL model.
Table 4.
MSE Value for Different Training Ratios for the RL model.
| Battery | Training Ratio |
|---|
| 70% | 75% | 80% | 85% | 90% |
|---|
| PL19 | 0.0422 | 0.0618 | 0.0179 | 0.0008 | 0.0002 |
| PL11 | 0.0718 | 0.0465 | 0.0153 | 0.0156 | 0.0084 |
| PL09 | 0.0209 | 0.0007 | 0.0006 | 0.0003 | 0.0003 |
Table 5.
MSE, MAE, and RMSE values for the predictive models (PL19).
Table 5.
MSE, MAE, and RMSE values for the predictive models (PL19).
| Evaluation Metric | LSTM | ARIMA | RL |
|---|
| MSE | 0.00003 | 0.00001 | 0.0002 |
| MAE | 0.00417 | 0.00001 | 0.00005 |
| RMSE | 0.00580 | 0.00003 | 0.00009 |
Table 6.
MSE, MAE, and RMSE values for the predictive models (PL11).
Table 6.
MSE, MAE, and RMSE values for the predictive models (PL11).
| Evaluation Metric | LSTM | ARIMA | RL |
|---|
| MSE | 0.00011 | 0.00001 | 0.0084 |
| MAE | 0.00012 | 0.00026 | 0.00054 |
| RMSE | 0.01095 | 0.00066 | 0.00090 |
Table 7.
MSE, MAE, and RMSE values for the predictive models (PL09).
Table 7.
MSE, MAE, and RMSE values for the predictive models (PL09).
| Evaluation Metric | LSTM | ARIMA | RL |
|---|
| MSE | 0.00001 | 0.00001 | 0.0003 |
| MAE | 0.00171 | 0.00001 | 0.03997 |
| RMSE | 0.00200 | 0.00002 | 0.05751 |


