1. Introduction
In recent years, the development of metaheuristic methodologies for the solution of complex optimization problems has increased, both in the continuous and discrete space versions. Some of the most significant metaheuristics are: particle swarm optimization (PSO) [
1], ant colony optimization (ACO) [
2], genetic algorithms (GA) [
3], artificial bee colony algorithm (ABC) [
4], tabu search (TS) [
5], variable neighborhood search (VNA) [
6], the bees algorithm (BA) [
7], fish school search (FSS) [
8], swallow swarm optimization (SSO) [
9], hybrid particle swallow swarm optimization (HPSSO) [
10], grasshopper optimization algorithm (GOA) [
11], bat algorithm (BAT) [
12], whale optimization algorithm (WOA) [
13] just to mention a few. Within the metaheuristics mentioned above it can be observed that they are developed using two main ingredients: (1) the basic principles of physics such as velocity, the force of attraction and acceleration and (2) the behavior of certain groups of animals. There are many applications in which GOA has been used. Among such applications the most recent and relevant are [
14,
15,
16,
17,
18].
The open vehicle routing problem (OVRP) is a variant of the classic vehicle routing problem (VRP) first introduced in [
19]. Many variants of the VRP have been studied in the literature, and recent research focuses on modeling very specialized real-world variants of the VRP. Some of these recent specialized real-world variants can be found in [
20,
21,
22,
23,
24,
25,
26,
27,
28,
29].
Although new routing problems arise everyday, classic problems such as the OVRP are still studied thanks to their potential applications. The research presented in this paper was motivated by the case study presented in
Section 5, which required the solution of OVRP instances.
The OVRP was formally introduced in [
30], although the first work related to the problem was first presented in [
31] for an air express courier problem. The OVRP is an NP-Hard combinatorial optimization problem (as mentioned in [
32]), which makes it difficult to solve by exact methods. Therefore, many heuristic approaches have been developed to solve the problem. Among the most important heuristic algorithms used to solve the OVRP are those in [
32,
33,
34,
35,
36,
37,
38,
39].
The applications of the OVRP are not limited to the context of vehicle route design. In [
31], the OVRP is used to solve an air express courier problem, and in [
40], the train services planning at the Channel tunnel is made by solving an OVRP.
In this work, a novel hybrid grasshopper optimization algorithm with local search (HGOALS) method is used to solve instances of the open vehicle routing problem. To our knowledge, GOA has not been previously used for solving the OVRP. In fact, there is not much literature on GOA in the context of vehicle routing problems. The proposed solution method is based on the grasshopper optimization algorithm (GOA) and uses local search to improve solutions and accelerate the optimization process. The GOA is a swarm optimization algorithm that mimics the behavior of a grasshopper swarm to solve optimization problems.
The HGOALS combines the GOA framework with a decodification procedure and local search to obtain solutions for the OVRP instances. The decodification procedure incorporates a feasibility recovery phase in case the decoded solutions are infeasible. Once the solutions are feasible, the best ones are selected for improvement using local search. Every time a new best solution is found, it is subjected to an improvement phase. The algorithm finishes when two given stop criteria are reached.
To demonstrate the efficiency of the proposed methodology, experiments were carried out using 30 benchmark problems taken from the scientific literature and the results were compared against previous algorithms. The experiments considered two objective functions for the problem. The first is the hierarchical objective function, which has as a first goal the minimization of the total number of vehicles to be used, and as a second goal the minimization of the total traveling cost of such vehicles. In the second objective function, only the total traveling cost is minimized. The results show that the proposed methodology is competitive. Additionally, the algorithm was utilized to solve a case study from a security company, obtaining excellent results. The rest of this paper is organized as follows:
Section 2 describes the OVRP, while
Section 3 describes the proposed algorithm. The computational experiments are reported in
Section 4, where the used benchmark instances, the corresponding numerical results and a numerical comparison concerning other algorithms are presented. Finally, conclusions and future research are discussed in
Section 6.
2. Problem Description
As mentioned before, two types of objective functions have been taken from the literature for the problem: (i) the hierarchical one (minimize the number of routes and then minimize the total traveling cost) and (ii) the minimization of the total traveling cost.
Consider a complete directed graph
, with
the set of vertices and
A the set of arcs. The reason to consider a directed graph is that in real-life applications, cost (distance) matrices are not symmetric (See
Section 5). Notice that vertex 0 (depot) is the departure point of all vehicles. Each vertex (except the depot)
, has an associated demand
. Also, each arc
, has an associated cost
. Feasible solutions to the OVRP are open routes originated at the depot, that satisfy capacity and route length constraints.
Before formally defining the OVRP, some notation is introduced. Let denote a given set of open routes of G originated at the depot (0):
, the set of vertices without the depot.
Cost of R, .
, the time required to service any client.
First vertex, a vertex directly connected to 0 in R ().
Subroute (), an open route in R originated at vertex .
s-route (), a subroute originated at i, where i is the first vertex of .
, the set of vertices that are part of subroute .
, the sum of the demands of the vertices in .
, the total length of .
The capacity constraints for the OVRP impose that for a given open route originated at 0 the total demand of any subroute can not exceed a given value . That is for any subroute of R. Open routes are also subjected to length constraints, which impose that route duration can not exceed a given value . That is for any subroute of R.
The OVRP can be defined as the problem of finding a set of open routes originated at the depot, visiting all clients and satisfying the capacity and route length constraints while minimizing one of the above mentioned objective functions.
3. Hybrid Grasshopper Optimization Algorithm with Local Search
This section describes the proposed hybrid grasshopper optimization algorithm with local search (HGOALS) for solving OVRP’s instances. The grasshopper optimization algorithm (GOA) has been proposed initially in [
11].
The behavior of a grasshopper’s swarm of size
P can be simulated using
, where
is the current position of the
member of the swarm,
the effect of the wind on the
grasshoppers movement,
the gravity force and
the social interaction between the
grasshopper and the rest of the members of the swarm. The coefficients
,
and
are random numbers in the interval
used to introduce random behavior among the members of the swarm. As mentioned in [
11], the problem with this model is that grasshoppers tend to stay in a comfort zone, which is not useful when solving optimization problems. Therefore the authors proposed to use:
In this equation,
and
are vectors containing respectively, the upper and lower bounds for the variables considered for optimization.
T is the target solution, which is the best solution found so far by the algorithm,
is the distance between grasshoppers
i and
j. Finally, the social interaction between grasshoppers is computed using
, where
f is the intensity of attraction, and
l the attractive length scale. Constant
determines how likely is the grasshopper to explore around the target
T (equivalent to
w in the PSO algorithm), balancing the exploration and exploitation of the area around
T. Constant
defines the attraction, repulsion and comfort zone among the grasshoppers. For a problem of dimension
n, the position of the grasshopper on dimension
h (
) is given by:
The movement of the grasshopper can be simulated in a multidimensional space using Equation (
10). For further details about the GOA, the reader is encouraged to read [
11].
Since the GOA is a continuous optimization algorithm, it is necessary to implement a decodification procedure in order to solve non-continuous optimization problems. Therefore, a decodification procedure is required to transform the continuous values from the GOA into solutions of the non-continuous problem.
3.1. HGOALS Description
A mentioned previously, HGOALS combines the GOA framework with a decodification procedure and local search to solve OVRP instances.
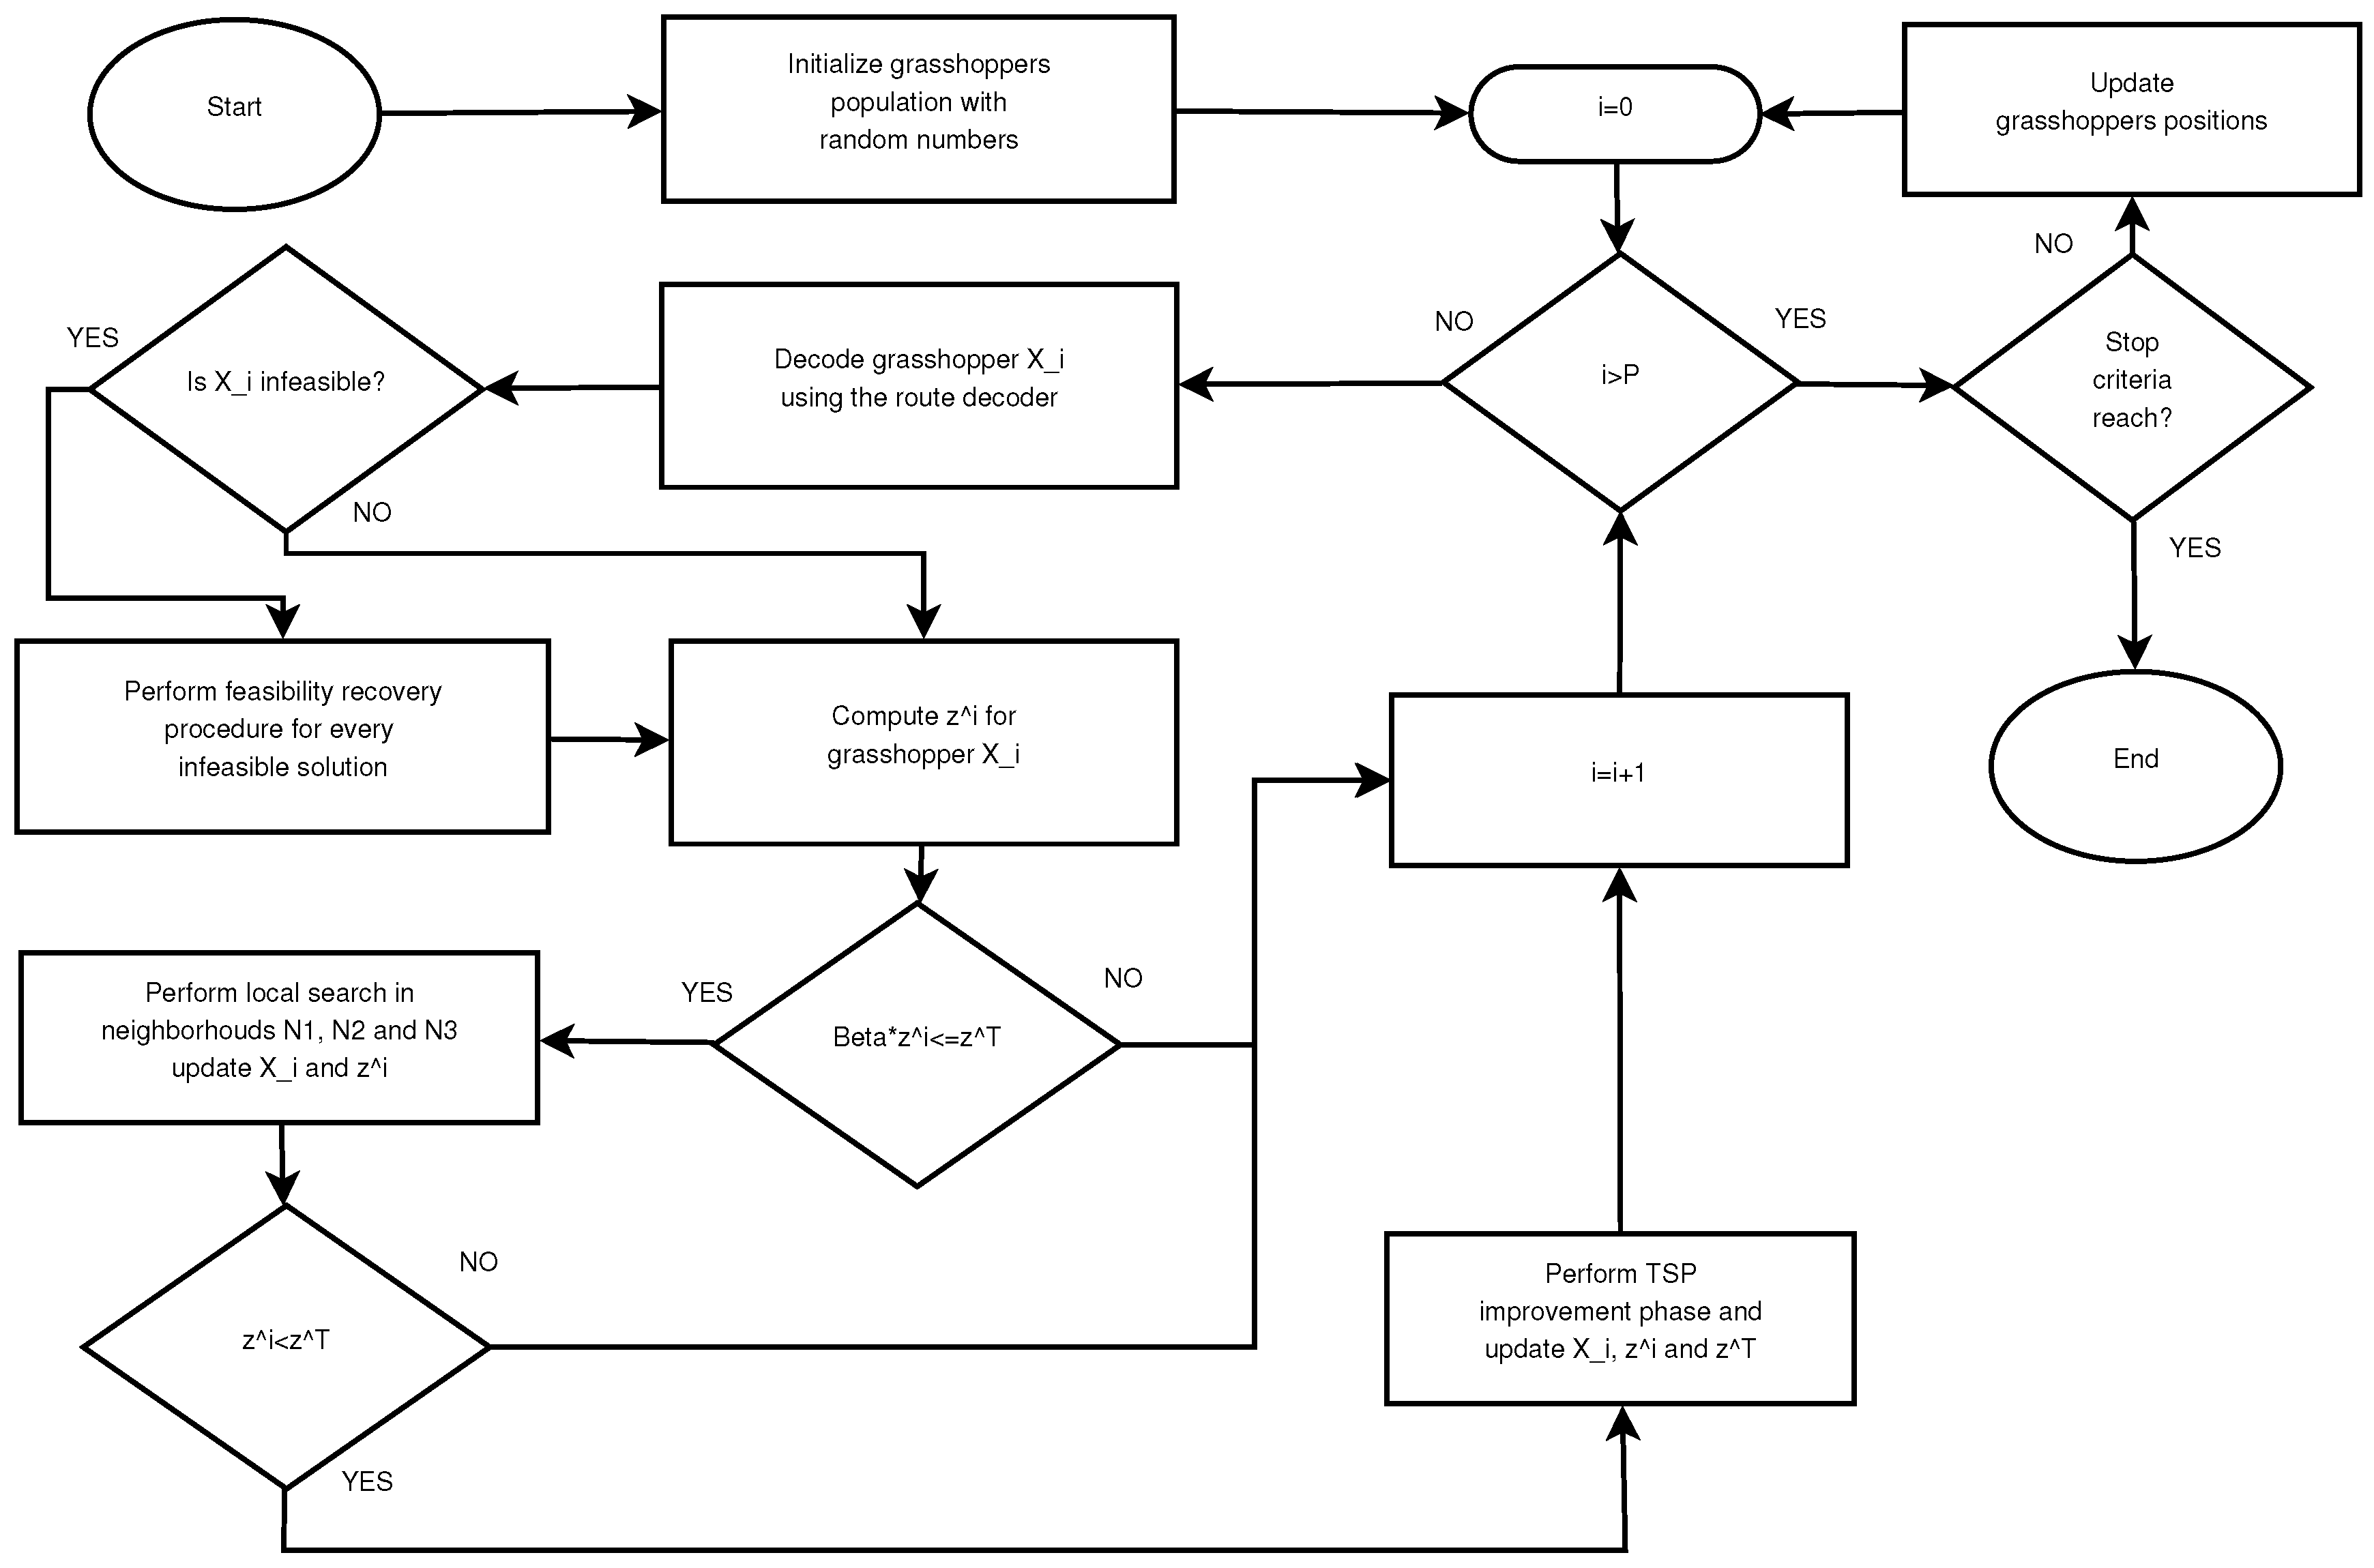
Figure 1 shows a flow diagram for the HGOALS. The proposed algorithm receives as an input graph
, the associated cost matrix
c, the service time parameter
, the vehicle capacity parameter
Q, the maximum length parameter
L, the grasshopper population size
P and the grasshopper dimension
n. HGOALS has three essential components: (i) The route decoder (decodification procedure), (ii) the local search and (iii) the improvement phase. To facilitate comprehension the above mentioned components are described first, and the complete process of the proposed HGOALS algorithm is explained after.
3.2. The Route Decoder
As mentioned before, the HGOALS requires the implementation of a decoder. Other decoders for similar problems have been previously proposed. The objective of proposing a new decoder is to find better results than those obtained by previous decoders and other metaheuristics. In this section, the new decoder is described.
The route decoder (RD) requires as input the associated cost to every arc
, the random-key vector
and the demand vector
d. The random-key vector
contains
fractional values.
, the first value in vector
, is used to define the total number of vehicles available in the solution. The other
n values are used to assign vertices to different vehicles. The decoder determines the total number of vehicles, by first computing the minimum number of vehicles required to deliver all the clients demand using:
where:
Using the random-key vector value
the number of available vehicles in the solution is given by:
Then the interval
is divided into
subintervals. Each client is assigned to a vehicle using these subintervals and the keys associated with each client. Once all clients have been assigned to a vehicle, they are sorted in ascending order according to their key. The routes are built using the sorted keys.
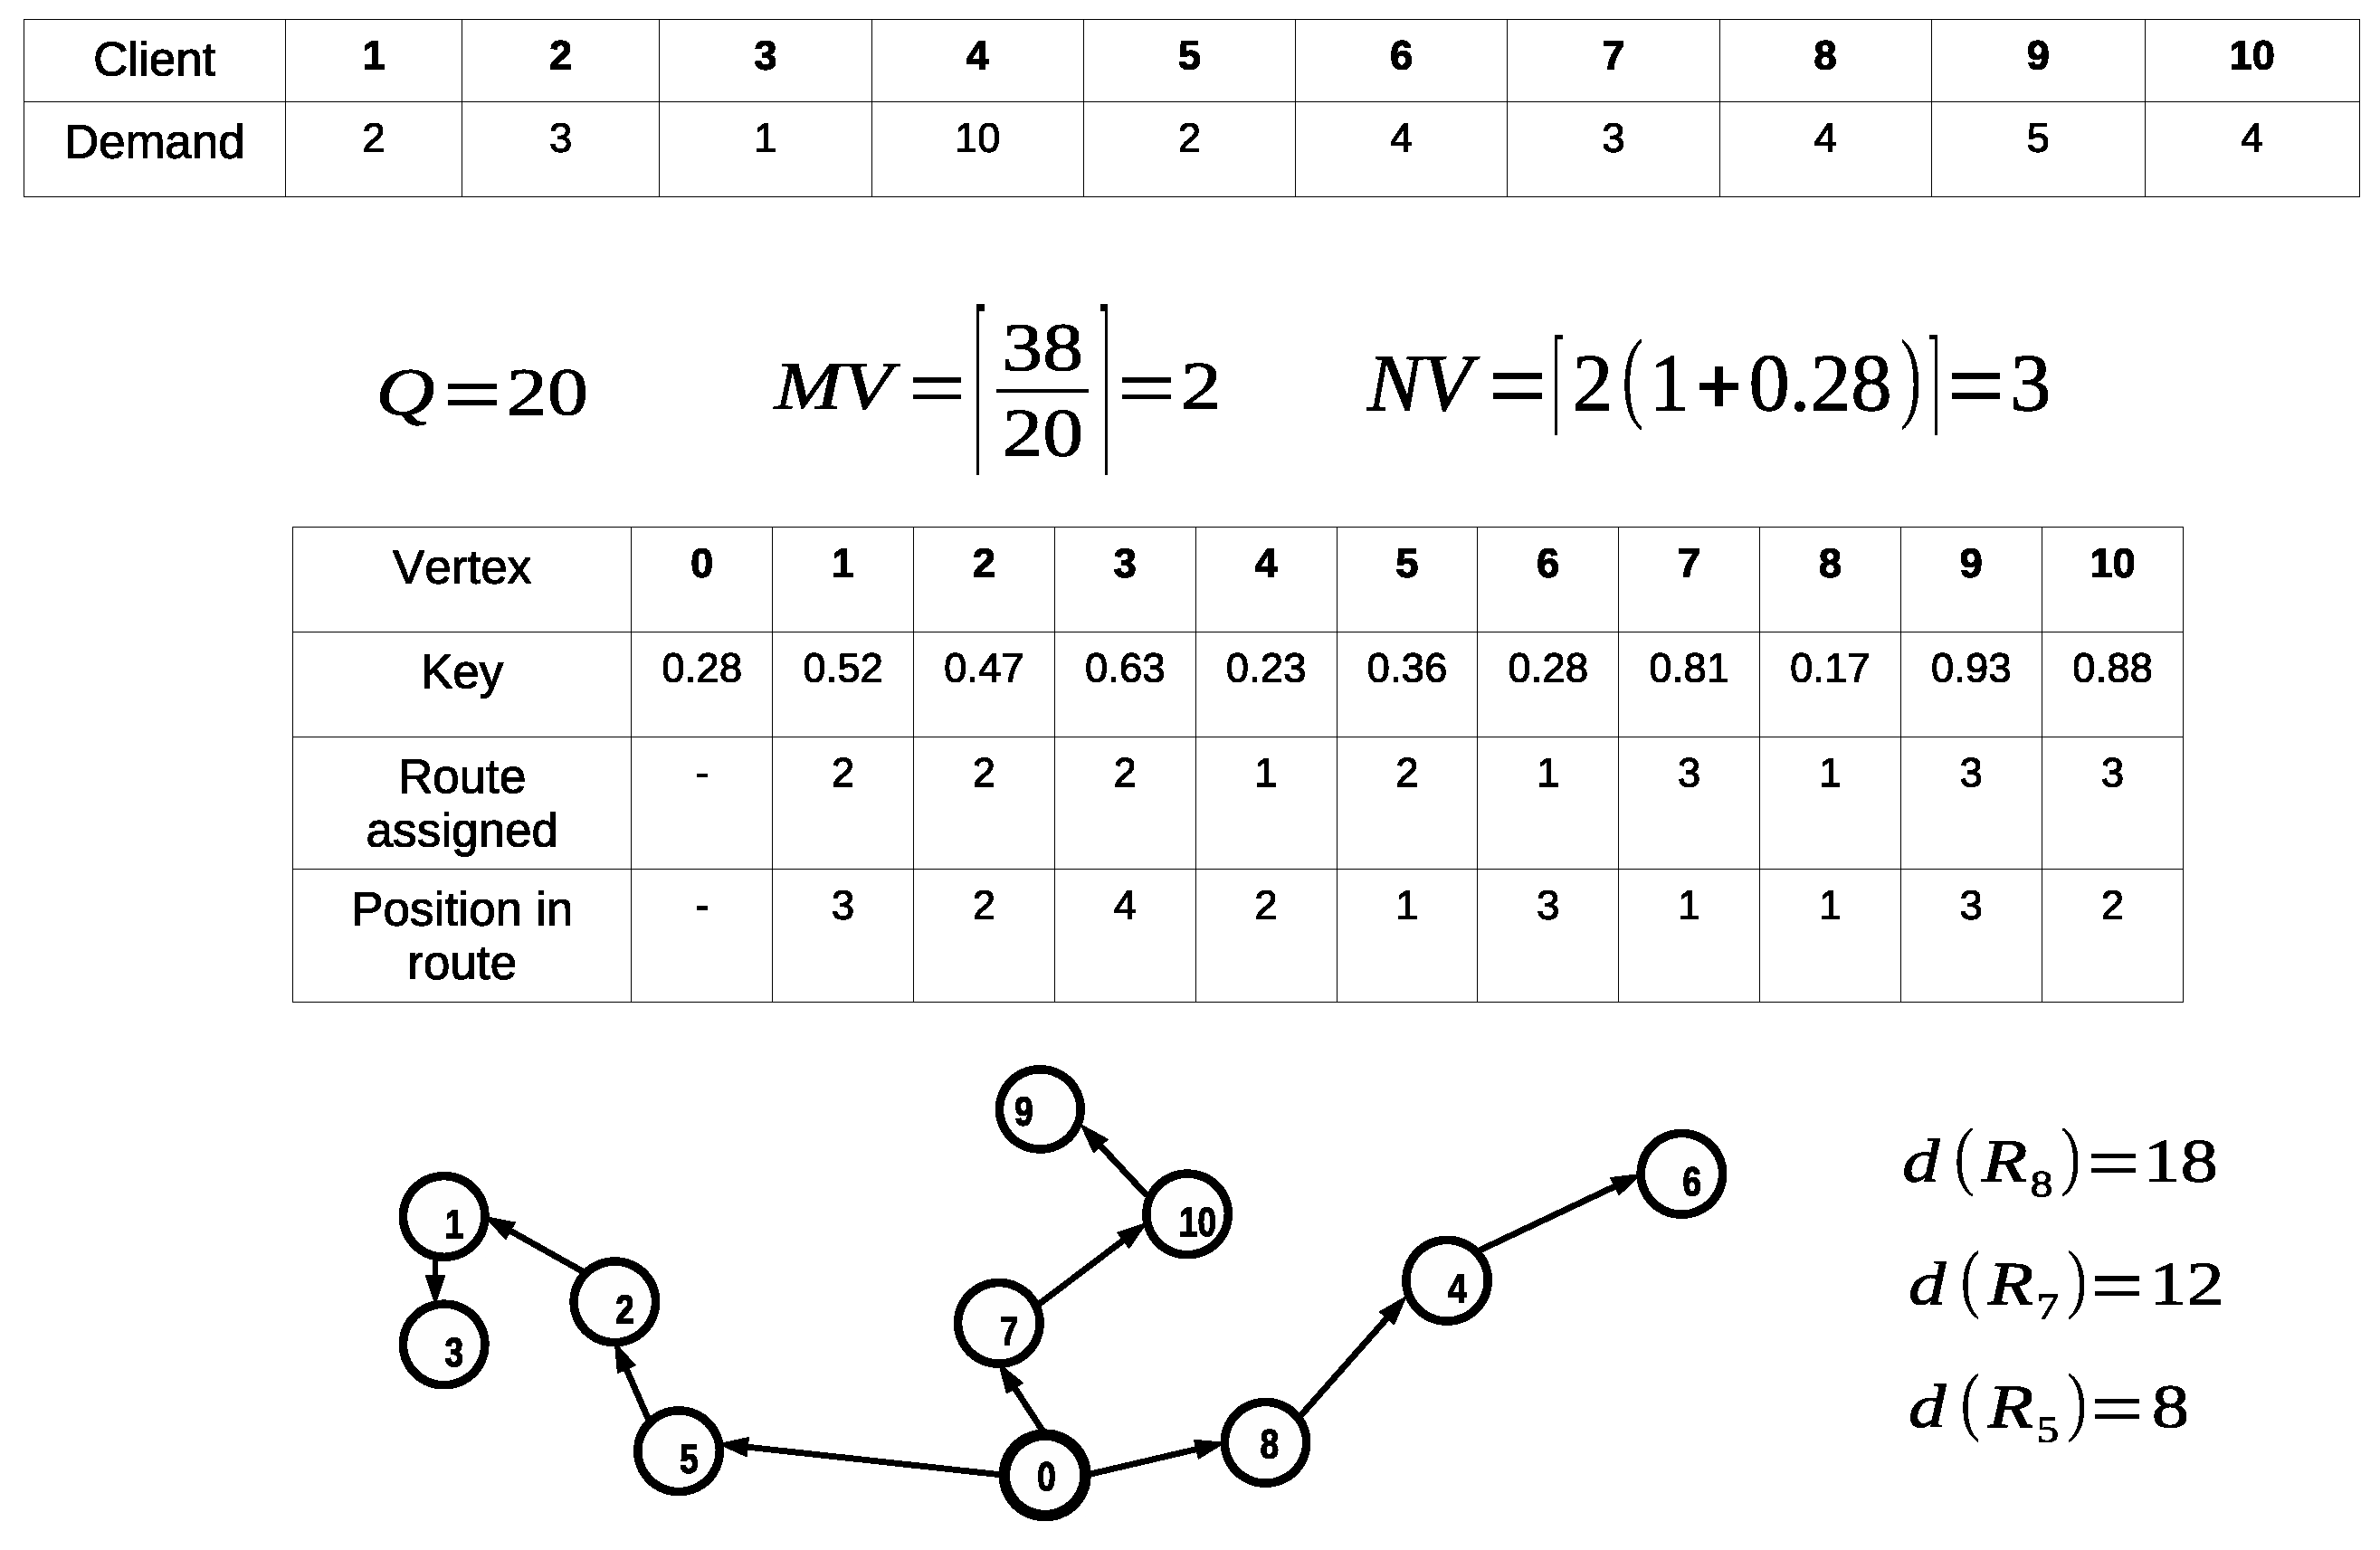
Figure 2 illustrates an example of how the proposed decodification procedure works. In this example, using the demand vector
d, the capacity parameter
and the first key-value
, the minimum and the available number of vehicles are obtained:
and
respectively. Therefore, the interval
is divided into three subintervals which are used to assign clients to vehicles. Clients 4, 6 and 8 are assigned to vehicle number 1; clients 1, 2, 3 and 5 are assigned to vehicle 2; and clients 7, 9 and 10 are assigned to vehicle number 3. For vehicle 1, the assigned vertices are transformed into the route
; for vehicle 2, the resulting route is
. Finally, for vehicle 3, the resulting route is
.
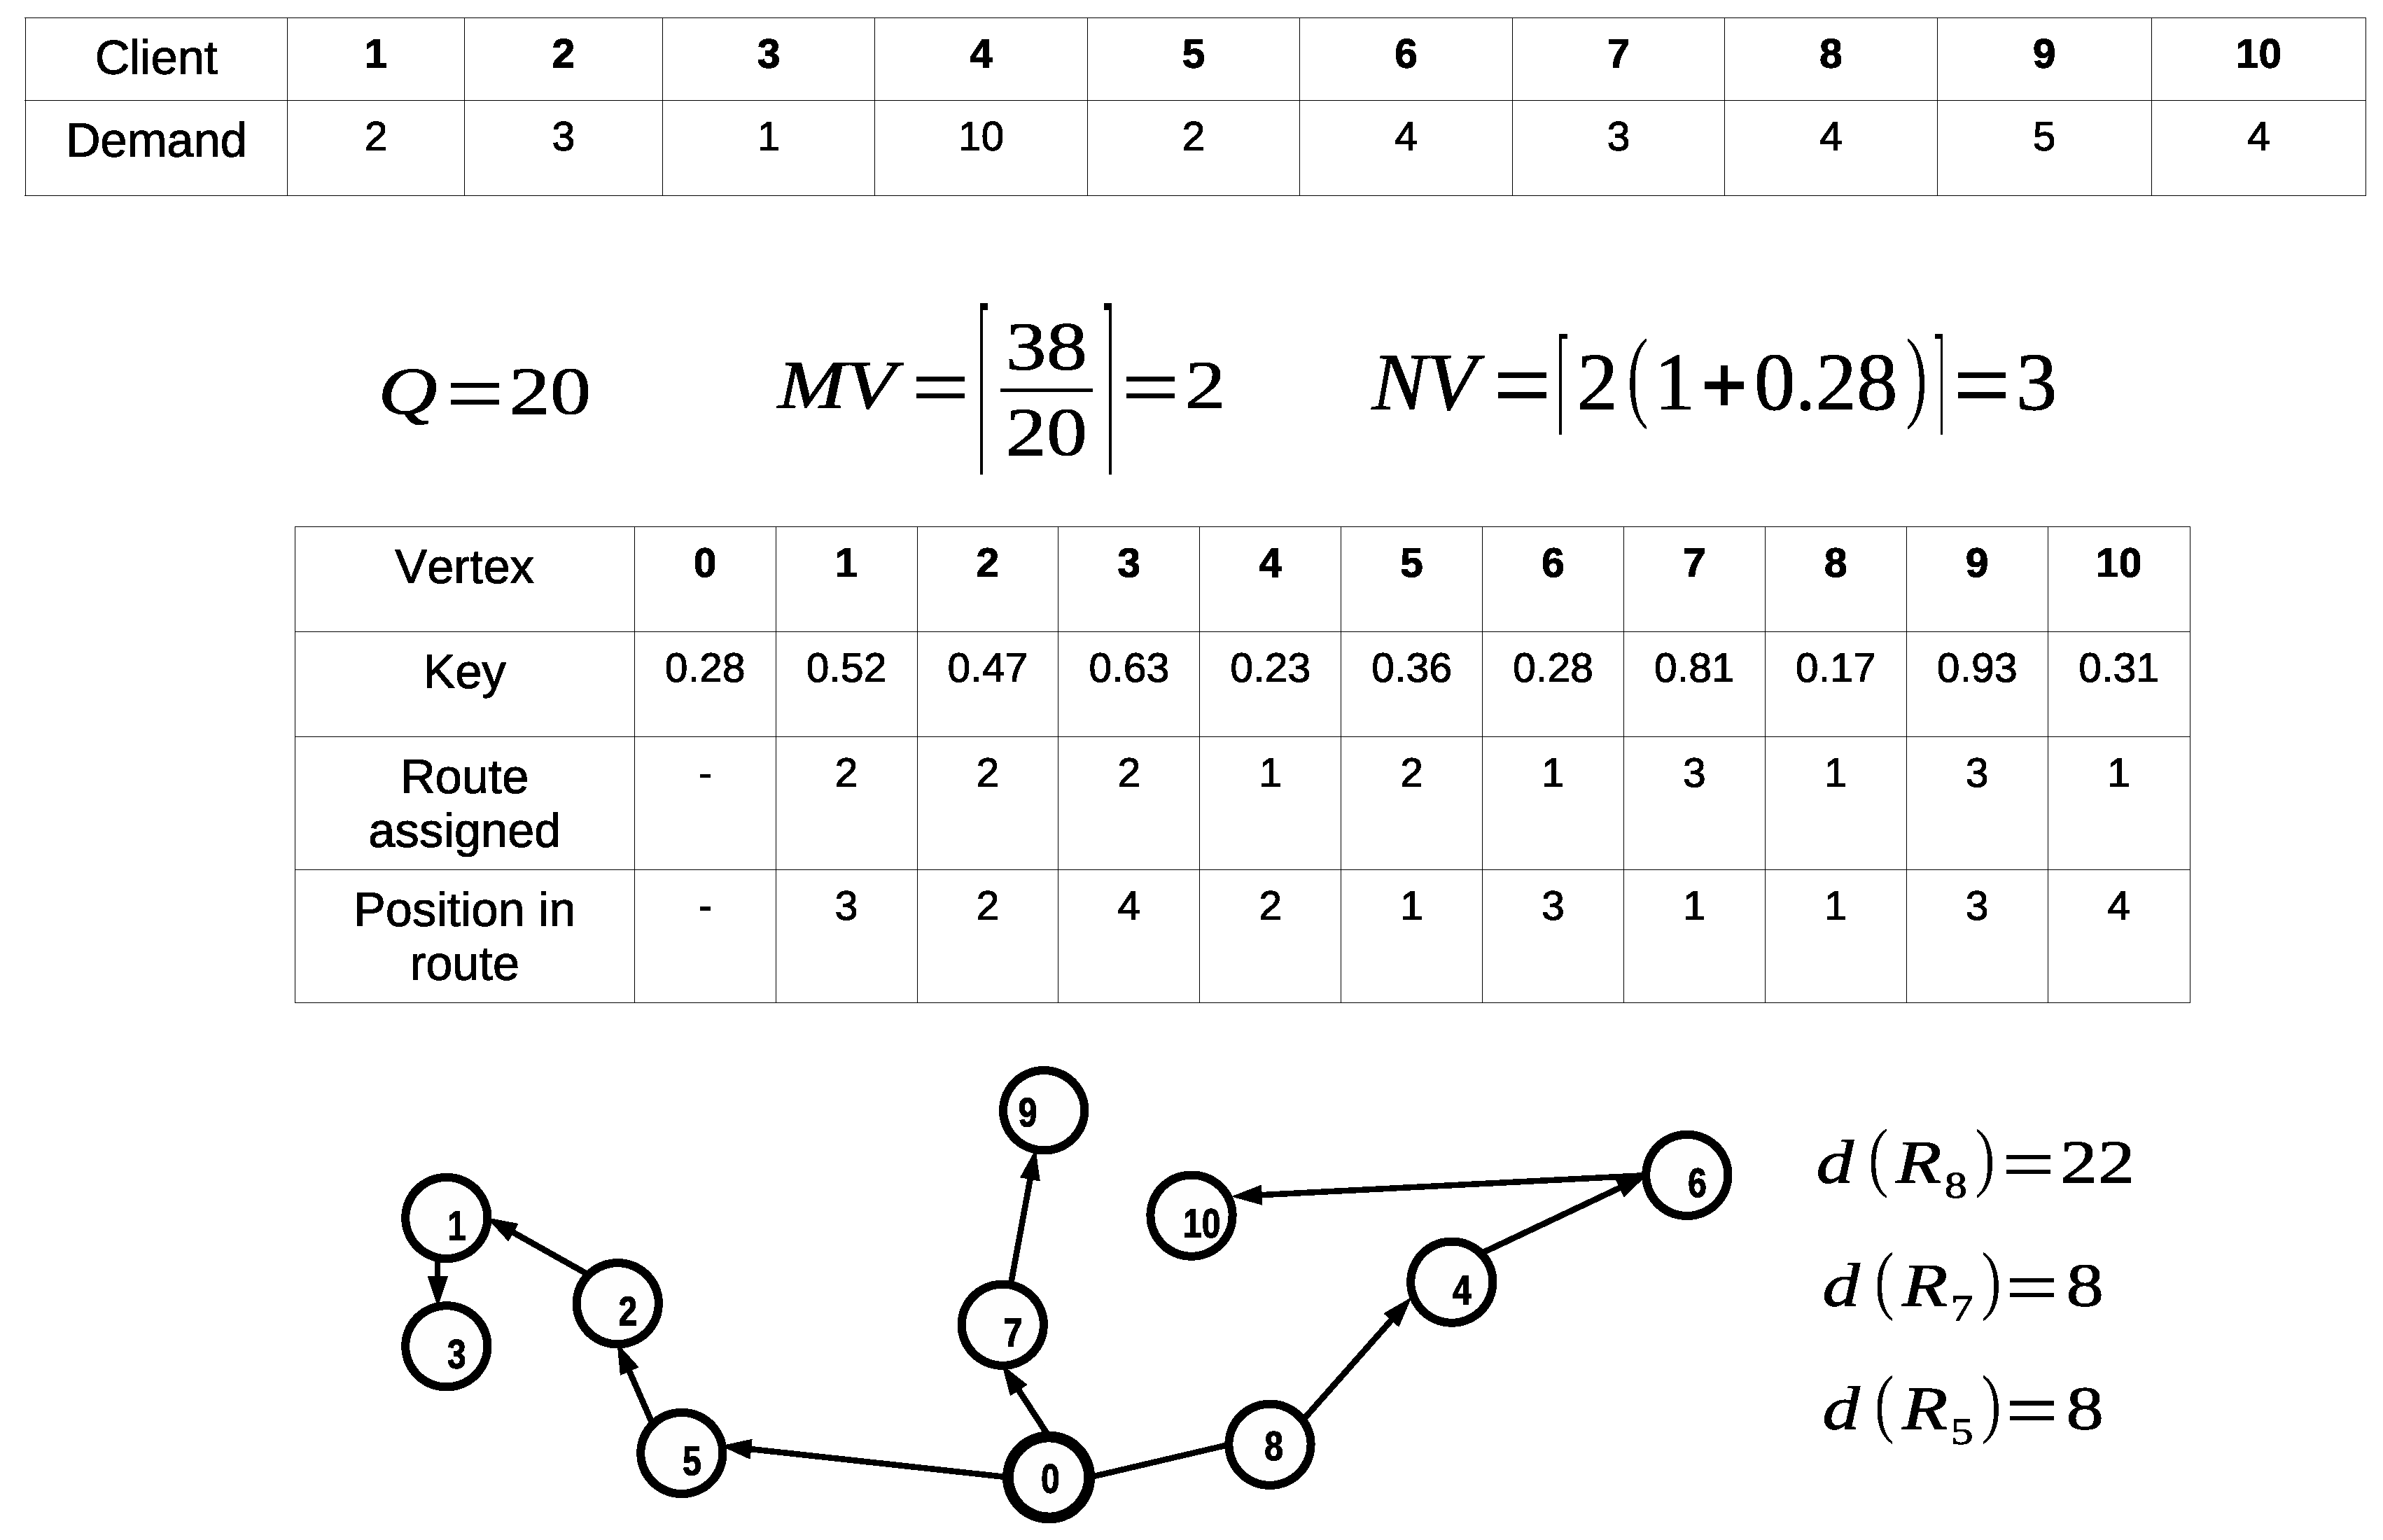
It is relevant to notice that this decodification/codification method can lead to infeasible solutions. In
Figure 3, an example of an infeasible solution is presented. The violation is made over the capacity and maximum distance constraints since for
s-route
,
and
.
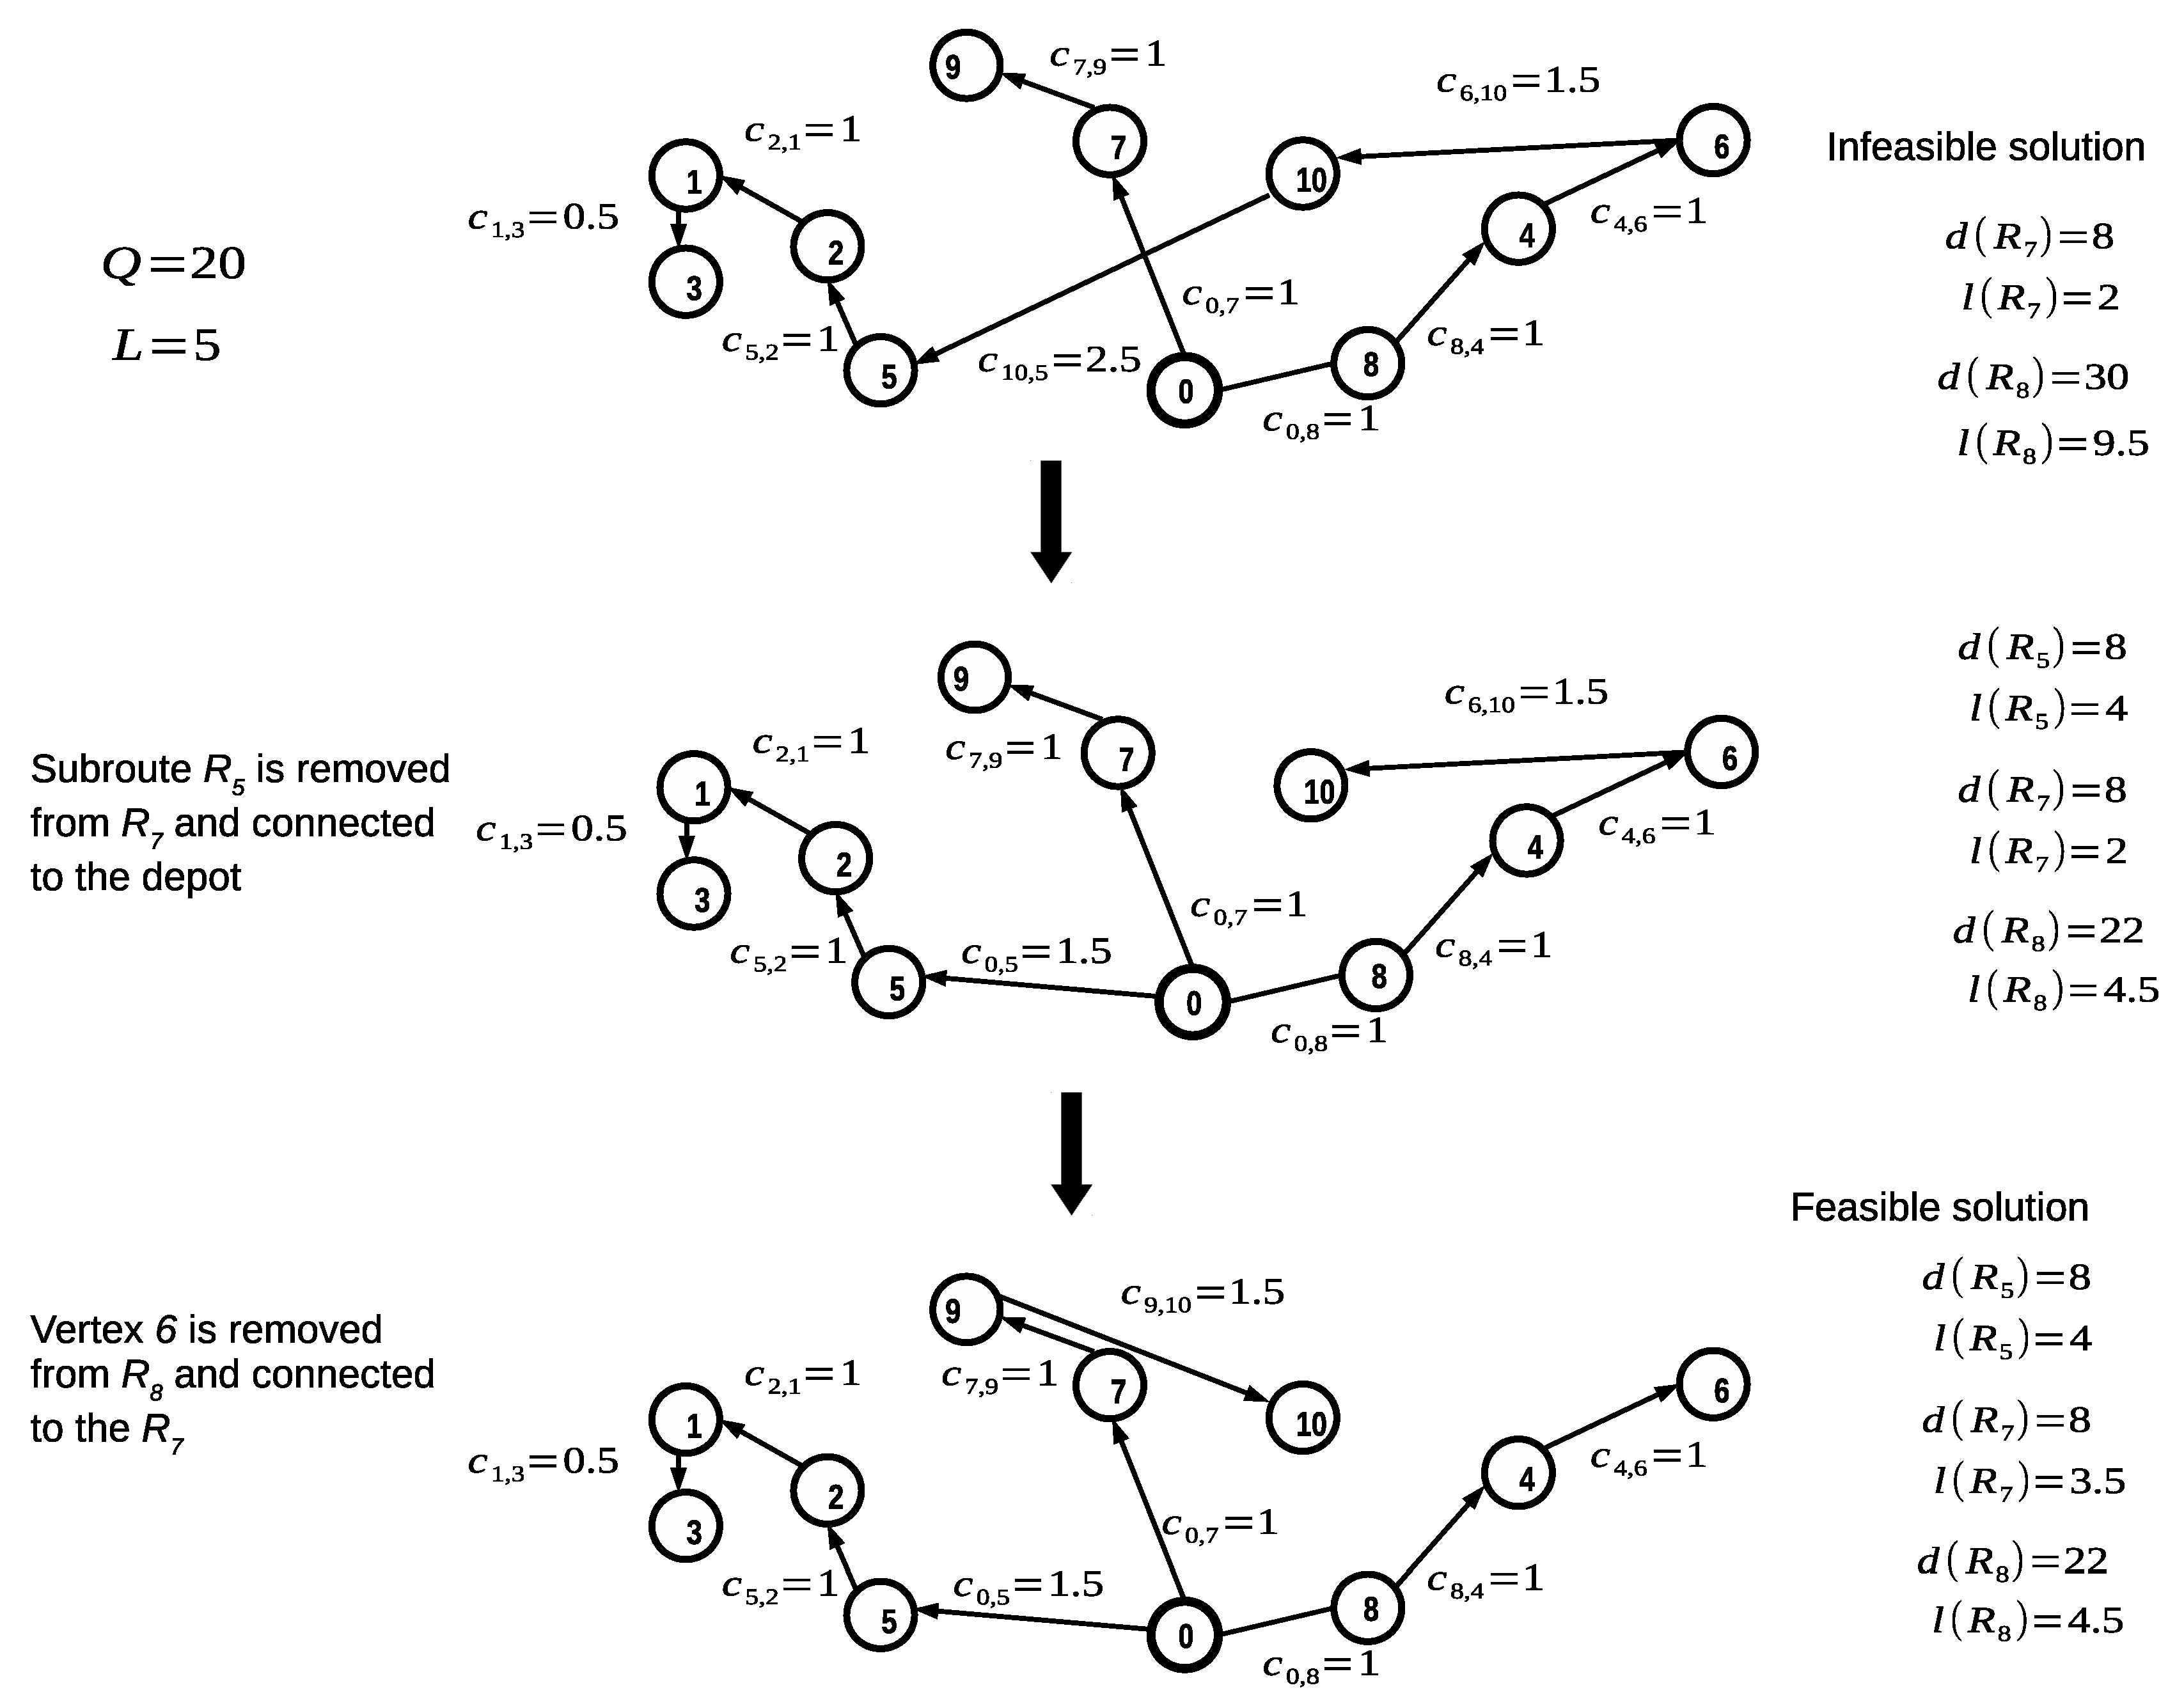
Whenever a solution is infeasible after decoding, it enters the feasibility recovery procedure. The feasibility recovery procedure reassigns subroutes or vertices from the infeasible route to other routes with available capacity and without violating the maximum length constraint. If there are no suitable routes for reassigning a given subroute or vertex, a new route is created by connecting such subroute or vertex directly to the depot. The reassignment is made by replacing arcs on the solution, using the cheapest available that reduces or eliminates the route’s infeasibility.
Figure 4 shows how the feasibility recovery procedure repairs an infeasible solution. In this example,
s-route
violates the capacity and maximum distance constraints (
and
). For recovering feasibility, subroute
is removed from
. Since annexing
to
s-route
will violate the maximum length constraint,
is directly connected to the depot. At this point,
only violates the capacity constraint. Therefore, vertex 10 is removed from
and annexed to
s-route
, leading to a feasible solution.
3.3. Local Search
Once a solution is feasible, it is improved through a local search phase if its objective function value
, is close to the objective function value
of the current best solution
T (
,
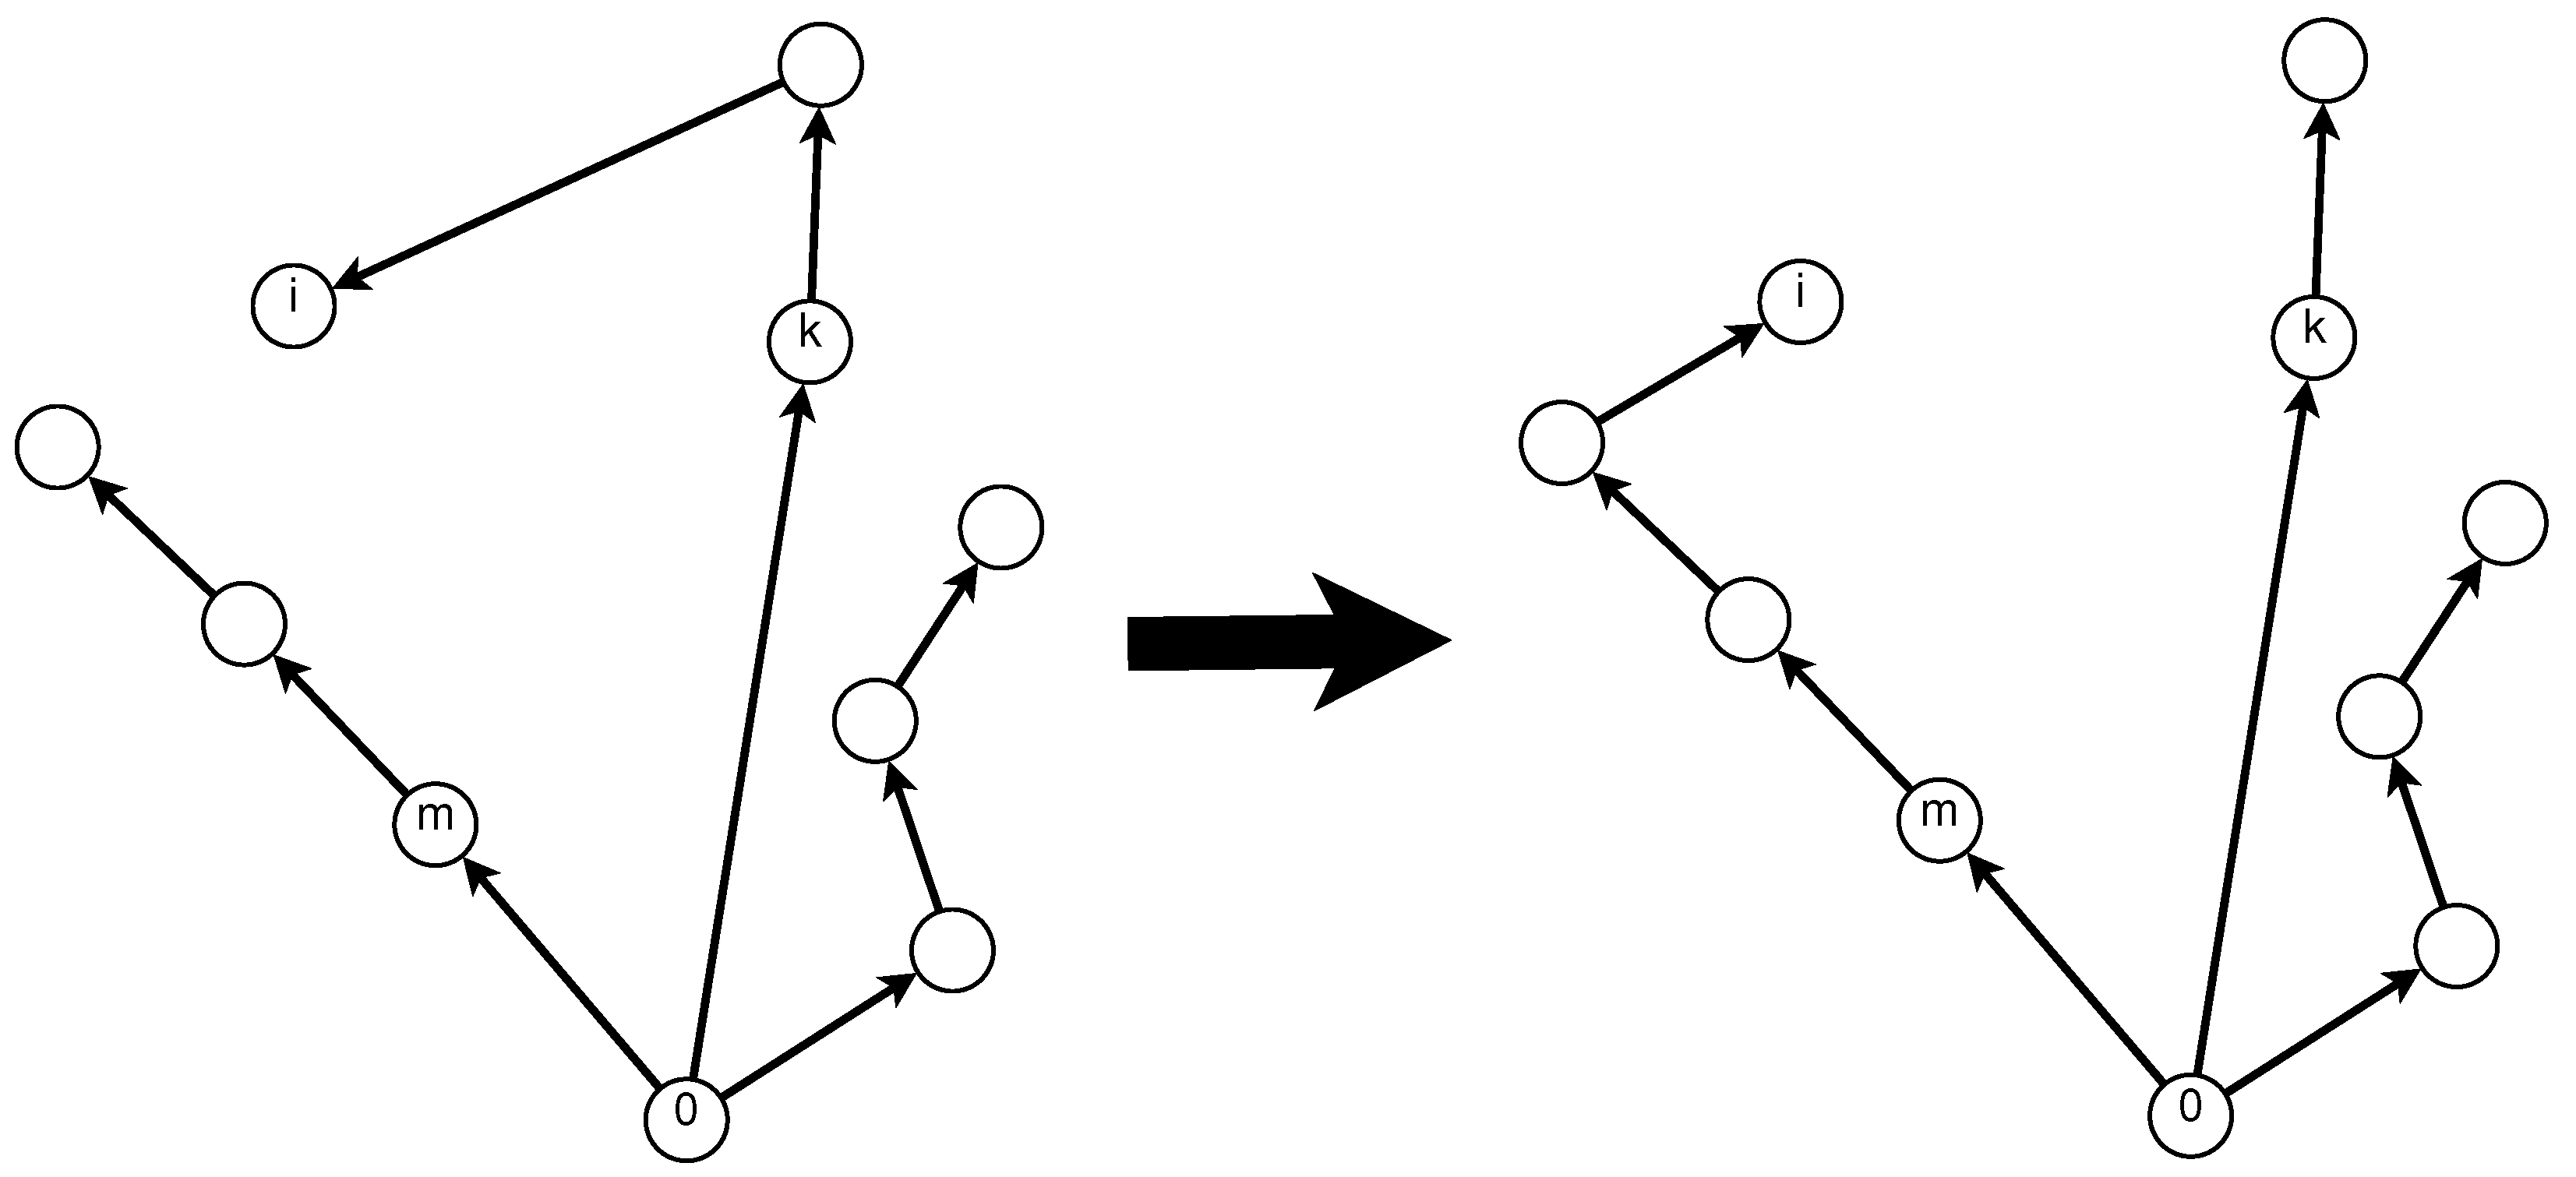
). In the local search, three neighborhoods are explored: (i)
vertex exchange, (ii)
vertex reassignment and (iii)
route merging. Consider two vertices
i and
j belonging respectively, to two different
s-routes
k and
m. In the
neighborhood, vertex
i is removed from
s-route
k and connected to
s-routes
m, while vertex
j is removed from
s-route
m and connected to
s-routes
k (
Figure 5). The
neighborhood is explored by removing vertex
i from
s-routes
k and connecting
i to
s-route
m (
Figure 6). Finally,
s-routes
k and
m are merged into one
s-route (
k) in the
neighborhood (
Figure 7). The three neighborhoods are explored sequentially (
) until no further improvement is found.
3.4. Improvement of Best Solutions
If after the local search, the algorithm finds a new best solution, such a solution is subjected to an improvement phase. Consider the subset of vertices
that contains the vertices assigned to a given
s-route
and the depot. Using
and the associated subset of arcs
, the sub-graph
is built. Associated costs
for every arc
are obtained from the original problem. The cost for the remaining arcs
are substituted using
. Using
and its associated costs, a traveling salesman problem (TSP) can be solved in order to minimize the cost of route
since every route respects the capacity and maximum length constraints. Notice that the solution obtained by the TSP using graph
and its associated costs are equivalent to an open route, since the costs for returning to the depot are equal to zero. Therefore, a TSP problem is solved for every
s-route using the formulation in [
41], leading to a locally optimized solution.
Since all HGOALS components have been explained, it is appropriate to describe the algorithm with the aid of the flow diagram presented in
Figure 1. The first step is to initialize the
P grasshoppers with
continuous random values, and the target solution
T’s objective function is initialized
. Then, the algorithm enters a loop to transform grasshoppers into OVRP solutions. As every grasshopper
enters the loop, the route decoder (comprehensively explained in
Section 3.2) transforms the grasshopper’s continuous values to obtain OVRP solutions in a non-continuous space. If the obtained solution is infeasible, then it enters the feasibility recovery procedure. Once the solution is feasible, its objective function
is computed. If the solution is among the best solutions (
,
) then it enters local search. In the local search, three neighborhoods
,
and
are explored sequentially. After the local search phase, the solution’s objective function
is computed. If
then
T is updated with
. The loop finishes once all grasshoppers have been decoded. At this point, the grasshoppers’ positions are updated using Equation (
10), and the stop criteria are checked. The algorithm finishes when one stop criterion is reached.
4. Computational Experiments
In this Section, test instances are described first, and second, the results from the computational experiments for both of the objective functions previously mentioned are presented.
4.1. Test Instances
For testing the proposed algorithm, three sets of instances were used: group C, group O and group K. The first two sets of instances have been widely used in previous research, while the third set was only used in [
42,
43].
Table 1 shows the characteristics for every group of instances;
n specifies the size of the instances in the group (excluding the depot),
Q specifies the vehicle’s capacity and
L specifies the range for the maximum length allowed for the routes.
Table 1 shows that instances C1–C5, C11–C12 and O1–O8 do not consider route length constraints, while instances C6–C10, C13–C14 and K01–K08 do. For instances C1–C10, O1–O8 and K01–K08 the depot is located at the center of the customers, while for instances C11–C14 the depot is located on an extreme side. Additionally, for instances C11–C14, clients are distributed in clusters over the plane. For instances C1–C10, clients are randomly distributed around the depot. Finally, clients for K and O instances follow a ring-like distribution over the plane.
4.2. Implementation Details
The proposed algorithm was implemented in Matlab. Two criteria were used to stop the algorithm. The first was set to a maximum running CPU time of 1000 s, while the second was to reach 25 iterations without improving the current best solution found. The machine used for the experiments was running Linux with an Intel Core2 Duo, a CPU clock speed of 3.1 GHz and 4 GB of RAM.
4.3. Results with the Hierarchical Objective Function
Table 2 presents the results obtained by the HGOALS for the benchmark problems using a hierarchical objective function. In this case, the first goal is to minimize the number of vehicles, and the second, the total traveling cost. Column
n shows the size of the instance,
Q shows the vehicles capacity,
presents the number of vehicles and
the best-known solution value. Column
shows the average solution value after five runs,
presents the value of the best solution value after five runs,
shows the percentage difference between the best-known solution value and the best solution value obtained by the HGOALS, and
presents the average CPU time per run in seconds, after five runs. Row
presents the average for columns
and
. Results in bold format show that the algorithm found the best know solution for the instance. Results in bold and underlined show the algorithm improved the best-known solution for the benchmark problem. The symbol ‘**’ is used to indicate that the algorithm found solutions with a new minimum number of vehicles. When the number of vehicles from the best-known solution is different of the best solution obtained by the HGOALS, the number of vehicles used by the best-known solution is shown in column
. The results show that the algorithm was able to improve the best-known solutions for seven instances in group C, five on group K and one in group O.
Therefore, the HGOALS is capable of improving the best-known solution for 15 of the 30 benchmark problems. Notice that 11 of the improved best-known solutions where from instances considering route length constraints. The algorithm also finds the best-known solutions for the other five instances. Other relevant results are the new best solutions for instances C6, C13, C14 and O4 that use fewer vehicles (5, 10, 10 and 9, respectively) than the solutions found in previous research (6, 11, 11 and 10). Finally, the algorithm struggles with the C11 instance. The average percentage deviation from the best-known solution (gap) is the worst for all benchmark problems (). The reason is the cluster distribution of the clients and the tendency of the feasibility recovery procedure to create more routes than the minimum required. Note that instance C6 has a higher gap, but it uses fewer vehicles than the best-known solution.
The CPU times increase significantly as the benchmark problem size increases. The algorithm reached the 1000 s limit for seven of the benchmark instances, two from set O and five from set K. The algorithm performs the worst in the set O with an average deviation from the best-known solution of . For group C, the algorithm performs the best having an average deviation from the best-known solutions of , while for group K this metric is .
Table 3 compares the proposed algorithm with the results from previous research. Considering all instances in group C, the HGOALS outperforms the other algorithms. The Broad Local Search Algorithm (BLSA) performs better than the HGOALS in instances without route length constraints in this group. The HGOALS performs the best in instances with route length constraints, improving the best-known solutions for six of the seven instances. The HGOALS obtains new best solutions for C2, C6, C7, C9, C10, C13 and C14. For instances C6, C13 and C14 the algorithm found solutions using one less vehicle. Finally, it is relevant to mention that the algorithm struggles with C11 instance obtaining the largest gap (
). The latter instance has a cluster like distribution.
The comparison of the results with previous research for instances in group O is made in
Table 4. In this set of instances, the BLSA performs the best obtaining the best-known solutions for six of the eight benchmark problems. On the other hand, the HGOALS performs better than the other algorithms (except BLSA), and finds a new best solution for instance O4 using nine vehicles instead of ten. Notice that test problems in this set do not consider route length constraints.
Finally,
Table 5 compares results for instances in group K. The comparison is made with upper bounds obtained by the GRASP algorithm proposed in [
42] and the BRKGA in [
48]. The results show that the HGOALS outperforms the other two metaheuristics by obtaining six new best solutions for the eight instances in the set. In this set, all benchmark problems consider route length constraints.
4.4. Results with the Traveling Cost Minimization Objective Function
The obtained results by the HGOALS for the benchmark problems with the second objective function of minimizing the total traveling cost are presented in
Table 6. The results show that the algorithm was able to improve three of the 14 instances of group C, one of group O and five on group K. The HGOALS also reaches the best-known solutions for five instances in group C and one for group K.
The results show that the proposed algorithm is capable of improving the best-known solution in nine of the 30 instances used to test the algorithm. Notice that eight of these instances consider route length constraints. It is also capable of finding the best-known solutions in other nine test instances. In brief, the HGOALS matches or improves the best-known solutions for 18 of the 30 test instances. On the other hand, the CPU times required by the algorithm reach 1000 s for six instances in group O. It is also in this group where the algorithm performs the worst with an average deviation from the best solution of . For group K, the algorithm performs the best having an average deviation from the best solution of , while for group C this metric is of .
Table 7 compares the proposed algorithm with previous research for benchmark problems in group C. For instances with no route length constraints, the HGOALS performs worse than the BLSA and BRKGA but better than the other algorithms. For the benchmark problems including route length constraints, the HGOALS performs better than the rest of the algorithms obtaining new best solutions for instances C9, C10 and C13 and reaching the best-known solutions for instances C6, C7 and C14.
The comparison of the results with previous research for instances of group O is made in
Table 8. In this set of instances, the BLSA performs the best obtaining the best-known solutions for six of the eight instances, followed by the HGOALS obtaining the best-known solution for one of the eight instances.
For the benchmark problems in group K, the comparison with results obtained in previous research is made in
Table 9. The results show that the HGOALS outperforms the other two metaheuristics by obtaining five new best solutions for the eight instances in the group.
4.5. Comparison of Average CPU Times with Previous Research
Finally, a comparison of the computational effort required by each of the solution methods is presented in
Table 10 and
Table 11. Rows C, O and K present the mean for the different sets of test instances of the average CPU time per run reported by the different solutions methods. Row
shows the number of best-known solutions found and the number of tested instances by each algorithm. Finally, row
presents the CPU model used by each algorithm and row
, the SPECint2000 (
https://www.spec.org/cpu2000/results/) and SPECint2006 (
http://www.spec.org/cpu2006/results/cint2006.html) base score, along with an estimate of the computing times reduction factor.
In terms of CPU times, the HGOALS has slightly higher average CPU times, when compared with the BBMO, BLSA, HBMO and ORTR, although it obtains better results. It has lower average CPU times when compared with MVNS, HES, TSB, ALNS and BRKGA.
5. A Case Study
A security and alarm company requires its payment collection routes to be more efficient for two reasons: the first is to reduce the days required to collect payments, and the second is to reduce the fuel consumption used by the company representative. The company provides alarm and security services on a monthly or yearly basis. Customers choose the type of service they require and pay on the same basis. Therefore, at the beginning of each month, the company requires to collect payment from around 100 customers. Payment collection routes were decided by the company representative based on his experience and usually took between three to four weeks to be completed (15 to 20 working days). The company provided the addressees of customer required to pay in the next two months. They also set a maximum number of customers to be visited per day (15 per day) and a maximum of working hours per day (seven hours). Finally, they provided the routes planned by the company representative in charge of collecting the payments for the next two months. A geographic information system (GIS), customers’ addresses, and a web-based tool were used to build cost(distance) and time matrices to feed the algorithm. Such matrices were non-symmetric. The capacity parameter was set to
, the service time was set to
hours and the maximum route length to
hours. The algorithm was run five times using this information and the best solution was chosen. The results are presented in
Table 12, where columns
Dist CRP,
Days CRP,
Dist HGOALS and
Days HGOALS show the total distance and required days for the routes planned by the company representative and the routes obtained by the HGOALS respectively. Columns
Dist % red and
Days % red show the percentaje reduction in total distance and working days obtained with the use of HGOALS proposed routes instead of the planned routes by the company representative. Finally, column
CPU denotes the CPU time in seconds required by the algorithm and column
%gap the gap with the best solution obtained by using a modified version (directed) of the formulation in [
49] on CPLEX. This last column was added to verify the performance of the algorithm on real-life instances. For the exact method, a maximum CPU time was set to
s.
The results show a significant reduction in terms of total distance and working days. The routes obtained by the HGOALS are more efficient than those planned by the company representative. Moreover, fuel consumption is also importantly reduced due to the reduction in the total distance to be traveled. Note that the associated demand for each customer is the same (). Considering unitary demands helps the HGOALS reach the optimal solution with a small computational effort.
6. Concluding Remarks
A new hybrid grasshopper algorithm is presented and used to solve the open vehicle routing problem with capacity and maximum distance constraints. The OVRP is a variant of the classic VRP and has multiple applications, especially in transportation and distribution services. It is also a difficult combinatorial optimization problem of the NP-Hard type. The novel decoder first defines the number of vehicles to be used in the solution and then assigns clients to them. Such an approach allows the algorithm to find a balance between transmitting genetic information and allowing diversification of the population. The combination of the decoder with the local search and improvement phase grants robustness to the proposed heuristic. The last because the algorithm is capable of solving instances of up to 480 vertices without changing any parameter. The computational experiments considered two different objective functions. In the first, the prime objective is to minimize the number of vehicles to be used. In the second case, the total traveled distance is minimized. The results also show the excellent performance of the algorithm, especially in benchmark problems considering maximum distance constraints. For the first objective function, the algorithm improves or finds the best-known solutions for 21 of the 30 benchmark problems. For the second objective function, 18 of the 30 best-known solutions were found or improved by the algorithm. For the 30 benchmark problems considering distance constraints (including both objective functions), the algorithm found or improved the best-known solution for 21 of them. A comparison of the proposed algorithm with other heuristics in the literature shows its efficiency in terms of solutions quality, particularly in benchmark problems with maximum distance constraints. Additionally, the algorithm was used to solve instances in a case study with excellent results. Finally, in future research, the algorithm can incorporate constraints related to time windows, heterogeneous fleet or hiring costs, among others.
