
Low-Velocity Impact Response of Novel TPMS and Stochastic Lattice Cores of Sandwich Structures

 , , , and
Abstract
1. Introduction
2. Materials and Methods
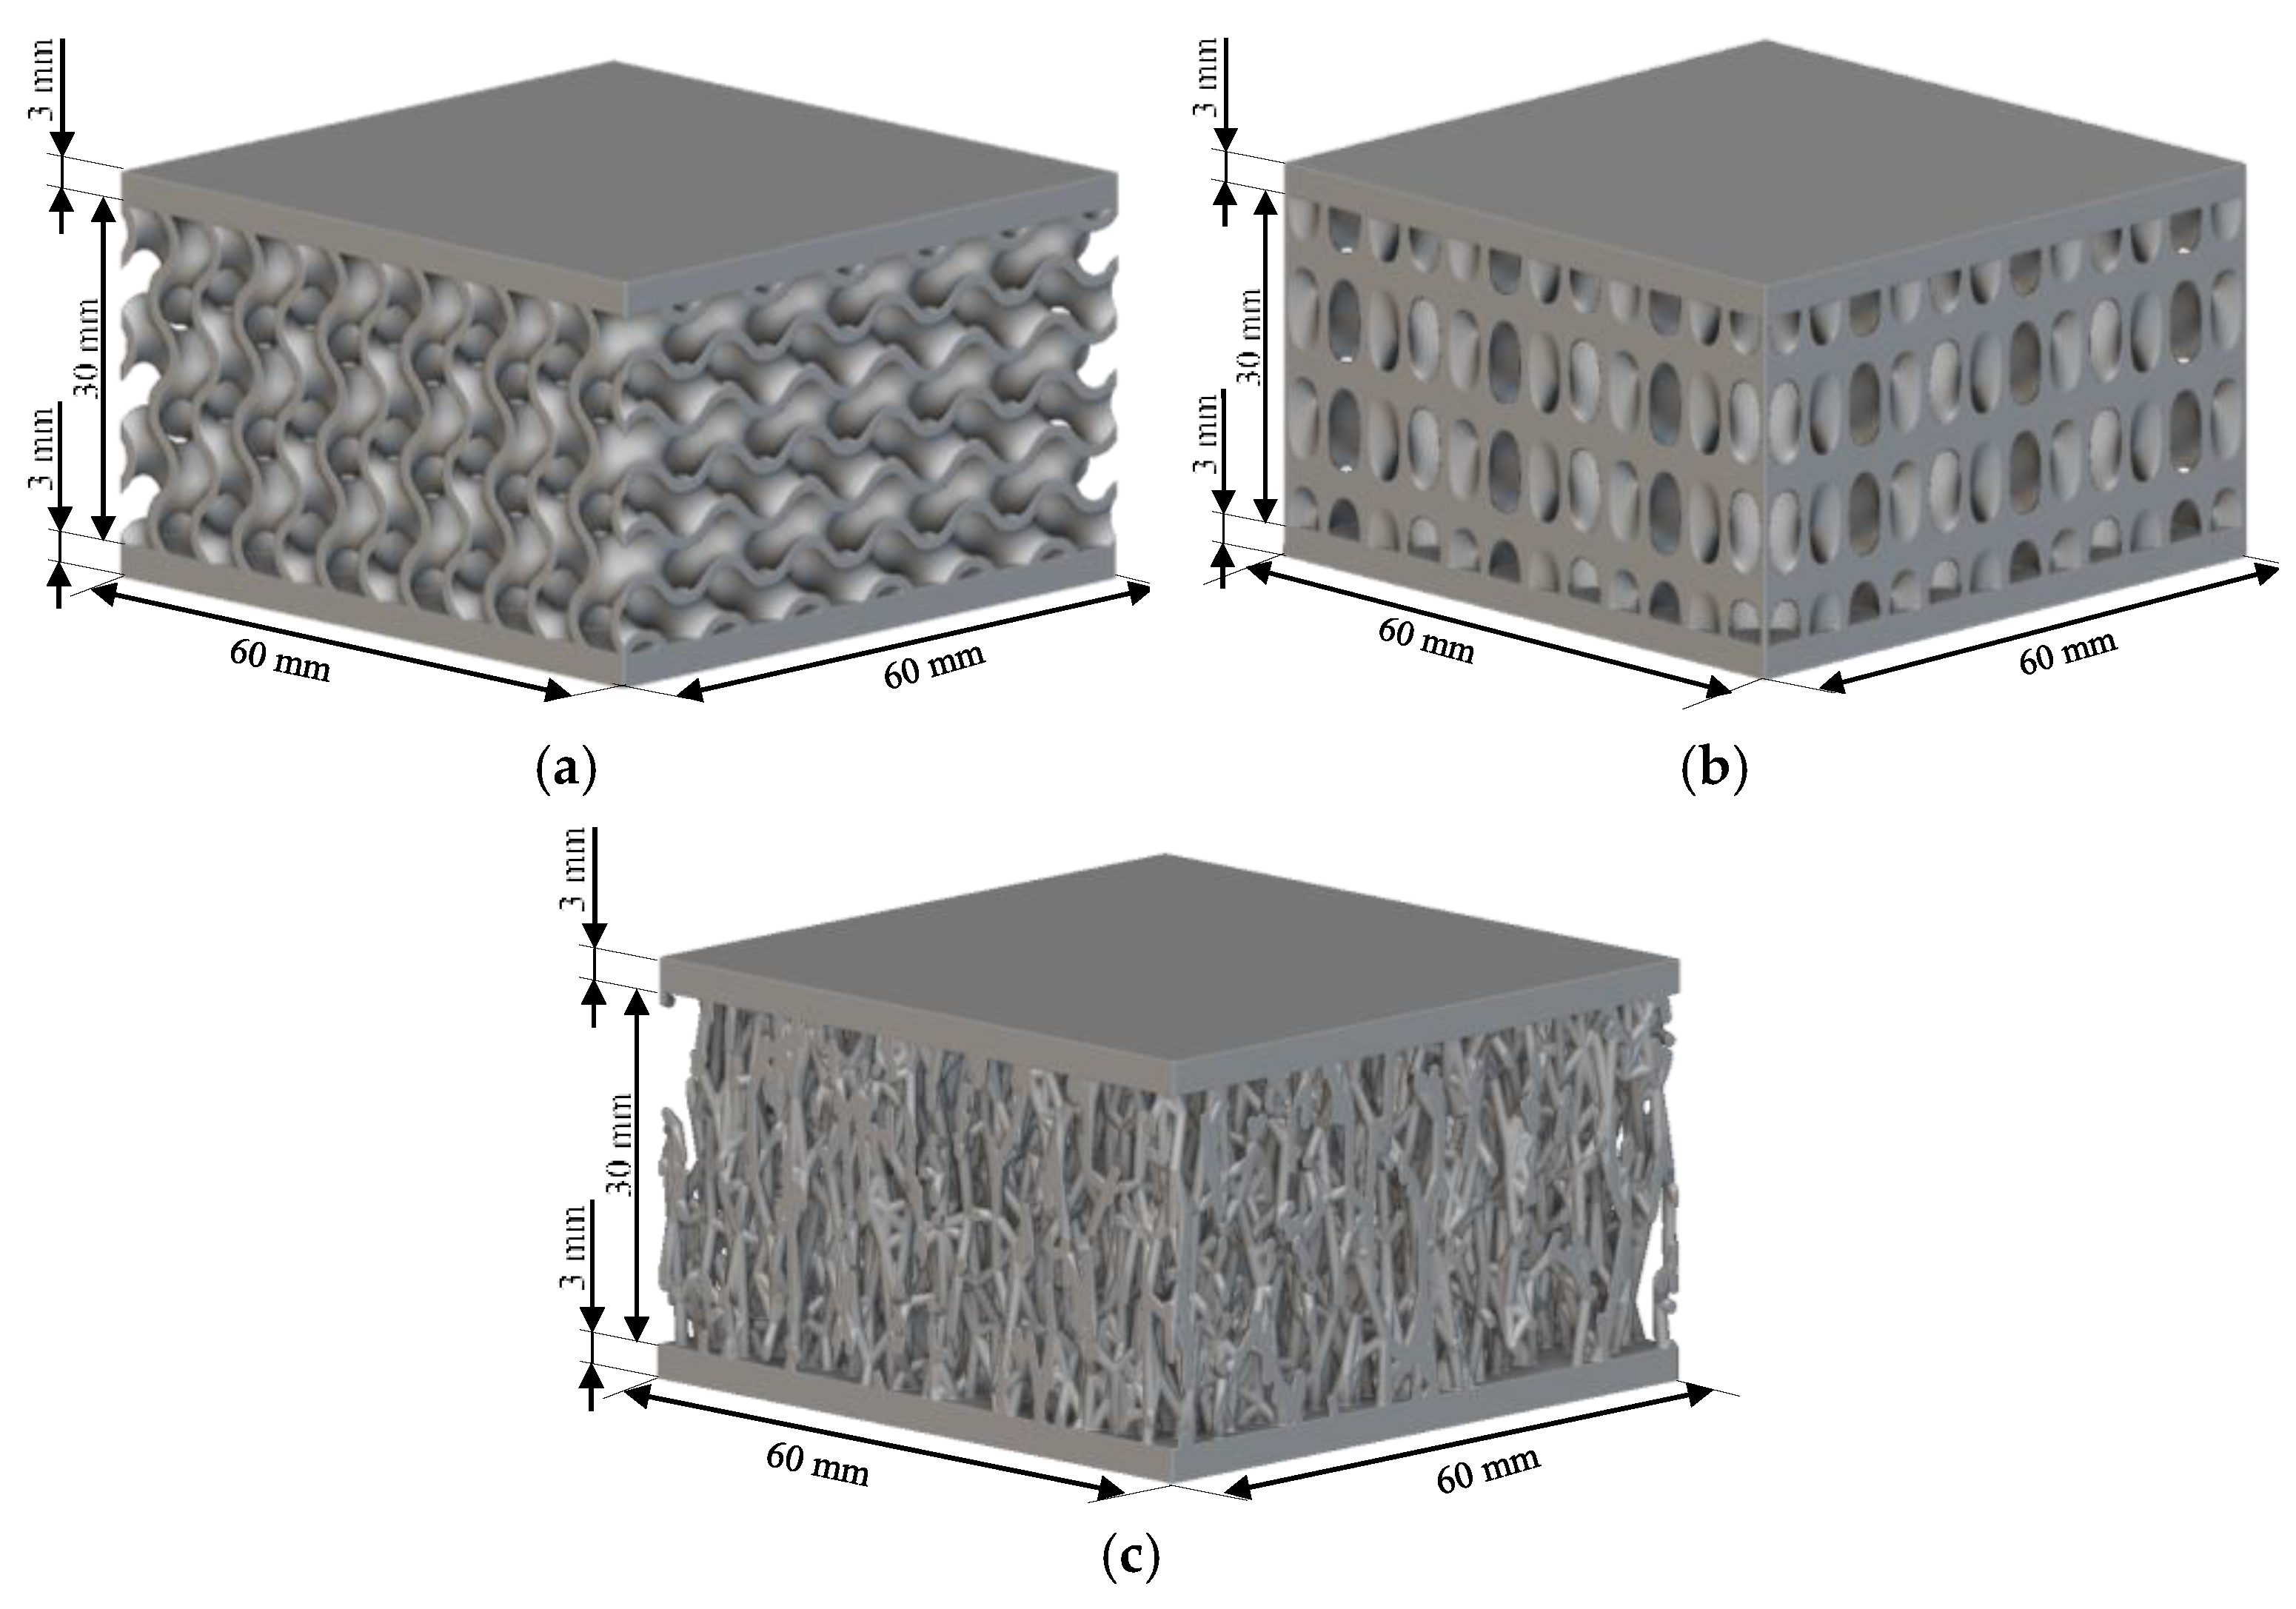
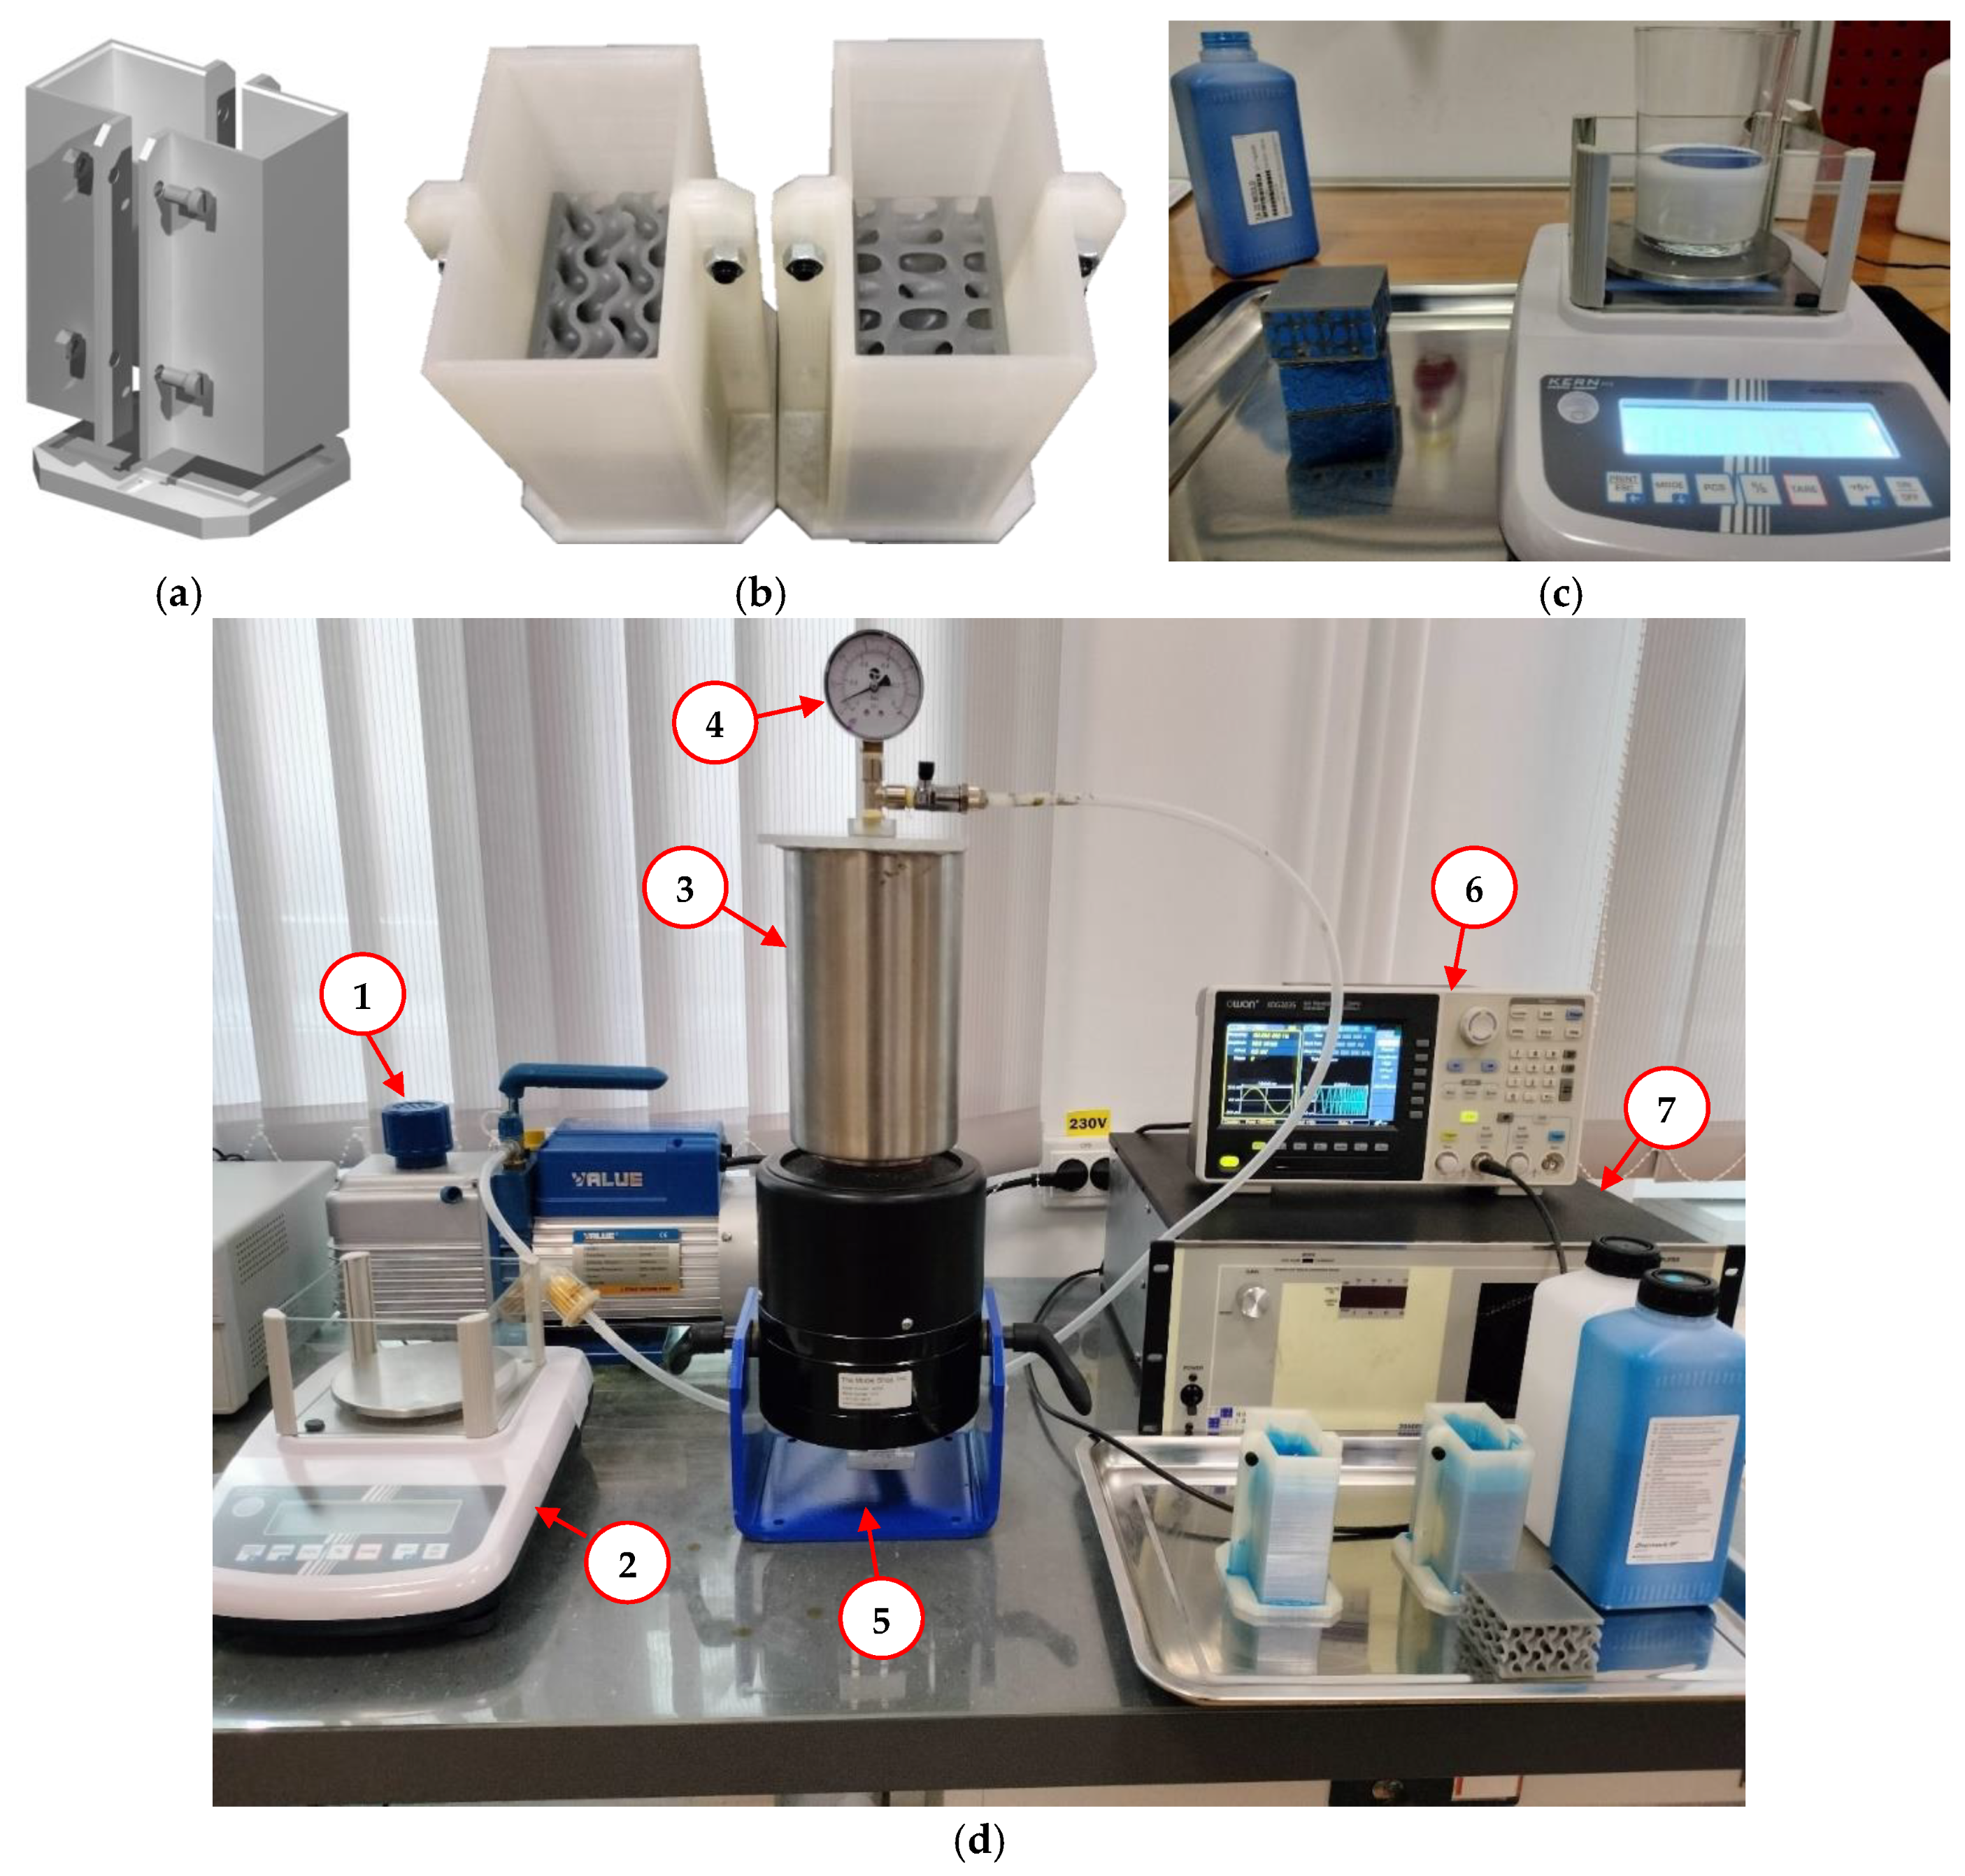
2.1. Sample Preparation
2.2. Low-Speed Impact Test System Configuration
2.3. Parameters Evaluated During Impact Tests
3. Results
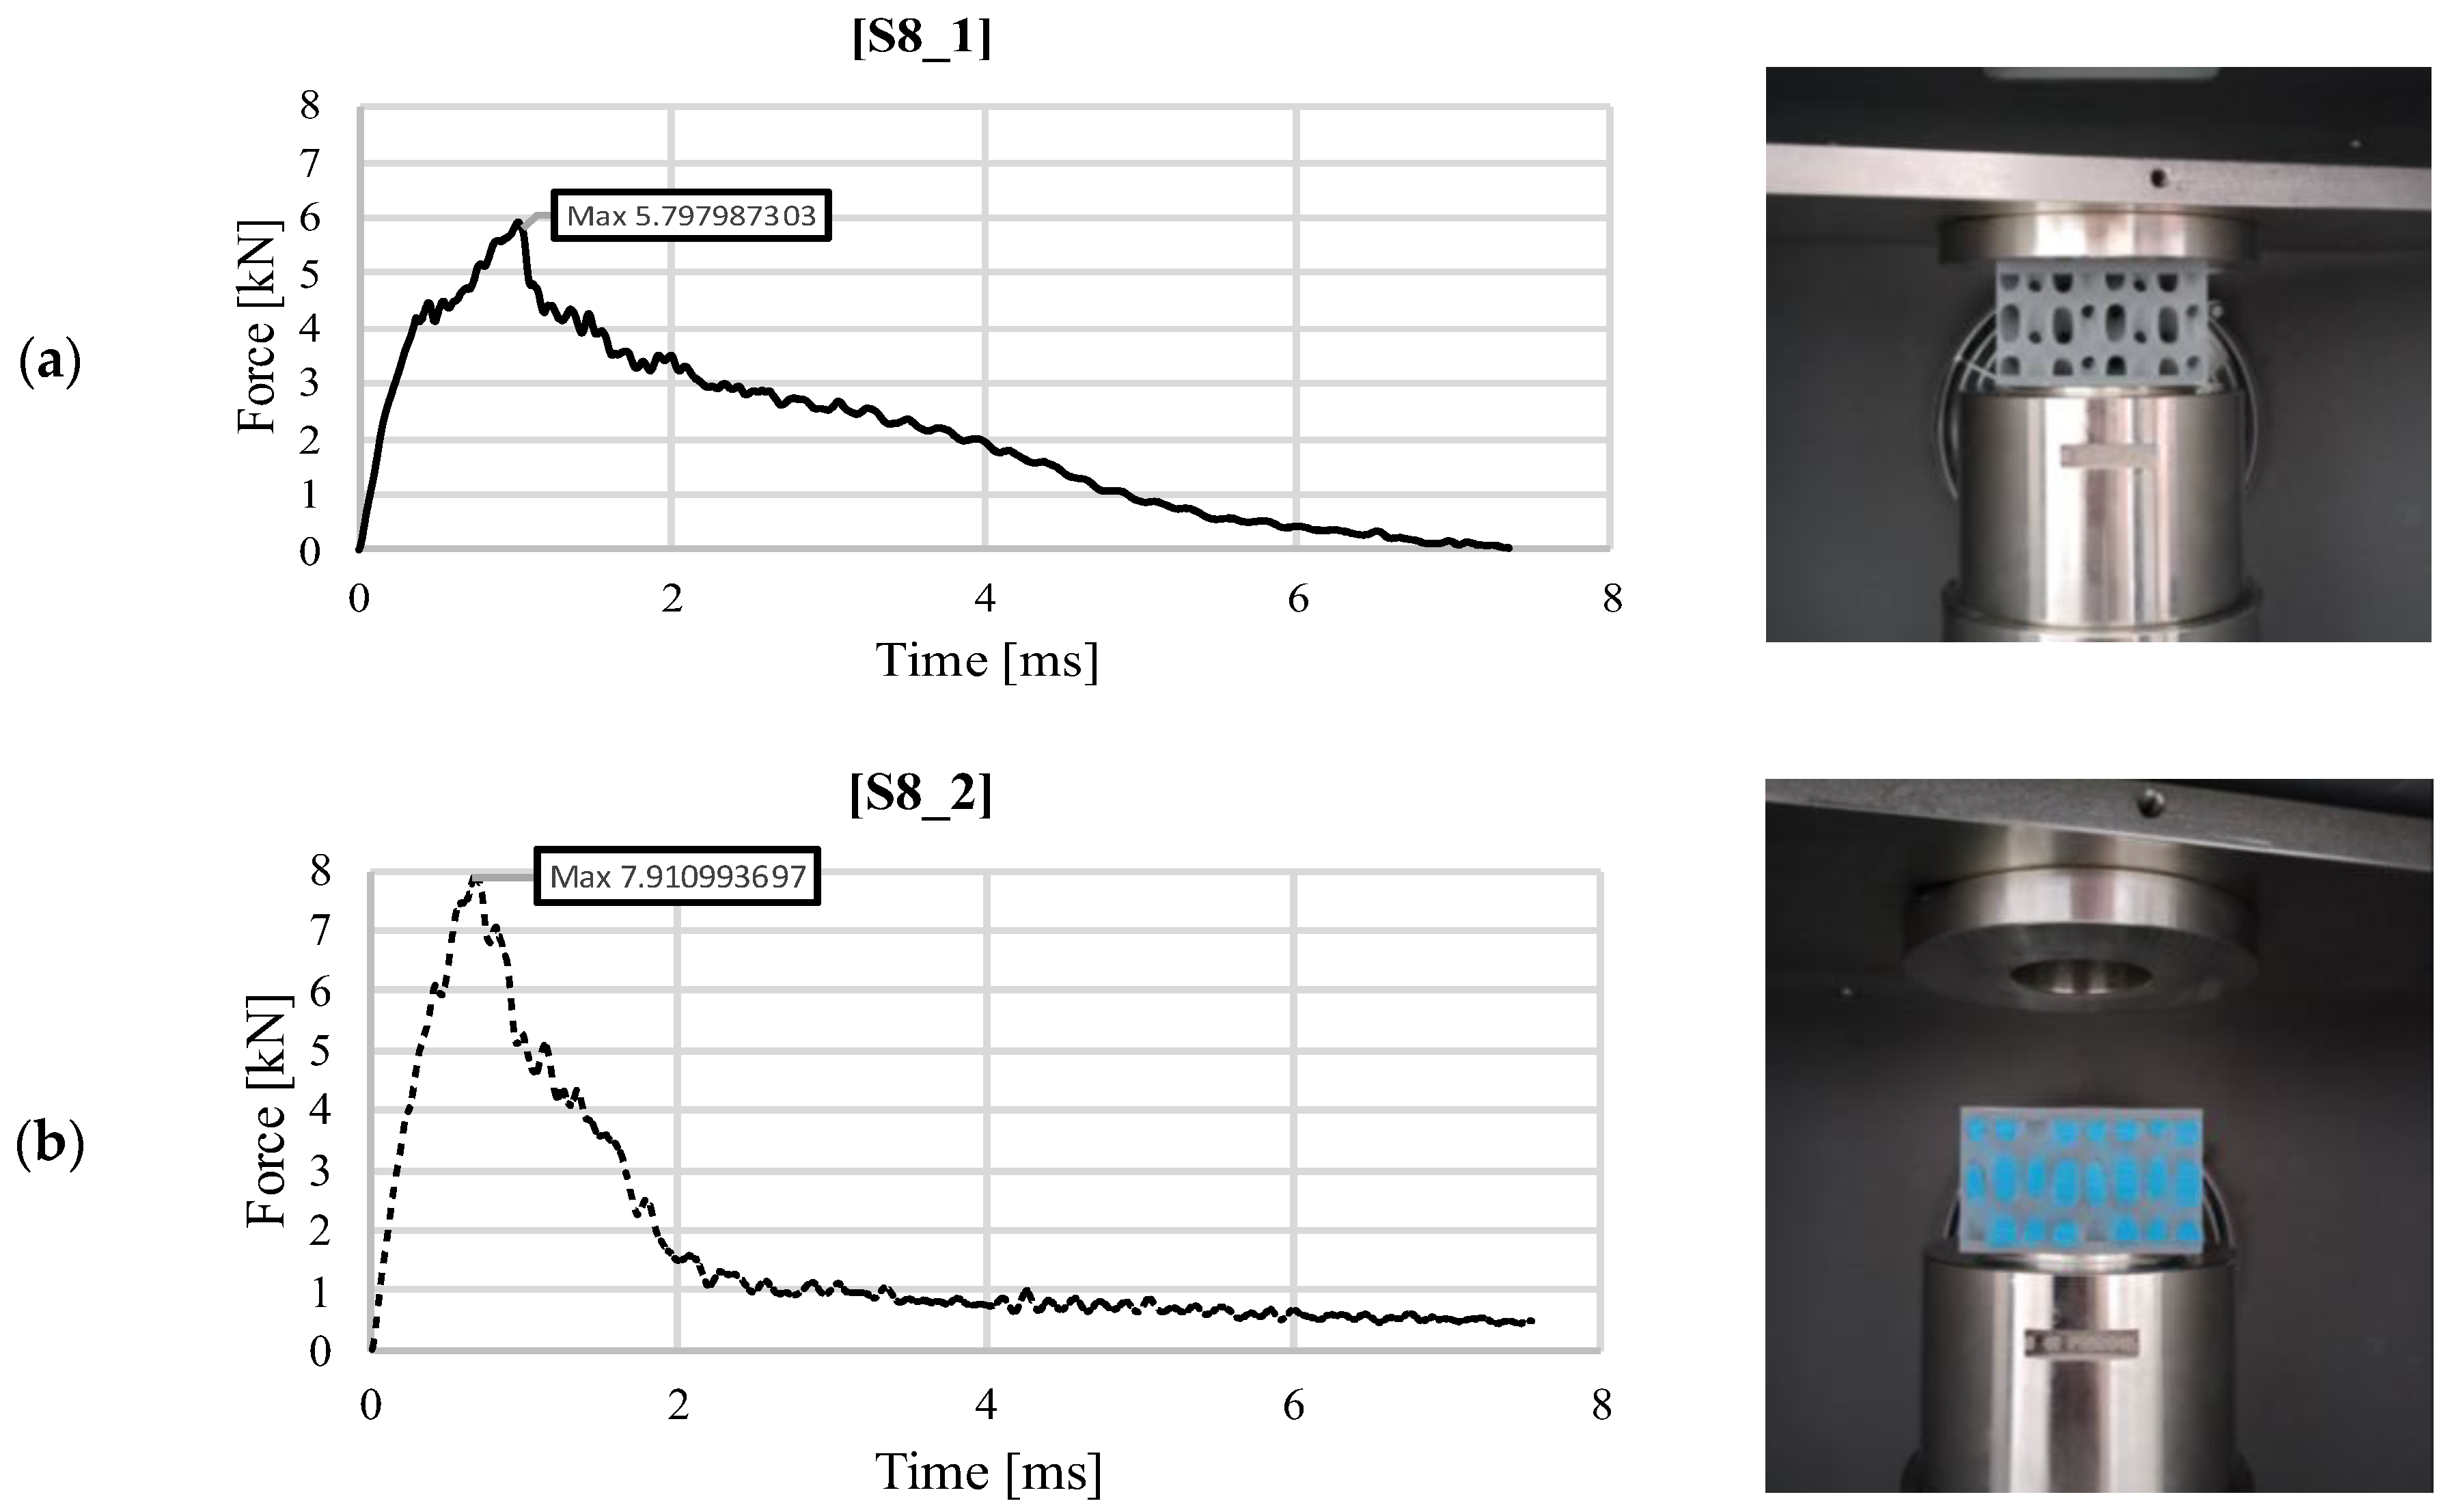
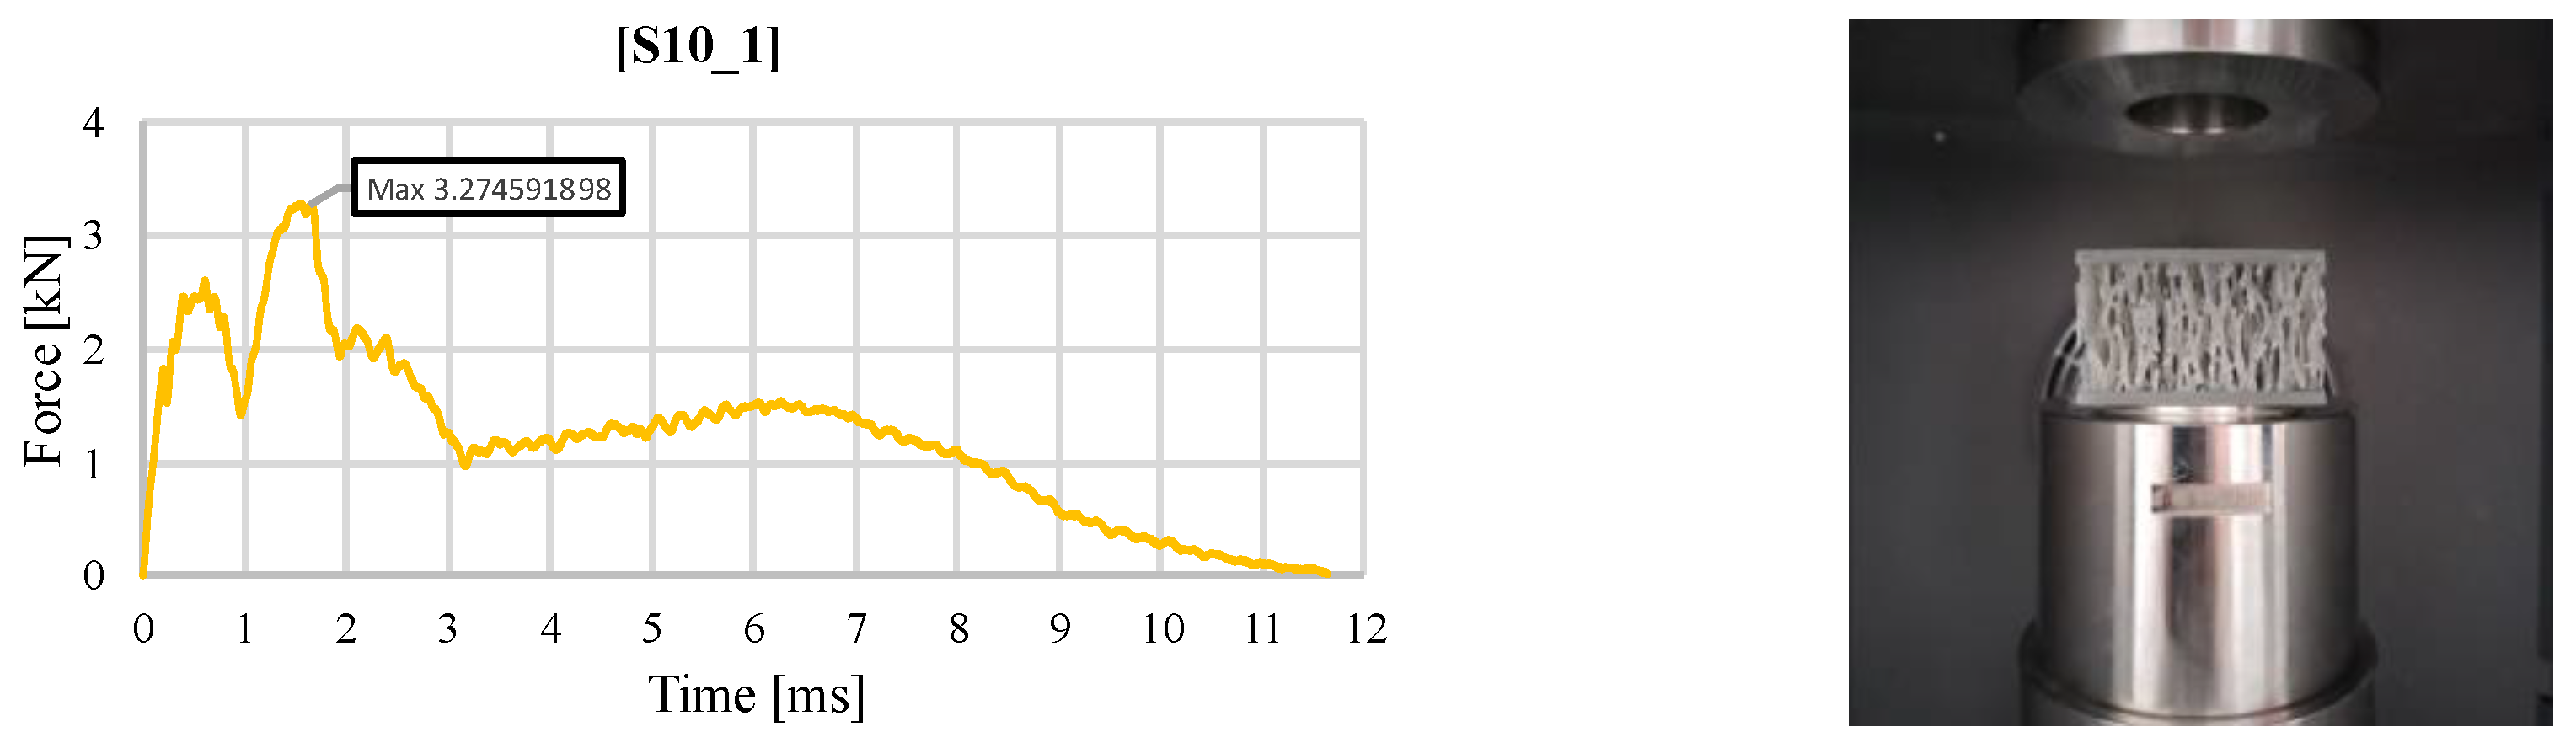
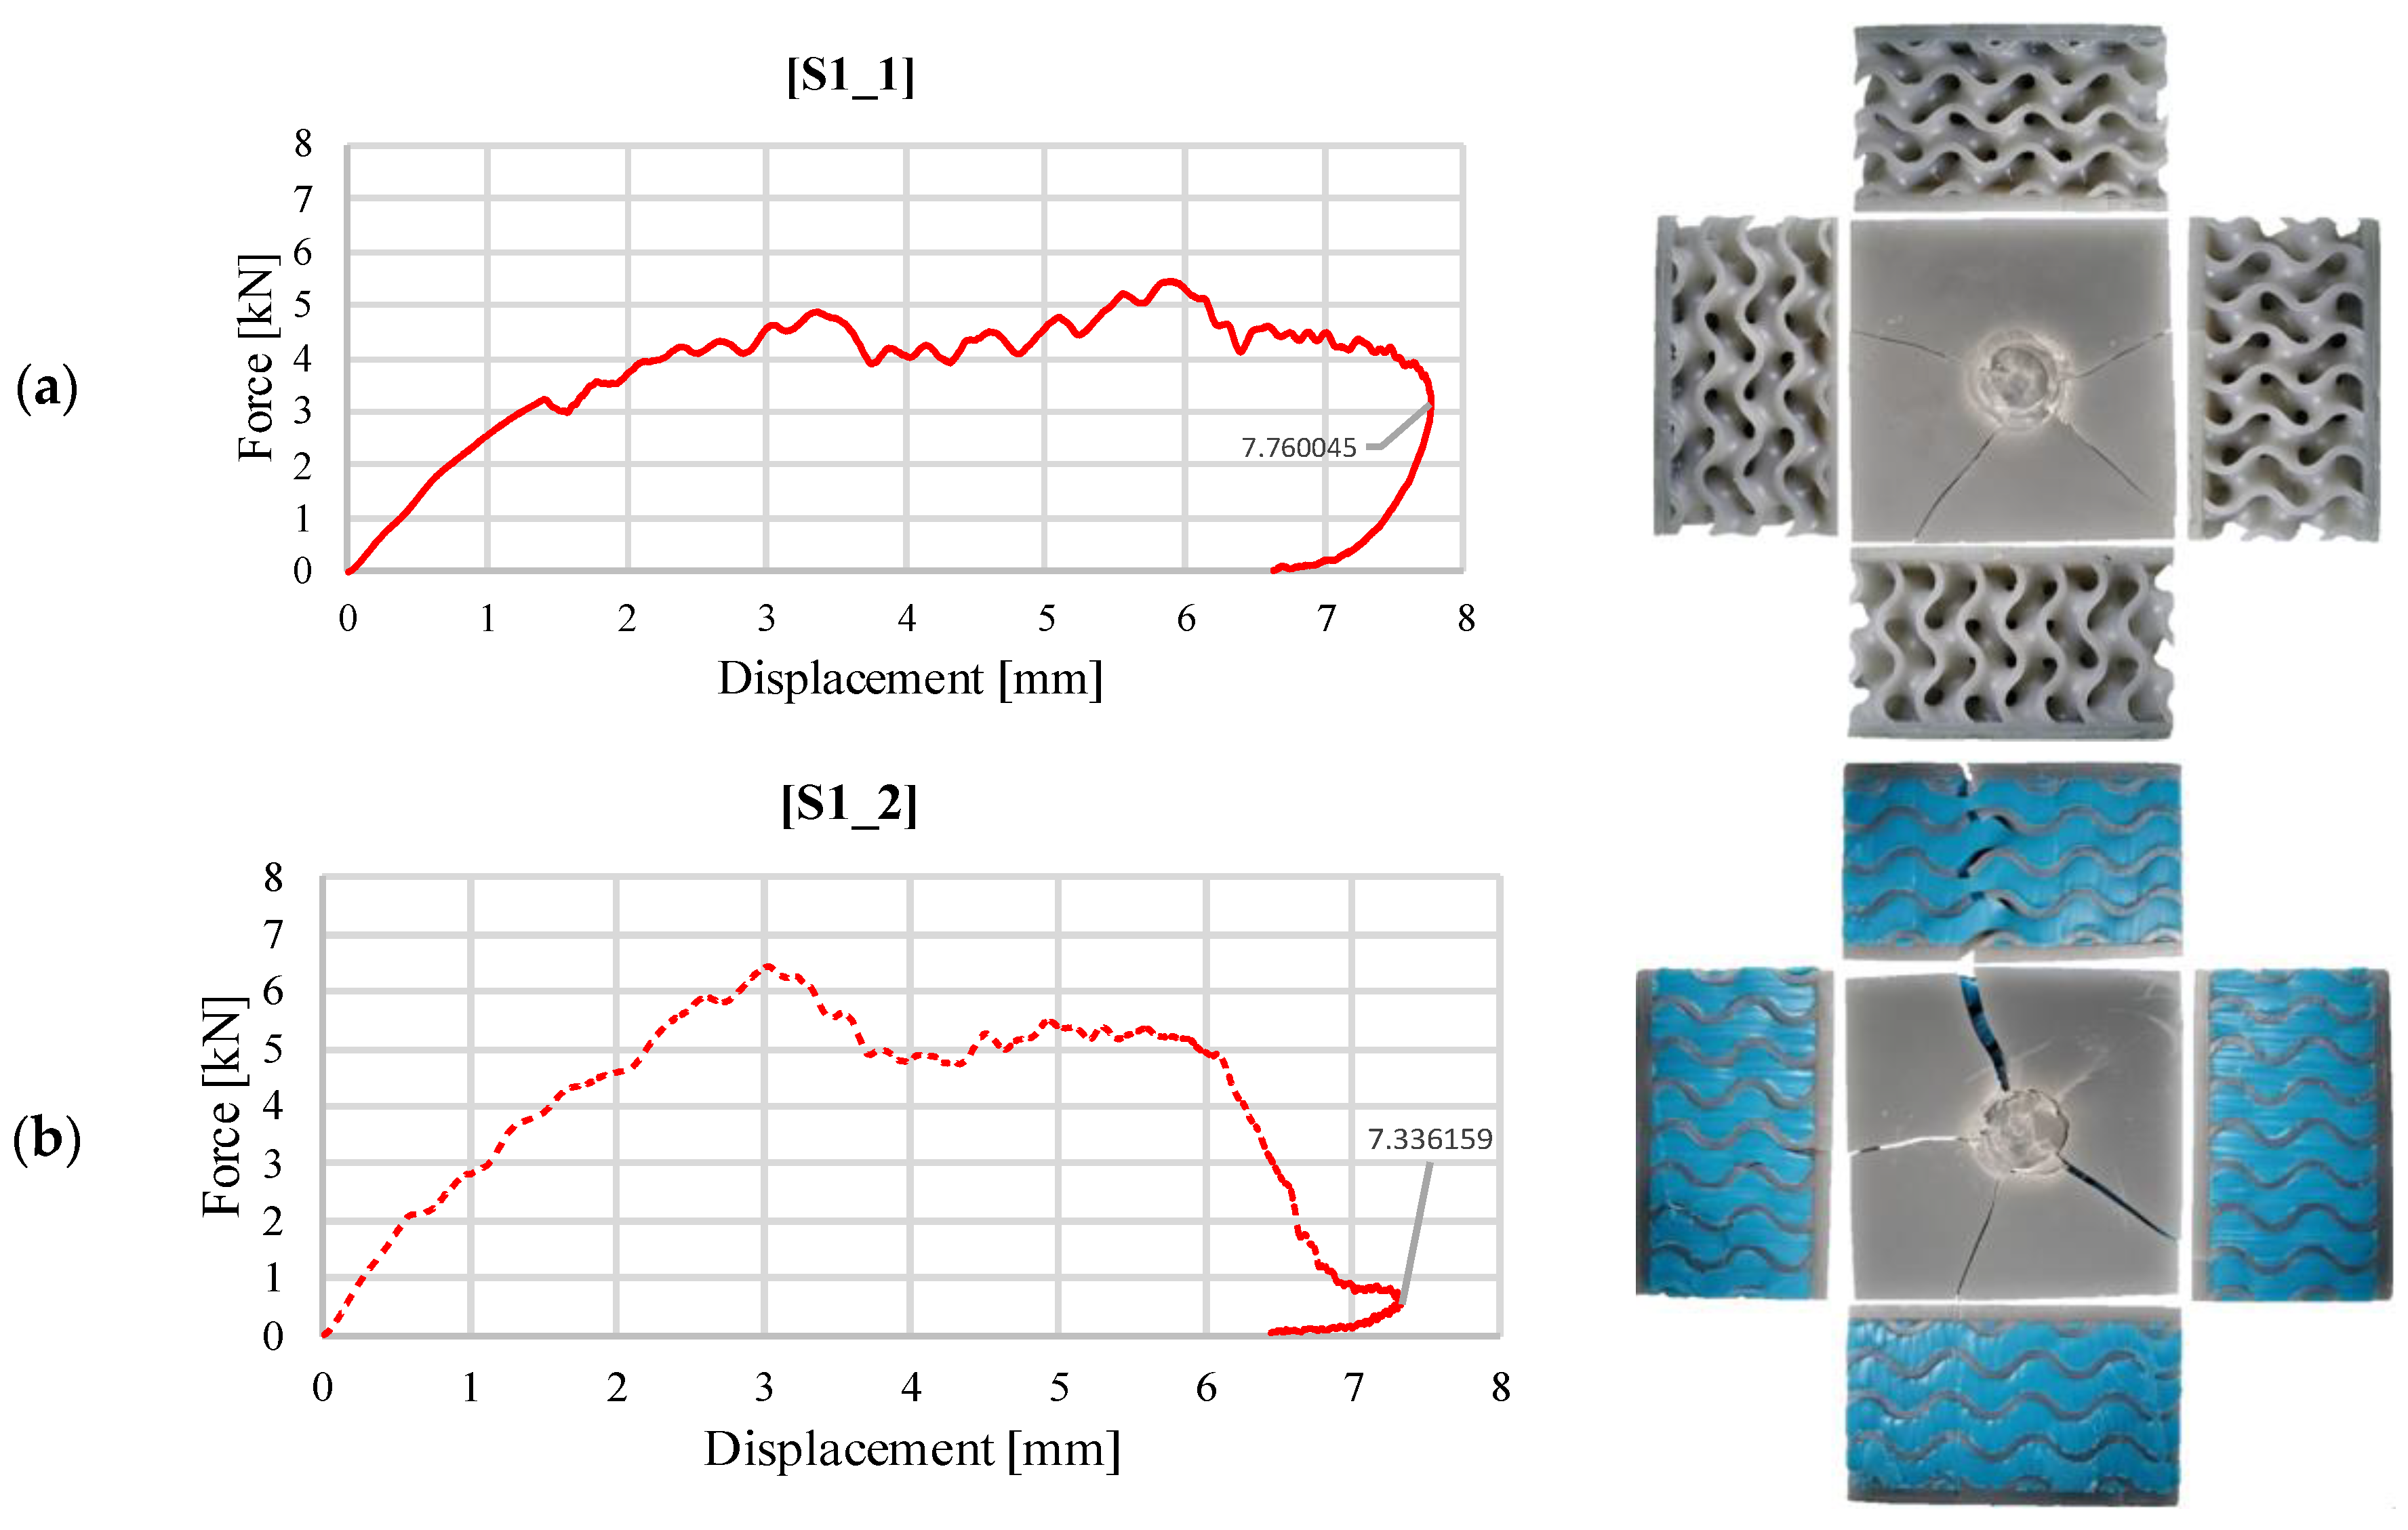
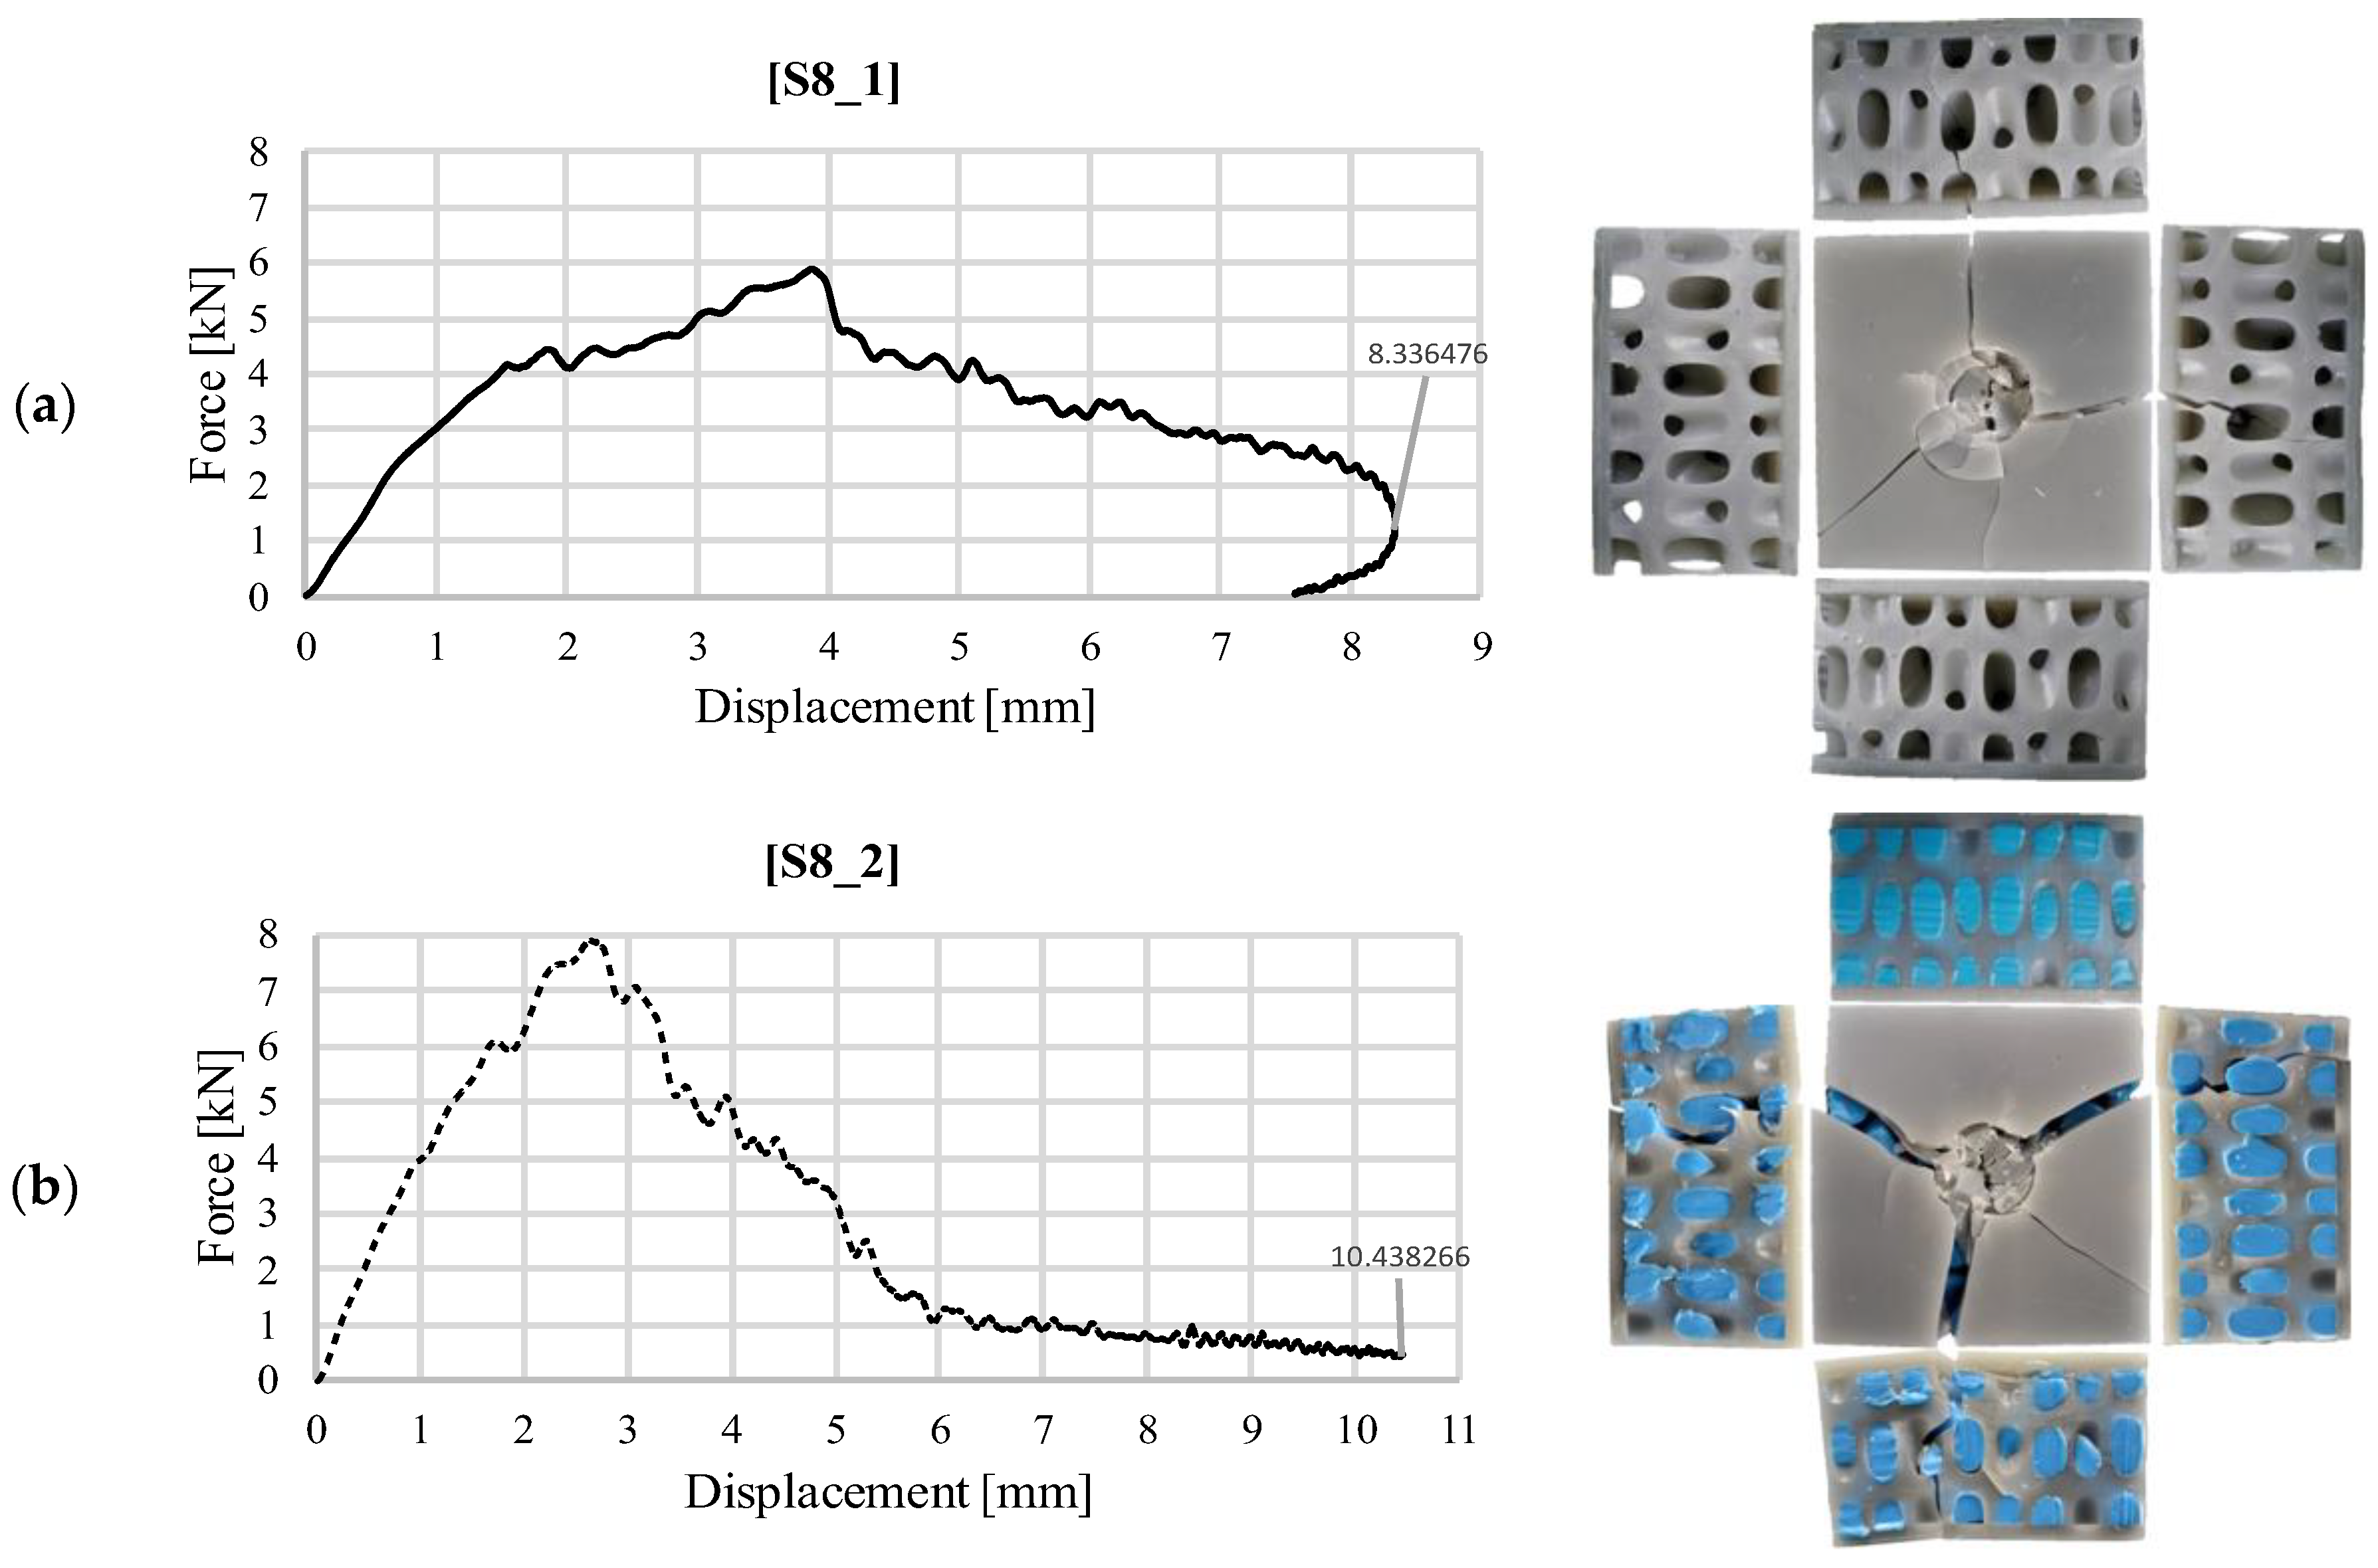
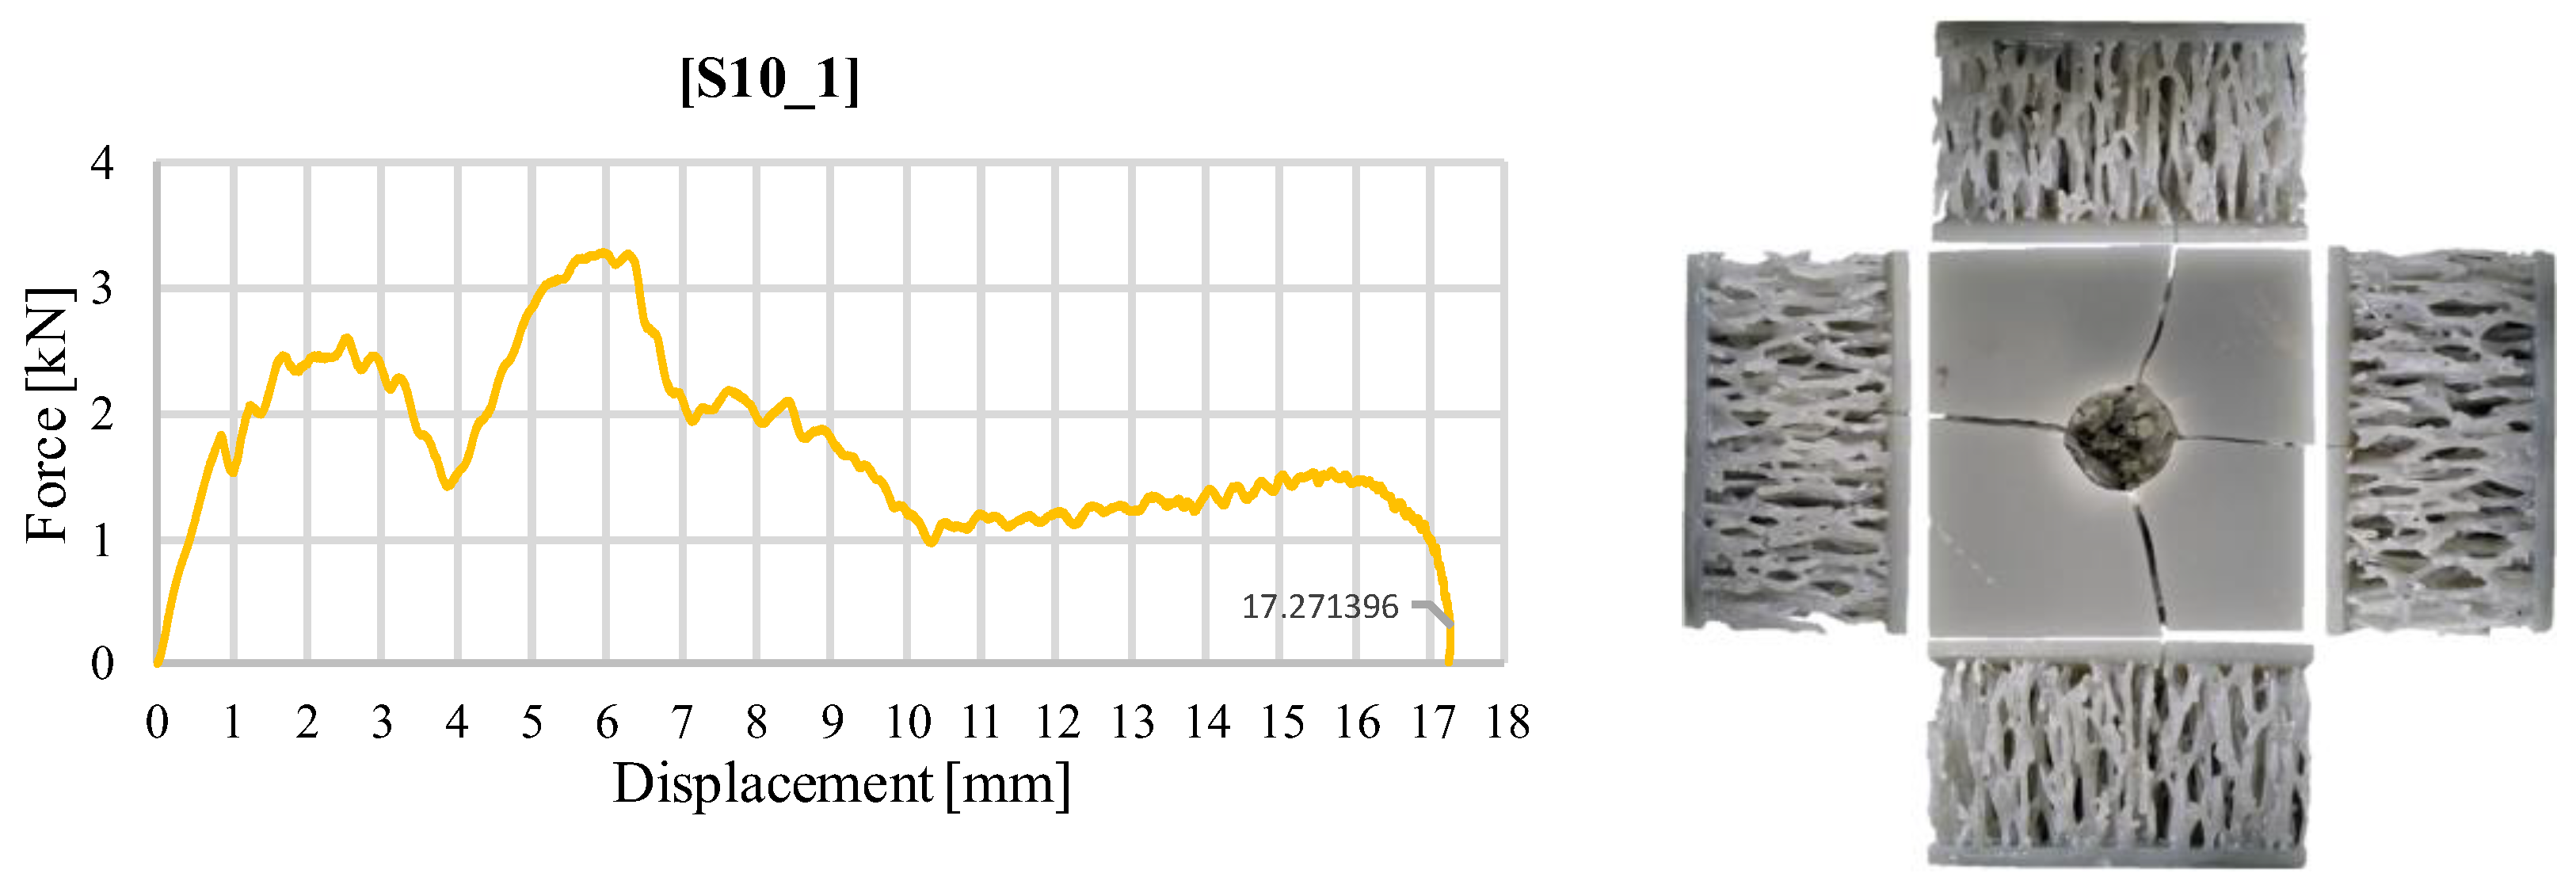
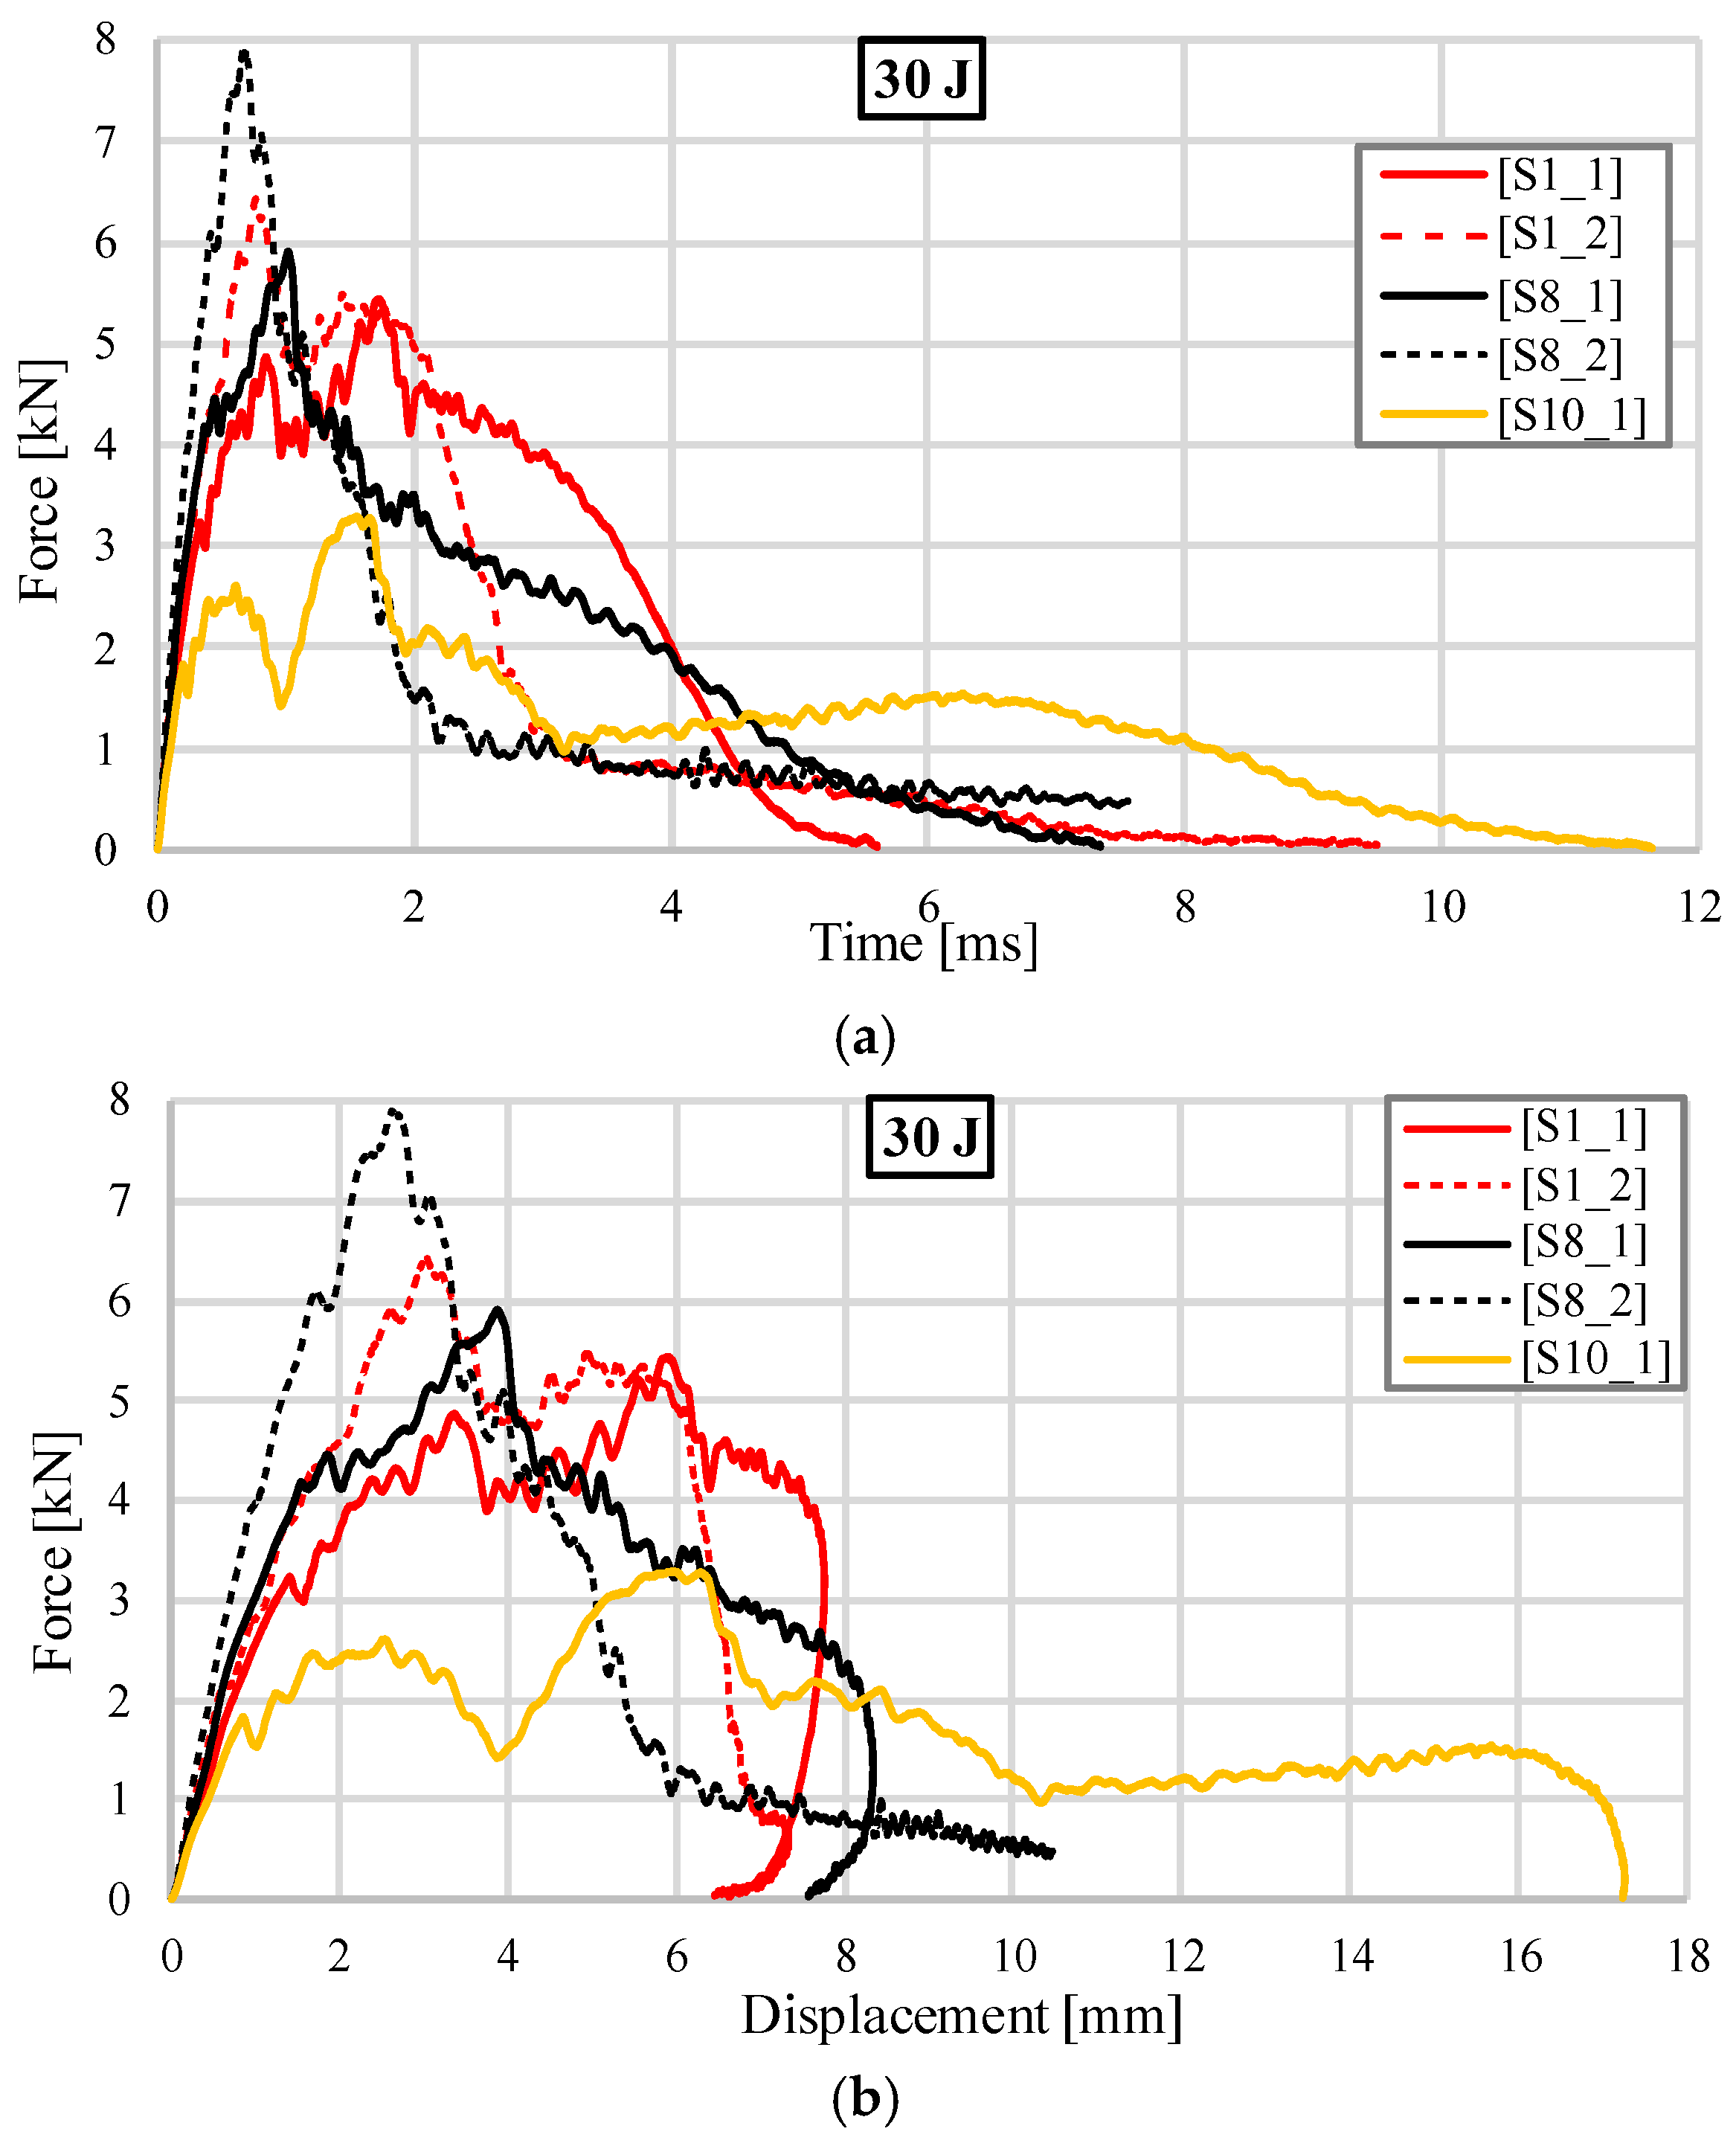
3.1. Impact Test Results at an Impact Energy of 30 J
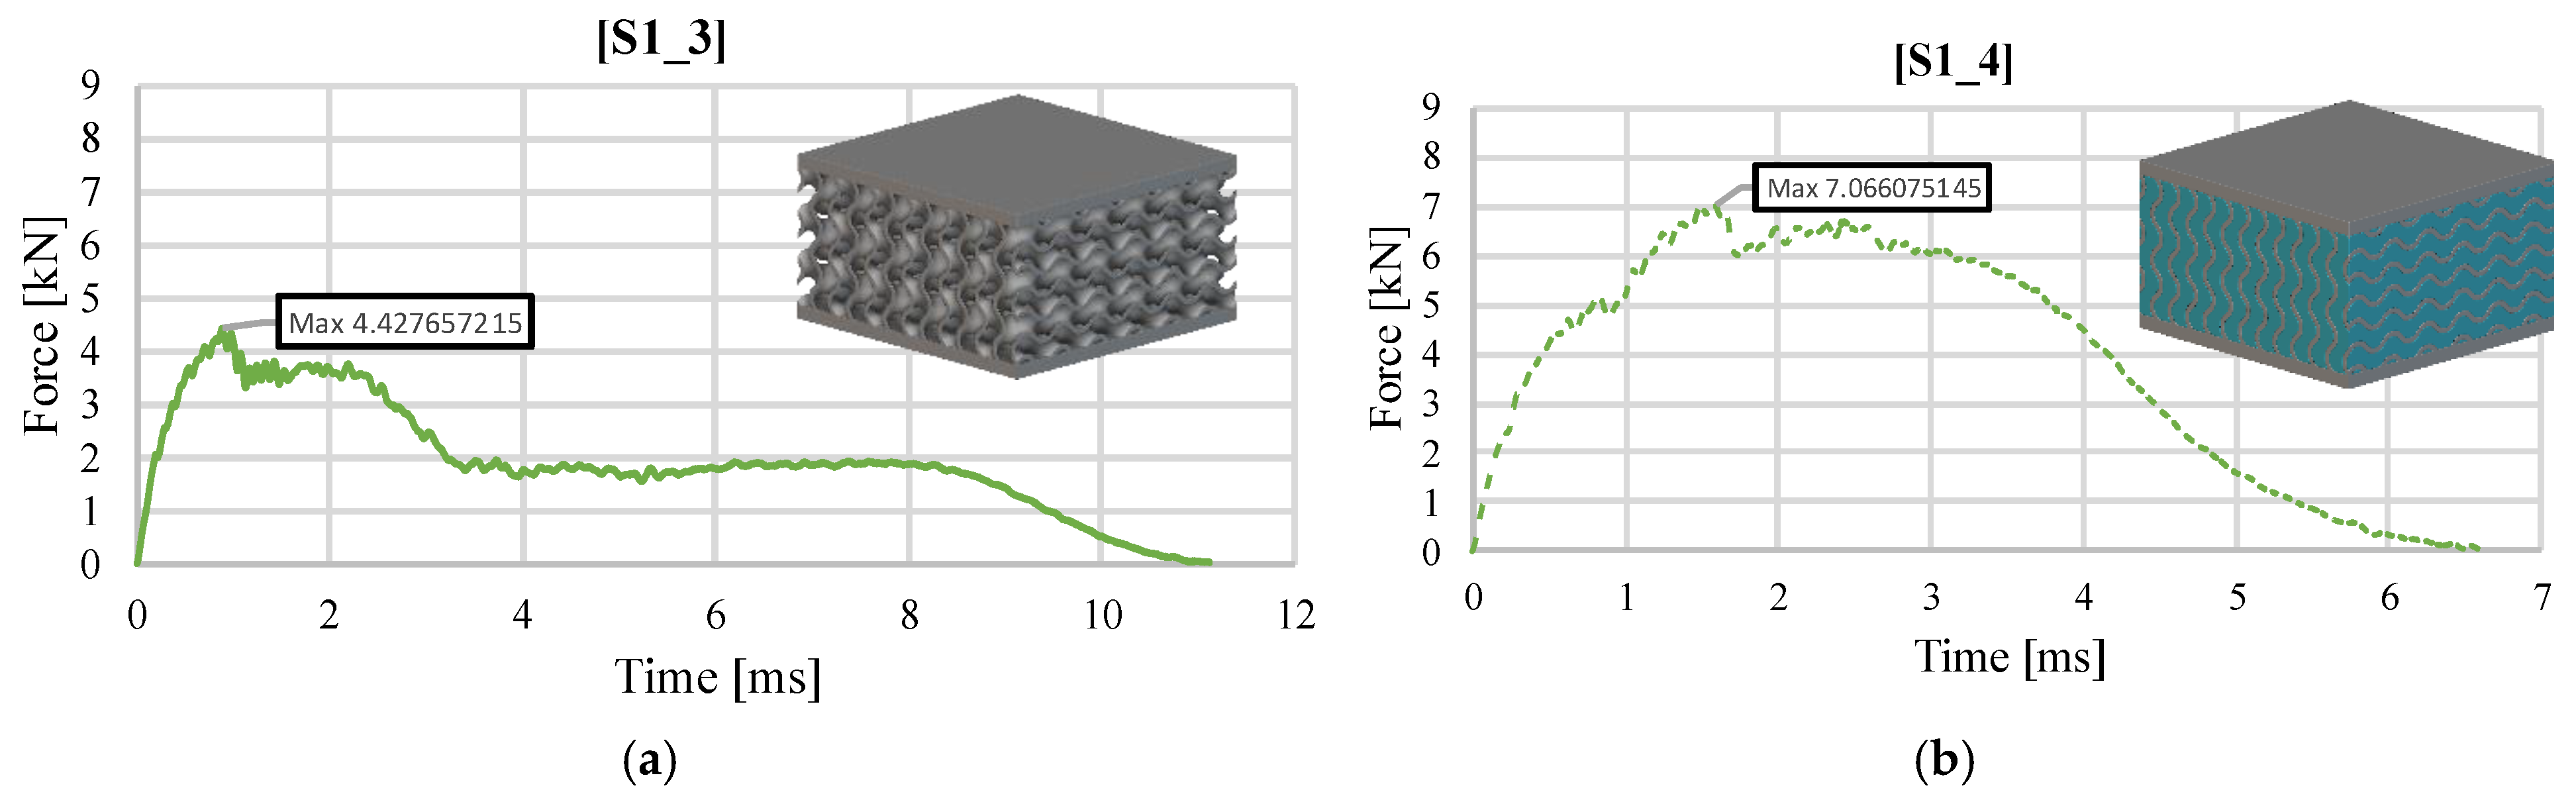
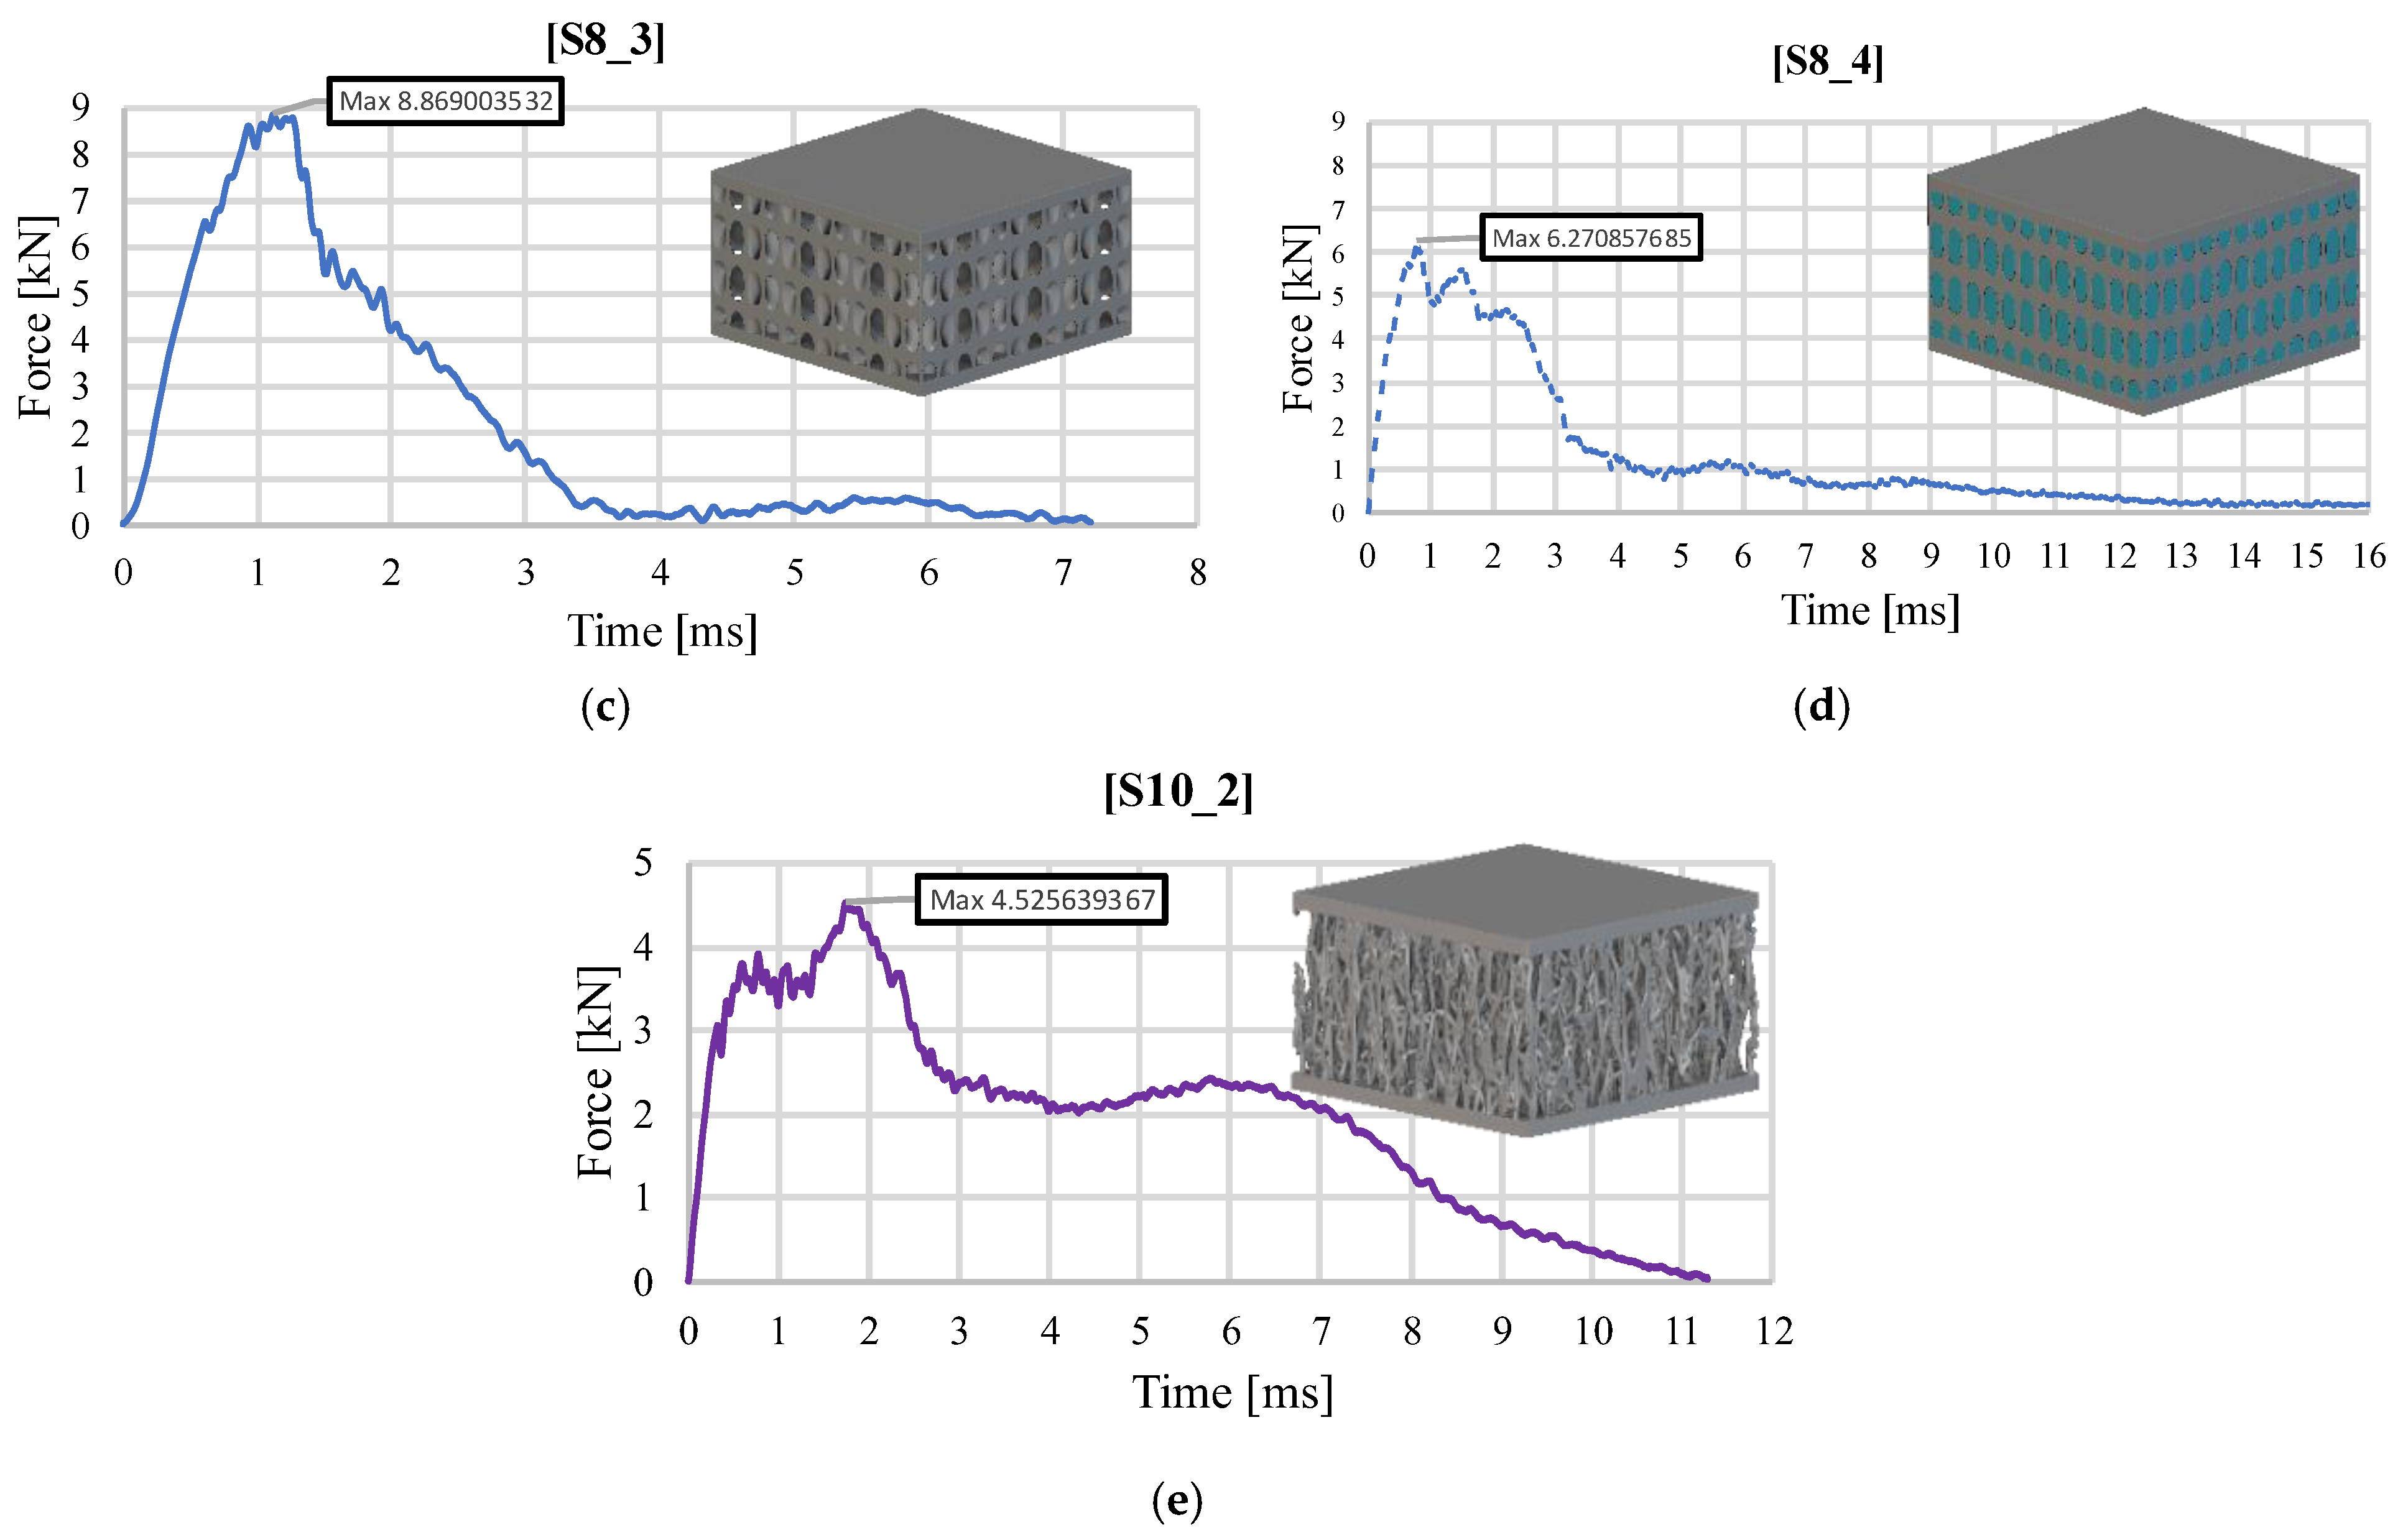
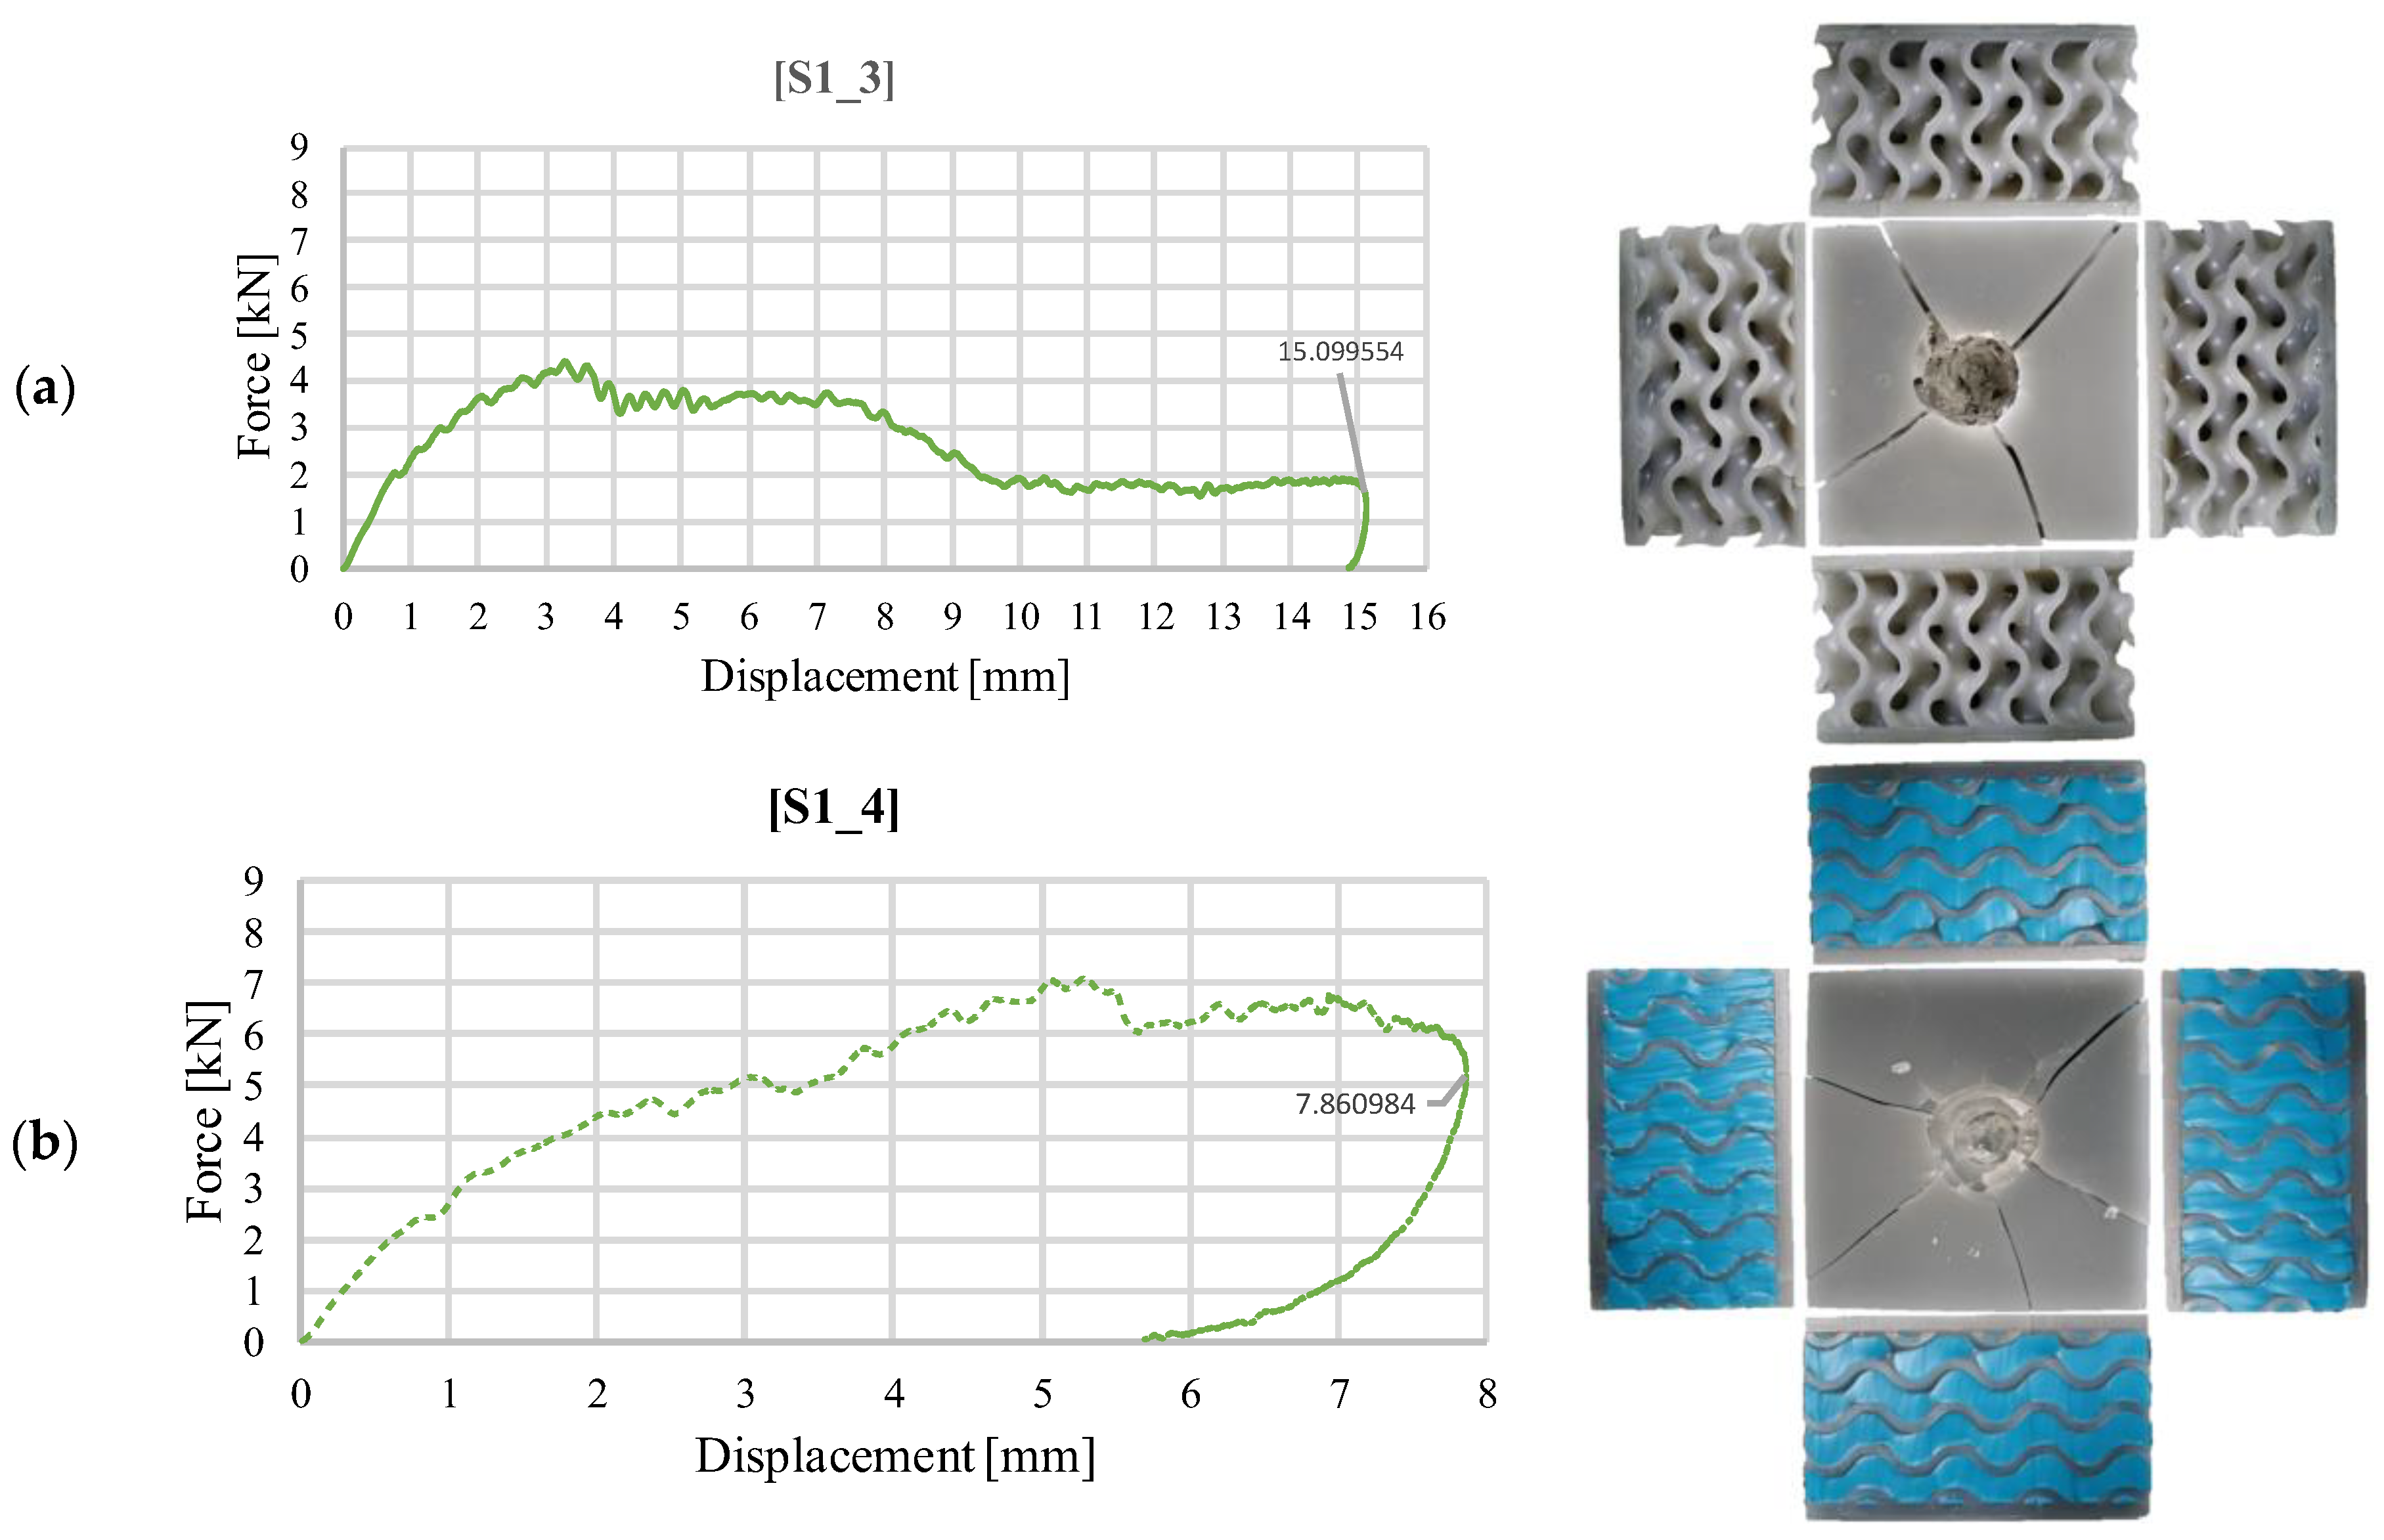
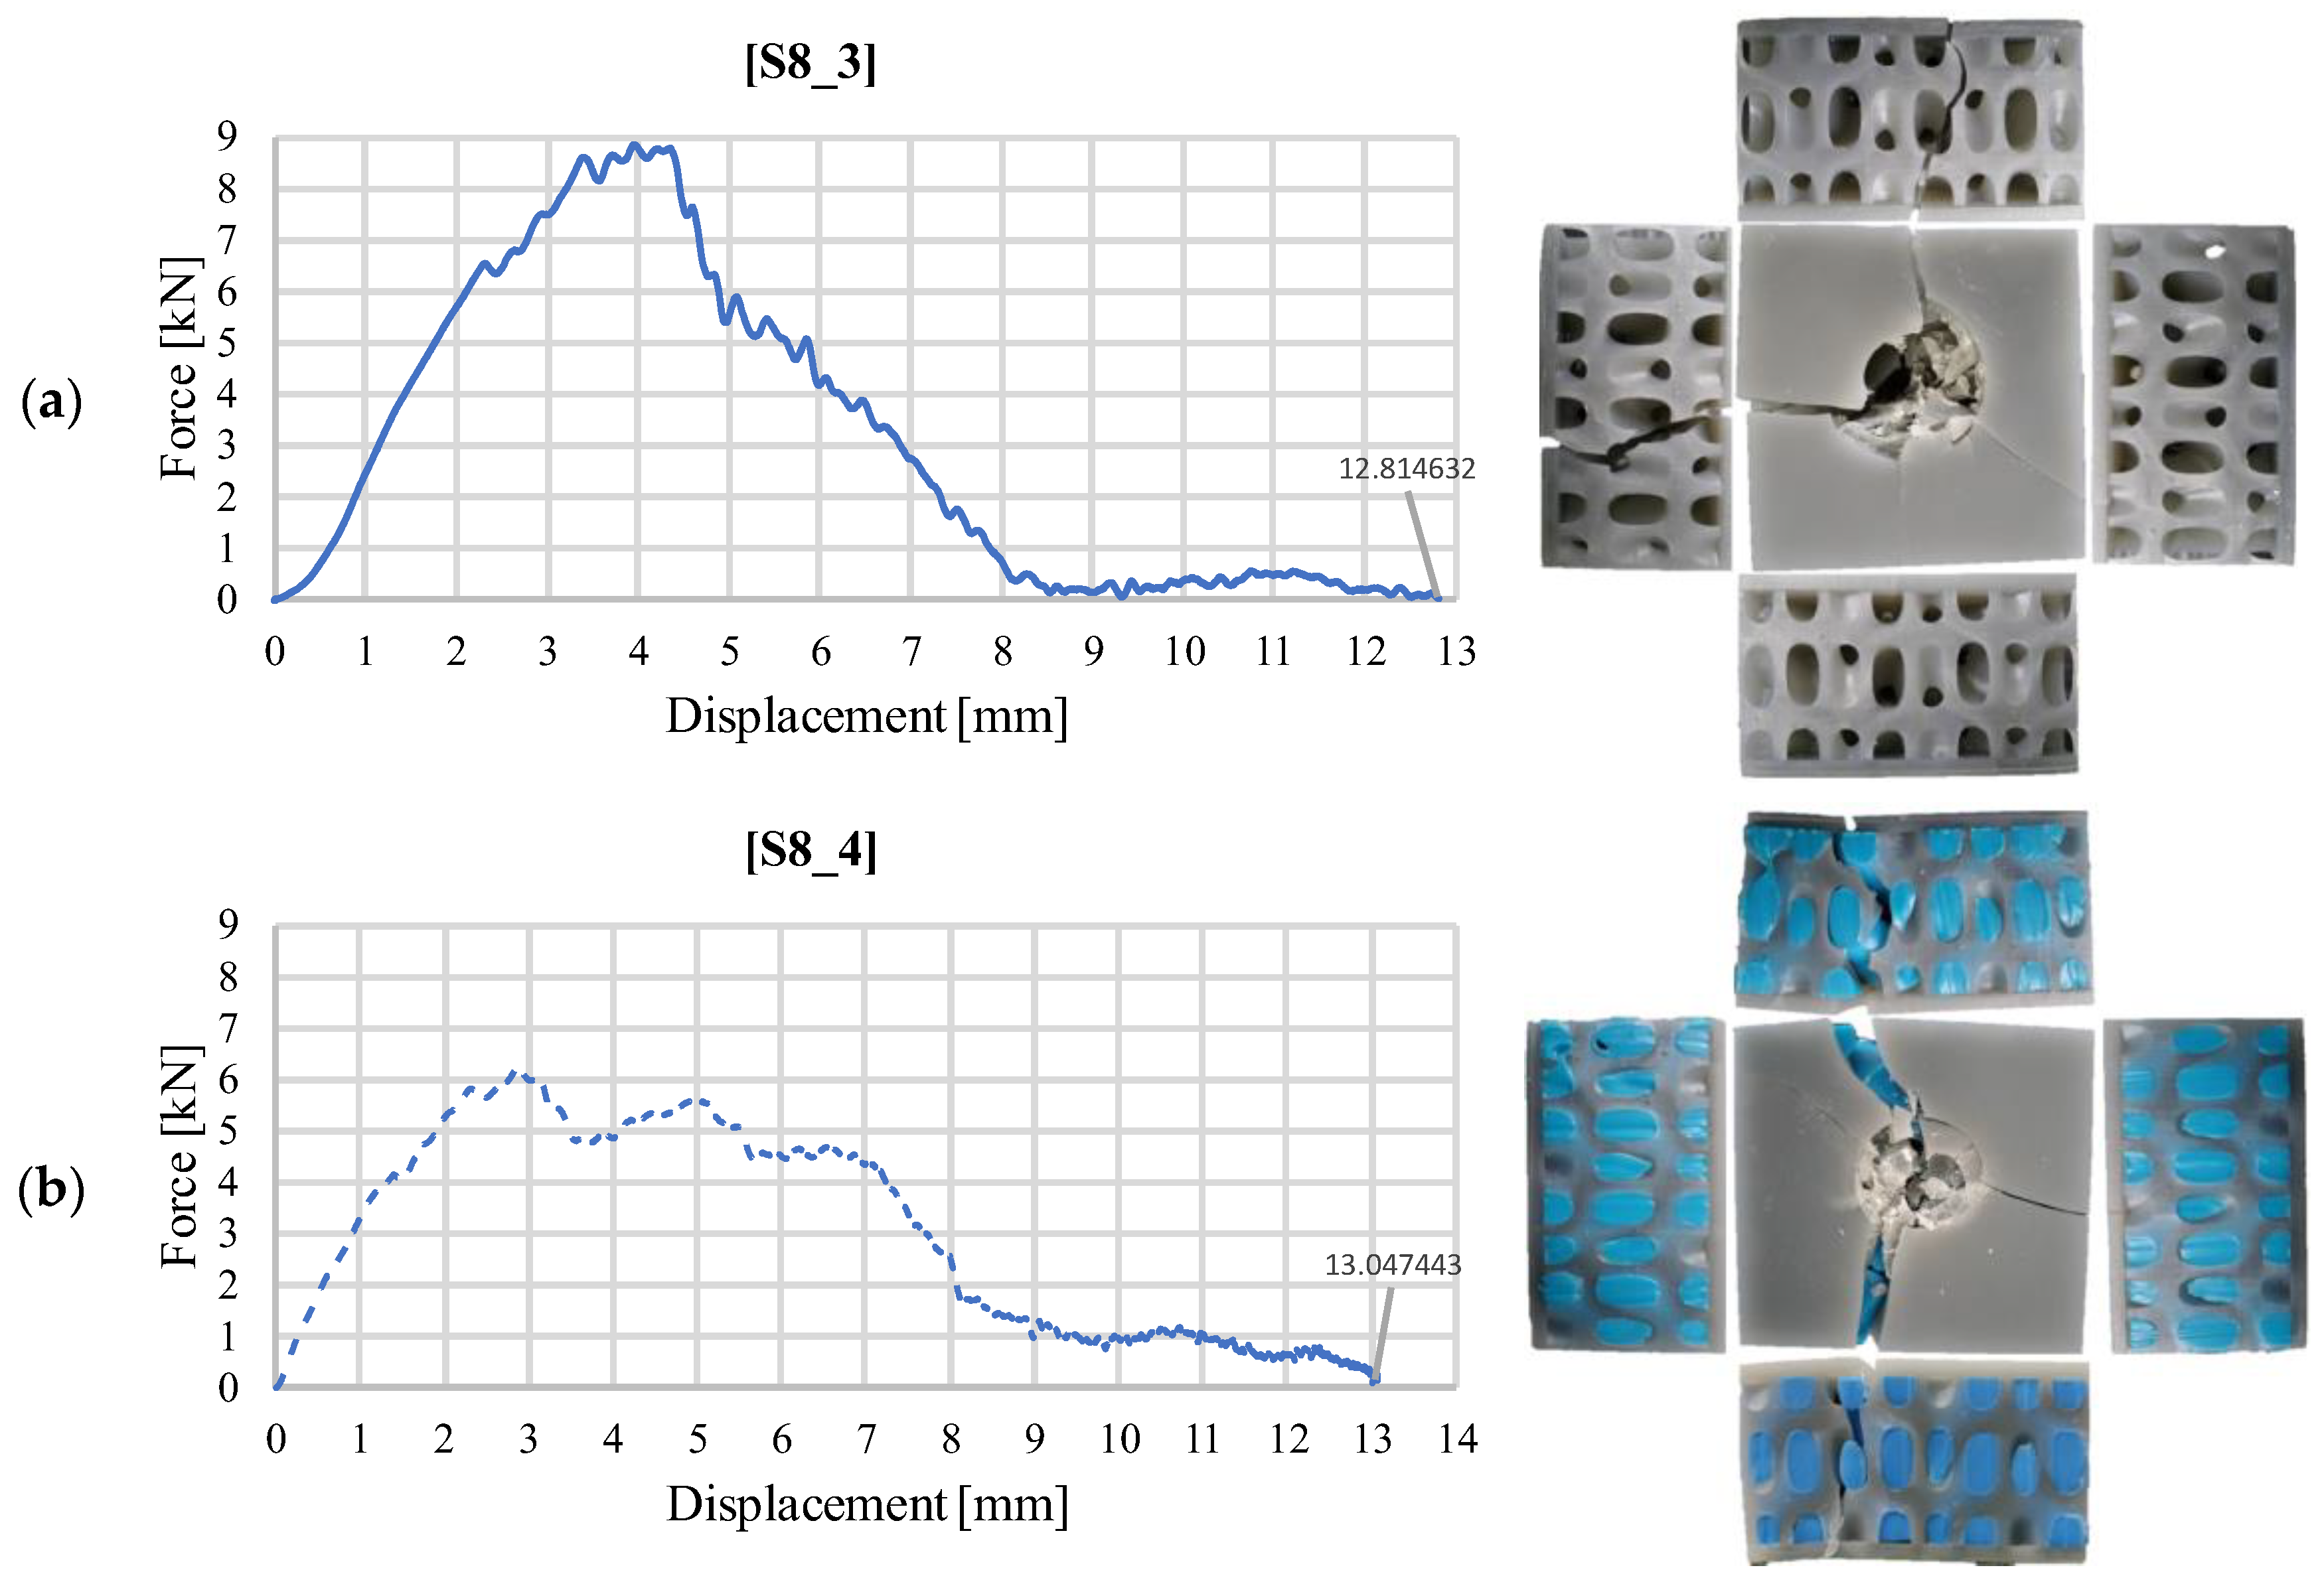
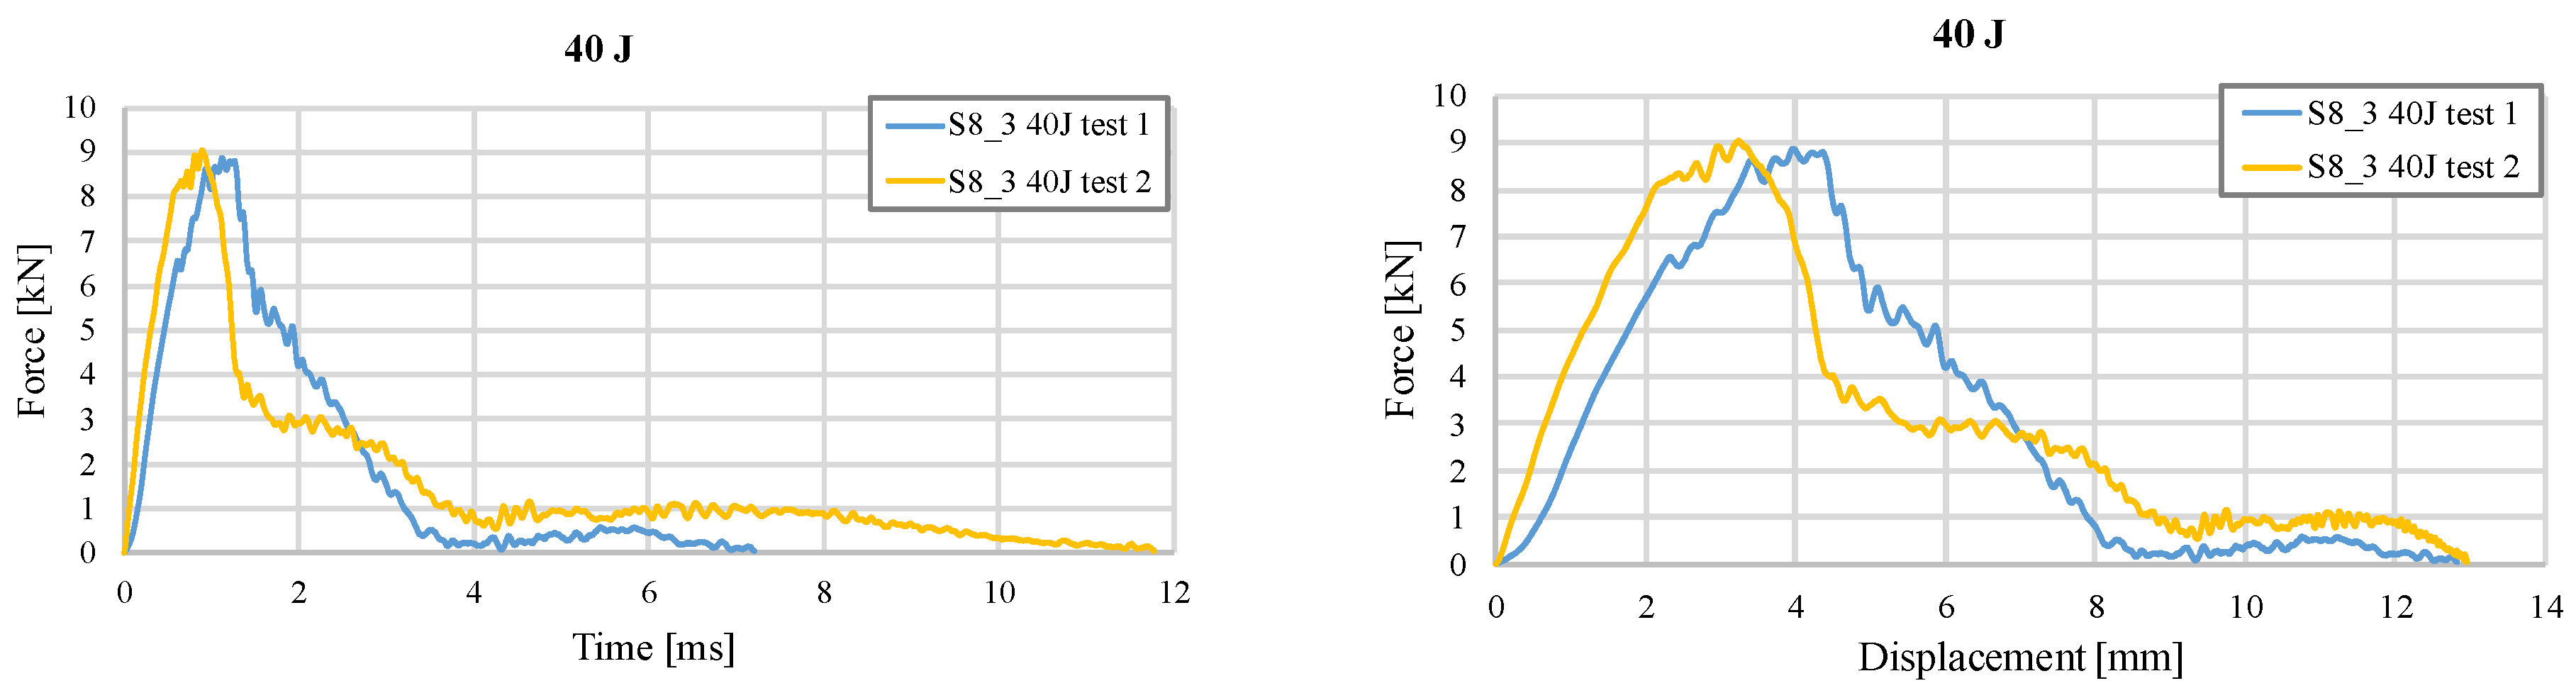
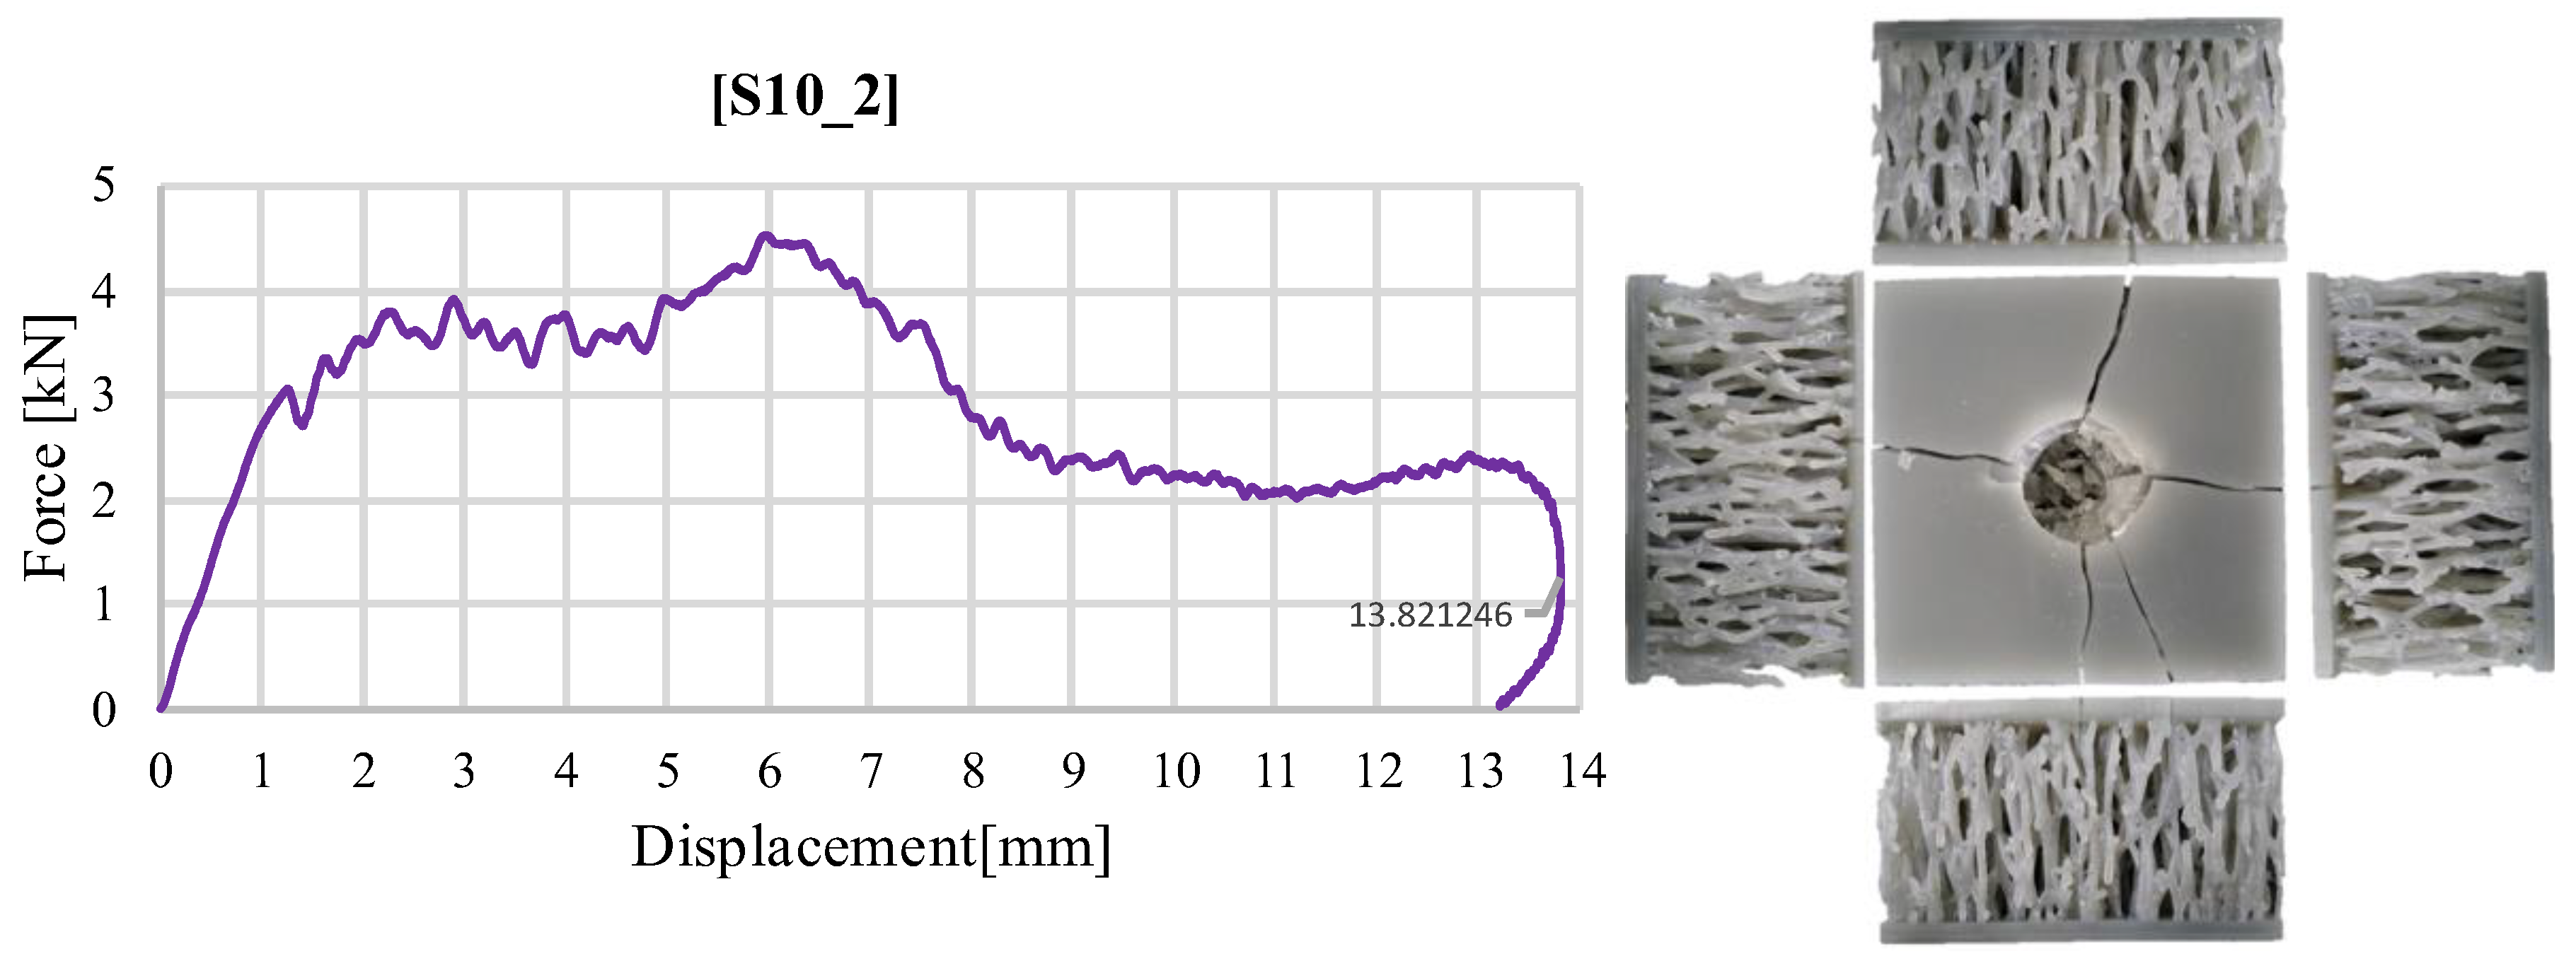
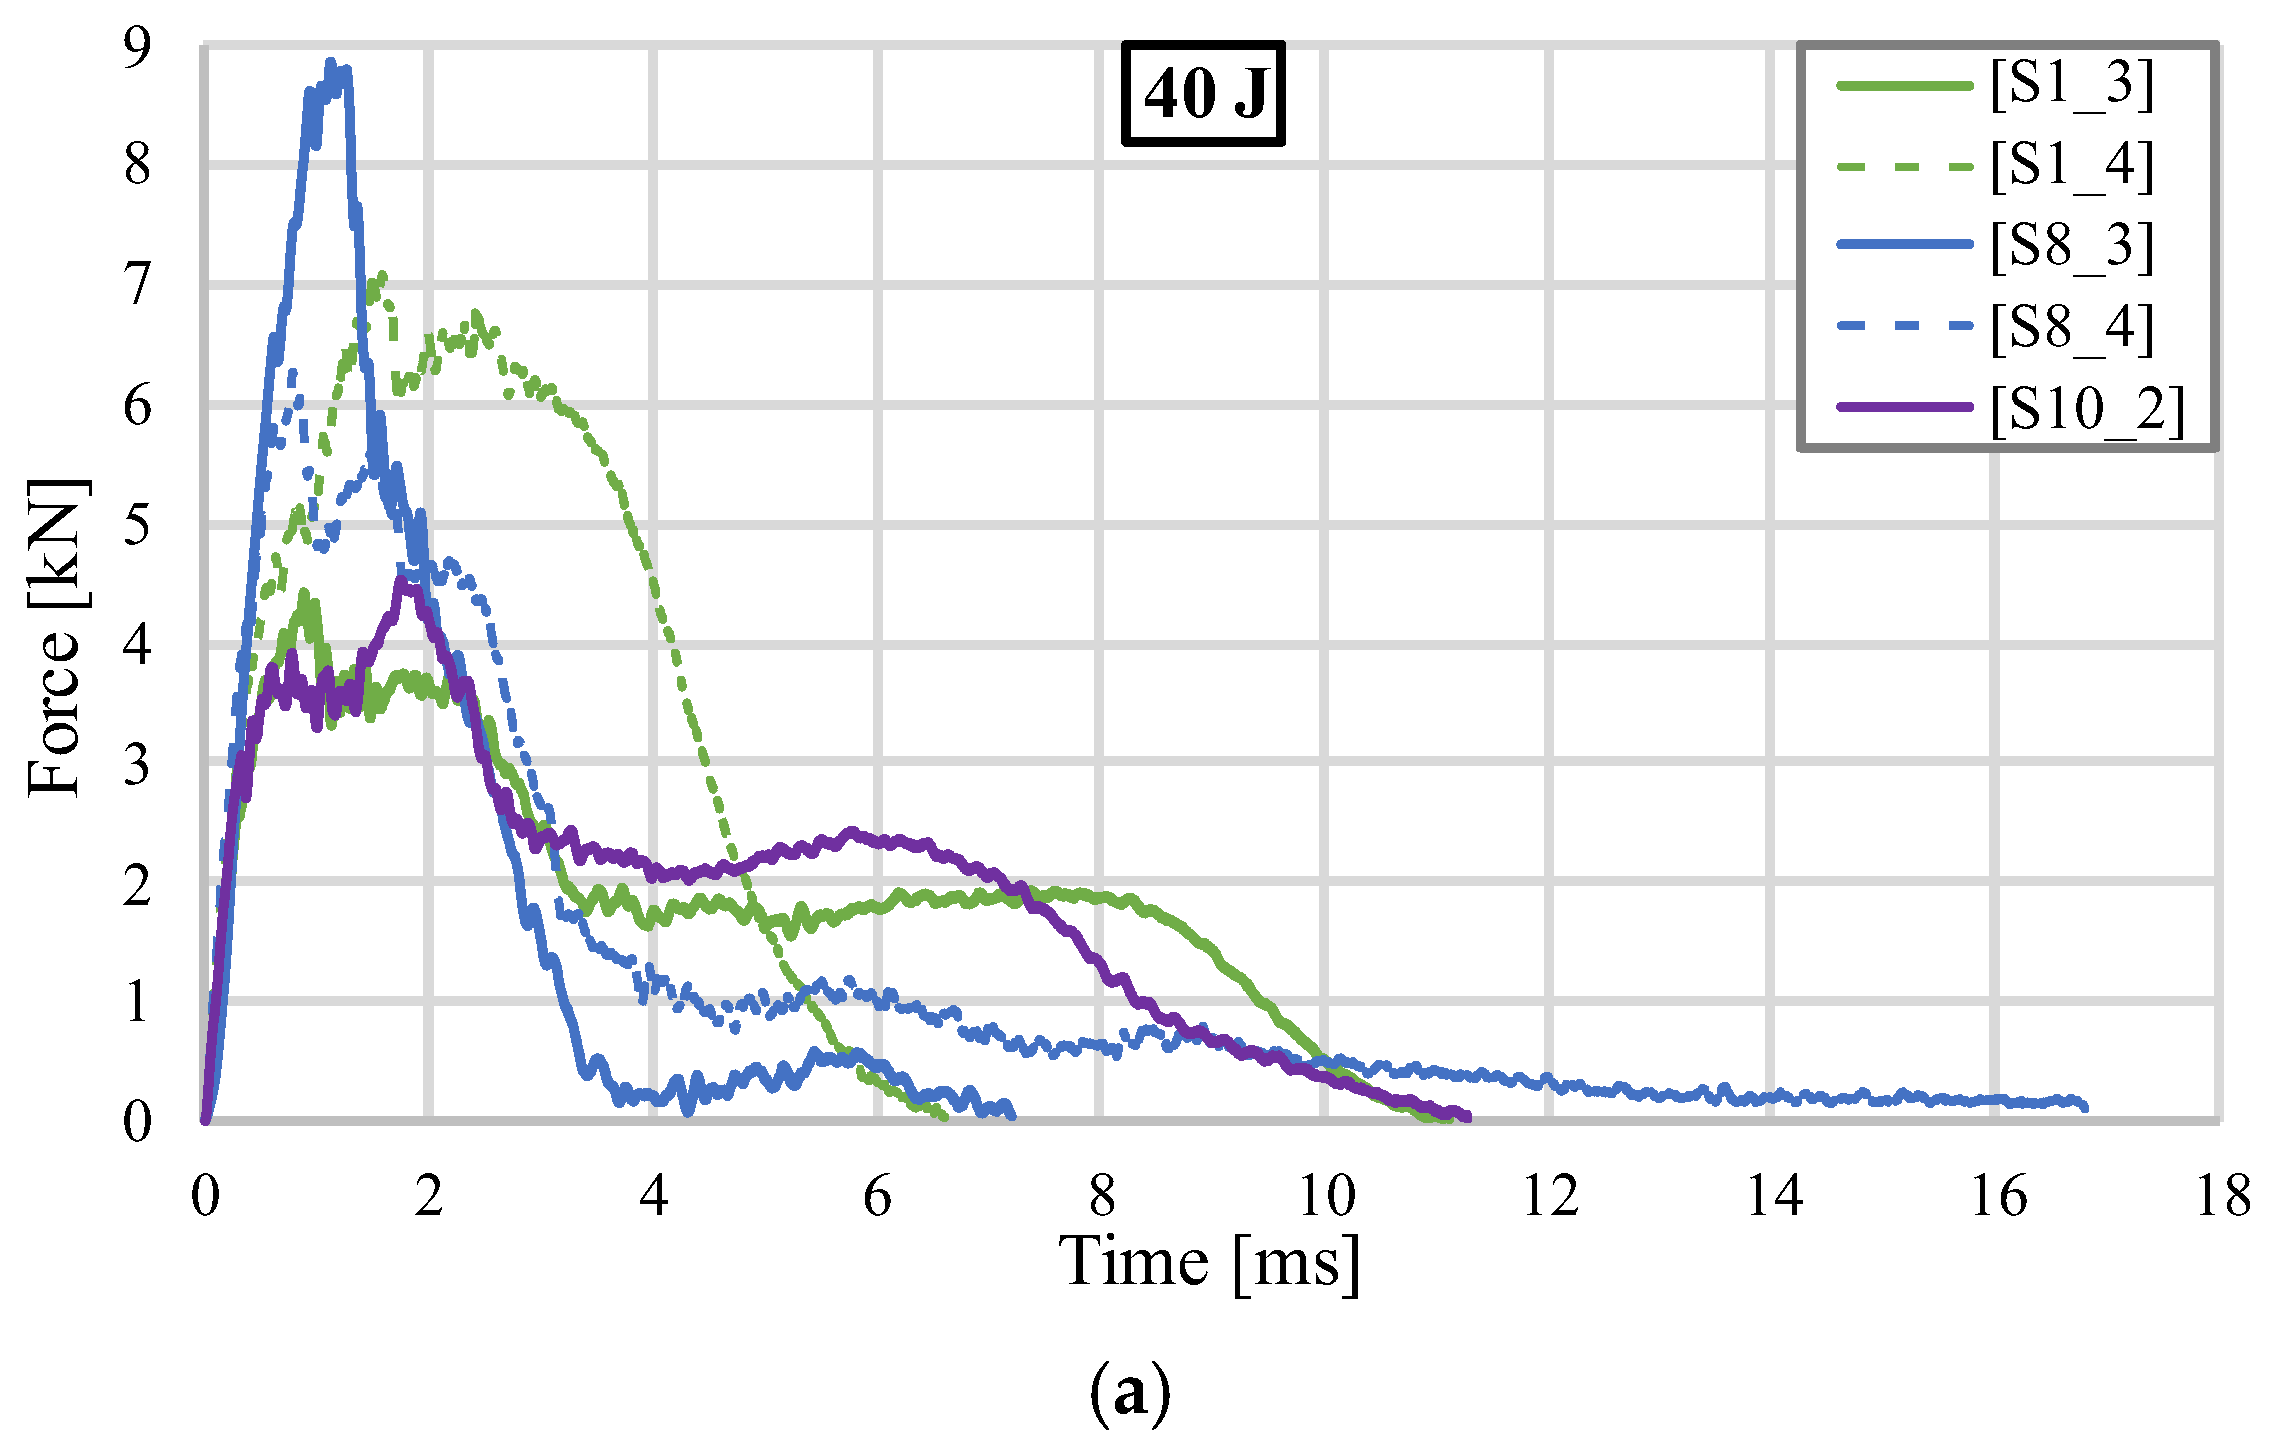
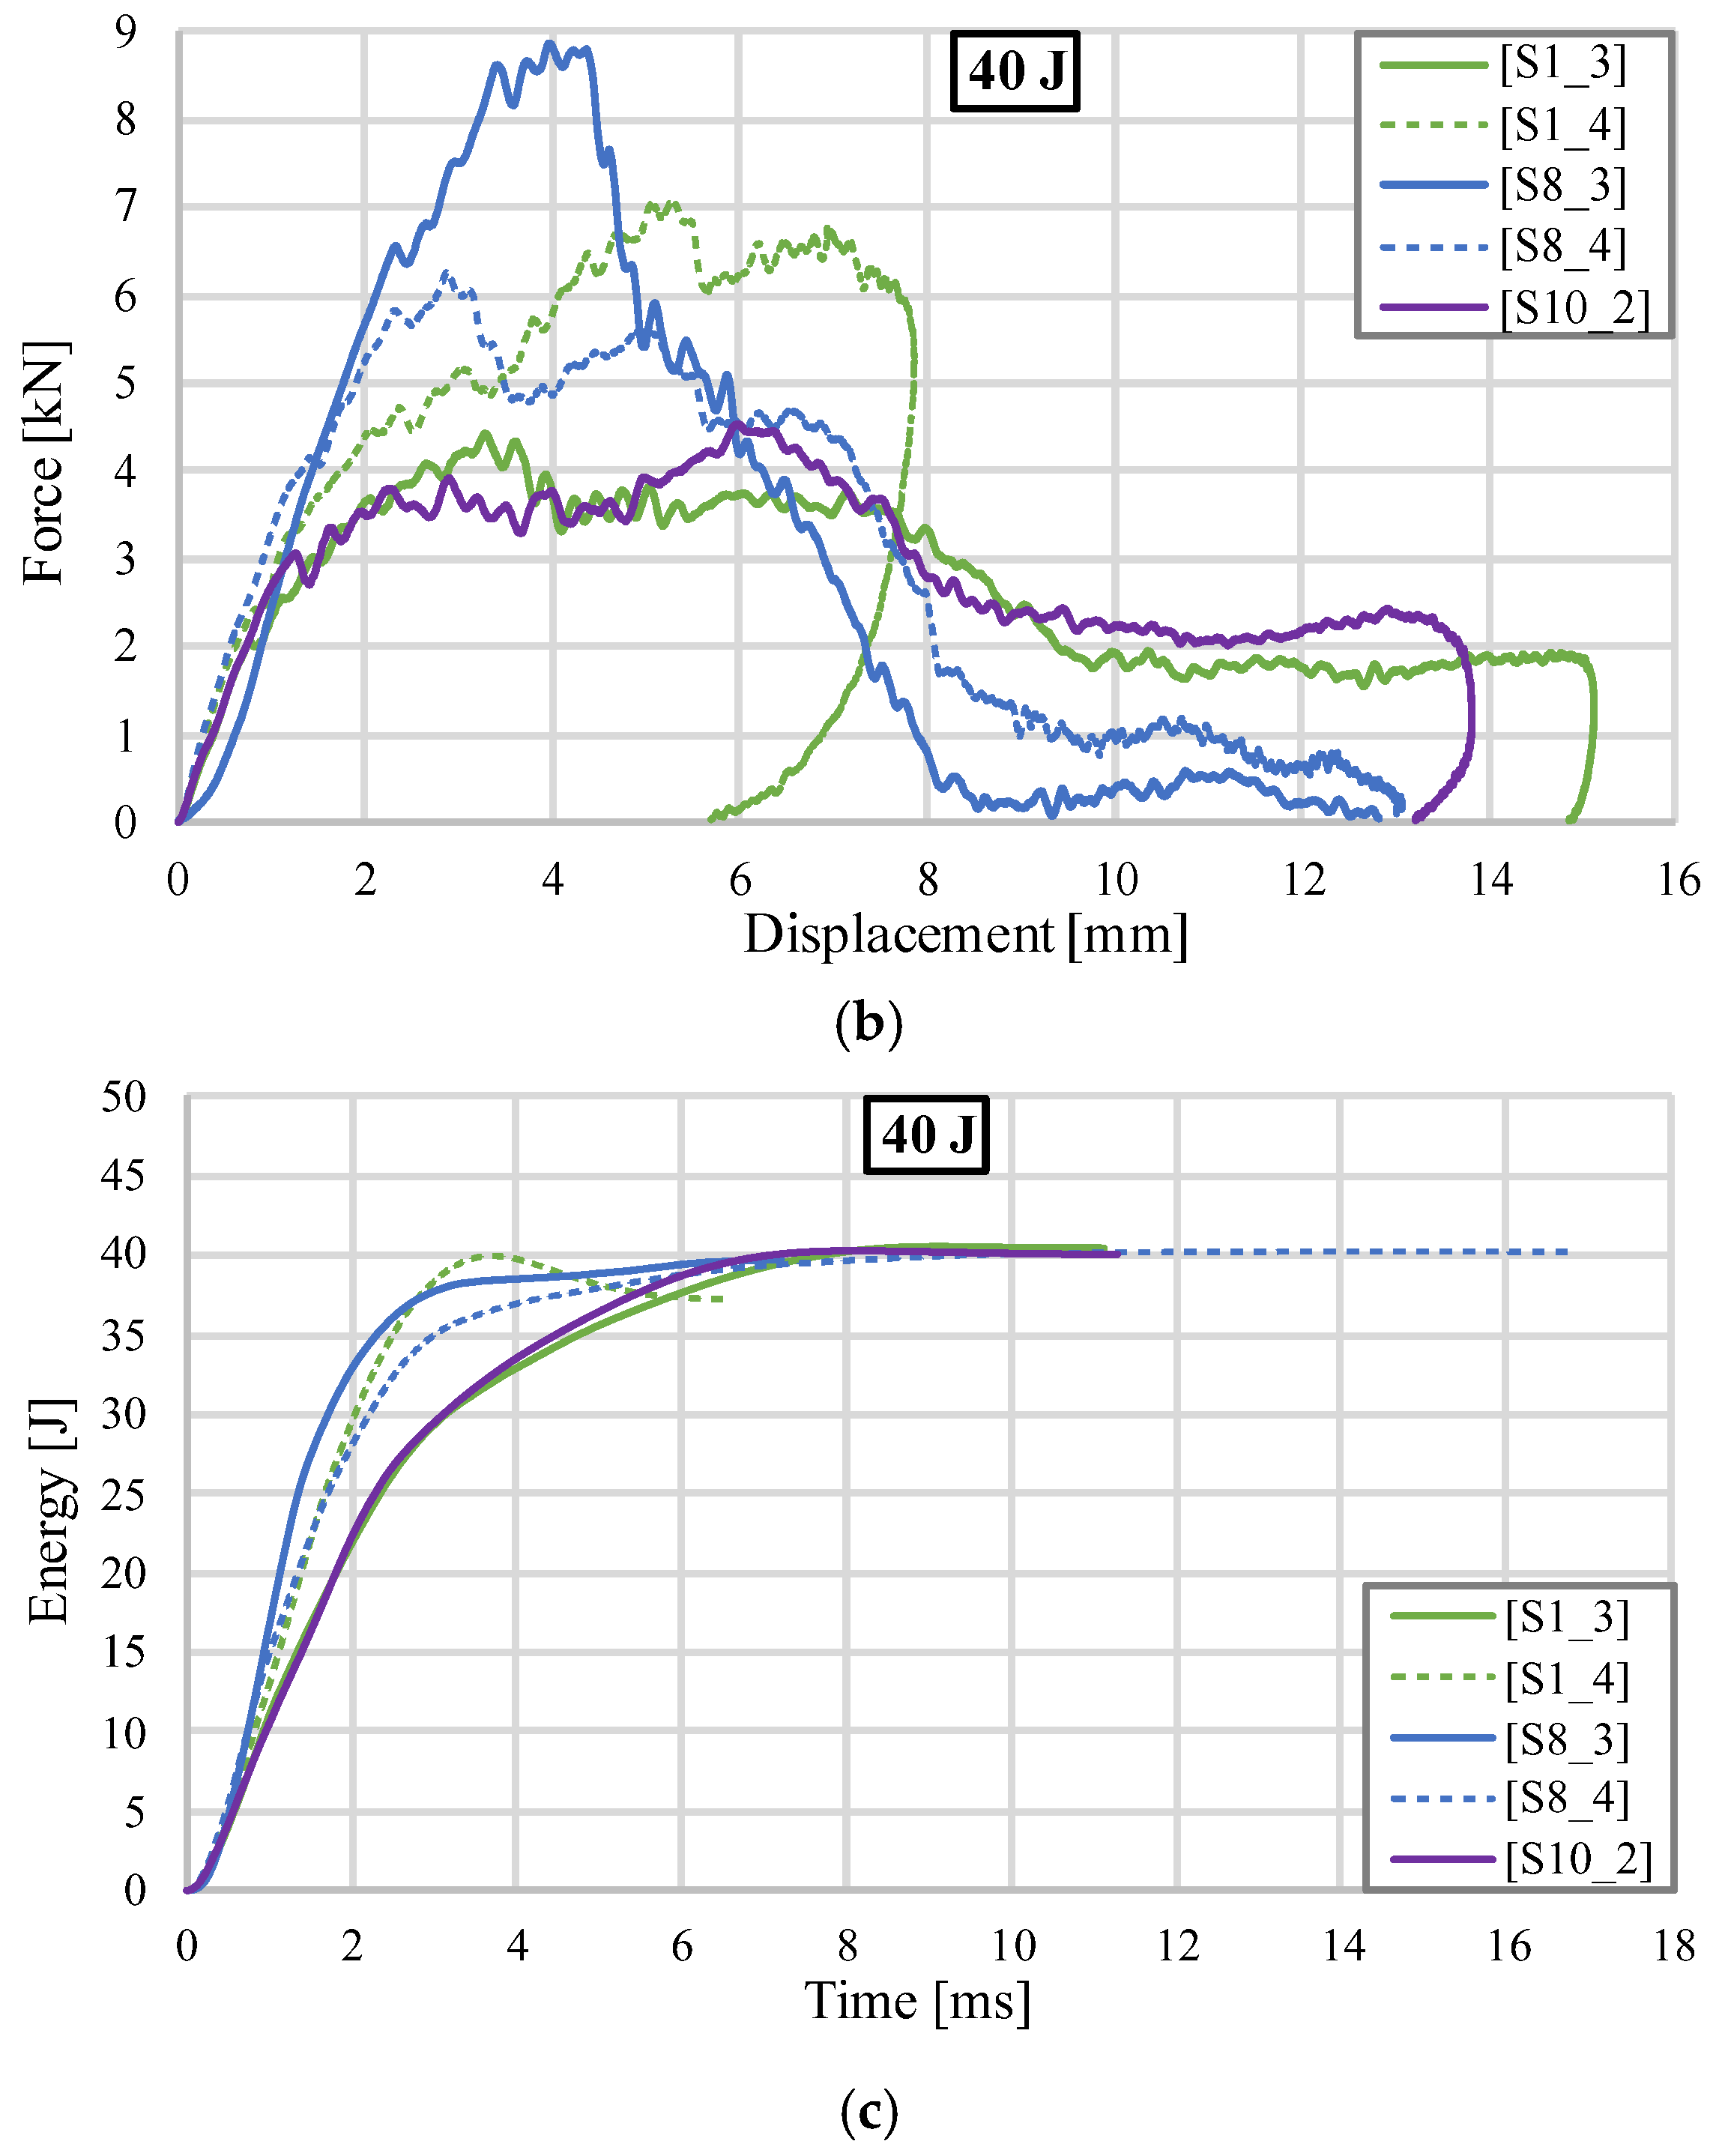
3.2. Impact Test Results at an Impact Energy of 40 J
4. Discussion and Conclusions
Author Contributions
Funding
Institutional Review Board Statement
Informed Consent Statement
Data Availability Statement
Conflicts of Interest
References
- Sjoblom, P.O.; Hartness, J.T.; Cordell, T.M. On Low-Velocity Impact Testing of Composite Materials. J. Compos. Mater. 1988, 22, 30–52. [Google Scholar] [CrossRef]
- Richardson, M.O.W.; Wisheart, M.J. Review of Low-Velocity Impact Properties of Composite Materials. Compos. Part. A Appl. Sci. Manuf. 1996, 27, 1123–1131. [Google Scholar] [CrossRef]
- Xu, Y.; Pan, H.; Wang, R.; Du, Q.; Lu, L. New Families of Triply Periodic Minimal Surface-like Shell Lattices. Addit. Manuf. 2023, 77, 103779. [Google Scholar] [CrossRef]
- Chai, G.B.; Zhu, S. A Review of Low-Velocity Impact on Sandwich Structures. Proc. Inst. Mech. Eng. Part L J. Mater. Des. Appl. 2011, 225, 207–230. [Google Scholar] [CrossRef]
- Sahu, S.K.; Sreekanth, P.S.R.; Reddy, S.V.K. A Brief Review on Advanced Sandwich Structures with Customized Design Core and Composite Face Sheet. Polymers 2022, 14, 4267. [Google Scholar] [CrossRef]
- Boonkong, T.; Shen, Y.O.; Guan, Z.W.; Cantwell, W.J. The Low Velocity Impact Response of Curvilinear-Core Sandwich Structures. Int. J. Impact Eng. 2016, 93, 28–38. [Google Scholar] [CrossRef]
- Ejeh, C.J.; Barsoum, I.; Abu Al-Rub, R.K. Impact Behavior of Periodic, Stochastic, and Anisotropic Minimal Surface-Lattice Sandwich Structures. Int. J. Mech. Sci. 2024, 276, 109359. [Google Scholar] [CrossRef]
- Fashanu, O.; Rangapuram, M.; Abutunis, A.; Newkirk, J.; Chandrashekhara, K.; Misak, H.; Klenosky, D. Mechanical Performance of Sandwich Composites with Additively Manufactured Triply Periodic Minimal Surface Cellular Structured Core. J. Sandw. Struct. Mater. 2022, 24, 1133–1151. [Google Scholar] [CrossRef]
- Özen, İ.; Çava, K.; Gedikli, H.; Alver, Ü.; Aslan, M. Low-Energy Impact Response of Composite Sandwich Panels with Thermoplastic Honeycomb and Reentrant Cores. Thin-Walled Struct. 2020, 156, 106989. [Google Scholar] [CrossRef]
- Bates, S.R.G.; Farrow, I.R.; Trask, R.S. Compressive Behaviour of 3D Printed Thermoplastic Polyurethane Honeycombs with Graded Densities. Mater. Des. 2019, 162, 130–142. [Google Scholar] [CrossRef]
- Almesmari, A.; Barsoum, I.; Abu Al-Rub, R.K. Topology Optimised Novel Lattice Structures for Enhanced Energy Absorption and Impact Resistance. Virtual Phys. Prototyp. 2024, 19, e2361463. [Google Scholar] [CrossRef]
- Hao, H.; Joe, C.-R.; Kim, D.-U. Mechanical Behavior of Rubberfilled Multifunctional Honeycomb Sandwich Composite. In Sandwich Structures 7: Advancing with Sandwich Structures and Materials; Springer: Amsterdam, The Netherlands, 2005; pp. 671–680. [Google Scholar] [CrossRef]
- Kao, Y.T.; Amin, A.R.; Payne, N.; Wang, J.; Tai, B.L. Low-Velocity Impact Response of 3D-Printed Lattice Structure with Foam Reinforcement. Compos. Struct. 2018, 192, 93–100. [Google Scholar] [CrossRef]
- Karahan, M.; Gül, H.; Ivens, J.; Karahan, N. Low Velocity Impact Characteristics of 3D Integrated Core Sandwich Composites. Text. Res. J. 2012, 82, 945–962. [Google Scholar] [CrossRef]
- Deng, Y.; Wang, Y.; Niu, Y.; Feng, Z.; Wei, G. Research on the Influence of Foaming Silica Gel-Filled on Low-Velocity Impact Performance of M-Type GFRP Foldcore Sandwich Structure. Mech. Adv. Mater. Struct. 2024, 31, 10298–10313. [Google Scholar] [CrossRef]
- Yin, S.; Wu, L.; Yang, J.; Ma, L.; Nutt, S. Damping and Low-Velocity Impact Behavior of Filled Composite Pyramidal Lattice Structures. J. Compos. Mater. 2014, 48, 1789–1800. [Google Scholar] [CrossRef]
- Vasile, A.; Constantinescu, D.M.; Coropețchi, I.C.; Sorohan, Ș.; Apostol, D.A. Assessment of the Additive Fabrication Quality of Sandwich Structures with Novel Triply Periodic Minimal Surface Cores. Solids 2024, 5, 665–680. [Google Scholar] [CrossRef]
- Vasile, A.; Constantinescu, D.M.; Coropețchi, I.C.; Sorohan, Ș.; Apostol, D.A. Definition, Fabrication, and Compression Testing of Sandwich Structures with Novel TPMS-Based Cores. Materials 2024, 17, 5150. [Google Scholar] [CrossRef]
- Xue, Z.; Geng, X.; Li, X.; Cao, Y.; Zhang, J.; Aydeng, A.; Liu, J. Compressive Mechanical Properties of Lattice Structures Filled with Silicone Rubber. Mech. Adv. Mater. Struct. 2024, 31, 9062–9072. [Google Scholar] [CrossRef]
- Xue, Y.; Wang, X.; Wang, X.; Han, F. Compressive Behavior and Deformation Characteristic of Al-Based Auxetic Lattice Structure Filled with Silicate Rubber. MSF 2018, 933, 240–245. [Google Scholar] [CrossRef]
- ZA 22 Mould, Zhermack. Available online: https://mbfgfiles.co.uk/datasheets/za22_mould_tech.pdf (accessed on 26 May 2025).
- ASTM D3763-18; Test Method for High Speed Puncture Properties of Plastics Using Load and Displacement Sensors. ASTM International: West Conshohocken, PA, USA, 2018.
- INSTRON. CEAST Division Visual IMPACT. In Instruction Manual; Instron: Torino, Italy, 2014; Volume 0710.690MN1, pp. 103–106. [Google Scholar]
- Cetin, E.; Baykasoğlu, C. Energy Absorption of Thin-Walled Tubes Enhanced by Lattice Structures. Int. J. Mech. Sci. 2019, 157–158, 471–484. [Google Scholar] [CrossRef]
- Mocian, O.A. Low-Speed Impact Response Analysis of Foam Core Sandwich Structures. Ph.D. Thesis, University POLITEHNICA of Bucharest, Bucharest, Romania, 2019. [Google Scholar]
- Indres, I.A. Low-Speed Impact Analysis of Sandwich Structures Made by Rapid Prototyping. Ph.D. Thesis, National University of Science and Technology POLITEHNICA Bucharest, Bucharest, Romania, 2024. [Google Scholar]
- Yu, T.X.; Xiang, Y.; Wang, M.; Yang, L. Key Performance Indicators of Tubes Used as Energy Absorbers. Key Eng. Mater. 2015, 626, 155–161. [Google Scholar] [CrossRef]
- Dehkordi, M.T.; Nosraty, H.; Shokrieh, M.M.; Minak, G.; Ghelli, D. Low Velocity Impact Properties of Intra-Ply Hybrid Composites Based on Basalt and Nylon Woven Fabrics. Mater. Des. 2010, 31, 3835–3844. [Google Scholar] [CrossRef]
- Moure, M.M.; Rubio, I.; Aranda-Ruiz, J.; Loya, J.A.; Rodríguez-Millán, M. Analysis of Impact Energy Absorption by Lightweight Aramid Structures. Compos. Struct. 2018, 203, 917–926. [Google Scholar] [CrossRef]


| Characteristic | Value |
|---|---|
| Mixing ratio (parts by weight) | 1:1 |
| Viscosity after mixing | 4500 ± 300 cP |
| Density after mixing | 1.13 g/cm3 |
| Mixing time at 23 °C | 1 min |
| Application time at 23 °C | 14–17 min |
| Curing time at 23 °C | 60–90 min |
| Hardness–Shore A after 24 h | 21 ± 2 shA |
| Tensile strength after 24 h | 4 ± 0.2 N/mm2 |
| Specific strain at break after 24 h | 480% |
| Reproduction details | Up to 2 µm |
| Dimensional variation | max 0.05% after 24 h |
| No. in Figure 2 | Equipment | Characteristics |
|---|---|---|
| 1 | Vacuum Pump VE2100N | Flow rate: 283 l/min; Vacuum depth: 2 × 10⁶ bar |
| 2 | Precision Balance PFB2000-2 | Accuracy: 0.01 g |
| 3 | Vacuum Chamber | Made of aluminum |
| 4 | Manometer | Measuring range: −1~0 bar relative pressure |
| 5 | Shaker 2075E | Maximum stroke: 25.4 mm; Maximum weight: 3.2 kg; Maximum speed: 1.8 m/s |
| 6 | Arbitrary Function Generator XDG2035 | Frequency: 1 µHz~15 MHz; Accuracy: ±2 ppm |
| 7 | Power Amplifier 2050E09 | Output voltage: 50 V; Output power: 1000 VA |
| Sample | Figure | Mass [g] | Sample | Figure | Mass [g] |
|---|---|---|---|---|---|
| S1_1 |  | 66.99 | S8_1 | 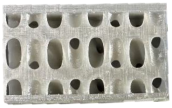 | 66.61 |
| S1_2 | 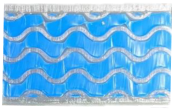 | 67.47 | S8_2 |  | 65.87 |
| 147.2 with silicone | 146.3 with silicone | ||||
| S1_3 | 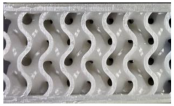 | 66.07 | S8_3 | 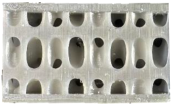 | 66.01 |
| S1_4 | 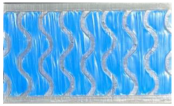 | 66.9 | S8_4 | 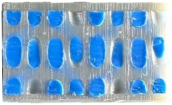 | 66.6 |
| 146.5 with silicon | 147.3 with silicon | ||||
| S10_1 | 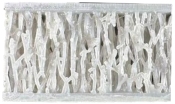 | 67.77 | S10_2 |  | 66.34 |
| Impact Energy | Fall Height | Falling Mass | Impact Velocity | Samples Tested |
|---|---|---|---|---|
| 30 J | 946 mm | 3.233 kg | 4.31 m/s | S1-1, S1-2, S8-1, S8-2, S10-1 |
| 40 J | 779 mm | 5.233 kg | 3.91 m/s | S1-3, S1-4, S8-3, S8-4, S10-2 |
| Sample | Impact Energy [J] | Mass [g] | Maximum Force [kN] | Maximum Deformation [mm] | Total Absorbed Energy [J] | Average Impact Force [kN] | Specific Absorbed Energy [J/kg] | Impact Force Efficiency [-] | Recovered Energy [J] | Damping Index [-] |
|---|---|---|---|---|---|---|---|---|---|---|
| S1_1 | 30 | 67 | 5.413 | 7.76 | 29.07 | 3.75 | 433.95 | 0.692 | 0.93 | 31.25 |
| S1_2 | 30 | 147 | 6.35 | 7.33 | 29.72 | 4.05 | 201.90 | 0.639 | 0.28 | 106.14 |
| S8_1 | 30 | 66.6 | 5.798 | 8.33 | 29.78 | 3.58 | 447.08 | 0.617 | 0.22 | 135.36 |
| S8_2 | 30 | 146 | 7.911 | 10.43 | 29.88 | 2.86 | 204.24 | 0.362 | 0.12 | 249 |
| S10_1 | 30 | 67.8 | 3.275 | 17.27 | 30.19 | 1.75 | 445.48 | 0.534 | 0.19 | 158.89 |
| S1_3 | 40 | 66.1 | 4.428 | 15.09 | 40.35 | 2.67 | 610.72 | 0.604 | 0.35 | 115.28 |
| S1_4 | 40 | 147 | 7.067 | 7.86 | 37.17 | 4.73 | 253.72 | 0.669 | 2.83 | 13.13 |
| S8_3 | 40 | 66 | 8.869 | 12.81 | 39.75 | 3.10 | 602.18 | 0.350 | 0.25 | 159 |
| S8_4 | 40 | 147 | 6.271 | 13.04 | 39.61 | 3.04 | 268.91 | 0.484 | 0.39 | 101.56 |
| S10_2 | 40 | 66.3 | 4.526 | 13.82 | 39.93 | 2.89 | 601.90 | 0.638 | 0.07 | 570.42 |
Disclaimer/Publisher’s Note: The statements, opinions and data contained in all publications are solely those of the individual author(s) and contributor(s) and not of MDPI and/or the editor(s). MDPI and/or the editor(s) disclaim responsibility for any injury to people or property resulting from any ideas, methods, instructions or products referred to in the content. |
© 2025 by the authors. Licensee MDPI, Basel, Switzerland. This article is an open access article distributed under the terms and conditions of the Creative Commons Attribution (CC BY) license (https://creativecommons.org/licenses/by/4.0/).
Share and Cite
Vasile, A.; Constantinescu, D.M.; Coropețchi, I.C.; Sorohan, Ș.; Indreș, A.I. Low-Velocity Impact Response of Novel TPMS and Stochastic Lattice Cores of Sandwich Structures. Materials 2025, 18, 2889. https://doi.org/10.3390/ma18122889
Vasile A, Constantinescu DM, Coropețchi IC, Sorohan Ș, Indreș AI. Low-Velocity Impact Response of Novel TPMS and Stochastic Lattice Cores of Sandwich Structures. Materials. 2025; 18(12):2889. https://doi.org/10.3390/ma18122889
Chicago/Turabian StyleVasile, Alexandru, Dan Mihai Constantinescu, Iulian Constantin Coropețchi, Ștefan Sorohan, and Andrei Ioan Indreș. 2025. "Low-Velocity Impact Response of Novel TPMS and Stochastic Lattice Cores of Sandwich Structures" Materials 18, no. 12: 2889. https://doi.org/10.3390/ma18122889
APA StyleVasile, A., Constantinescu, D. M., Coropețchi, I. C., Sorohan, Ș., & Indreș, A. I. (2025). Low-Velocity Impact Response of Novel TPMS and Stochastic Lattice Cores of Sandwich Structures. Materials, 18(12), 2889. https://doi.org/10.3390/ma18122889