
Optimization of the Proportioning and Microscopic Mechanism Study of Cement Mortar Prepared with Copper Tailings as Fine Aggregate


Abstract
1. Introduction
2. Materials and Methods
2.1. Raw Materials and Properties
2.1.1. Cement
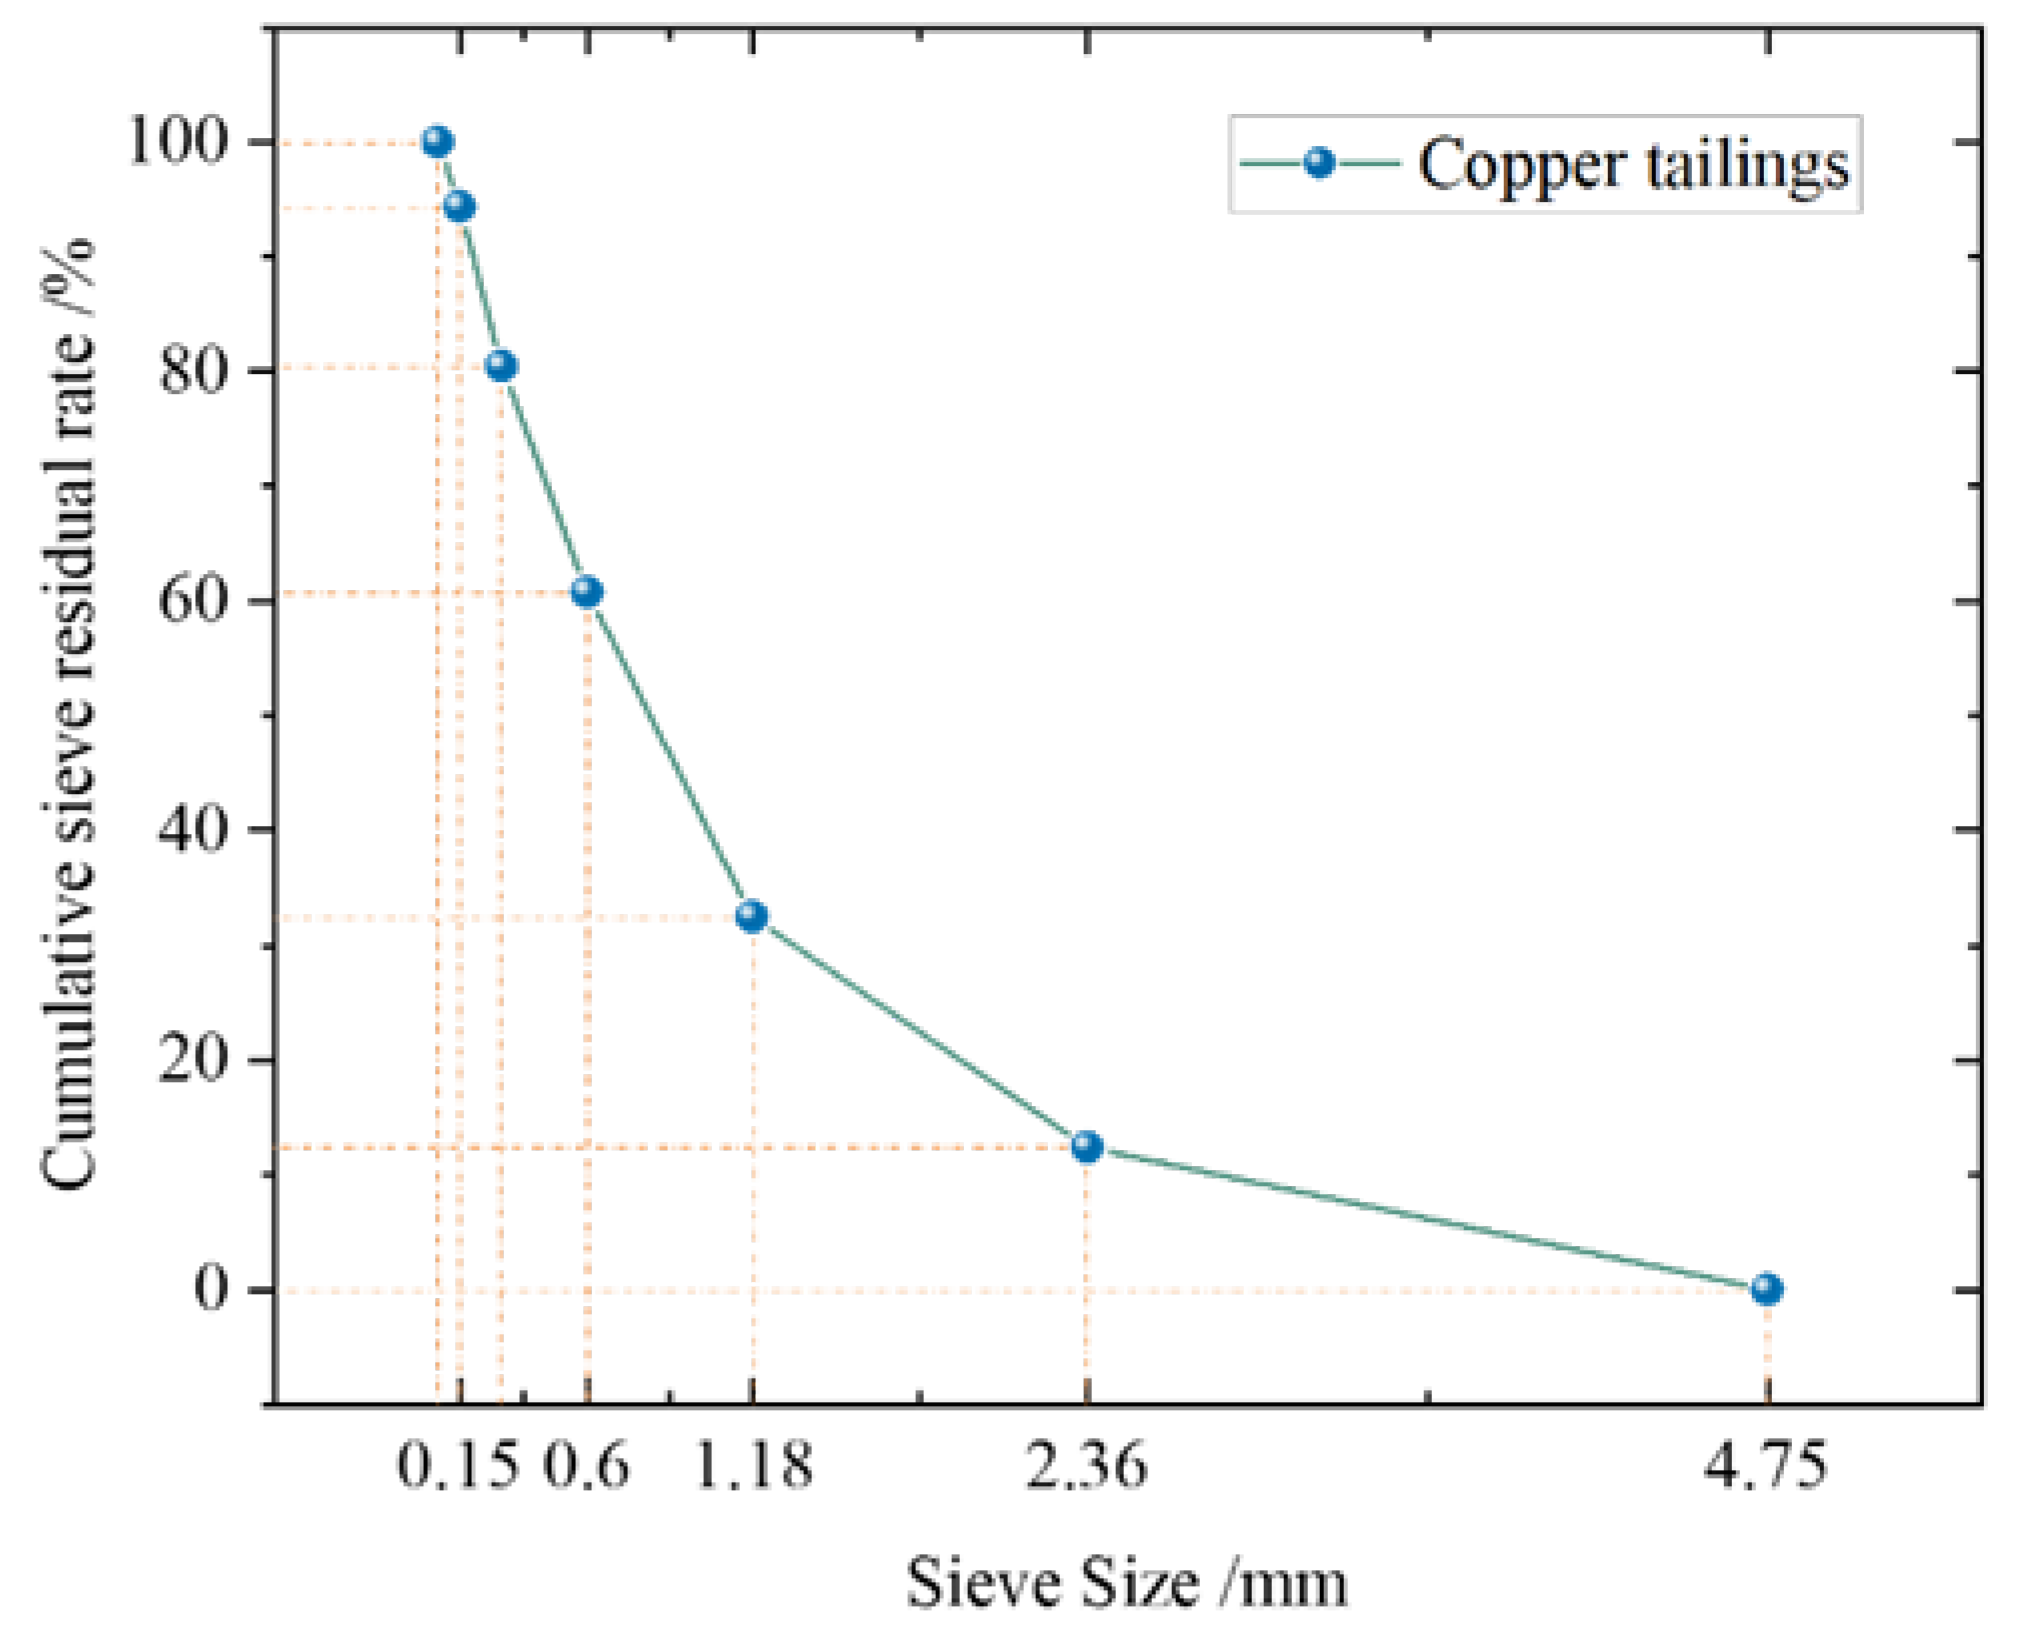
2.1.2. Aggregates
2.1.3. Admixtures
2.1.4. Water
2.2. Experimental Design and Analytical Study
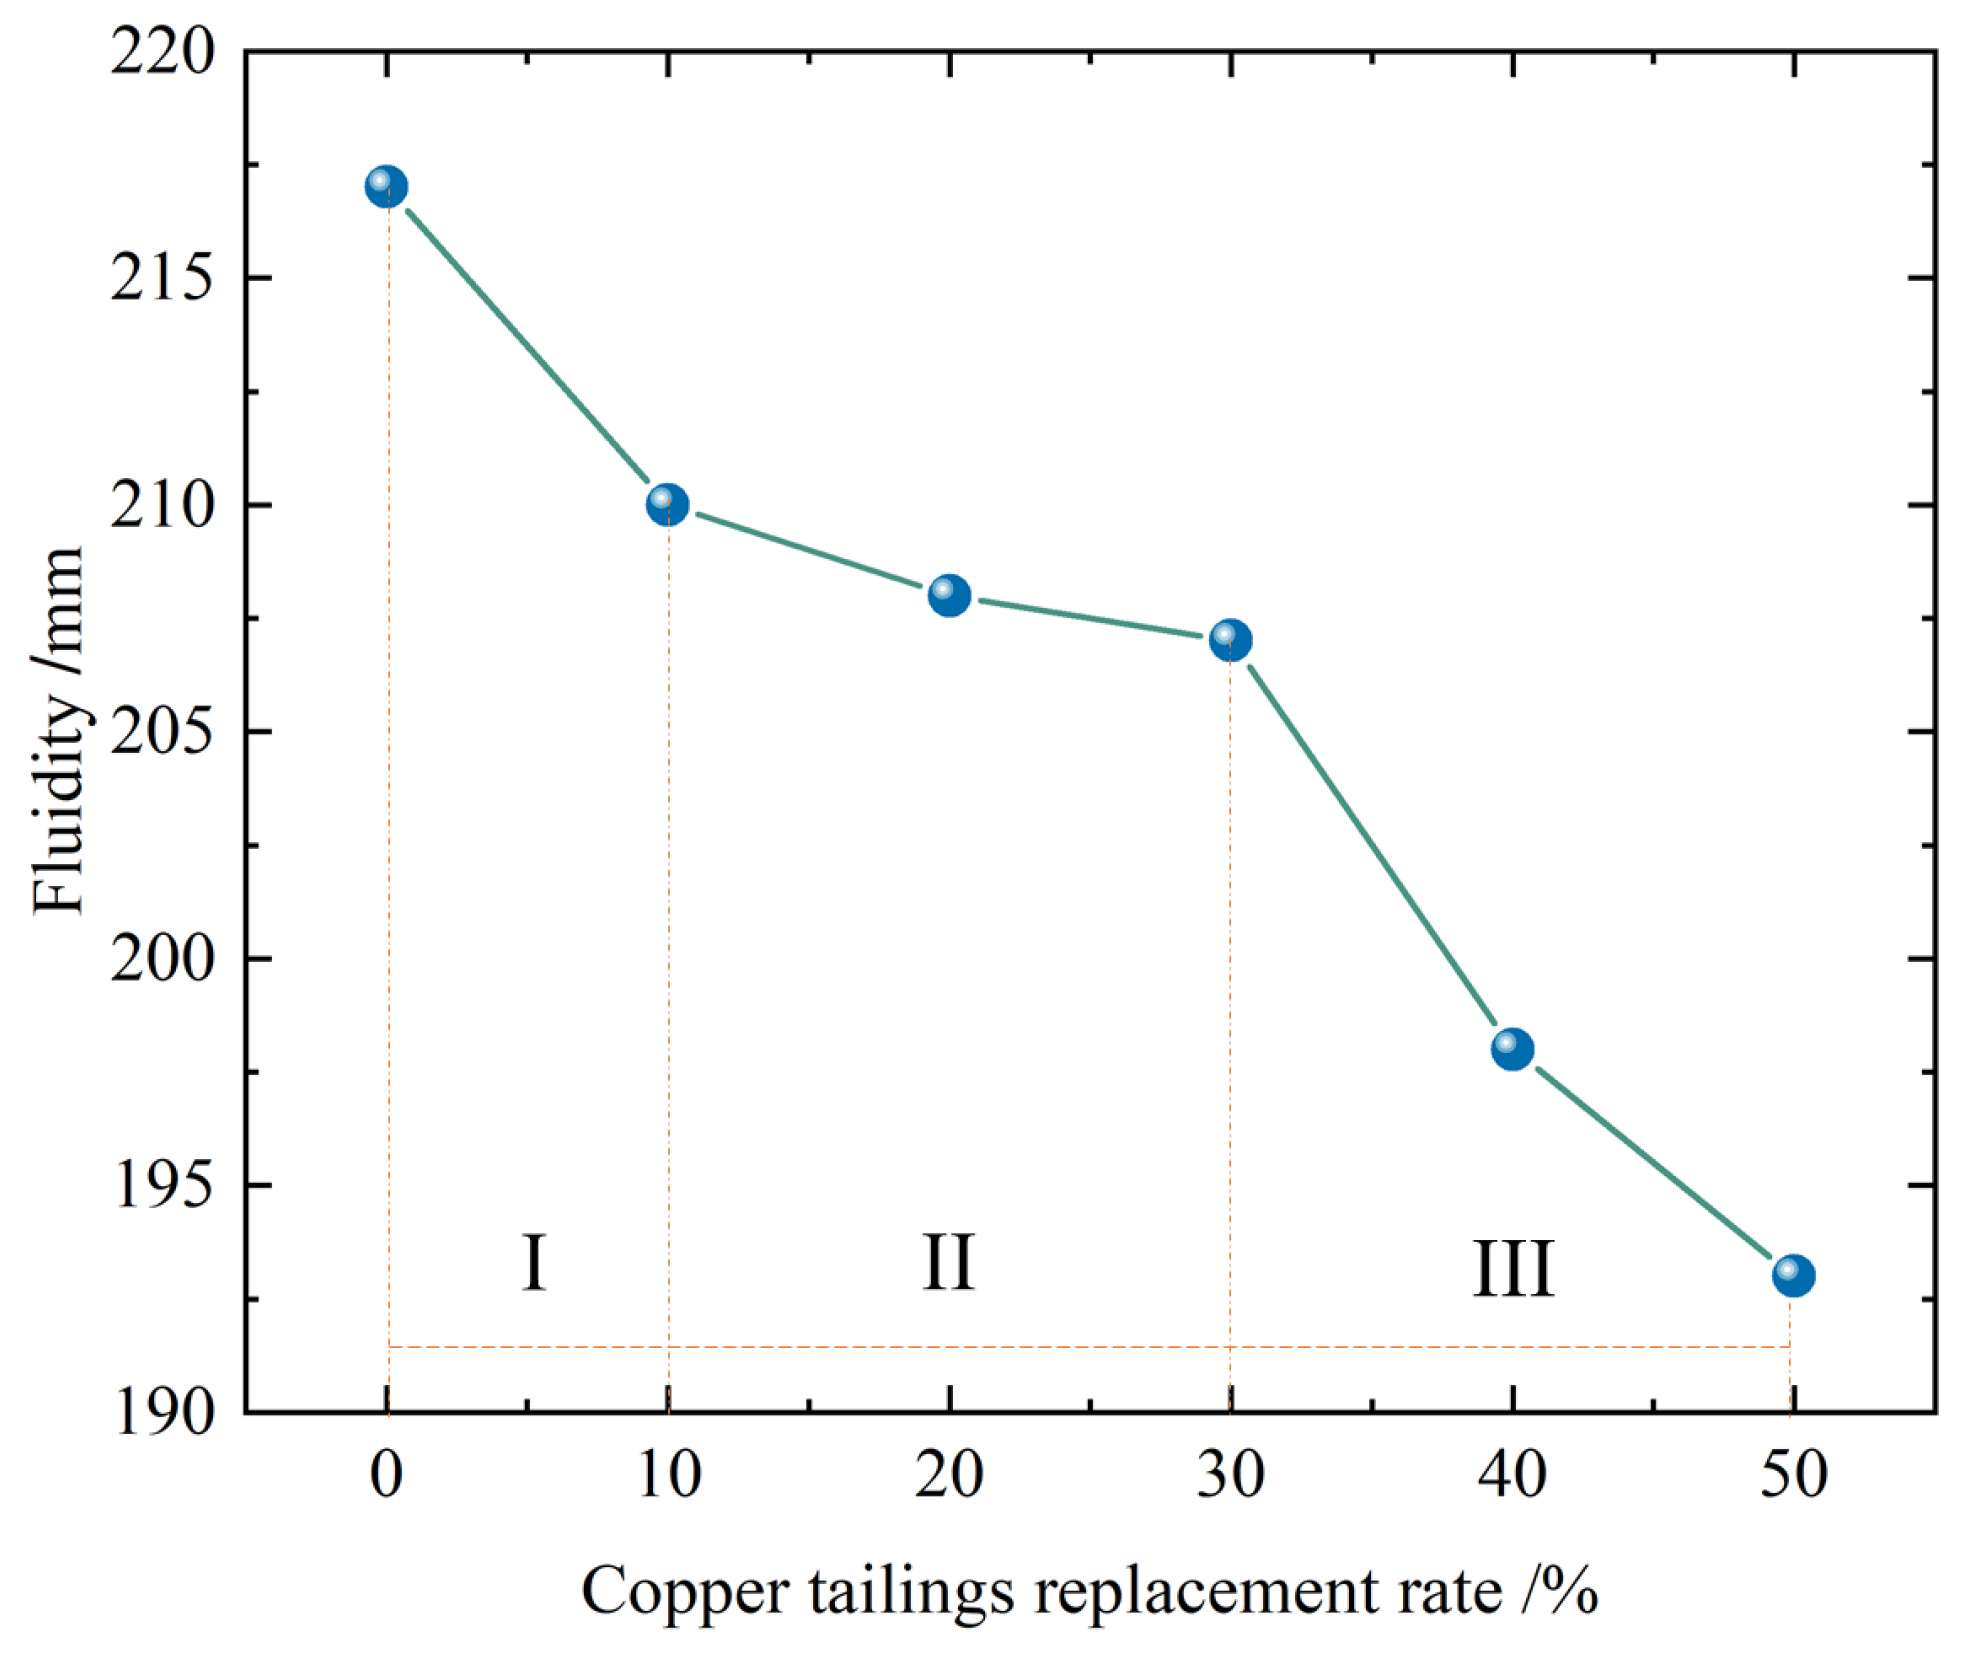
2.2.1. The Influence of Replacement Ratio on the Workability
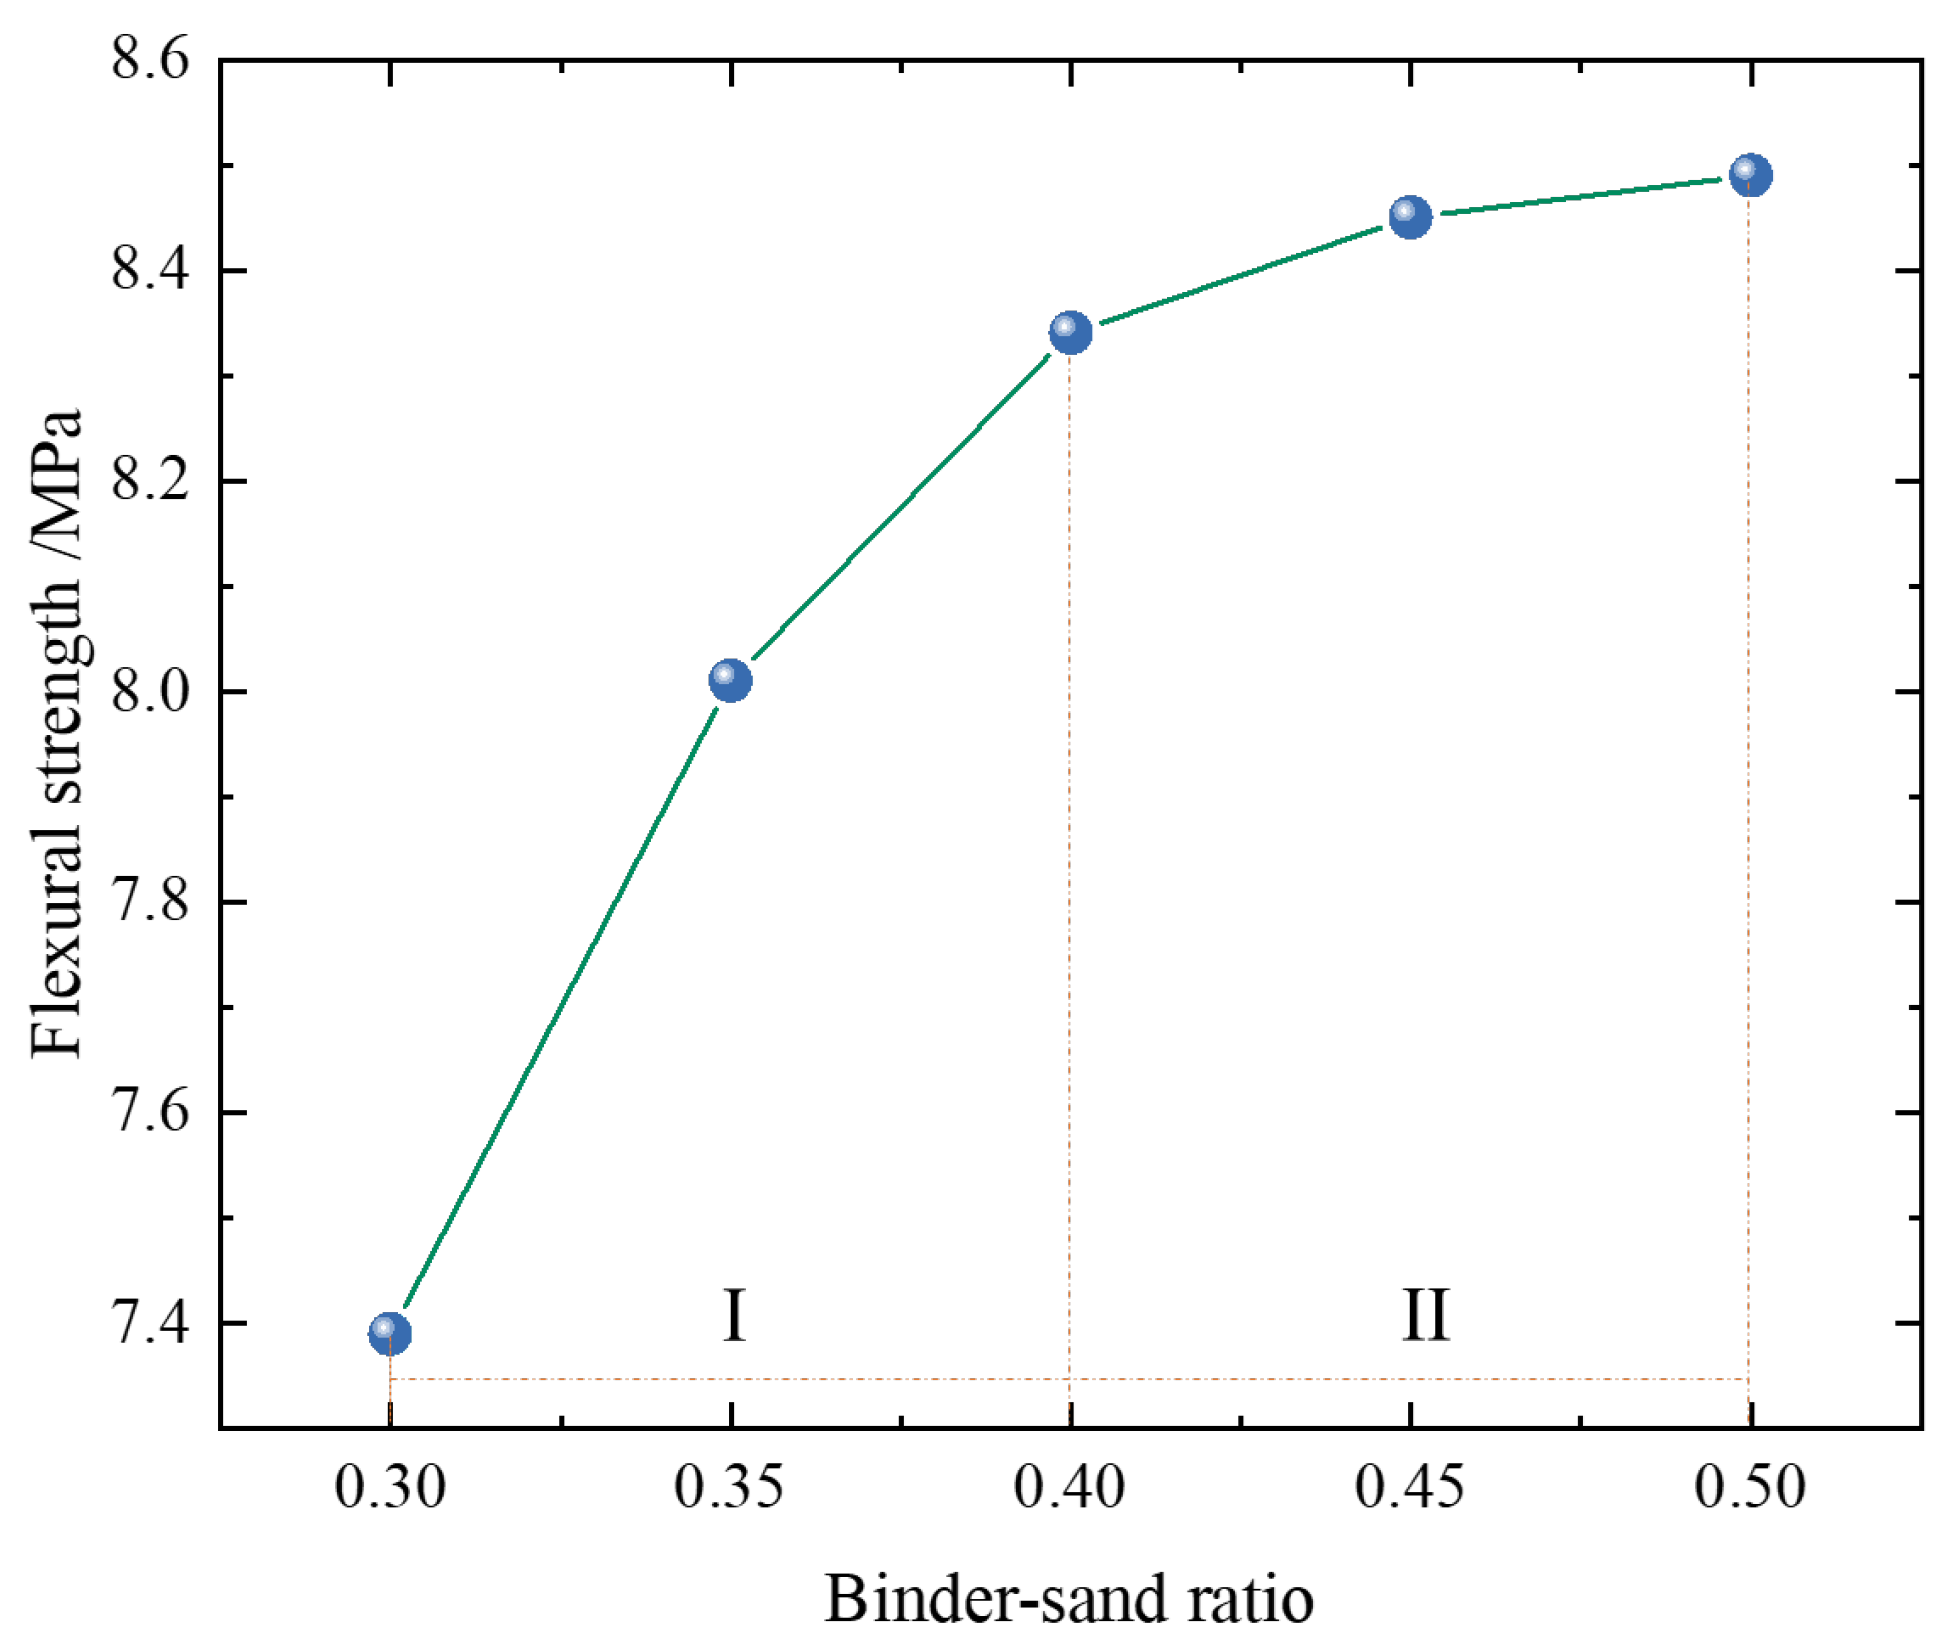
2.2.2. Impact of Binder–Sand Ratio on Strength
2.2.3. Mix Design
- 1.
- Experimental design
- 2.
- Response surface prediction model
- 3.
- Mix ratio optimization based on grey correlation
2.3. Experimental and Testing Methods
2.3.1. Test Method
2.3.2. SEM Testing
3. Results and Analysis
3.1. Mix-Design Test Results
3.2. Response Surface Analysis
3.2.1. Establish the Response Surface Model
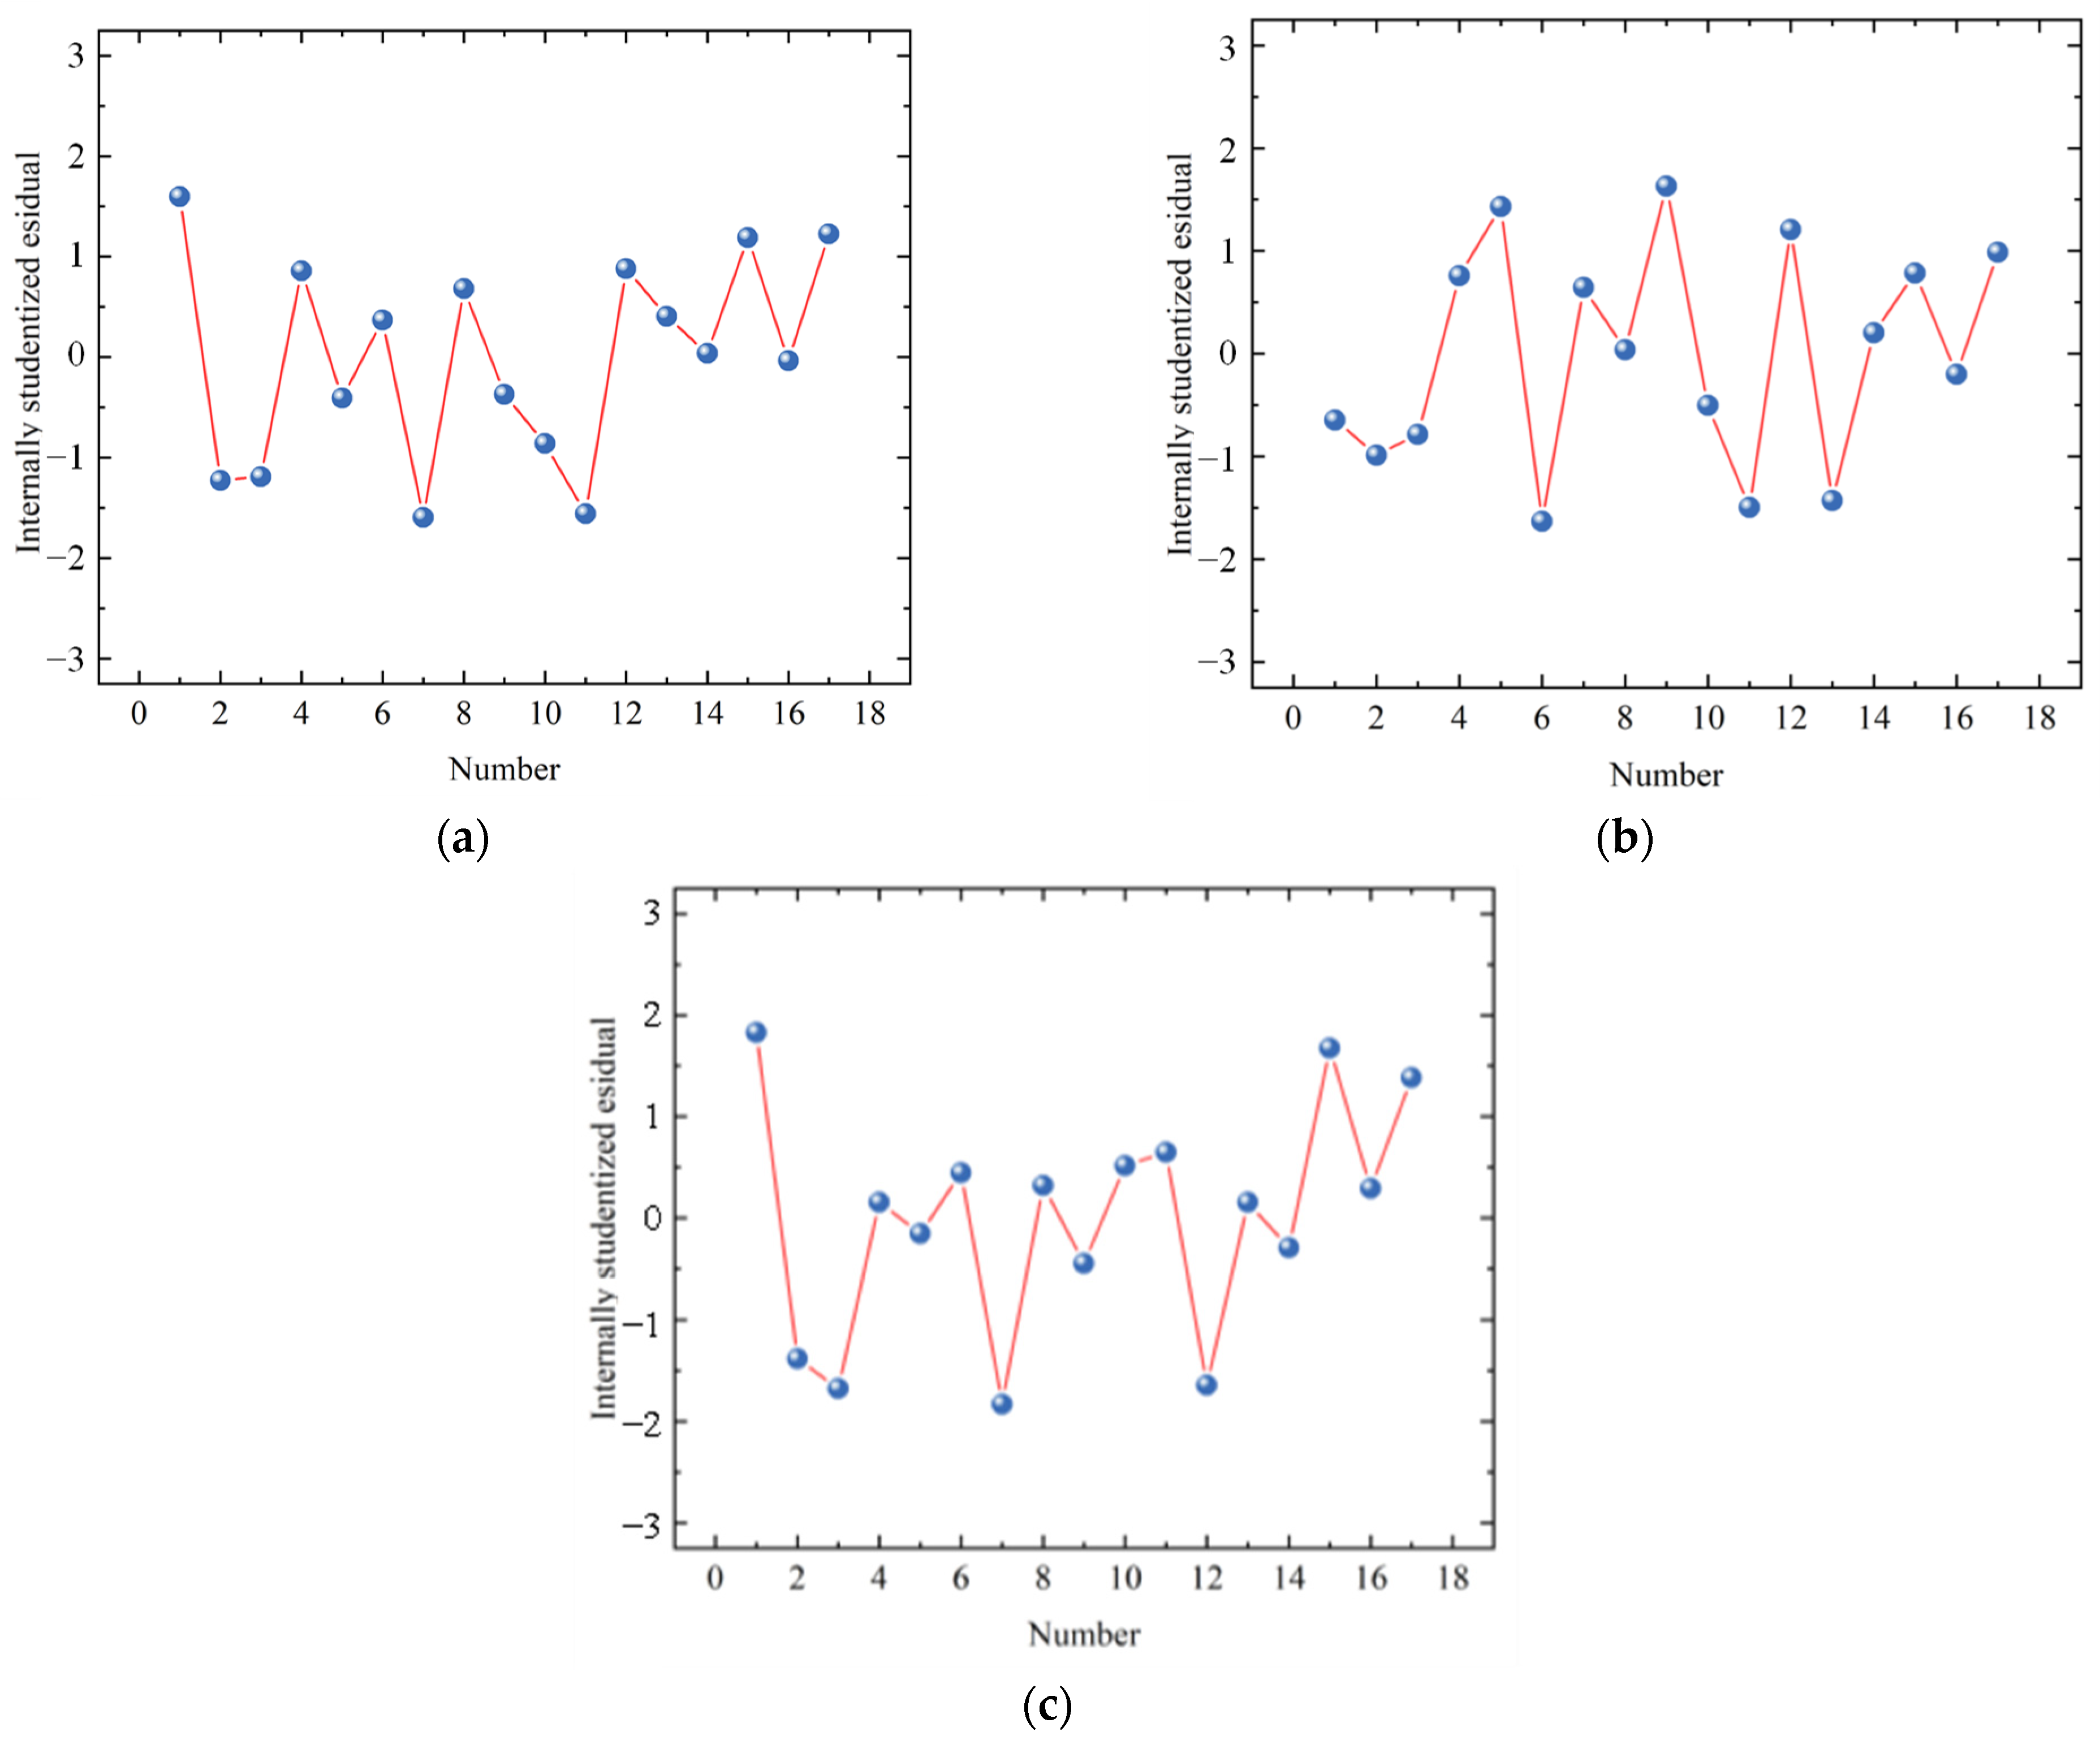
3.2.2. Model Significance Analysis
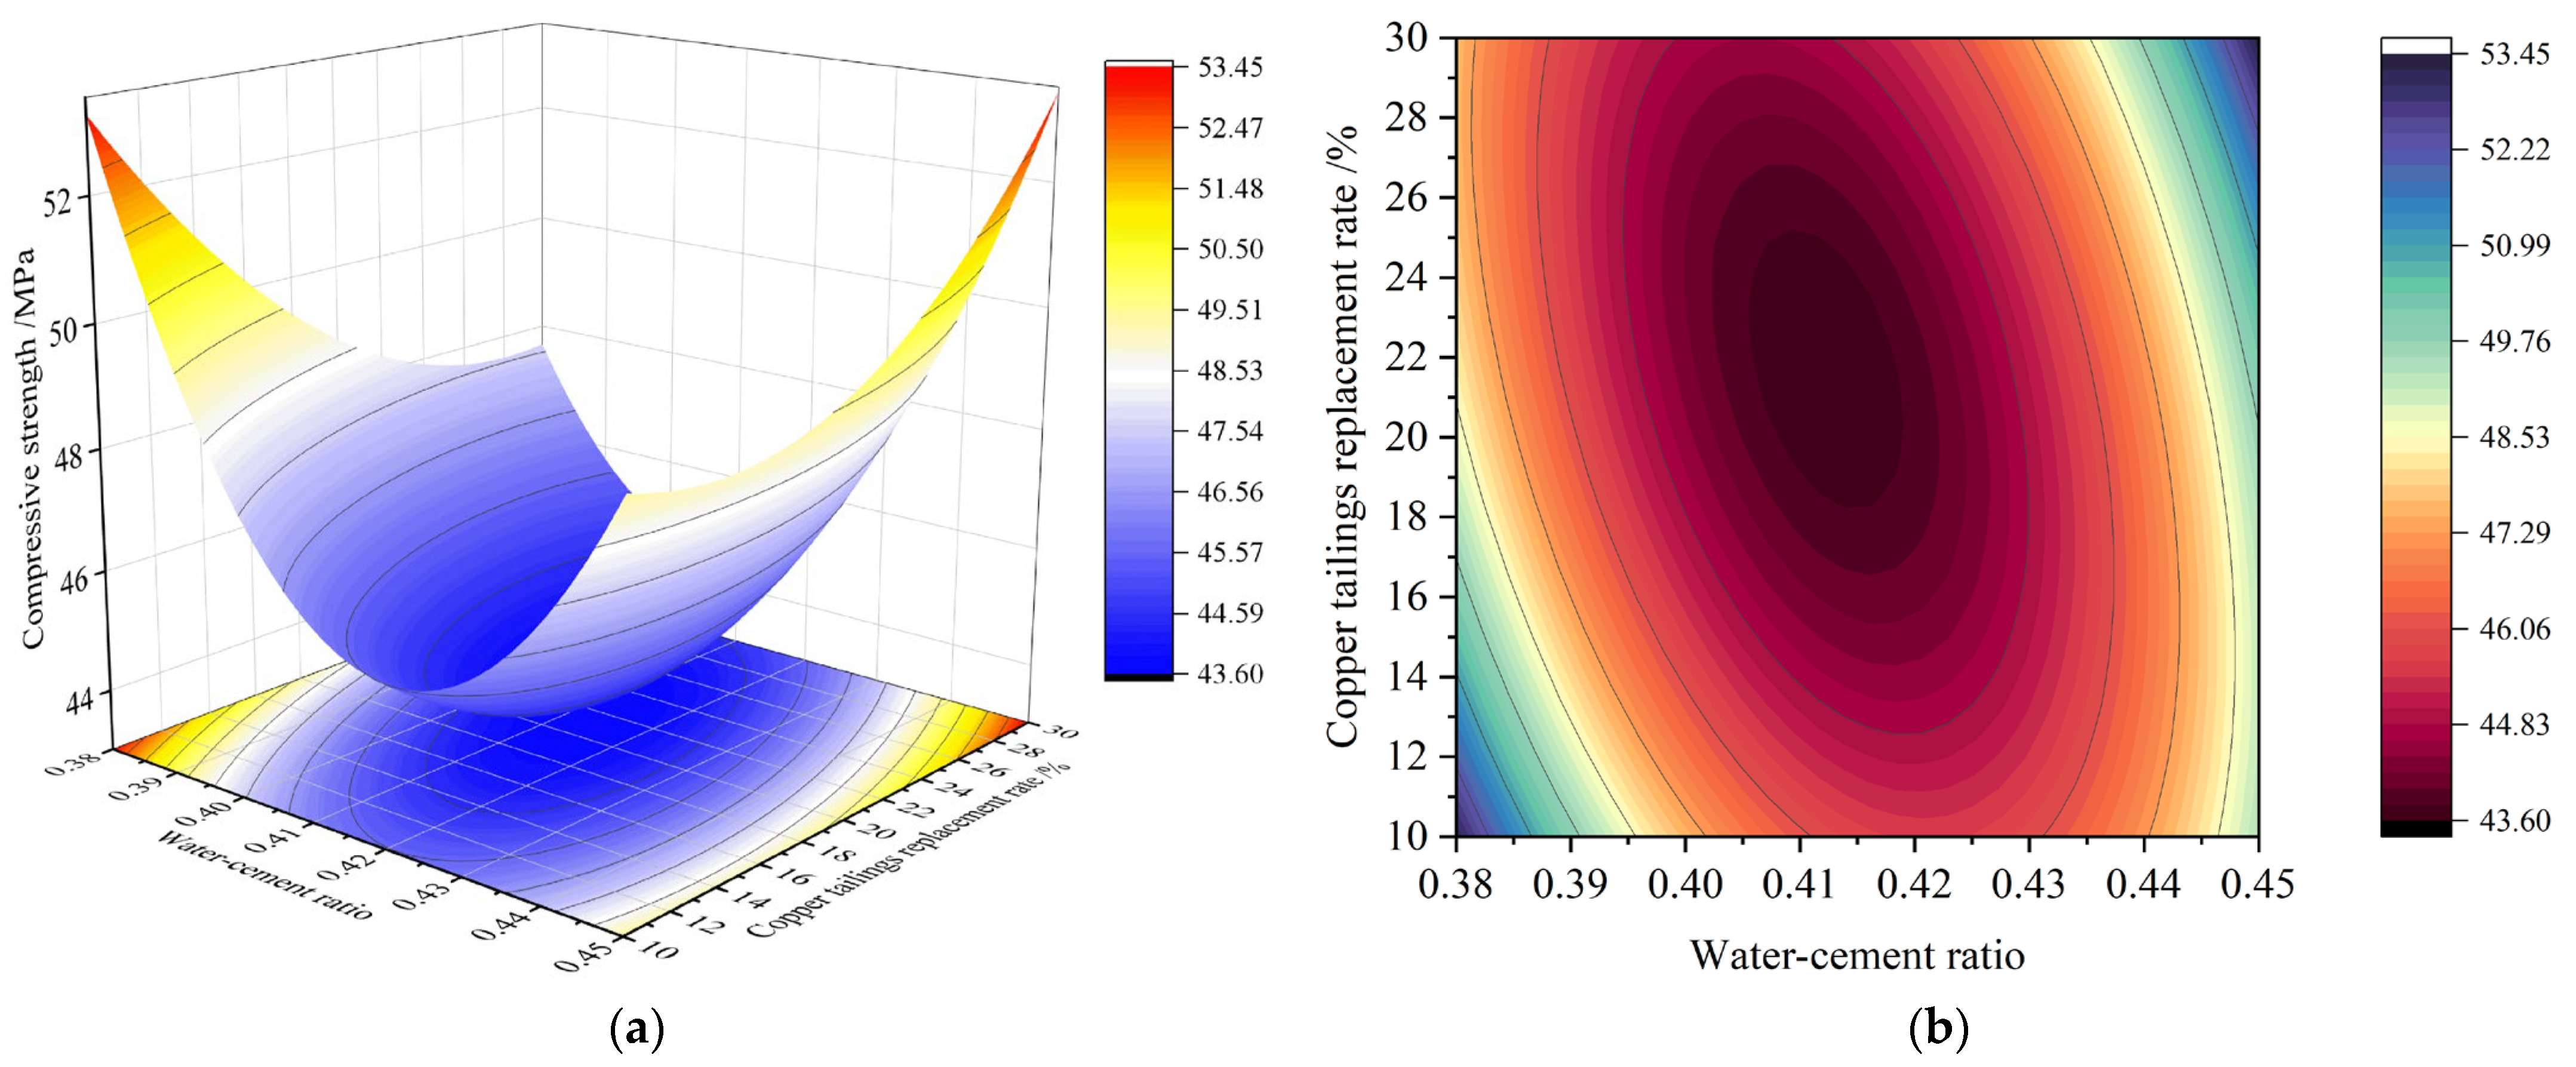
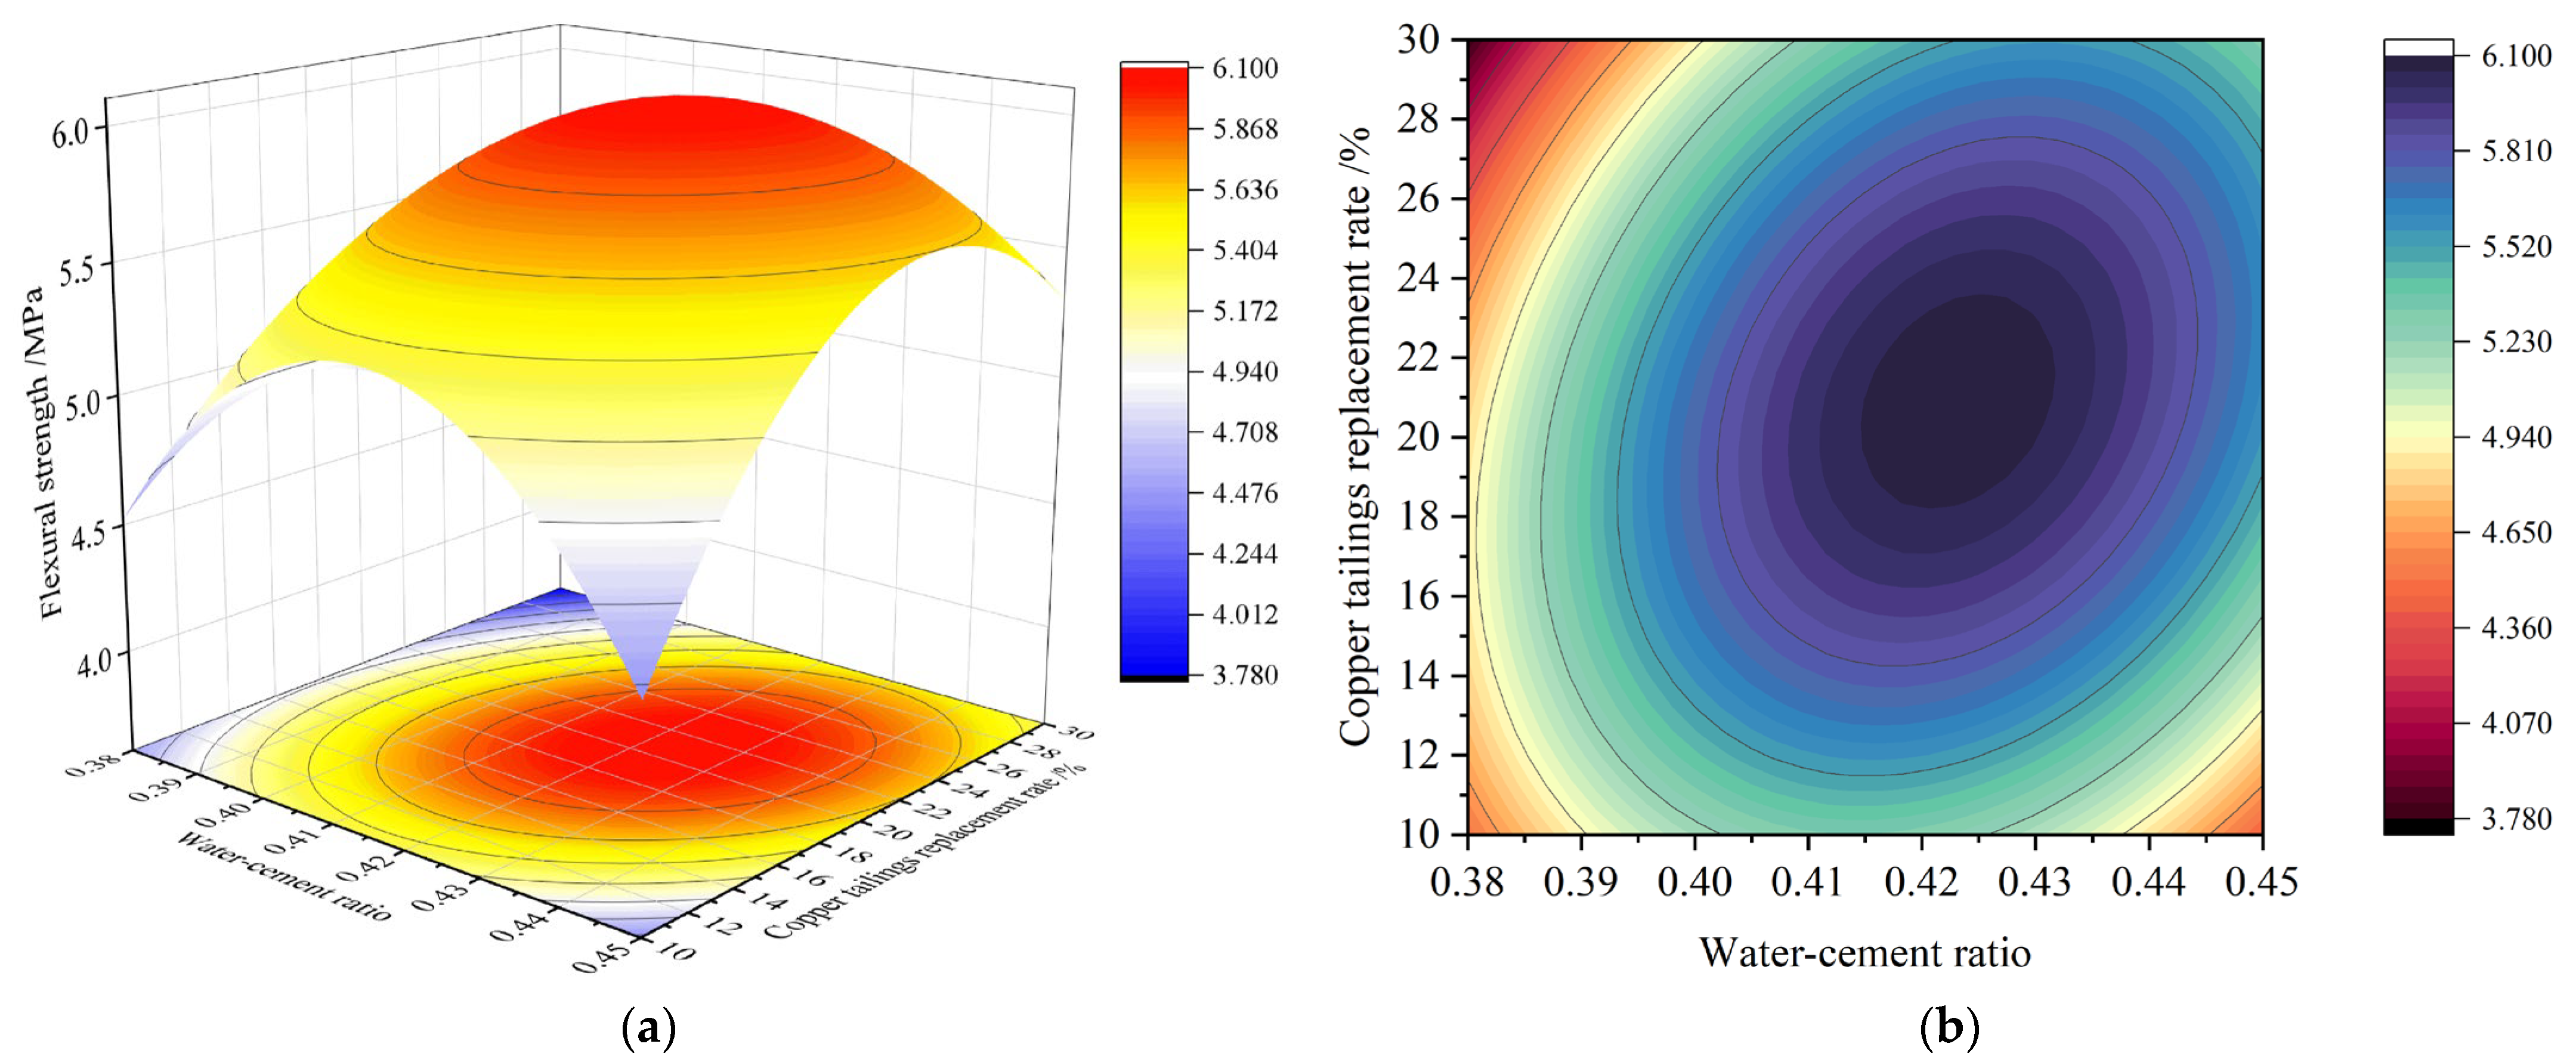
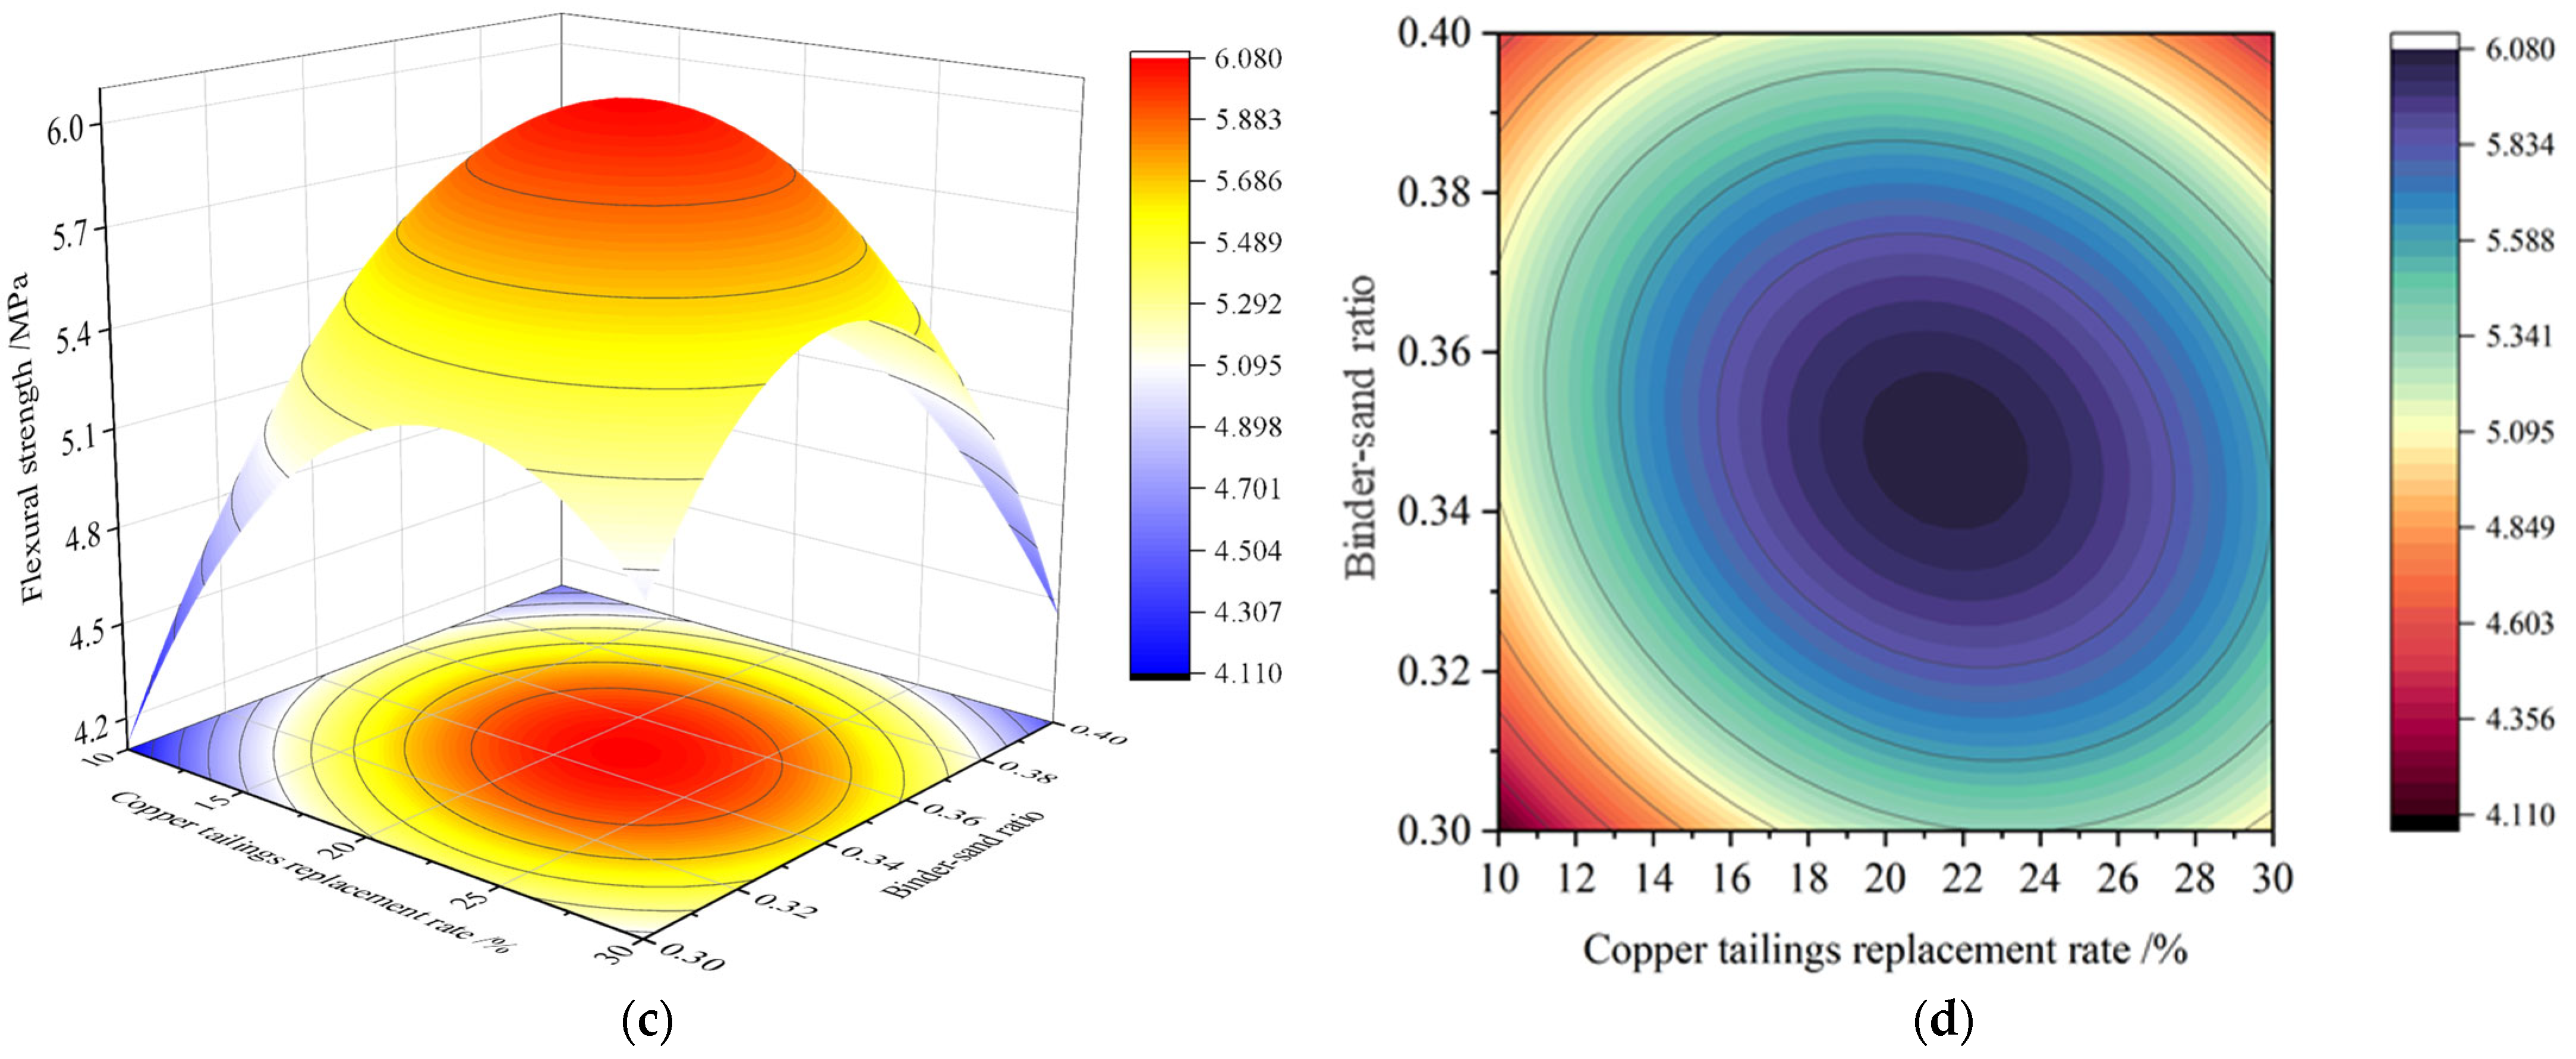
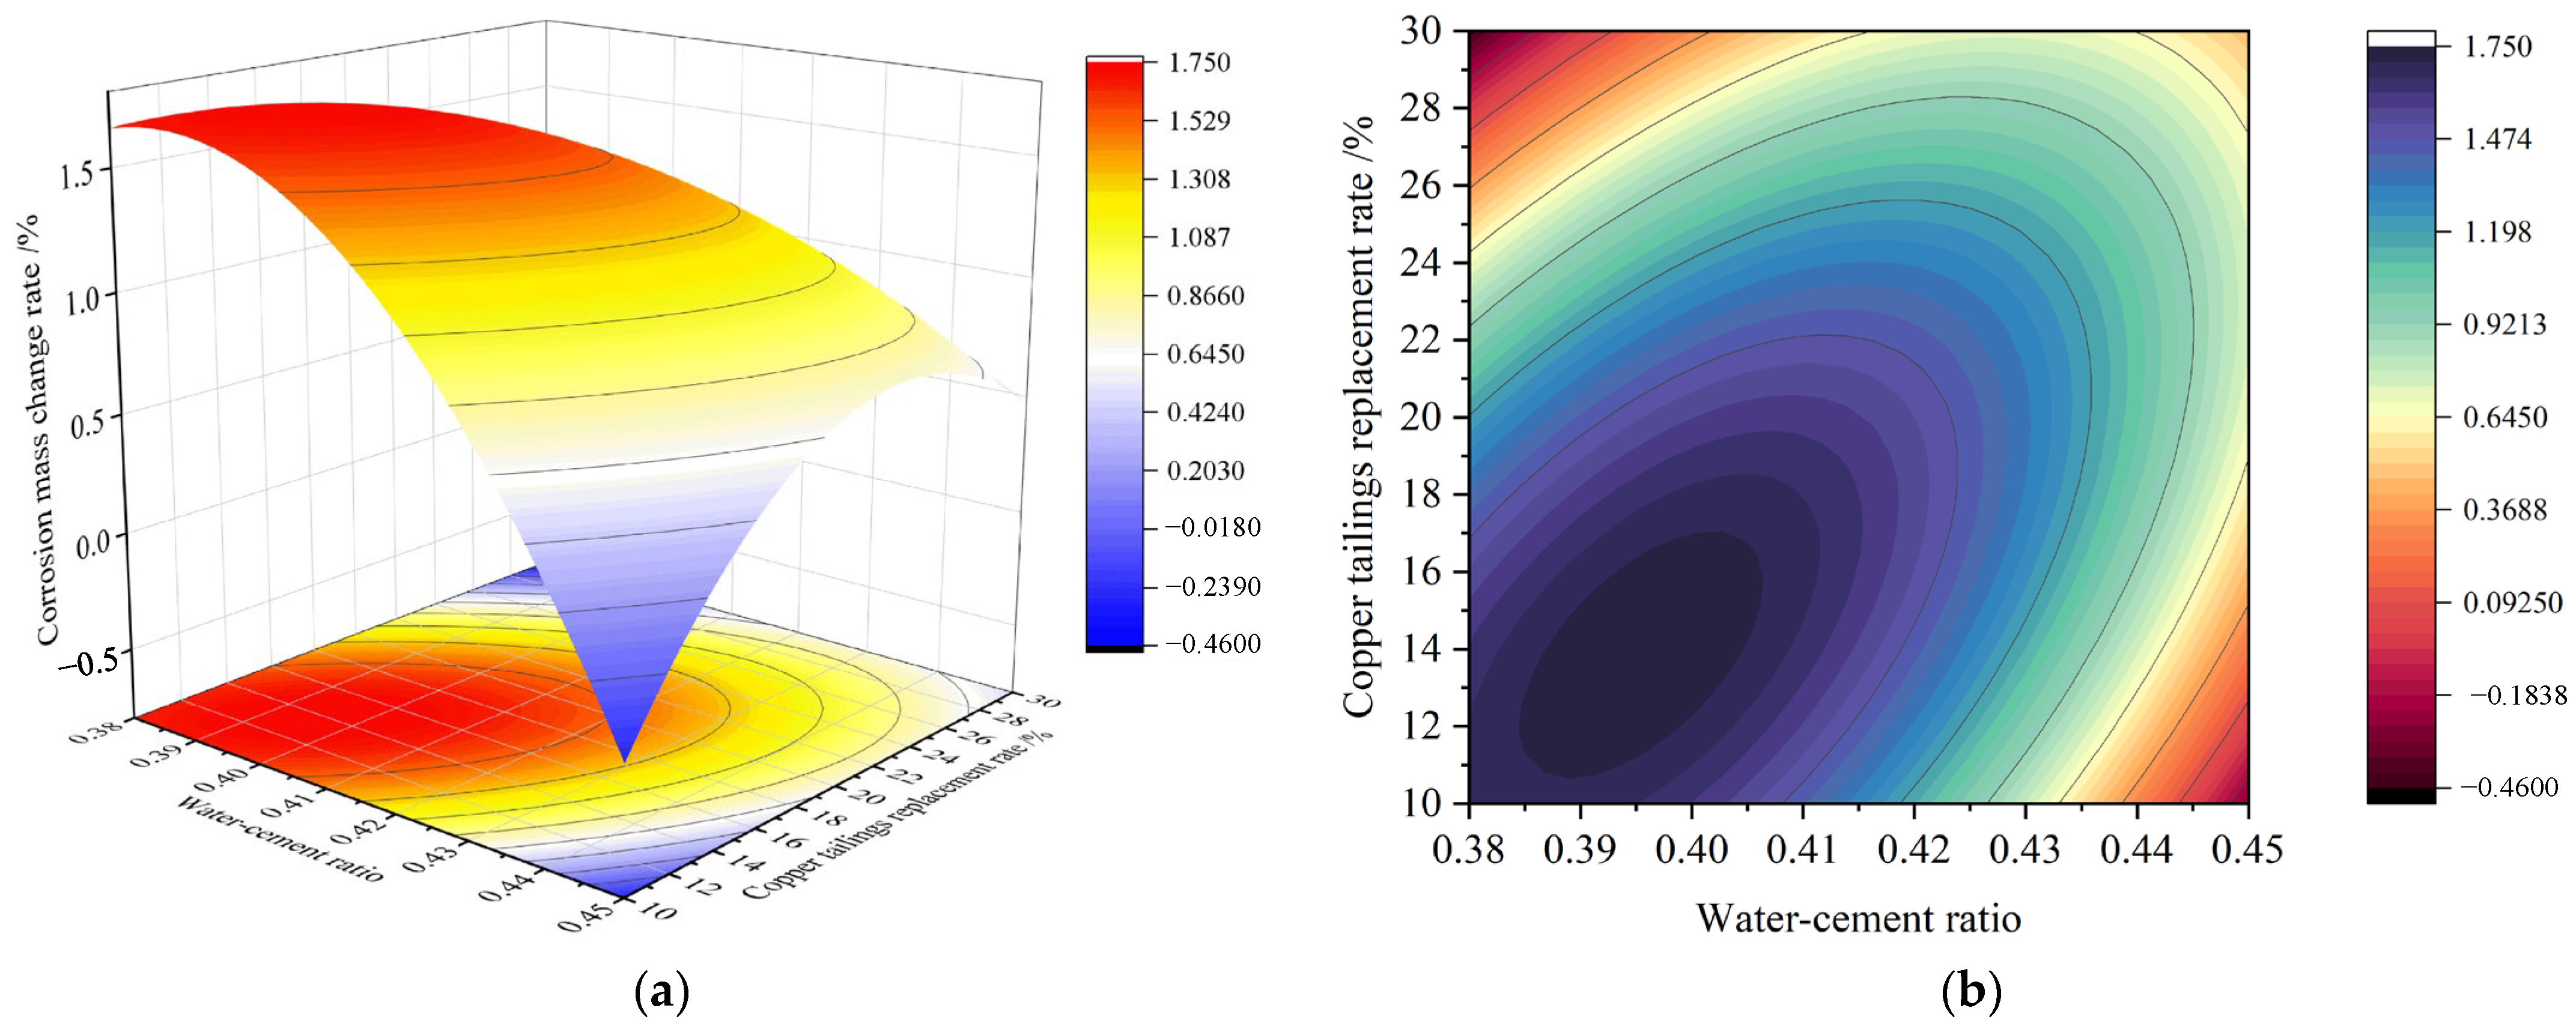
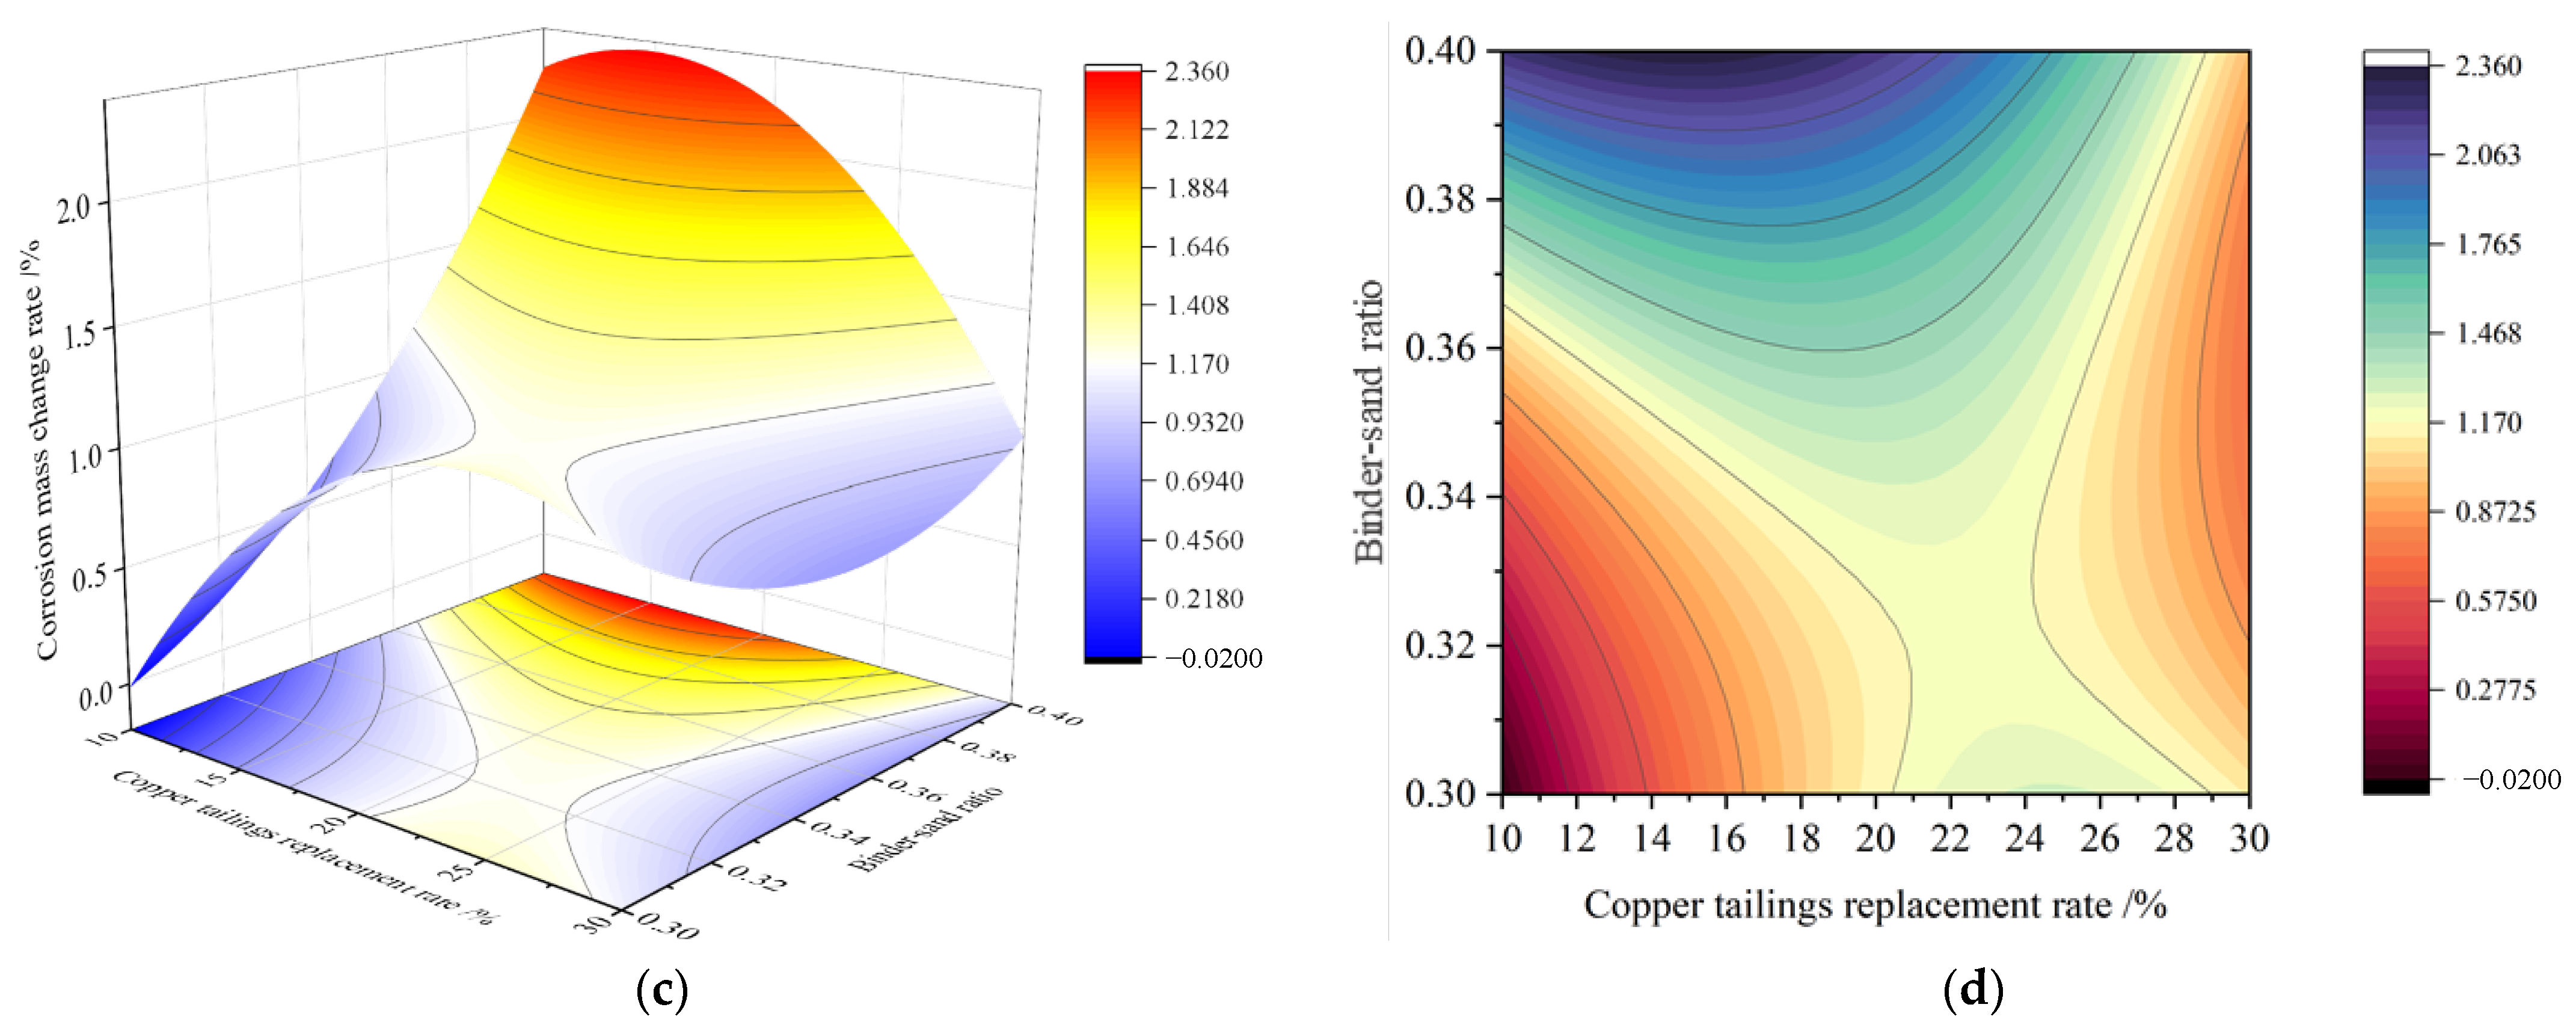
3.2.3. Interaction Analysis of Significant Factors
- 1.
- 3D response surface of compressive strength
- 2.
- 3D response surface of the flexural strength
- 3.
- 3D response surface of the corrosion resistance
3.3. Mix Ratio Optimization
4. Microscopic Mechanisms
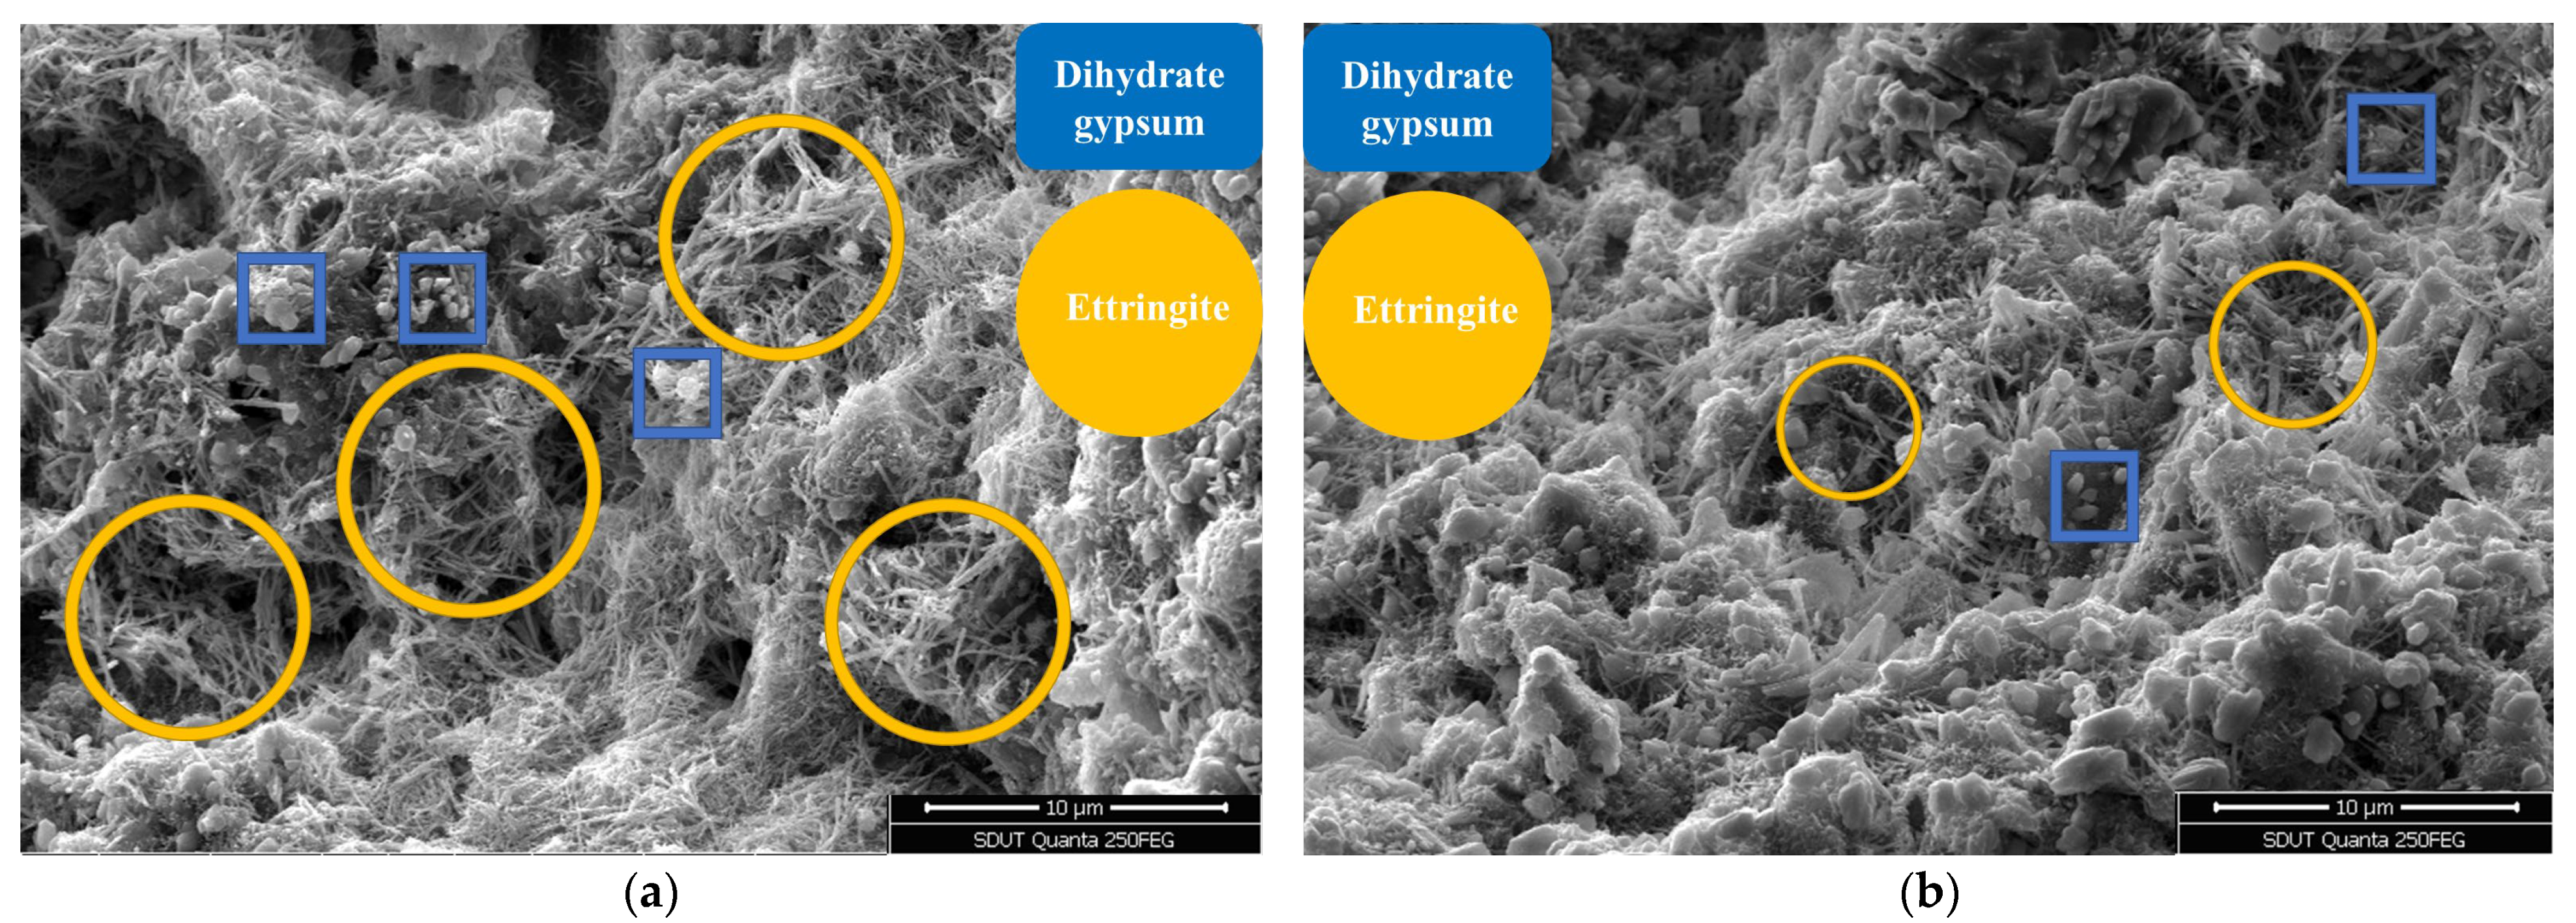
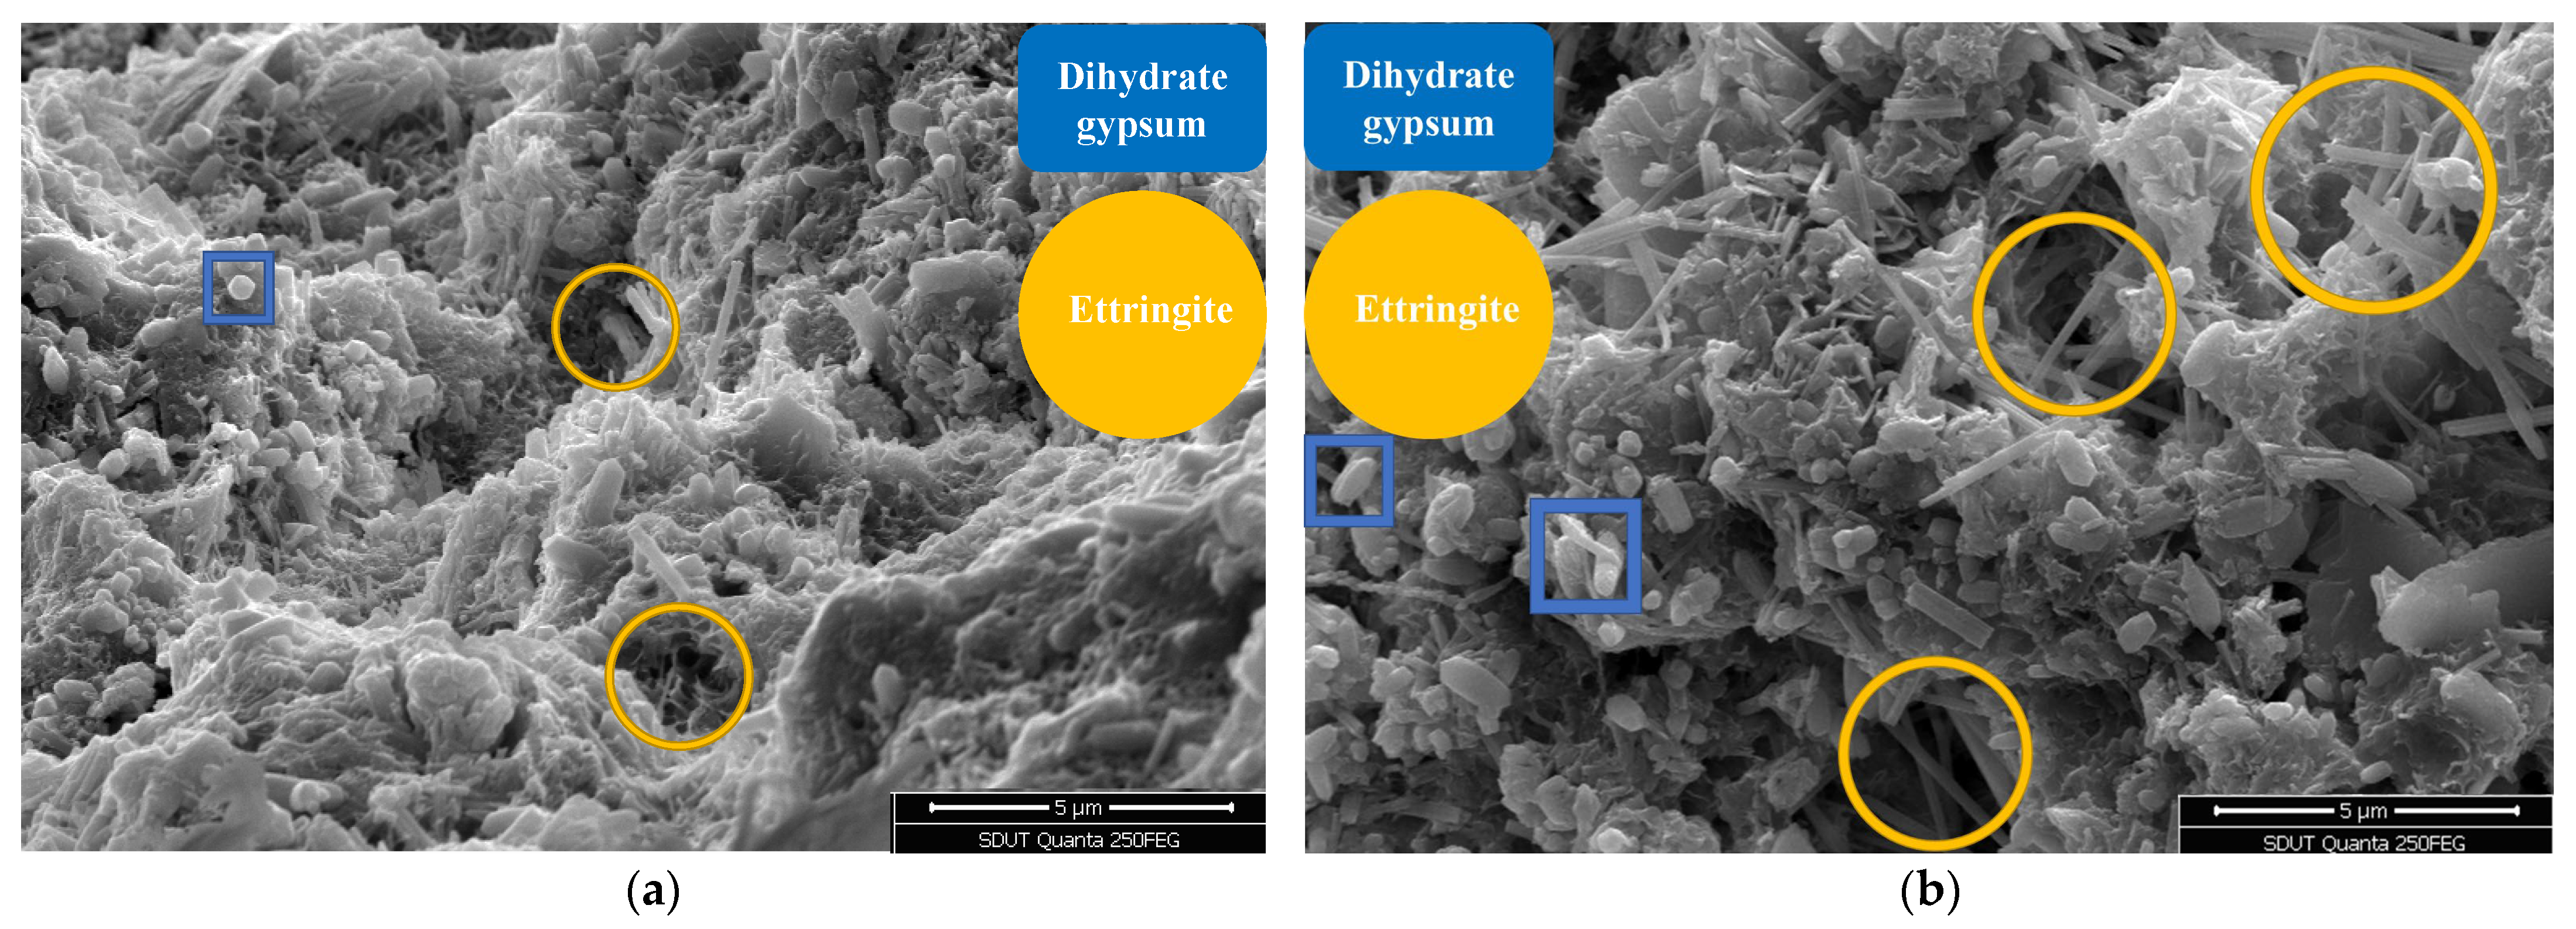
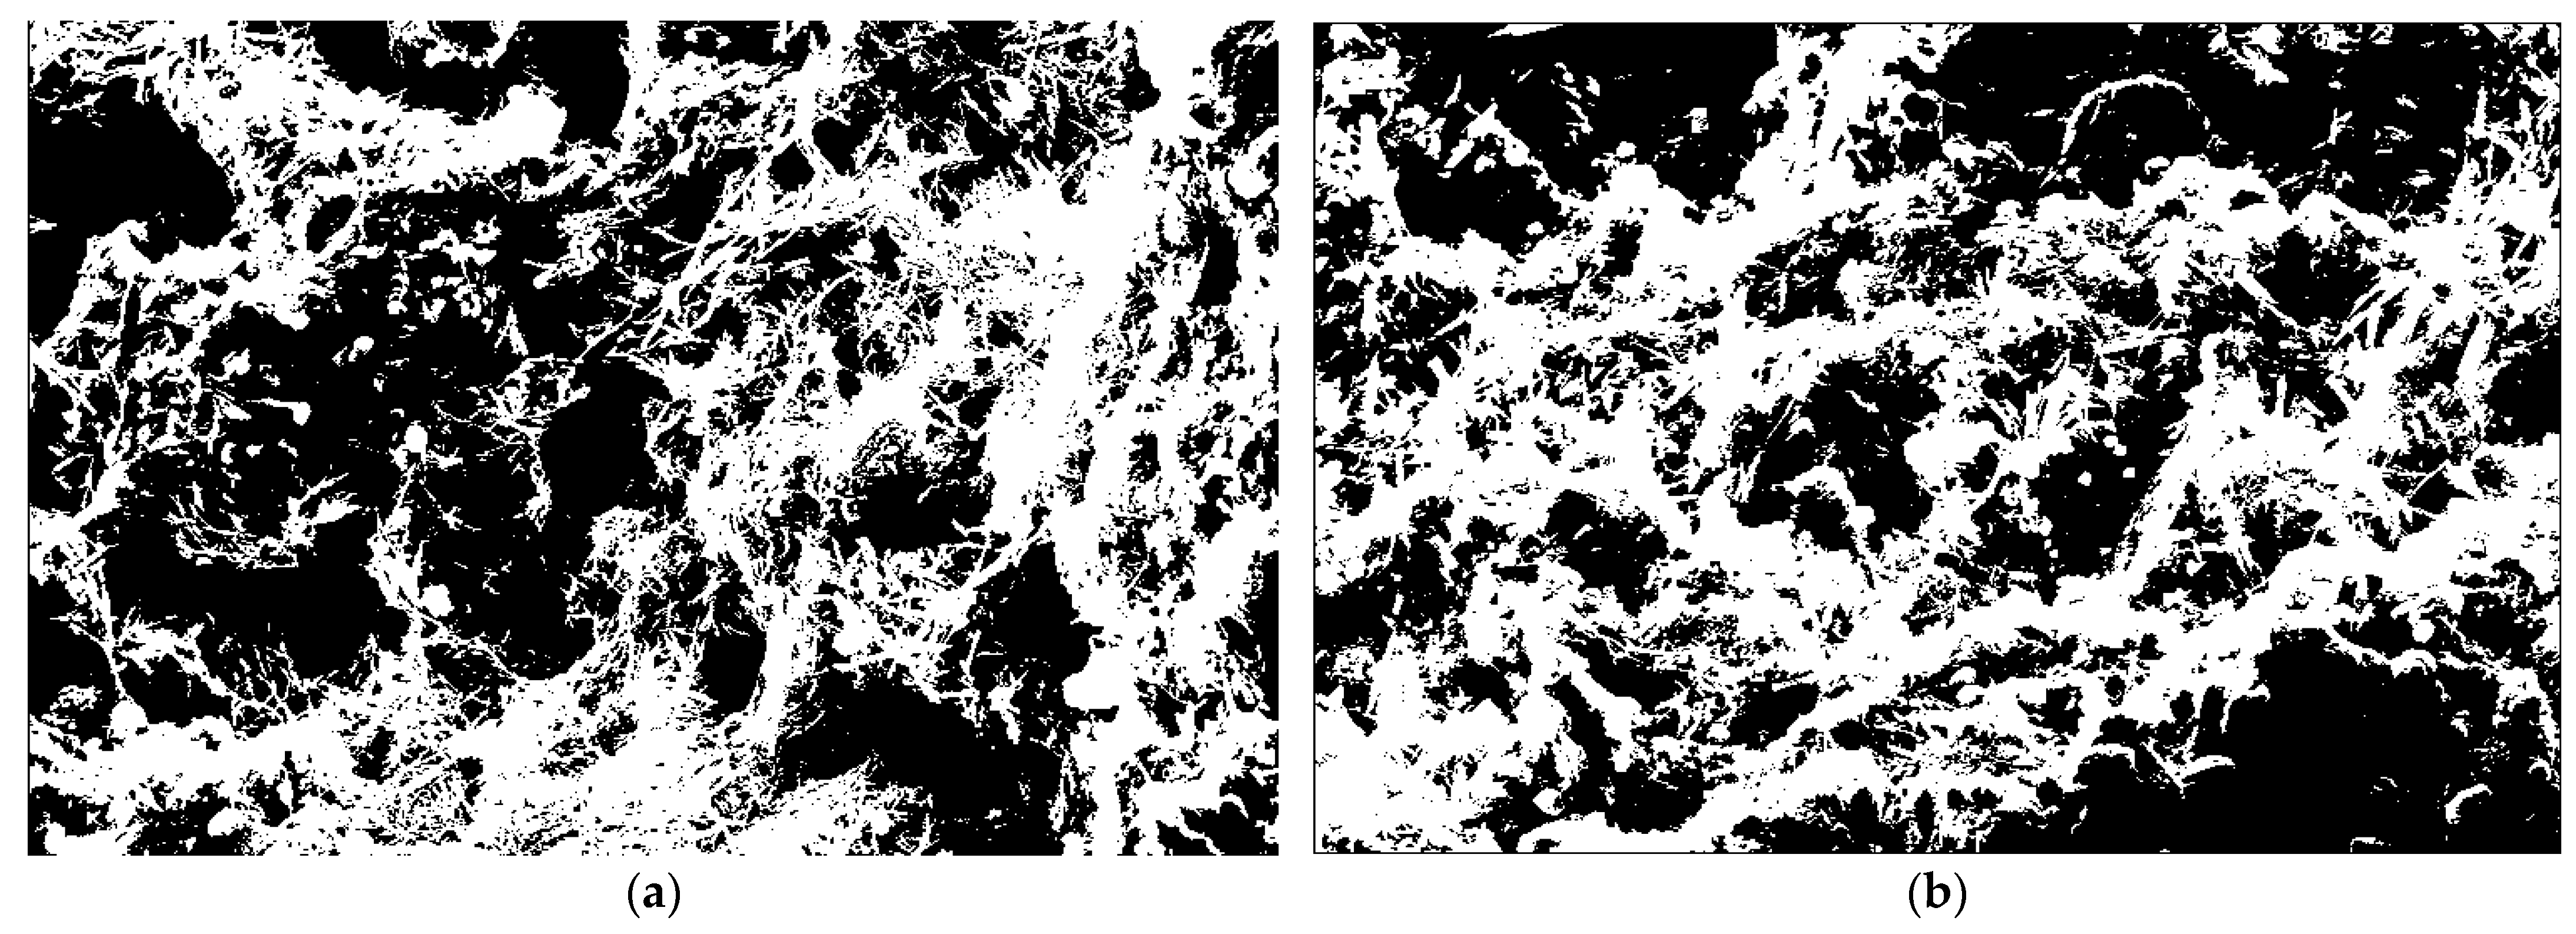
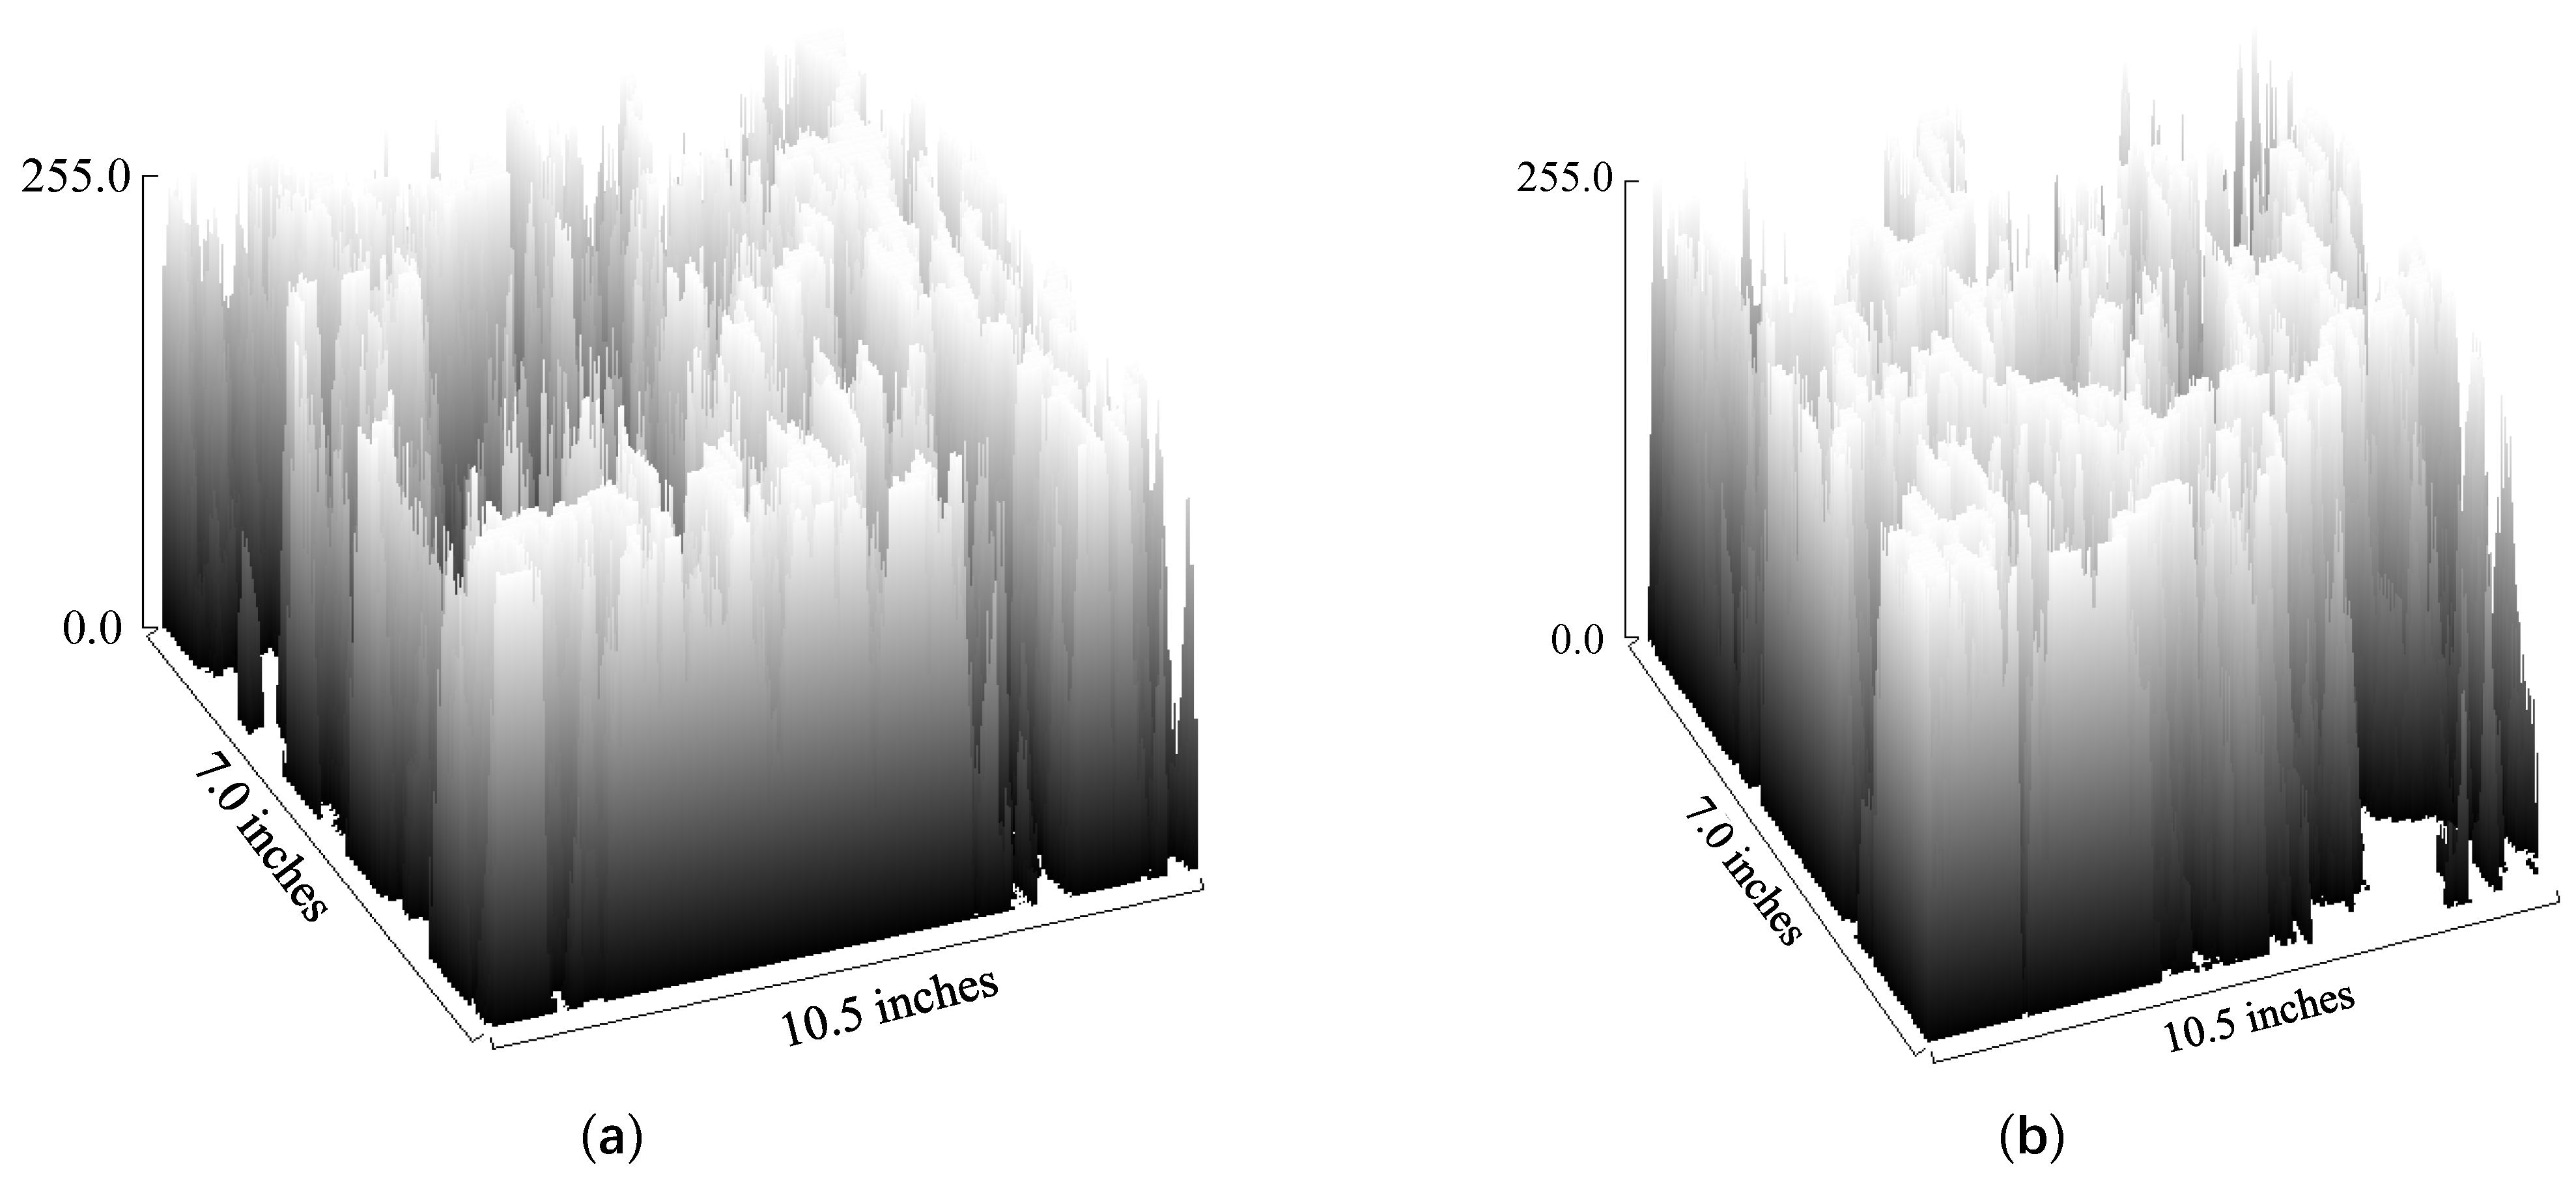
4.1. Microscopic Morphology Analysis
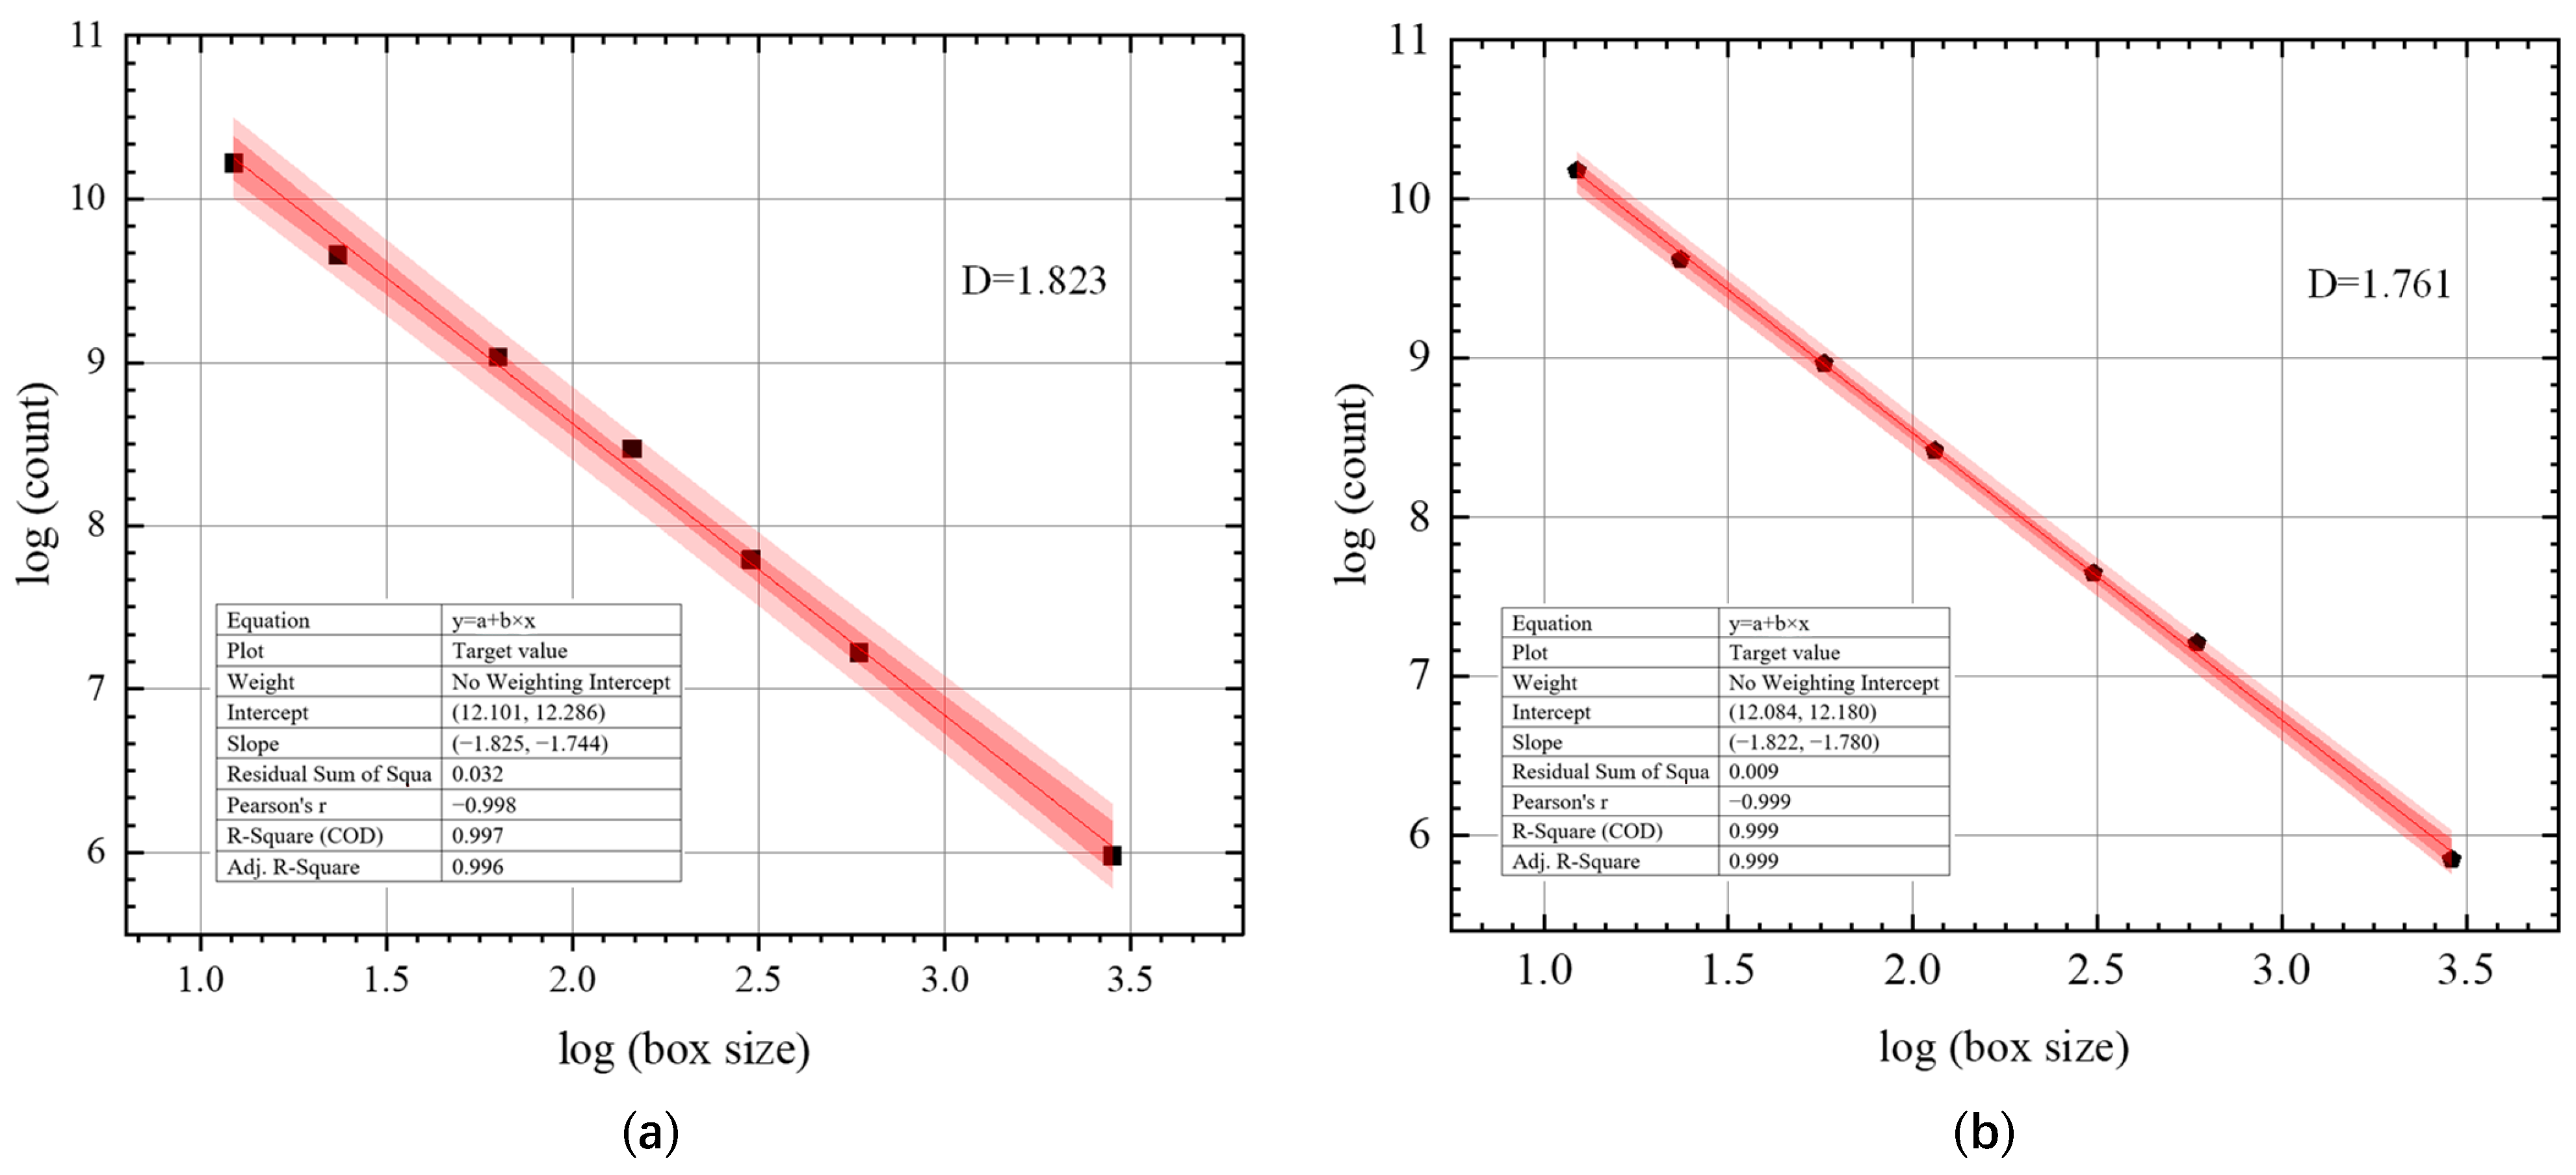
4.2. SEM Fractal Characteristics
5. Conclusions
Author Contributions
Funding
Institutional Review Board Statement
Informed Consent Statement
Data Availability Statement
Conflicts of Interest
References
- Vo, D.H.; Hwang, C.L.; Thi, K.D.T.; Yehualaw, M.D.; Liao, M.-C.; Lee, Y.-T. Utilization of high-volume mine tailing and by-products in composite binder production: Hardened properties and sustainable development. J. Mater. Cycles Waste Manag. 2022, 24, 1276–7280. [Google Scholar] [CrossRef]
- Xu, S.; Wang, Q.; Wang, N. Chemical Fabrication Strategies for Achieving Bioinspired Superhydrophobic Surfaces with Micro and Nanostructures: A Review. Adv. Eng. Mater. 2020, 23, 2001083. [Google Scholar] [CrossRef]
- Phiri, T.C.; Singh, P.; Nikoloski, A.N. The potential for copper slag waste as a resource for a circular economy: A review—Part II. Miner. Eng. 2021, 172, 107150. [Google Scholar] [CrossRef]
- Aljerf, L. Data of thematic analysis of farmer’s use behavior of Recycled Industrial Wastewater. Data Brief 2018, 21, 240–250. [Google Scholar] [CrossRef]
- Mavroulidou, M. Mechanical Properties and Durability of Concrete with Water Cooled Copper Slag Aggregate. Waste Biomass Valorization 2017, 8, 1841–1854. [Google Scholar] [CrossRef]
- Prem, P.R.; Verma, M.; Ambily, P.S. Sustainable cleaner production of concrete with high volume copper slag. J. Clean. Prod. 2018, 193, 43–58. [Google Scholar] [CrossRef]
- Oscar, A.; Marín, A.B.; Kraslawski, A.; Cisternas, L. Estimating processing cost for the recovery of valuable elements from mine tailings using dimensional analysis. Miner. Eng. 2022, 184, 107629. [Google Scholar]
- Cacciuttolo, C.; Atencio, E. Past, Present, and future of copper mine tailings governance in Chile (1905–2022): A review in one of the leading mining countries in the world. Int. J. Environ. Res. Public Health 2022, 19, 13060. [Google Scholar] [CrossRef]
- Li, B.; Huo, B.; Cao, R.; Wang, S.; Zhang, Y. Sulfate resistance of steam cured ferronickel slag blended cement mortar. Cem. Concr. Compos. 2018, 96, 204–211. [Google Scholar] [CrossRef]
- Cheng, Y.H.; Tong, B.Q.; Sun, X.H.; Zhang, J.Y. On the grinding effects of high-silicon iron tailings. Environ. Sci. Pollut. Res. Int. 2022, 29, 73326–73340. [Google Scholar] [CrossRef]
- Chen, Y.; Ji, T.; Yang, Z.; Zhan, W.; Zhang, Y. Sustainable use of ferronickel slag in cementitious composites and the effect on chloride penetration resistance. Constr. Build. Mater. 2020, 240, 117969. [Google Scholar] [CrossRef]
- Lori, I.; Toufigh, M.M.; Toufigh, V.; Zhang, Y. Improvement of poorly graded sandy soil by using copper mine tailing dam sediments-based geopolymer and silica fume—ScienceDirect. Constr. Build. Mater. 2021, 281, 12259. [Google Scholar]
- Shi, C.; Wang, X.; Zhou, S.; Zhang, X.; Wang, C. Mechanism, application, influencing factors and environmental benefit assessment of steel slag in removing pollutants from water: A review. J. Water Process Eng. 2022, 47, 102666. [Google Scholar] [CrossRef]
- Song, Q.; Guo, M.Z.; Wang, L.; Ling, T.C. Use of steel slag as sustainable construction materials: A review of accelerated carbonation treatment. Resour. Conserv. Recycl. 2021, 173, 105740. [Google Scholar] [CrossRef]
- Georgiades, M.; Shah, I.; Steubing, B.; Cheeseman, C.; Myers, R. Prospective life cycle assessment of European cement production. Resour. Conserv. Recycl. 2023, 194, 106998. [Google Scholar] [CrossRef]
- Al-Jabri, K.S.; Hisada, M.; Al-Oraimi, S.K.; Al-Saidy, A.H. Copper slag as sand replacement for high performance concrete. Resour. Cem. Concr. Compos. 2023, 31, 483–488. [Google Scholar] [CrossRef]
- Shirdam, R.; Amini, M.; Bakhshi, N. Investigating the Effects of Copper Slag and Silica Fume on Durability, Strength, and Workability of Concrete. Int. J. Environ. Res. 2019, 13, 909–924. [Google Scholar] [CrossRef]
- Chithra, S.; Kumar, S.R.R.S.; Chinnaraju, K. The effect of Colloidal Nano-silica on workability, mechanical and durability properties of High Performance Concrete with Copper slag as partial fine aggregate. Constr. Build. Mater. 2016, 113, 794–804. [Google Scholar] [CrossRef]
- Farshad, A.; Jorge, d.B.; Morteza, M.; Ramezan, A.T. Steel fibre-reinforced high-strength concrete incorporating copper slag: Mechanical, gamma-ray shielding, impact resistance, and microstructural characteristics. J. Build. Eng. 2020, 29, 101118. [Google Scholar]
- Sharma, R.; Khan, R.A. Influence of Copper Slag and Metakaolin on the Durability of Self Compacting Concrete. J. Clean. Prod. 2017, 171, 1171–1186. [Google Scholar] [CrossRef]
- Feng, Y.; Chen, Q.; Zhou, Y.; Guo, H. Modification of glass structure via CaO addition in granulated copper slag to enhance its pozzolanic activity. Constr. Build. Mater. 2020, 240, 117970. [Google Scholar] [CrossRef]
- Ismael, J.R.; Mark, T.H.; Wil, V.S. Influence of copper-impregnated basic oxygen furnace slag on the fresh-and hardened-state properties of antimicrobial mortars. Cem. Concr. Compos. 2021, 121, 104059. [Google Scholar]
- Pattanaik, M.L.; Choudhary, R.; Kumar, B.; Kumar, A. Mechanical properties of open graded friction course mixtures with different contents of electric arc furnace steel slag as an alternative aggregate from steel industries. Road Mater. Pavement Des. 2021, 22, 268–292. [Google Scholar] [CrossRef]
- Zhang, Y.; Shen, W.; Wu, M.; Shen, B.; Li, M.; Xu, G.; Zhang, B.; Ding, Q.; Chen, X. Experimental study on the utilization of copper tailing as micronized sand to prepare high performance concrete. Constr. Build. Mater. 2020, 244, 118312. [Google Scholar] [CrossRef]
- Nevy, S.; Keiyu, K.; Isao, U. Influence of copper slag on corrosion behavior of horizontal steel bars in reinforced concrete column specimen due to chloride-induced corrosion. Constr. Build. Mater. 2020, 255, 119265. [Google Scholar]
- Nuruzzaman, M.; Kuri, J.C.; Sarker, P.K. Strength, permeability and microstructure of self-compacting concrete with the dual use of ferronickel slag as fine aggregate and supplementary binder. Constr. Build. Mater. 2021, 318, 125927. [Google Scholar] [CrossRef]
- Ince, C.; Derogar, S.; Gurkaya, K.; Ball, R.J. Properties, durability and cost efficiency of cement and hydrated lime mortars reusing copper mine tailings of Lefke-Xeros in Cyprus. Constr. Build. Mater. 2020, 268, 121070. [Google Scholar] [CrossRef]
- Esfahani, S.M.R.A.; Zareei, S.A.; Madhkhan, M.; Ameri, F.; Taheri, R.A. Mechanical and gamma-ray shielding properties and environmental benefits of concrete incorporating GGBFS and copper slag. J. Build. Eng. 2021, 33, 101615. [Google Scholar] [CrossRef]
- Nikvar-Hassani, A.; Hodges, R.; Zhang, L. Production of green bricks from low-reactive copper mine tailings: Durability and environmental aspects. Constr. Build. Mater. 2022, 337, 127571. [Google Scholar] [CrossRef]
- GB/T 17671-2021; Test Method of Cement Mortar Strength (ISO Method). State Administration for Market Regulation: Beijing, China, 2021.
- GB/T 1346-2024; Test Methods for Water Requirement of Standard Consistency, Setting Time and Soundness of the Portland Cement. State Administration for Market Regulation: Beijing, China, 2024.
- GB175-2007; Common Portland Cement. General Administration of Quality Supervision, Inspection and Quarantine of the People’s Republic of China: Beijing, China, 2007.
- JGJ 52-2006; Standard for Technical Requirements and Test Method of Sand and Crushed Stone (or Gravel) for Ordinary Concrete. Ministry of Construction of the People’s Republic of China: Beijing, China, 2006.
- GB/T25176-2010; Recycled Fine Aggregate for Concrete and Mortar, General Administration of Quality Supervision. Inspection and Quarantine of the People’s Republic of China: Beijing, China, 2010.
- JGJ 63-2006; Standard of Water for Concrete. Ministry of Construction of the People’s Republic of China: Beijing, China, 2006.
- Xie, R.S.; Ge, R.; Li, Z.S.C.; Qu, G.F.; Zhang, Y.J.; Xu, Y.X.; Zeng, Y.D.; Li, Z.Y. Synthesis and influencing factors of high-performance concrete based on copper tailings for efficient solidification of heavy metals. J. Environ. Manag. 2023, 325, 116469. [Google Scholar] [CrossRef]
- Shao, W.; Zha, W.; Zhou, X.; Xu, T. Experimental Study Based on Box–Behnken Design and Response Surface Methodology for Optimization Proportioning of Activated Lithium Slag Composite Cement-Based Cementitious Materials. Materials 2024, 17, 2651. [Google Scholar] [CrossRef] [PubMed]
- Marzouki, M.; Samet, B.; Tounsi, H. Application of Plackett–Burman and Box-Behnken designs for the optimization of Tunisian dam sediment-based geopolymers. J. Build. Eng. 2022, 50, 104162. [Google Scholar] [CrossRef]
- Guo, J.; Yan, Y.; Wang, J.; Xu, Y. Strength Analysis of Cement Mortar with Carbon Nanotube Dispersion Based on Fractal Dimension of Pore Structure. Fractal Fract. 2022, 609, 609. [Google Scholar] [CrossRef]
- GB/T 2419-2005; Test Method for Fluidity of Cement Mortar. General Administration of Quality Supervision, Inspection and Quarantine of the People’s Republic of China: Beijing, China, 2005.
- GB/T50082-2024; Standard for Test Methods of Long-Term Performance and Durability of Concrete. Ministry of Housing and Urban-Rural Development, People’s Republic of China: Beijing, China, 2024.
- Guo, L.; Samet, B.; Guo, Y.H.; Zhong, L. Research on the back analysis and failure mechanism of recycled concrete aggregate meso-parameters based on Box-Behnken Design response surface model. J. Build. Eng. 2022, 51, 104317. [Google Scholar] [CrossRef]
- Johansson, L.; Bahrami, A.; Wallhagen, M.; Cehlin, M. A comprehensive review on properties of tailings-based low-carbon concrete: Mechanical, environmental, and toxicological performances. Dev. Built Environ. 2024, 18, 100428. [Google Scholar] [CrossRef]
- Yang, X.; Wang, M.Z. Fractal dimension analysis of aggregate packing process: A numerical case study on concrete simulation. Constr. Build. Mater. 2021, 270, 121376. [Google Scholar] [CrossRef]
- Wang, Q.Z.; Zhao, Y.F.; Tsengcde, M.L.; Lim, L.K. Performance analysis and reuse of construction and demolition waste stone using fractal and gradation theory. J. Clean. Prod. 2020, 20, 122208. [Google Scholar] [CrossRef]
- Kurniati, E.O.; Pederson, F.; Kim, H.J. Application of steel slags, ferronickel slags, and copper mining waste as construction materials: A review. Resour. Conserv. Recycl. 2023, 198, 107175. [Google Scholar] [CrossRef]


| Strength Class | 3 d Compressive Strength /MPa | 3 d Bending Strength /MPa | 28 d Compressive Strength /MPa | 28 d Bending Strength /MPa | Apparent Density /(g/cm3) | Initial Setting Time /min | Final Setting Time /min |
|---|---|---|---|---|---|---|---|
| 42.5 | 25.2 | 5.7 | 44.3 | 8.1 | 3.73 | 88 | 184 |
| Ingredient | CaO | SiO2 | CO2 | Al2O3 | Fe2O3 | MgO | K2O | Loss |
| Content/% | 50.77 | 23.94 | 12.81 | 8.15 | 2.63 | 0.98 | 0.47 | 0.25 |
| The Screen Hole Side Length/mm | 4.75 | 2.36 | 1.18 | 0.6 | 0.3 | 0.15 | |
| Cumulative screening residue/% | Distribution zone I | 0–10 | 5–35 | 35–65 | 71–85 | 80–95 | 85–100 |
| Distribution zone II | 0–10 | 0–25 | 10–50 | 41–70 | 70–92 | 80–100 | |
| Distribution zone III | 0–10 | 0–15 | 0–25 | 16–40 | 55–85 | 75–100 | |
| Copper-tailings sand gradation area | 0 | 12.4 | 32.5 | 60.8 | 80.5 | 94.4 | |
| Aggregate Property | Apparent Density /(kg/m3) | Loose Density /(kg/m3) | Crushing Index /% | 24 h Water Absorption /% |
|---|---|---|---|---|
| Standard sand | 2520 | 1480 | 14.28 | 1.26 |
| Copper tailings sand | 2360 | 1052 | 17.66 | 2.42 |
| Ingredient | SiO2 | CaO | FeO | Fe3O4 | Al2O3 | CuO | MgO | S | LOSS |
| Content/% | 41.2 | 4.7 | 34.2 | 5.57 | 6.34 | 2.6 | 4.12 | 0.87 | 0.4 |
| Index | Water Reduction Rate/% | Gas Content/% | pH | Density/(g/cm3) |
|---|---|---|---|---|
| Numerical value | 30 | 2.6 | 7.8 | 1.174 |
| Level | Influencing Factor | ||
|---|---|---|---|
| A | B/% | C | |
| −1 | 0.38 | 10 | 0.30 |
| 0 | 0.43 | 20 | 0.35 |
| 1 | 0.45 | 30 | 0.40 |
| Group | A | B/% | C | Cement /(kg/m3) | Standard Sand /(kg/m3) | Copper Tailings Sand /(kg/m3) | Water /(kg/m3) | Water Reducing Agent /(kg/m3) |
|---|---|---|---|---|---|---|---|---|
| 1 | 0.43 | 20 | 0.35 | 467 | 1111 | 222 | 201 | 2.3 |
| 2 | 0.45 | 20 | 0.3 | 415 | 1154 | 231 | 187 | 2.1 |
| 3 | 0.43 | 20 | 0.35 | 467 | 1111 | 222 | 201 | 2.3 |
| 4 | 0.43 | 20 | 0.35 | 467 | 1111 | 222 | 201 | 2.3 |
| 5 | 0.45 | 10 | 0.35 | 467 | 1212 | 121 | 210 | 2.3 |
| 6 | 0.43 | 30 | 0.4 | 514 | 989 | 297 | 221 | 2.6 |
| 7 | 0.45 | 30 | 0.35 | 467 | 1025 | 308 | 210 | 2.3 |
| 8 | 0.38 | 30 | 0.35 | 467 | 1025 | 308 | 177 | 2.3 |
| 9 | 0.38 | 20 | 0.3 | 415 | 1154 | 231 | 158 | 2.1 |
| 10 | 0.38 | 20 | 0.4 | 514 | 1072 | 214 | 195 | 2.6 |
| 11 | 0.38 | 10 | 0.35 | 467 | 1212 | 121 | 177 | 2.3 |
| 12 | 0.43 | 20 | 0.35 | 467 | 1111 | 222 | 201 | 2.3 |
| 13 | 0.43 | 10 | 0.4 | 514 | 1169 | 117 | 221 | 2.6 |
| 14 | 0.43 | 10 | 0.3 | 415 | 1259 | 126 | 178 | 2.1 |
| 15 | 0.43 | 30 | 0.3 | 415 | 1065 | 320 | 178 | 2.1 |
| 16 | 0.43 | 20 | 0.35 | 467 | 1111 | 222 | 201 | 2.3 |
| 17 | 0.45 | 20 | 0.4 | 514 | 1072 | 214 | 231 | 2.6 |
| Group | 28 d Compressive Strength/MPa | 28 d Bending Strength/MPa | Corrosion Mass Change Rate/% |
|---|---|---|---|
| 1 | 52.94 | 4.55 | 1.59 |
| 2 | 48.39 | 4.31 | −0.56 |
| 3 | 49.1 | 3.33 | −0.54 |
| 4 | 54.16 | 4.70 | 0.17 |
| 5 | 45.43 | 3.75 | 0.82 |
| 6 | 43.33 | 4.67 | 0.17 |
| 7 | 55.91 | 3.70 | 1.73 |
| 8 | 61.31 | 4.51 | 1.78 |
| 9 | 44.34 | 4.18 | 0.86 |
| 10 | 39.46 | 4.32 | 0.83 |
| 11 | 52.85 | 4.68 | 2.59 |
| 12 | 54.1 | 3.82 | 0.17 |
| 13 | 44.89 | 5.83 | 1.52 |
| 14 | 45.19 | 5.96 | 0.92 |
| 15 | 45.16 | 5.91 | 1.47 |
| 16 | 42.54 | 5.77 | 1.58 |
| 17 | 41.48 | 5.66 | 1.62 |
| Curing Period | Prediction Model of Mass Loss Rate |
|---|---|
| Compressive strength | C28 = 1117.479 − 4260.103A − 4.64B − 962.537C + 6.864AB + 1071.428AC + 3.065BC +4531.836A2 + 0.017B2 + 836.6C2 |
| Flexural strength | F28 = −156.527 + 567.277A − 0.019B + 245.736C + 1.15AB − 15.714AC − 0.5BC − 692.244A2 − 0.007B2 − 328.2C2 |
| mass loss rate | Z28 = −48.702 + 338.463A − 0.223B − 99.695C + 2.042AB + 100AC − 1.195BC − 507.959A2 − 0.006B2 + 130.1C2 |
| Source | Sum of Squares | df | Mean Square | F-Value | p-Value | Significance |
|---|---|---|---|---|---|---|
| Model | 555.342 | 9 | 61.704 | 21.290 | 0.0002 | Significant |
| A | 1.814 | 1 | 1.814 | 0.626 | 0.454 | |
| B | 0.361 | 1 | 0.361 | 0.124 | 0.734 | |
| C | 332.949 | 1 | 332.949 | 114.877 | 0.0001 | Significant |
| AB | 23.088 | 1 | 23.088 | 7.966 | 0.025 | Significant |
| AC | 14.062 | 1 | 14.062 | 4.852 | 0.063 | |
| BC | 9.394 | 1 | 9.394 | 3.241 | 0.114 | |
| A2 | 129.764 | 1 | 129.764 | 44.772 | 0.0002 | Significant |
| B2 | 12.806 | 1 | 12.806 | 4.418 | 0.073 | |
| C2 | 18.418 | 1 | 18.418 | 6.354 | 0.039 | Significant |
| Lack of Fit | 8.361 | 3 | 2.787 | 0.934 | 0.502 | not significant |
| Source | Sum of Squares | df | Mean Square | F-Value | p-Value | Significance |
|---|---|---|---|---|---|---|
| Model | 11.464 | 9 | 1.273 | 82.757 | 0.00002 | Significant |
| A | 1.022 | 1 | 1.022 | 66.426 | 0.0008 | Significant |
| B | 0.300 | 1 | 0.300 | 19.510 | 0.003 | Significant |
| C | 0.005 | 1 | 0.005 | 0.358 | 0.568 | |
| AB | 0.648 | 1 | 0.648 | 42.101 | 0.0003 | Significant |
| AC | 0.003 | 1 | 0.003 | 0.196 | 0.670 | |
| BC | 0.25 | 1 | 0.25 | 16.242 | 0.004 | Significant |
| A2 | 3.027 | 1 | 3.027 | 196.711 | 0.00002 | Significant |
| B2 | 2.403 | 1 | 2.403 | 156.137 | 0.00004 | Significant |
| C2 | 2.834 | 1 | 2.834 | 184.159 | 0.00002 | Significant |
| Lack of Fit | 0.052 | 3 | 0.017 | 1.244 | 0.404 | not significant |
| Source | Sum of Squares | df | Mean Square | F-Value | p-Value | Significance |
|---|---|---|---|---|---|---|
| Model | 11.367 | 9 | 1.263 | 10.822 | 0.002 | Significant |
| A | 0.520 | 1 | 0.520 | 4.457 | 0.072 | |
| B | 1.852 | 1 | 1.852 | 15.876 | 0.005 | Significant |
| C | 1.611 | 1 | 1.611 | 13.804 | 0.007 | Significant |
| AB | 2.044 | 1 | 2.044 | 17.522 | 0.004 | Significant |
| AC | 0.122 | 1 | 0.122 | 1.049 | 0.339 | |
| BC | 1.428 | 1 | 1.428 | 12.236 | 0.010 | Significant |
| A2 | 1.630 | 1 | 1.630 | 13.969 | 0.007 | Significant |
| B2 | 1.696 | 1 | 1.696 | 14.536 | 0.006 | Significant |
| C2 | 0.445 | 1 | 0.445 | 3.816 | 0.091 | |
| Lack of Fit | 0.488 | 3 | 0.162 | 1.986 | 0.258 | not significant |
| Model | R2 | Adjusted R2 | Predicted R2 | Adeq Precision |
|---|---|---|---|---|
| C28 | 0.964 | 0.919 | 0.735 | 15.934 |
| F28 | 0.990 | 0.978 | 0.920 | 26.874 |
| Z28 | 0.932 | 0.846 | 0.816 | 13.038 |
| Name | Goal | Lower Limit | Upper Limit |
|---|---|---|---|
| A | is in range | 0.38 | 0.48 |
| B | is in range | 10 | 30 |
| C | is in range | 0.3 | 0.4 |
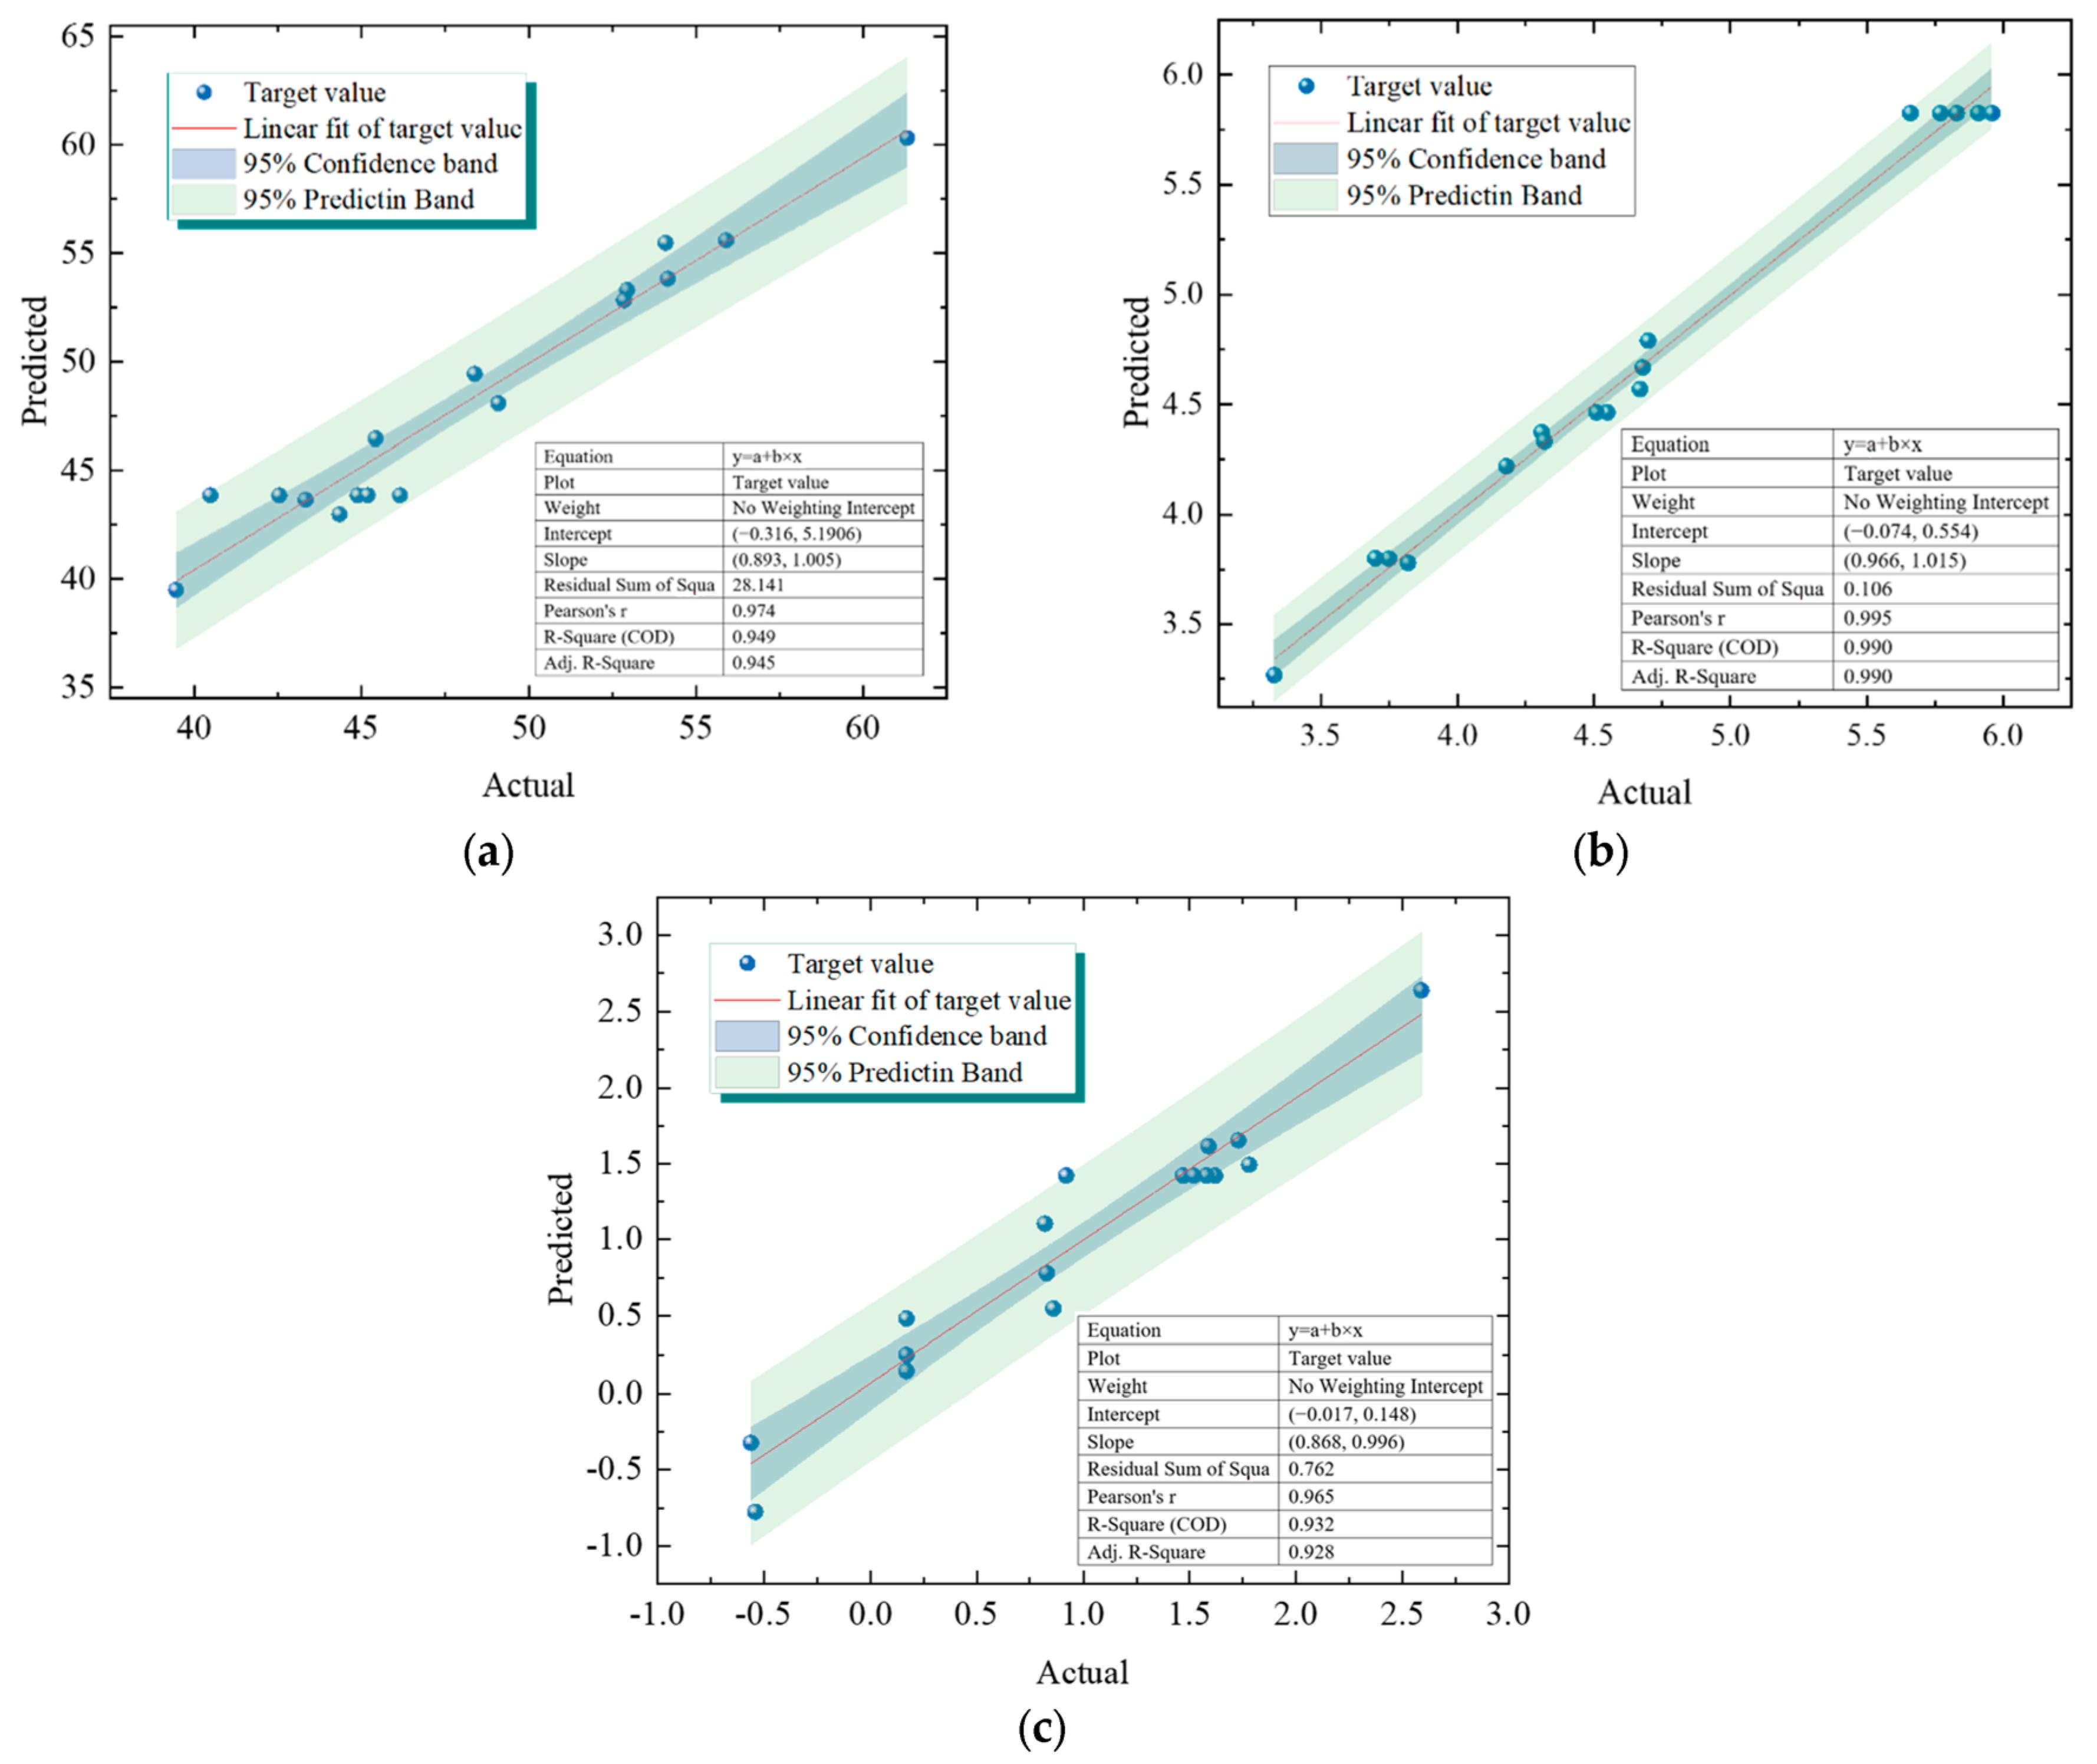
| Compressive strength/MPa | maximize | 39.46 | 61.31 |
| Flexural strength/MPa | maximize | 3.33 | 5.96 |
| Corrosion mass change rate/% | minimize | −0.56 | 2.59 |
| Group | A | B | C | Compressive Strength/MPa | Flexural Strength/MPa | Corrosion Mass Change Rate/% | Result |
|---|---|---|---|---|---|---|---|
| 1 | 0.45 | 28.669 | 0.365 | 56.171 | 4.794 | 0.331 | Selected |
| 2 | 0.45 | 28.731 | 0.365 | 56.193 | 4.787 | 0.324 | |
| 3 | 0.45 | 28.694 | 0.365 | 56.286 | 4.784 | 0.332 |
| Index | Compressive Strength/MPa | Flexural Strength/MPa | Corrosion Mass Change Rate/% |
|---|---|---|---|
| Predicted value | 62.14 | 6.76 | −0.721 |
| Actual value | −0.26 | 0.38 | −0.016 |
| Error (%) | 0.42 | 5.62 | 2.22 |
Disclaimer/Publisher’s Note: The statements, opinions and data contained in all publications are solely those of the individual author(s) and contributor(s) and not of MDPI and/or the editor(s). MDPI and/or the editor(s) disclaim responsibility for any injury to people or property resulting from any ideas, methods, instructions or products referred to in the content. |
© 2025 by the authors. Licensee MDPI, Basel, Switzerland. This article is an open access article distributed under the terms and conditions of the Creative Commons Attribution (CC BY) license (https://creativecommons.org/licenses/by/4.0/).
Share and Cite
Li, H.; Zhang, L.; Liu, J.; Chu, D.; Ren, J. Optimization of the Proportioning and Microscopic Mechanism Study of Cement Mortar Prepared with Copper Tailings as Fine Aggregate. Materials 2025, 18, 2569. https://doi.org/10.3390/ma18112569
Li H, Zhang L, Liu J, Chu D, Ren J. Optimization of the Proportioning and Microscopic Mechanism Study of Cement Mortar Prepared with Copper Tailings as Fine Aggregate. Materials. 2025; 18(11):2569. https://doi.org/10.3390/ma18112569
Chicago/Turabian StyleLi, Haizhou, Lu Zhang, Jianping Liu, Daozhong Chu, and Jiaolong Ren. 2025. "Optimization of the Proportioning and Microscopic Mechanism Study of Cement Mortar Prepared with Copper Tailings as Fine Aggregate" Materials 18, no. 11: 2569. https://doi.org/10.3390/ma18112569
APA StyleLi, H., Zhang, L., Liu, J., Chu, D., & Ren, J. (2025). Optimization of the Proportioning and Microscopic Mechanism Study of Cement Mortar Prepared with Copper Tailings as Fine Aggregate. Materials, 18(11), 2569. https://doi.org/10.3390/ma18112569