3.1. TMCs Microstructure
In
Figure 3, the microstructures of the bulk deposited samples by DED of Ti and TMC with wt% 1, wt% 2, and wt% 3 TiC content are presented. The pure Ti-deposited structure, used as a control, was identified as α + β type, with interwoven acicular grains of hexagonal compact α phase grown in large polyhedral grains of β phase (cubic with centered volume). The α grain superposition formed a basket-shaped Widmansttaten structure (
Figure 3a), inserted in the β-phase large grains. Due to repeated irradiation of the same area by laser processing, the temperature rose above 890 °C, which represents the threshold α > β transformation, and therefore the dark grains of the β phase are identified between the light-colored α grains. In the case of TMC, the α-Ti phase grains were interwoven inside the β-Ti grains, which results in a microstructure with a higher proportion of β-phase. There are areas where acicular α-Ti grains nucleated over other grain colonies, contributing to the formation of the Widmanstatten structure.
The TiC particle concentrations in the range of wt.% 1–3 in the Ti metal matrix caused a minimal impact on the phase transformation of typical pure Ti microstructure. According to the Ti-C binary phase diagram, the carbon content of the eutectic point is about 2%. The composites with wt.% 1–3 TiC in bulk (
Figure 3) are in the range of hypoeutectic area because the TiC volume fraction is below 5% according to the Ti-C phase diagram. Due to the fast process of cooling down the melt pool from high temperature (~1400 °C, which is very close to the melting point of the pure Ti) to a value under 400 °C, the β-Ti phase will be solidified firstly from the liquid state of pure titanium because of the differences between the solid states of each phase (the melting point of the TiC is ~3140 °C). In the solidification process of the β-Ti phase, the carbon concentration decreases to the eutectic point, and the TiC + β-Ti eutectic reaction occurs. When the temperature drops to β-transus temperature (~890 °C), the β-Ti transforms to α-Ti. However, the rapid cooling rate characteristic in the DED process during solidification makes impossible the β-Ti complete transformation into α-Ti.
Figure 4 presents the TMCs that were manufactured by DED with a larger amount of TiC particles.
Figure 4a displays the TMC microstructure with a content of TiC up to wt.% 5, and it can be observed that the primary dendritic TiC occur. The increase in Carbon due to the step-up to wt.% 10 TiC provides the necessary mass for an increase in the TiC dendritic dimensions and the number of unmelted particles that can lead to crack formation (
Figure 4b). This phenomenon is further enhanced in the bulk sample with wt.% 15 (
Figure 4c), where the primary dendritic phase becomes significantly coarser and it can be observed the apparition of secondary and tertiary dendrites.
In case of changing the morphology of the matrix, there are two possible reasons: i. the pure titanium powder may contain few impurity elements and can influence the growth rate of the grains after the nucleation stage during the cooling process, and ii. the addition of TiC particles affects the cooling rate of the melt pool due to the high laser energy absorption rate. Therefore, the difference in the microstructure of the deposited material obtained in the experiments presented in this study indicates that the cooling rate of the molten pool of samples with lower concentrations of TiC may be faster than that of the TMC molten pool with higher concentrations of TiC particles.
Because the processing parameters (laser power, scanning speed, focusing distance, gas mixture flow) were kept constant, the cooling rate differences could be assigned to the reflectivity coefficient for the laser beam of TMC composites with different TiC particle content. The laser absorption coefficient of a material depends in general on its material resistivity [
39]. Thus, when the laser wavelength is constant, the absorption rate increases with the increase of the material resistivity. In this case, the material resistivity of TiC (105 μΩm) is significantly higher in comparison with the one of commercially pure Ti (0.554 μΩm). This indicates that the TiC powder has a higher laser absorption coefficient; hence, by increasing the concentration of TiC in the Ti matrix, the laser absorption coefficient of the powder mixtures will increase and the temperature of the molten pool will be higher. The reaction for the synthesis of TiC is exothermic, and a large amount of heat is released during the deposition of TMCs.
Examination of the sample’s microstructures by SEM at higher magnification revealed numerous TiC phases, depending on the TiC particle content, that are spread in the entire volume of the TMCs.
Due to the layer-by-layer manner-specific technique for 3D printing using the DED method, after each layer, the surface of the last deposited layer will partially be remelted, and some compositional differences between the interface area and the bulk can emerge. For TMCs, two mechanisms of integrating the TiC particles in the metal matrix were identified: (i) TiC will partially melt and re-solidify as dendrites, which refines the matrix microstructure, and (ii) the TiC particles will remain unmelted within the bulk due to the insufficient laser energy delivered in the melt pool. In the case of DED, it is difficult to distinguish the interface between layers and the remelted area within each layer. The high absorption of the laser beam, which led to a higher temperature of the molten pool, caused the dissolution of the TiC particles. If the TiC content increases in the bulk, the mean particle dimensions and the quantity in the bulk will also increase, leading to the apparition of a microstructure that includes fine unmelted or remelted particles in the metal matrix volume.
Figure 5 presents a strong adhesion without the presence of any defects at the interfaces between the TiC microstructure and Ti matrix. In addition to the melting of TiC particles, the partial dissolution of TiC particles into the molten pool during the DED process could also be obtained. The level of TiC dissolution was influenced by the liquid metal matrix and TiC interaction time with the laser energy, which is low due to the fast processing cycles. In consequence, it was difficult to melt/dissolve into the Ti matrix the entire TiC particles in TMCs with a content above wt.% 3 TiC. Therefore, most of the samples with an increased percentage of TiC were partly melted, and some unmelted TiC particles were trapped in the Ti matrix, as described in
Figure 4.
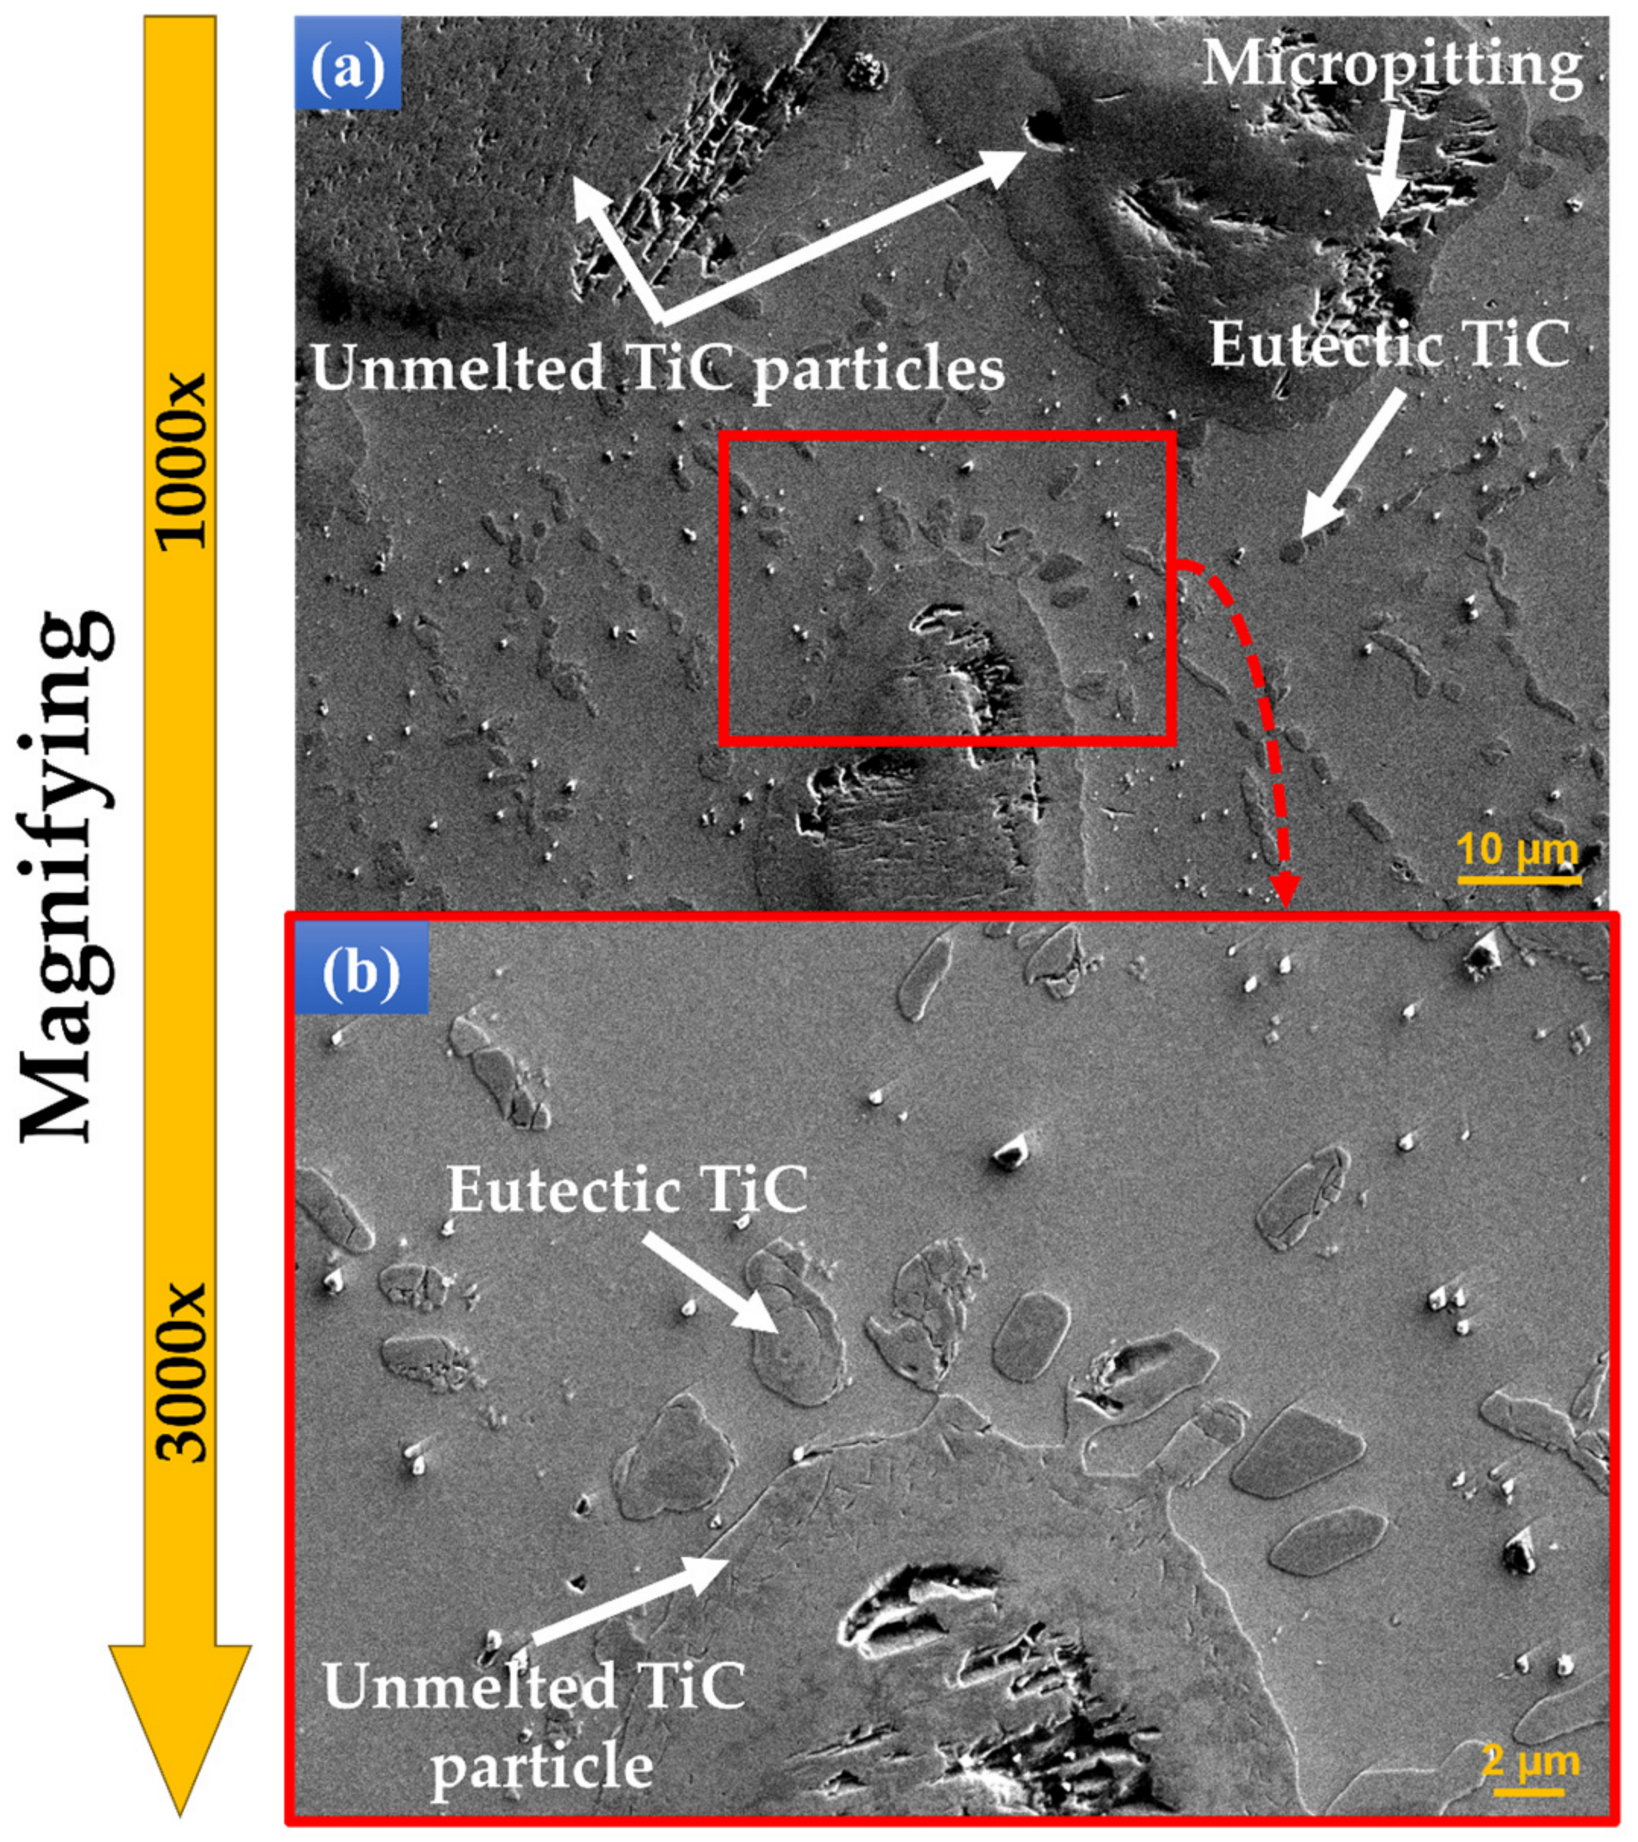
For a better understanding of the TiC microstructure,
Figure 6 presents the SEM images at different magnifications starting from 500 (
Figure 6(a.1–d.1)), continuing with 1000× (
Figure 6(a.2–d.2)), and up to 3000× (
Figure 6(a.3–d.3)) of the microstructure of TiC/Ti composites with percentages of TiC particles between wt.% 1–3. As exhibited in
Figure 6, the microstructure of metal matrix in TMCs with different content of TiC particles appeared to be Widmannstatten microstructure. It could be seen from
Figure 6(b.1–d.3) that the reinforcements of TiC/Ti composites were the granular and chain-shaped eutectic phases, granular primary TiC, and a reduced number of unmelted particles. The phases were homogeneously spread in the metal matrix.
The concentration increase from wt.% 5 to wt.% 10 TiC caused the appearance of a main primary dendritic structure, a secondary dendritic structure that evolves from the main one, and a granular component, which is more significant for 10 than for wt.% 5 TiC in the Ti matrix (
Figure 4b). In the case of wt.% 15 TiC (
Figure 4c), the secondary dendritic phase is overdeveloped, and also the highest number of undissolved TiC particles in the Ti matrix were identified.
The metal powder particles of commercially pure Ti would be initially melted during the laser processing. This is attributed to the fact that the melting point of Ti matrix (~1668 °C) is significantly lower than that of TiC used as reinforcement phase of materials (~3140 °C). The TiC reinforcement particles would be completely melted if the temperature value of the molten pool was closer to one of the TiC melting points. The microstructure of deposited samples presented in
Figure 6 reveals that the size of unmelted TiC particles from the TMCs that are in the hypoeutectic region is in the range of 0.23 mm
2 to 5.25 mm
2. In the case of the samples exhibiting in
Figure 7 TMCs from the hypereutectic region, the unmelted particles are in the range of 0.27 ± 10.95 mm
2.
By varying the TiC content in the TMC materials, it leads to different solidification conditions of the molten pool. Different types of TiC phases are formed during the solidification process. Thus, three main forms of TiC morphologies appear: unmelted particles, eutectic, and primary phases. It is observed from
Figure 3 and
Figure 4 that the morphology and size of the precipitated TiC phases at different TiC content are not consistent. When the TiC mass fraction is relatively low, under wt.% 5, chain-shaped eutectic TiC and granular eutectic TiC phases can be identified (
Figure 7(a.1–a.3)). In addition, it can be observed that the chain-shaped TiC phase has a tendency to line up at the grain boundaries of β-Ti. As the content of TiC gradually increases, the chain-shaped and granular eutectic TiC phases gradually decrease, while the granular and dendritic primary TiC phases gradually increase. It can be observed from
Figure 7(b.1–b.3) that the dendritic primary TiC phase at wt.% 10 TiC is insufficiently grown. As the TiC content continues to increase up to wt.% 15, the size of the granular primary TiC phase keeps increasing, and the dendrites become coarser, showing secondary and tertiary dendritic arms (
Figure 7(c.1–c.3)).
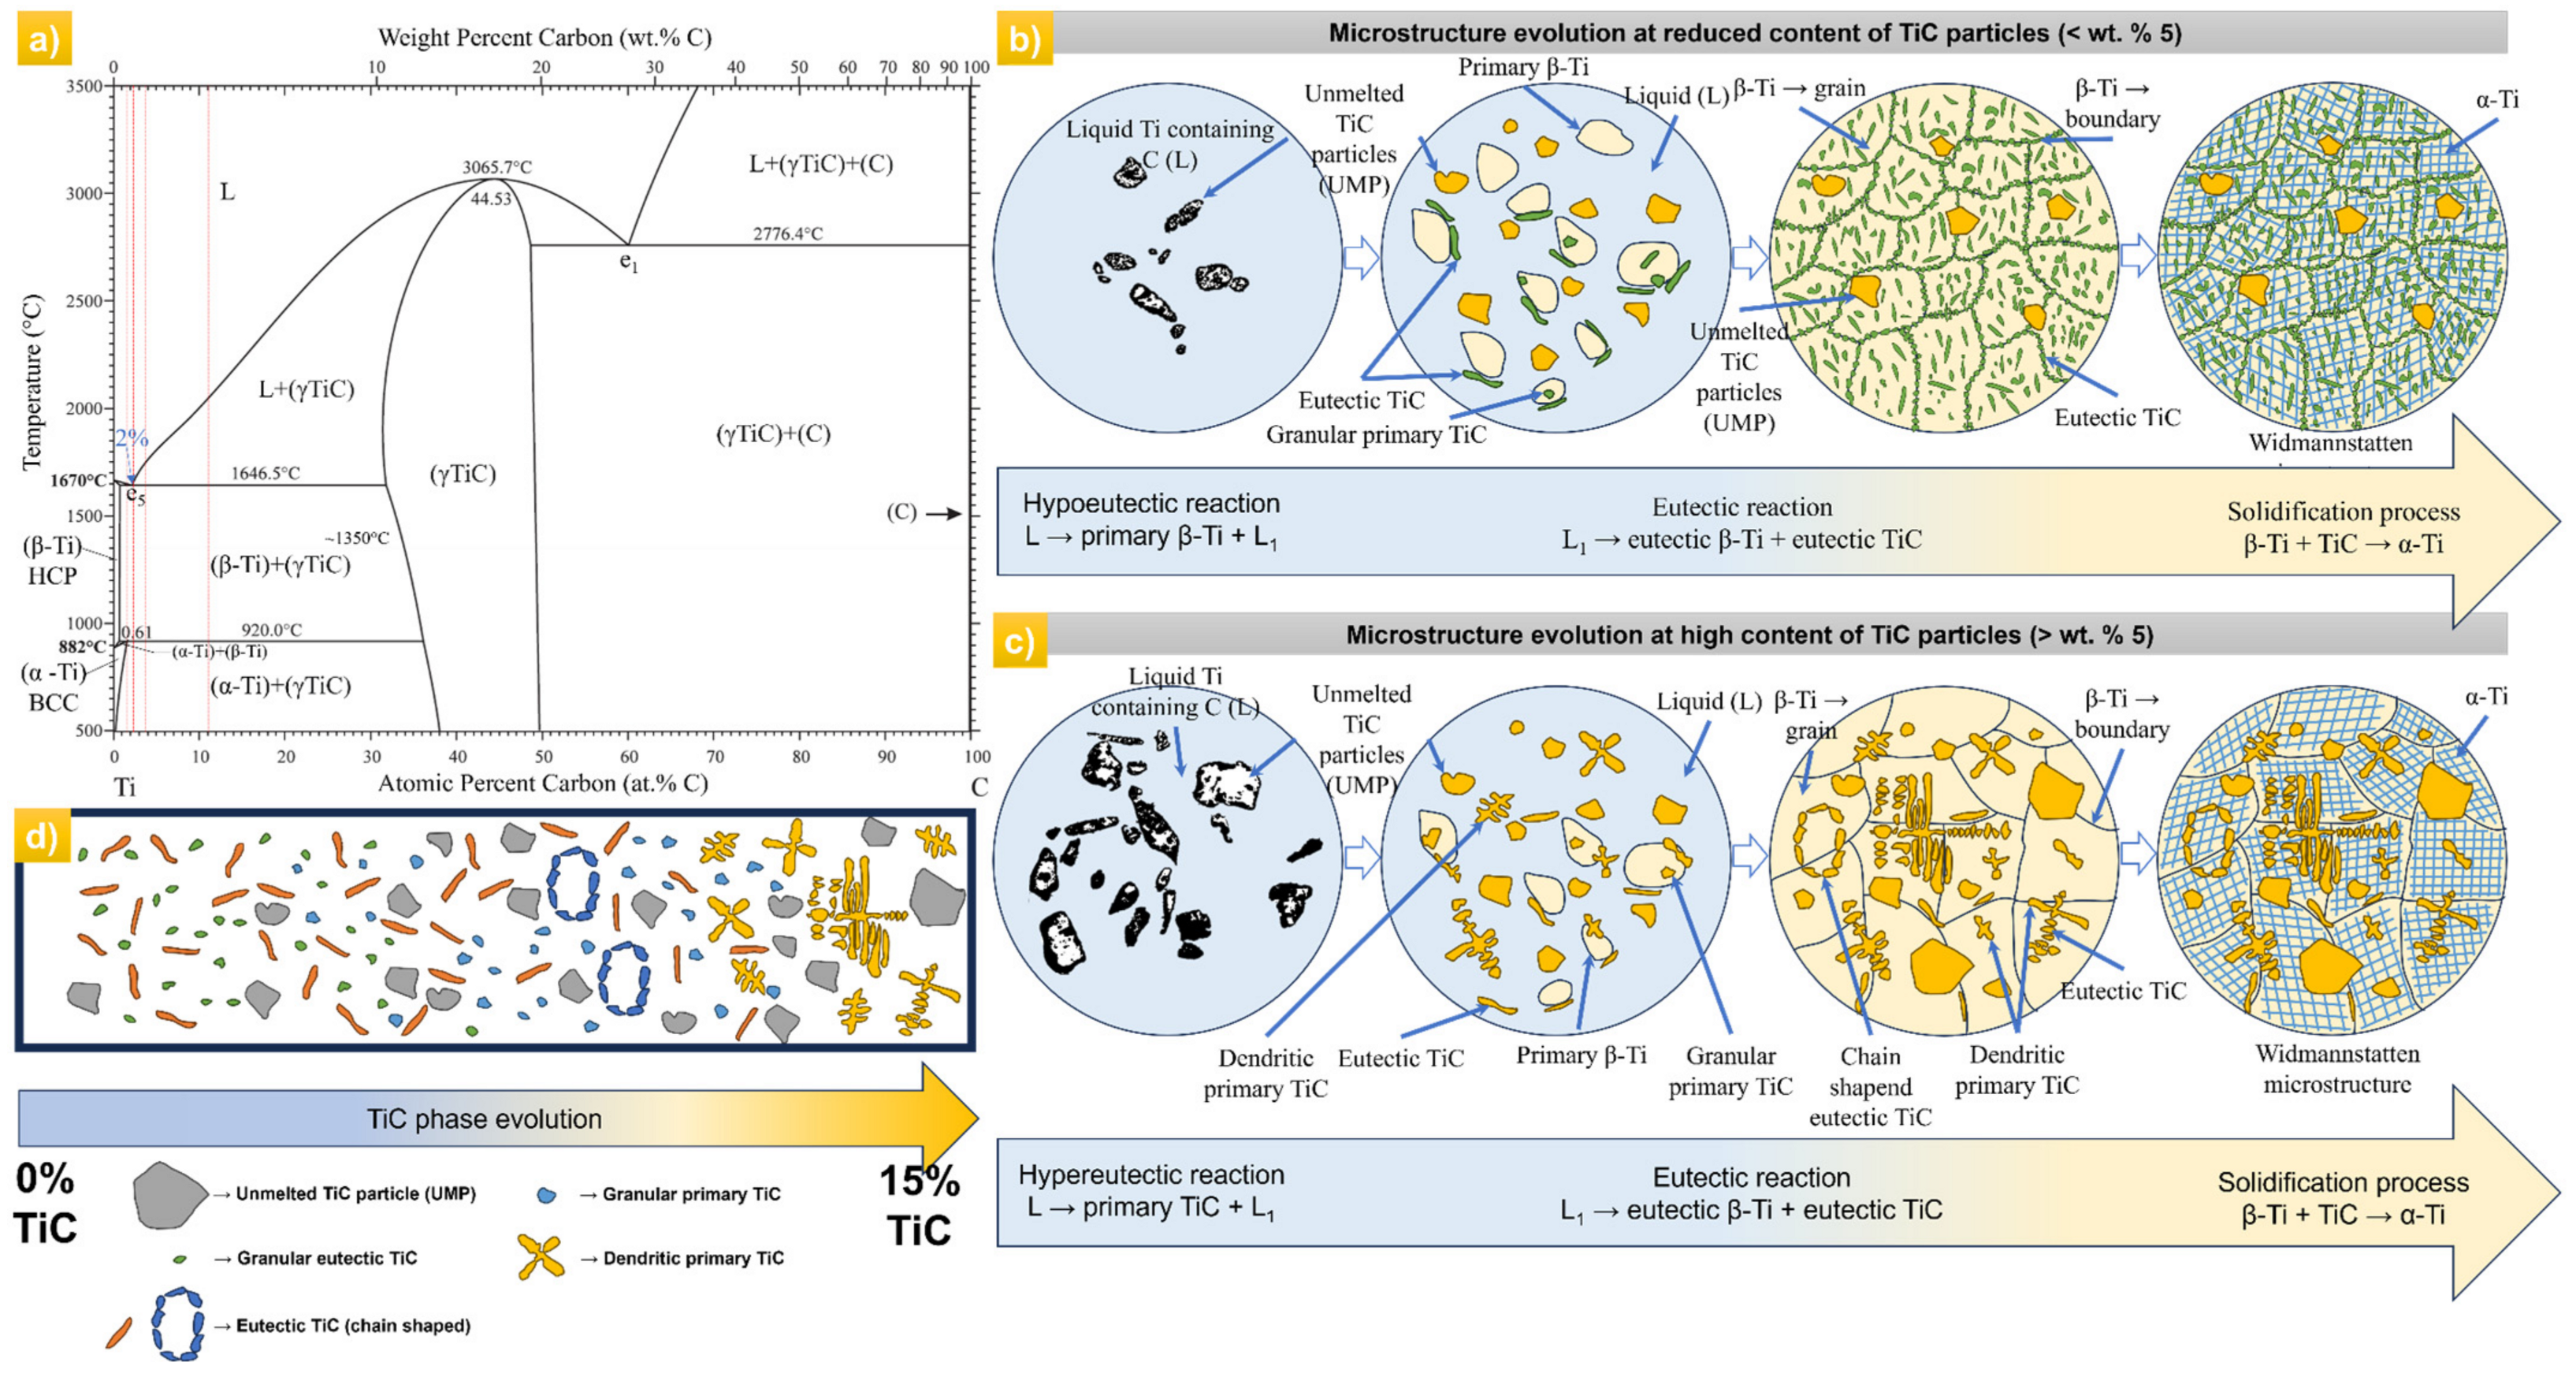
In order to discuss the mechanism of microstructure formation in depth of titanium matrix composites with different content of TiC reinforcement particles, the schematic representation of phase formation is presented in
Figure 8. The disk laser used for the manufacturing of the composite materials had a circular cross section with a “Top-Hat” intensity distribution, which was expected to generate a quasi-uniform high temperature gradient in the molten pool.
As presented in
Figure 8, the schematic diagram exhibits the microstructure evolution below and above wt.% 5 TiC. When the TiC content in TiC/Ti depositions is low, the TMC composition is in the hypoeutectic or eutectic composition region, according to the titanium-carbon (Ti-C) phase diagram [
40] as shown in
Figure 8a. In this case, during the cooling process, the metallographic phases of the materials are sequentially primary β-Ti + liquid phase that include the nucleation of another two phases (chain-shaped eutectic TiC + granular eutectic TiC) and α-Ti phase zones in the interior of β-Ti grain as the temperature decreases. The chain-shaped and granular eutectic TiC have a tendency to align at the boundary of the β-Ti grain. When the heat of the deposition reaches 1646 °C, eutectic reactions appear in the molten pool and generate eutectic TiC and β-Ti. After the laser processing ends, the temperature of the melt pool progressively decreases, and β-Ti precipitates during the cooling process. Once the temperature drops up to β-Ti transition point (~890 °C), solid-state phase transition takes place within each β-Ti grain, finally forming a α + β two-phase structure in the matrix. Because of the high cooling rate characteristic of the DED process, α-Ti precipitates through non-equilibrium martensitic transformation, thus leading to the Widmannstatten structure [
41]. The schematic diagram of the microstructure evolution at a reduced content of TiC is presented in
Figure 8b. In this case, in-situ eutectic TiC phase precipitates with the microstructure of short tubes, granular and chain-shaped. These types of morphology were also identified by Zhang J. et al. at different experimental conditions and TiC content [
42].
Figure 8c illustrates the microstructure evolution of the TiC phase in the TMC composite as the TiC content is over wt.% 5. When the TiC content in Ti/TiC depositions is higher, the TMC composition is in the hypereutectic composition region, according to the titanium-carbon (Ti-C) phase diagram. Correspondingly with the first case, the liquid melt pool that contains carbon is generated with the melting of Ti powder and the dissolution of TiC particles. During the cooling process, with the carbon concentration in the melt pool increasing through diffusion, the hypereutectic reaction between Ti and C materializes, and then primary TiC phases are precipitated from the liquid Ti matrix, as is indicated in eq. L → primary TiC + L1. It develops into grains with different shapes and sizes depending on the TiC content. The primary TiC phase does not solidify at the same time, thus newly formed granular, chain-shaped, and dendritic shapes occur. The secondary phase of dendritic TiC is commonly supposed to be caused by the thermal variations at the dendrite surface. The tertiary TiC dendrites are mainly oriented by the thermal gradients in the melt pool. While the temperature decreases, the β-Ti grains keep growing until they occupy the whole matrix, the primary TiC stops precipitating, and the eutectic reaction occurs as in eq. L1 → eutectic β-Ti + eutectic TiC, followed at the end by the β-Ti to α-Ti transformation [
41]. The α-Ti dendrites are distributed inside the β-Ti grains, developing a Widmannstatten microstructure. In this case, the enhanced carbon activity and the extended reaction time assure the development conditions of dendritic primary TiC phases. Thus, due to the high content of C in the melt pool, more secondary and even tertiary dendritic arms are formed. The specific microstructure of this type of material was also validated by L. Li et al., but at a content higher than wt.% 20 TiC [
19].
According to the analyses of the metallographic morphologies of TMCs with different TiC content, the TiC powders could bear considerable melting and dissolution during the DED processing (
Figure 6 and
Figure 7). The increase in TiC fractions provides more C that allows the formation of primary TiC. Based on the Ti–C phase transformation diagram, a rise in the carbon content results in a pronounced elevation of the liquidus line and an expanded temperature range for primary TiC precipitation. Thus, a higher degree of undercooling at the front interface of primary TiC will be expected. This phenomenon promotes the formation of primary TiC phases with dendritic shapes. Even slight turbulences from heat gradients at the solid-liquid interface during the growth process of TiC give the possibility of secondary and tertiary dendrite growth. In the case of the eutectic and primary TiC phases, both apparitions are referred to as resolidified TiC. In order to clearly understand the microstructure of the TMCs depending on the TiC content, the diagram of each composition up to wt.% 15 TiC is illustrated in
Figure 8d.
3.2. Particle Distribution Analysis
The microstructure of pure Ti deposition is composed of α-Ti + β-Ti Widmanstatten structure characterized by α needle grains that grow from β grains in multiple directions and intertwining. This type of microstructure corresponds to the purity of the used powder (>99.95%). The results obtained for the sample with wt.% 1, 2, and 3 TiC are shown in
Figure 9. For the TMC with a concentration of wt.% 1 reinforcement material, the TiC microstructures have an average area of 1.87 µm
2 (
Figure 9a). The increased content of Carbon due to the raised percentage of TiC up to wt.% 2 exhibits a similar type of microstructure, and the mean value of the particle area decreased to 0.81 µm
2 (
Figure 9b). Therefore, the reinforcing structure became significantly well spread in the Ti matrix. This phenomenon is further magnified in the bulk sample with wt.% 3, where the mean area of the TiC phase is equal to 1.23 µm
2 (
Figure 9c). When the content of TiC goes beyond wt.% 3, the number of unmelted particles significantly increases. The results pertaining to samples containing wt.% 5, wt.% 10, and wt.% 15 TiC are also outlined in
Figure 10. Notably, the sample with wt.% 5% reveals a TiC microstructure with an average area of 2.23 µm
2 (
Figure 10a). When the content of TiC is increased up to wt.% 10, the microstructure shows an intensification in primary dendritic TiC, and the mean particle area is reduced to 1.15 µm
2 (
Figure 10b). Subsequently, the bulk sample containing wt.% 15 TiC demonstrates a mean TiC phase area of 1.2 µm
2 (
Figure 10c). Notably, beyond wt.% 10% TiC, the number of unmelted particles can affect the mechanical properties of the TMCs due to the exothermic reaction of the TiC synthesis caused by the intense heat that is released during the deposition of TMCs by direct energy deposition using a high-power laser source. Thus, the increased absolute temperature weakens the surface tension due to gradients in interfacial tension. This occurrence may promote the expansion of the molten pool and may increase the Marangoni effect velocity. In addition, in cases of a greater amount of TiC, due to the thermal instability, the primary dendritic phase becomes coarser and influences the overall properties of TMCs. Therefore, the agglomeration of the solute element is reduced, resulting in a dispersed distribution of the reinforcements, as can be seen in
Figure 9 and
Figure 10. Additionally, the TiC-rich samples present a large number of unmelted particles, which are considerably larger in size. This reinforcement phase acted as nucleation sites and refined the matrix microstructure, with the disadvantage of possible micro-crack center propagation. However, when the TiC content was increased over wt.% 3, pores and micro-pitting effects were observed in the volume of the unmelted particles.
3.3. Microhardness Assessment
The microhardness values of the samples obtained under optimal processing conditions are shown in
Figure 11, and it can be seen that they increased from 192 ± 5.3 HV
0.2 (pure Ti) up to 300 ± 14.2 HV
0.2 (Ti + wt.%15 TiC). The microhardness increases with the addition of TiC particles due to the macro-homogeneous incorporation of in-situ synthesized TiC reinforcement throughout the Ti matrix, which induces a strengthening effect. The improvement in hardness observed with the increase in TiC concentration is attributed to the dislocation fixation effect of the TiC particles [
43]. At the same time, the fine grain microstructure, due to the fast cycles of heating and cooling specific to the DED process, can increase the hardness of materials, according to the Hall-Petch theory [
44,
45]. The hardness of the undissolved TiC particles in the Ti matrix fluctuates between 3107.2 ± 88.12 HV and 3254 ± 20.09 HV. Due to the multilayer scanning strategy, the DED-deposited structure is subjected to repeated heating and cooling cycles, which leads to increased hardness due to the smaller grain’s microstructure. Also, the improved values of microhardness in the case of TMCs as compared to pure Ti are provided due to the solid solution strengthening of carbon and the fine grain strengthening. These TiC microstructures can withstand loads orders of magnitude higher than the metal matrix and thus contribute to the increase in resistance to plastic deformations during microindentation tests.
The microhardness of the hypoeutectic TMCs region, according to the Ti-C phase diagram, was measured to be up to 265 ± 16.88 HV (Ti + wt.% 3 TiC), which was about 35 HV lower than that of the hypereutectic TMCs region, which shows to be 300 ± 14.2 HV0.2 (Ti + wt.% 15 TiC). In TMCs with a TiC content up to wt.% 3, the microhardness indenter caused deformation and mobilization of TiC phases, and smaller microhardness was obtained. On the other hand, when the microhardness indenter was applied on the surface of the wt.% 15 TiC TMCs, the larger primary TiC dendrites acted as a reinforcement to the material deformation and were less deformable.
In comparison to titanium fabricated via powder metallurgy, this paper demonstrates a significant increase in microhardness, with a maximum value of around 300 HV compared to approximately 176 HV [
46]. Studies have shown that commercially pure titanium without any surface treatments typically has a microhardness of ~200 HV [
46,
47,
48]. Researchers have reported that under different experimental conditions and with varied powder morphologies, titanium metal matrix composites (TMCs) exhibited a microhardness of 312 HV at approximately 20% TiC volume fraction [
49]. Also, another DED sample with a 20% TiC deposition showed an increase in hardness at 350 HV [
12]. Thus, the TMCs studied in this paper offer notable advantages in terms of microhardness compared to similar composites in the literature.
3.4. Friction and Wear Behavior of TMCs
The wear track morphologies of TMCs with different TiC content were analyzed using the non-contact optical profilometry technique, as presented in
Figure 12. The wear track width and depth of the hypoeutectic TMCs region were considerably greater than those of the hypereutectic area. To provide a certain observation of the differences of the wear scar, cross-section profiles were measured across wear tracks and are presented in
Figure 12. For the samples with a TiC content of up to wt.% 3, the wear tracks reveal a maximum width and depth of 1.53 mm and 107 μm, respectively (
Figure 12d). The circular wear reciprocating test showed significant tribological differences between the TMC samples with different content of reinforcement TiC particles and the pure Ti sample tested at room temperature.
Figure 12a reveals a low value of the Ti-deposited sample wear scar with a depth and width of 57 µm and 1.07 mm, respectively. The geometric characteristics of the wear scar in the case of the Ti + wt.% 1 TiC sample (
Figure 12b) were two times deeper, reaching up to 112 µm depth and 1.29 mm width. When increasing the TiC content to wt.% 2, the wear scar depth was 72 µm and width 1.15 mm (
Figure 12c). In addition, plastic deformation pile-ups were observed at the edge of the wear tracks of samples with wt.% 1, 2, 3 TiC content, which indicates excellent plasticity.
In the case of wt.% 5 TiC, the wear track was more accentuated with deeper groves that reach up to 139 µm depth and 1.721 mm width (
Figure 12e). The increase in carbon due to the step-up to wt.% 10 TiC provides the necessary mass for increasing the depth and width values up to 206 µm and 1.98 mm (
Figure 12f). This phenomenon was not further magnified in the bulk sample with wt.% 15, that reach to a depth of 121 µm and a width of 1.68 mm. In contrast, with the sample with wt.% TiC up to 3%, no plastic deformation pile-up was observed.
The wear rate is not directly proportional with the rise content of TiC reinforcement [
50]. The depth of the tracks does not evolve in a linear manner and may be attributed to the complex processes occurring during the wear of the composites.
Based on the wear depth and the mass loss, the wear rate can be calculated by Equation (2):
where W
r is the wear rate (mm
3/N·m), V is the wear volume (mm
3), S is the total friction distance (m), and F is the load (N). The wear rate graphs of each sample are presented in
Figure 12h and show how it changes with the addition of TiC dispersed phase.
The analyzed results showed that the average wear volume of the sample fabricated of pure titanium was about 0.71 mm3/N·m, while the average specific wear rate for the composite sample mixed with wt.% 1, wt.% 2, and wt.% 3 TiC was about 1.7 mm3/N·m, 1.18 mm3/N·m, and 2.45 mm3/N·m, respectively. In the case of TMCs with wt.% 5 TiC, the wear rate was 3.43 mm3/N·m. When the content of TiC was increased up to wt.% 10, the wear rate also increased to 5.67 mm3/N·m. The increase in Carbon due to the step-up to wt.% 15 TiC provides the necessary mass to decrease the wear rate to 3.02 mm3/N·m.
The worn surfaces of Ti, Ti + wt.% 1, Ti + wt.% 2, and Ti + wt.% 3 TiC are presented in
Figure 12a–d. A large number of ridges and micro-plow structures are observed on the worn surfaces of bulk-deposited materials under a load of 60 N, which significantly contributed to the increased surface roughness and frictional resistance. The worn surface of each analyzed sample exhibits complex and severe wear tracks. As can be seen from
Figure 12, a large number of plowing grooves and spalling pits by stick-slip worn mechanism were observed on the analyzed surface. Edges produced by abrasive impurities that were caught between the sample surface and steel ball during the friction investigations together with microplow structures resulting from considerable plastic deformation during the wear examination were also observed. The presence of wear grooves and debris indicates the apparition of abrasive wear during the testing.
The microstructure of the TMCs with a TiC content up to wt.% 3 presented small pits that can be observed on the wear surface, which were caused by the granular eutectic, primary, and chain-shaped eutectic TiC microstructures that were being pulled out during the wear test. These pulled-out TiC particles became part of the wear debris, contributing to a reduction in the value of friction coefficients COF). These pulled-out TiC contents that caused large-scale spalling and plastic deformation would make the debris mix into the friction pair, contributing to a transition in the wear mechanism of TMCs from two into three friction elements with additional debris. The combination of these factors decreases the wear resistance.
The wear marks of the hypereutectic TMCs region (wt.% 5, 10, and 15 TiC) presented no pits, thus indicating that the large dendritic TiC phases were not contributing to the surface wear. This can be attributed to the larger size and deeper embedment of the primary dendritic TiC within the Ti matrix compared to those phases of TiC that are presented at a low amount of C. However, the remaining dendritic TiC caused a rough wear surface, leading to an increase in the coefficient of friction.
The wear performance of TMCs was also investigated by Zheng Y. et al. [
51]. He discovered that the morphologies of ceramic particles significantly influence the wear resistance. TMCs with equiaxed TiC presented a higher wear rate, and TMCs with dendritic TiC led to an improvement in wear resistance due to the two-body wear mechanism instead of the one with three bodies.
The control sample (titanium) displayed a high and unstable friction coefficient when sliding against the steel ball. The friction trace of TMCs rotating against steel balls in the air can slightly fluctuate during the complete testing period because of the stick-slip adhesive wear. The physical interaction between the testing surface and counterbody surface increases when increasing tangential force over junction growth, and both contact surfaces remain in adhesion, showing a ‘stick’. Then, as the applied force exceeds the adhesive strength, the junction ruptures and a rapid ‘slip’ for both surfaces can occur. This stick-slip series happened repetitively, accounting for the friction force fluctuation. The mean values for the friction coefficient of TMCs with different TiC morphologies were calculated, and the results are presented in
Figure 13. The COF average was between 0.48 ± 0.032 (pure Ti) and 0.63 ± 0.039 (Ti + wt.% 15 TiC). A high COF is generally associated with a large wear rate due to the high adhesion rate on the counterpart. The TMCs that are in the hypoeutectic region, despite having a lower COF, exhibited a wear rate of 2.45 mm
3/N·m (Ti + wt.% 3 TiC) compared to the ones in the hypereutectic region, which measured a COF of 3.02 mm
3/N·m (Ti + wt.% 15 TiC). Therefore, the friction and wear performance cannot be exclusively evaluated based on the value of the COF.
3.5. Tensile Properties
Commercially pure Ti showed a significant plastic deformation, but after adding TiC to the composition, the fracture feature of TMCs drastically changed, becoming brittle, as presented in
Figure 14. The average ultimate tensile strength and elongation of pure Ti fabricated by DED are approximately 552.8 ± 5.5 MPa and 4.87 ± 0.25%, respectively. The tensile properties, which consist of tensile strength and elongation of TMC with wt.% 1 TiC, are approximately 560 ± 6.2 MPa and 1.31 ± 0.09%, respectively. When the TiC content was increased up to wt.% 2, the tensile strength improved to approximately 590 ± 5.8 MPa and elongation decreased to 1.18 ± 0.1%, which translates into more brittle structures. The TMC with wt.% 3 TiC followed the same trend as before, where the tensile strength increased to 616 ± 7.4 MPa and elongation was diminished to 0.79 ± 0.29%. The results obtained in case of the TMC with wt.% 5 TiC maintain the increasing tendency in case of tensile strength by rising to 725 ± 5.4 MPa and become even more fragile compared with the samples with TiC content between wt.% 1–3, which had a maximum elongation of 0.62 ± 0.04%. The raised content of Carbon up to wt.% 10 TiC provides the necessary mass for changing the TiC reinforcement microstructure to primary TiC, leading to a reduction in tensile strength and elongation to 365 ± 6.1 MPa, and 0.42 ± 0.06%, respectively. When the content of TiC increases up to wt.% 15 TiC, this phenomenon intensifies, exhibiting a diminution of tensile strength and elongation down to 355 ± 5.9 MPa and 0.25 ± 0.05%. In conclusion, an amount of wt.% 5 TiC can improve tensile strength, but with the limitation that the plasticity of the Ti matrix is drastically reduced.
Experimentally, it was demonstrated that the melting mechanisms in the case of TiC particles after laser irradiation are (i) epitaxial growth along the margin of the partially melted TiC particle and (ii) complete dissolution of TiC particles. However, when we refer to the thermal behavior of TiC, the maximum temperature was located in the core of the particles, which was diminished gradually when reaching the outer shell surface. The transformation of the TiC phases is directly influenced by the C percentage. In case of a complete melting, a transformation to a primary dendritic phase may occur, and the coarse type forms secondary and tertiary dendrites along its margins due to the instability of the thermal gradients.
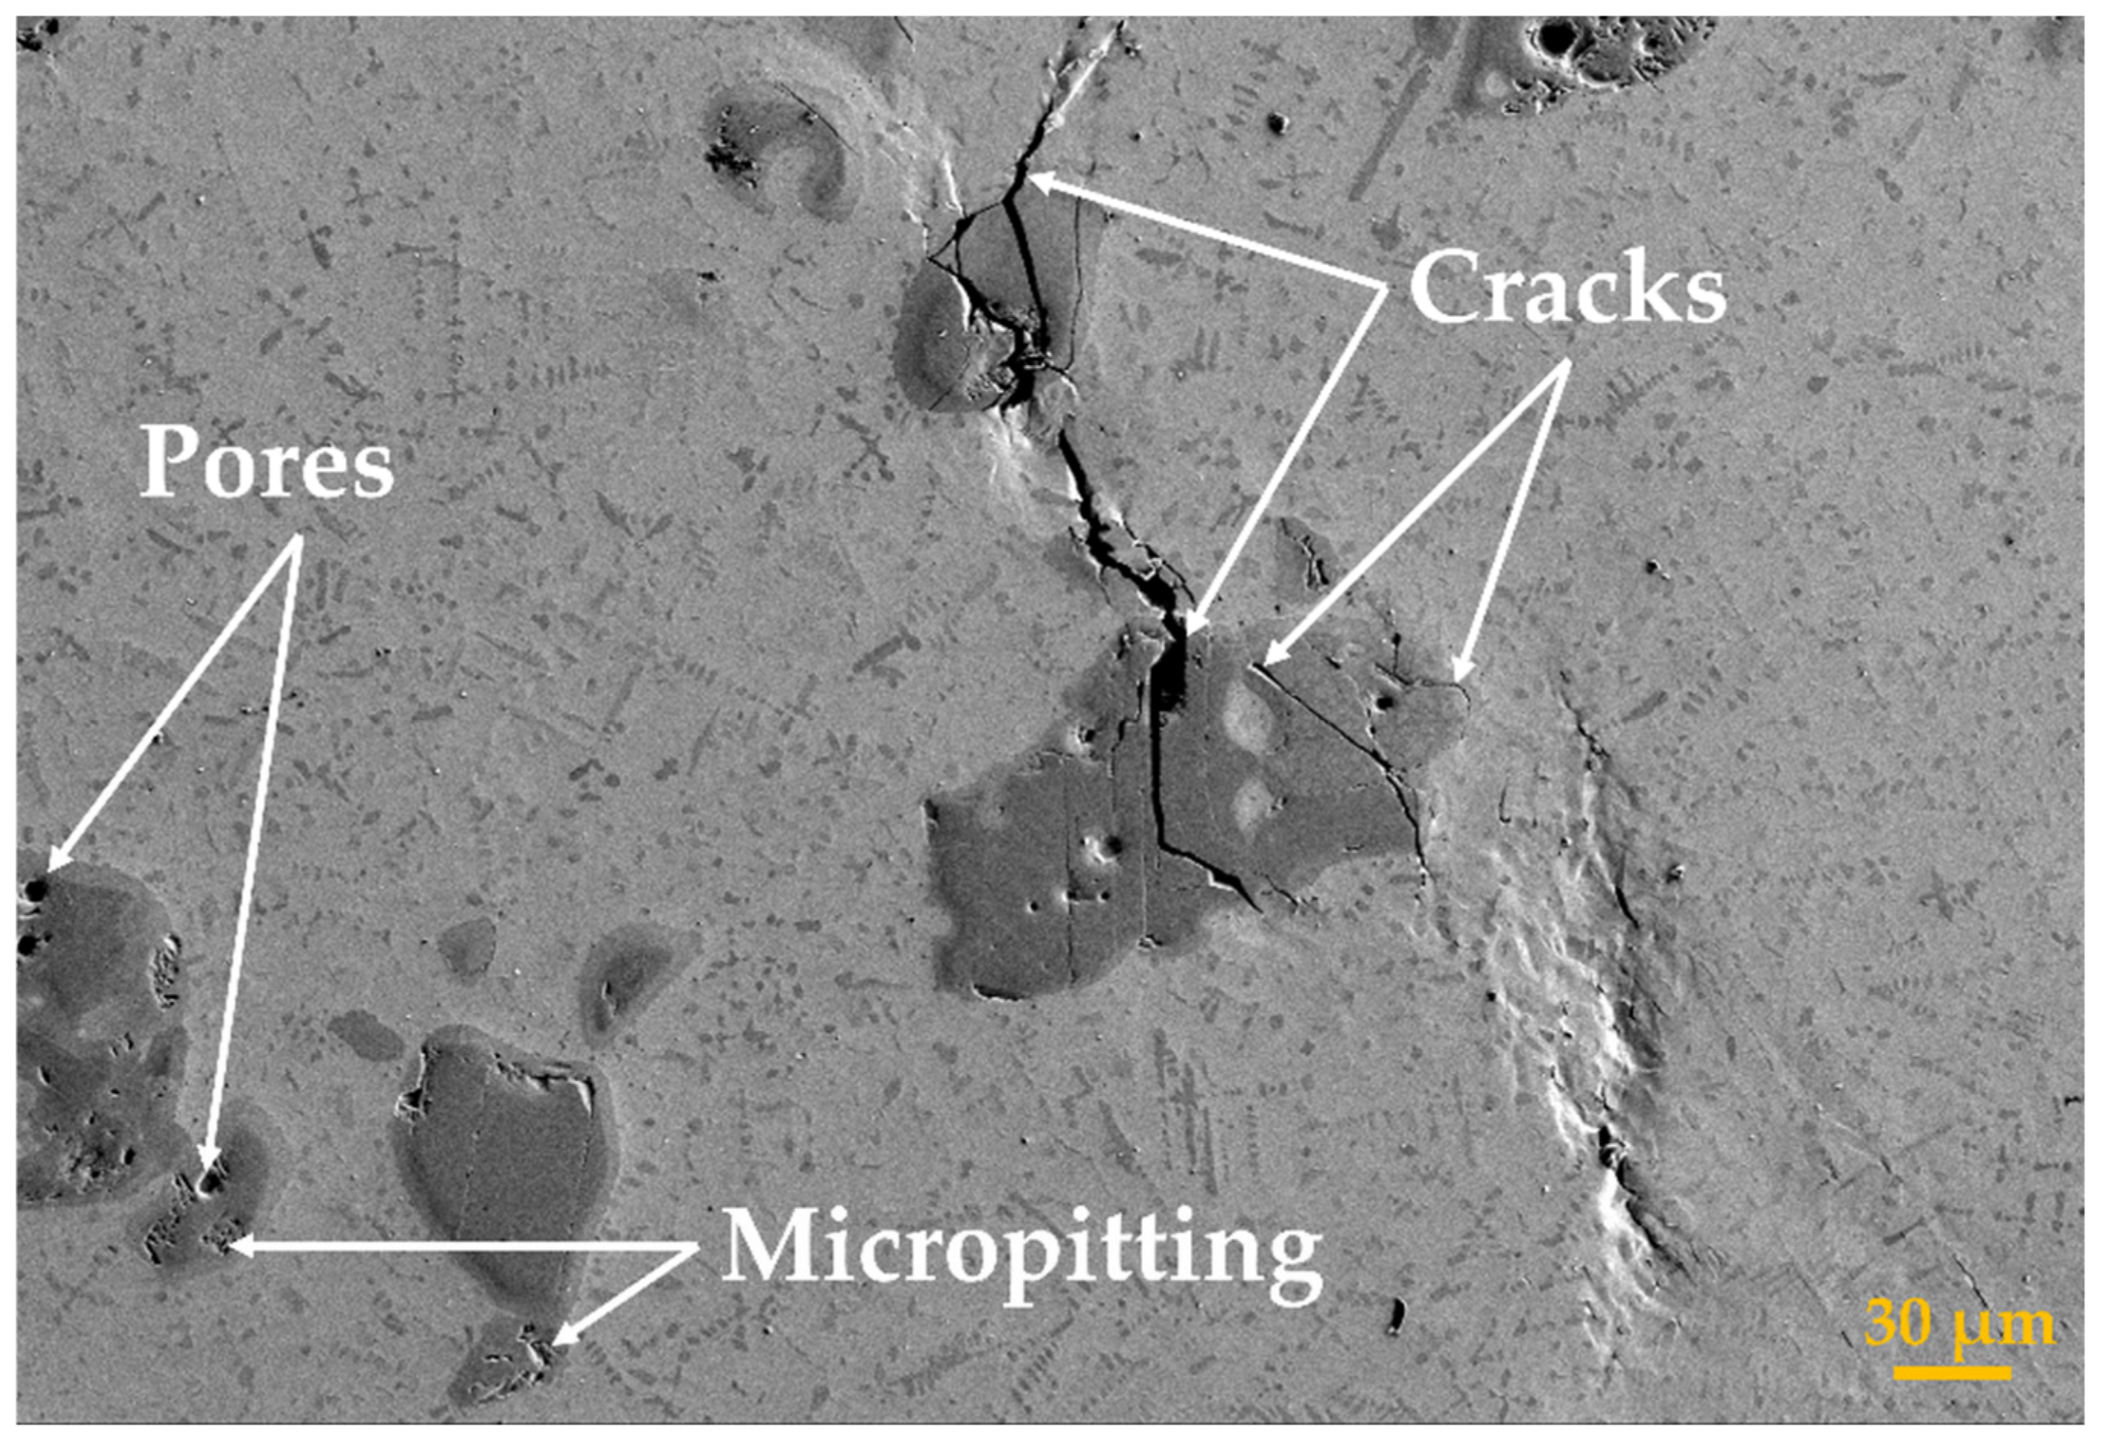
The TiC particles dispersed in the TMC matrix strengthen the fracture mechanism as part of the force from the base matrix that is retrieved by the reinforcement TiC phase. The principal feature that leads to a reduced tensile strength factor of the deposited samples when the TiC content was above wt.% 10 was caused by the apparition of premature cracking. As is known, when components are under load, the brittle materials can only relieve external stresses by cracking, whereas in ductile materials the stress relief can be accomplished by plastic deformation. On the other hand, by increasing the TiC content, there is less ductile matrix between brittle phases; thus, more micro-cracks are susceptible to propagation, which finally leads to reduced material strength. If the bonding between the TiC particles and Ti matrix is strong enough, after applying an external stress to the sample, the load could be transferred from the matrix to the TiC phases. Thus, the brittle cracks would form inside the TiC phases or in the vicinity of unmelted particles (
Figure 15). In the case of using TiC particles, the obtained TMC samples present a larger interfacial area between the TiC and Ti matrix and smaller inter-particle spacing for a given particle volume fraction, which is advantageous for obtaining more load transfer from the matrix to the TiC reinforcements, thus leading to an increased value in tensile strength. However, when the TiC content goes beyond wt.% 10, the size of dendritic primary TiC becomes substantially larger, and some unmelted particles exhibit pores or a micropitting effect. More fractured, unmelted particles and dendritic primary TiC phases remain on the fracture surfaces as the TiC content increases, leading to a less resistant structure. During the stretching process, the unmelted particles and dendritic primary TiC phases with larger size hinder the plastic deformation of the Ti matrix, causing stress to be concentrated in their vicinity. In addition, microcracks are prone to generate, extend, and merge in their vicinity, reducing the strength and ductility of the TMCs and making them susceptible to premature cracking. Thus, this indicates that when a high proportion of TiC is added (beyond wt.% 10), the bonding strength between TiC and the Ti matrix is still achievable and TMC will fail in terms of tensile strength. Moreover, since the ductility of the matrix decreases, the crack spreads more easily. The rupture mechanism of this type of material was also investigated by Yu C. et al. [
30], but at a content of wt.% 20 TiC and processed in different experimental conditions. He also concluded that only by reducing the content and size of unmelted TiC particles and the dendritic primary phase can the tensile properties of TMC be improved.
The lack of cohesion of the interface between TiC particles and the Ti matrix influences the tensile properties of the TMCs. The bonding strength of the interface between reinforcement particles and matrix is influenced by the diameter of the strengthening particles. If the dimensions of these particles increase, the possibility of fully melting them is reduced, and the bonding process can be incomplete due to the lack of adequate adhesion at the interface. The behavior of composite materials is often sensitive to changes in temperature. First, the response of the titanium matrix to an applied load is temperature-dependent, and, on the other hand, the temperature changes can cause internal stresses, established because of differential thermal contraction and expansion of the involved elements.
3.6. Influence of TiC Percentage on the Thermo-Cycle
Figure 16 displays a typical thermo-cycle of the molten pool, recorded using the IR thermal camera, during the 20-mm-long deposition of commercially pure Ti and the six TMCs with different TiC percentages (wt.% 1, wt.% 2, wt.% 3, wt.% 5, wt.% 10, and wt.% 15), using the same optimized process parameters. This analysis was suitable for revealing the temperature evolution during the deposition process.
At the beginning of the process, the temperature slightly fluctuates from 1400 °C to 1460 °C, probably due to a small stationary period of the robotic arm after the laser starts. After this point, the temperature decreases and remains approximately constant during the entire deposition process, showing only a slowly increasing increase at the end of the deposition, again most probably caused by the reduced speed of the robotic arm. From the plot (
Figure 16), it can be observed that in the case of the addition of wt.% 1 and wt.% 2 of TiC particles, the temperature increases up to 1423 °C, while for wt.% 3 of TiC, the temperature tends to decrease at 1377 °C, which is a similar interval compared to the pure Ti sample. During the deposition of TMCs, the small fluctuations of the temperature values can be explained by the fact that a part of the laser beam is absorbed by the TiC particles, which results in a higher melting point (~3140 °C) compared to the pure titanium melting temperature (~1668 °C) and leads to a destabilized melt pool. Overall, during the processing, it can be observed that the absorption of the laser beam was relatively constant, resulting in a steady thermal distribution that ultimately generates a stable melt pool that leads to a structure without defects and a homogeneous distribution of TiC in the titanium matrix.
From the plot interpretation, it can be observed that an increased amount of TiC in the TMCs composition causes a higher molten pool temperature when the TiC reaches up to wt.% 2. This is caused by the presence of TiC particles, which act as heterogeneous nucleation spots. In addition, at this rate of TiC content, the laser beam had sufficient energy to melt the majority of the particles, thus leading to an increase in the temperature values of the melt pool.
The plot of the temperature’s evolution recorded during the LMD process for 20 mm-long deposited tracks of Ti and TMCs with wt.% 5, 10, and 15 TiC concentrations, using the mentioned optimal parameters described in this study, is also displayed in
Figure 16. When pure titanium was deposited, temperatures quickly reached a range of 900 °C to 1400 °C within 0.2 s, exhibiting fluctuations between 1370 °C and 1420 °C throughout the deposition process. After the cease of the laser action, the temperature decreased from 1410 °C to below 900 °C in approximately 0.2 s. Extending these observations to the behavior of TMCs, a rapid temperature surge from 900 °C to 1390 °C within less than 0.05 s at the onset of the process was followed by expedited cooling subsequent to the ending of laser interaction. It is noteworthy that the TiC content within TMC of varying concentrations did not have a substantial influence on the temperature evolution during the laser metal deposition (LMD) process. Notwithstanding, an elevation in TiC concentration resulted in a shift in the temperature range. Specifically, with a TiC concentration of wt.% 5, temperature oscillations were noted within the 1350 °C to 1390 °C range, while a wt.% 10 TiC composition yielded fluctuations between 1350 °C and 1430 °C, while for a wt.% 15 TiC composition the measured temperature displayed values within the 1350 °C to 1520 °C range. Consequently, although the minimum temperature remained unaltered, the maximum temperature increased by 40 °C for TMC with wt.% 10 TiC in comparison to that with wt.% 5 TiC and by over 90 °C for TMC with wt.% 15 TiC compared to the sample with wt.% 10 TiC. Therefore, we may conclude that the TiC particles increase the amount of stored heat and slightly decrease the heat dissipation rate of the liquid phase because it takes a longer time for the cooling to take place after the laser beam is turned off.
The decrease in maximum temperature of the melt pool was also influenced by the fact that the thermal conductivity of Ti is lower than the one of TiC. The average temperatures of the deposited layers with different TiC percentages indicate a good metallurgical bond between the deposited layers and the TiC microstructure with the Ti metal matrix. The thermal signature analysis can offer a better understanding of the correlation between molten pool characteristics with input processing parameters and can be used to predict the microstructural evolution of TiC.


