3.1. Material Model and Main Parameters
Reactive material liners can form a high-velocity jet under the detonation of the SC, and its penetration and deflagration coupling effect on the target is very complex. At present, there is no material model mature enough for the numerical simulation of the whole process of the jet forming, penetration and deflagration coupling of the SC with reactive material liners. For this reason, the reaction delay time of reactive materials (
τ) was introduced by some domestic and foreign scholars [
17,
25,
27]. Generally, it has been considered that reactive material jets are inert such as traditional metal jets when time
t <
τ. The shock equation of state (EOS) and Johnson–Cook constitutive model were used to describe the formation and penetration behavior of the reactive material jets. Meanwhile, the corresponding parameters of the PTFE/Al reactive materials were obtained based on the separated Hopkinson shock and quasistatic compression experiments; the main material parameters are listed in
Table 2 [
17,
28]. The material of the target was steel 45#. The EOS of the shock model incorporating the strength model of Johnson–Cook was chosen to describe the material models; the main parameters are also listed in
Table 2 [
17], where
ρ is the density of the material,
a,
b,
n,
C,
m and
S are the material constants,
Tm and
Troom are the melting temperature and room temperature, respectively,
Γ is the Gruneisen coefficient and
c0 is the acoustic sound speed of the material.
For the metal liner, the shock EOSs were selected and the strength models were neglected, because the liners behaved like a fluid under the extremely large pressure and temperature during the collapse of the SC [
29]. The main material parameters of the Cu liner, Ti liner and Al liner are listed in
Table 3.
For the structure of the SC, the jet forming and penetration characteristics were significantly affected by the type of explosive. The JH-2 explosive was comprehensively selected considering the detonation speed, detonation pressure and operating cost. The corresponding parameters are listed in
Table 4 [
17], where
D and
PCJ are the detonation speed and detonation pressure of the explosive, respectively,
A,
B,
R1,
R2 and
ω are the material constants,
E0 is the specific internal energy and
V0 is the relative volume.
3.3. Formation Characteristics of Composite Jets
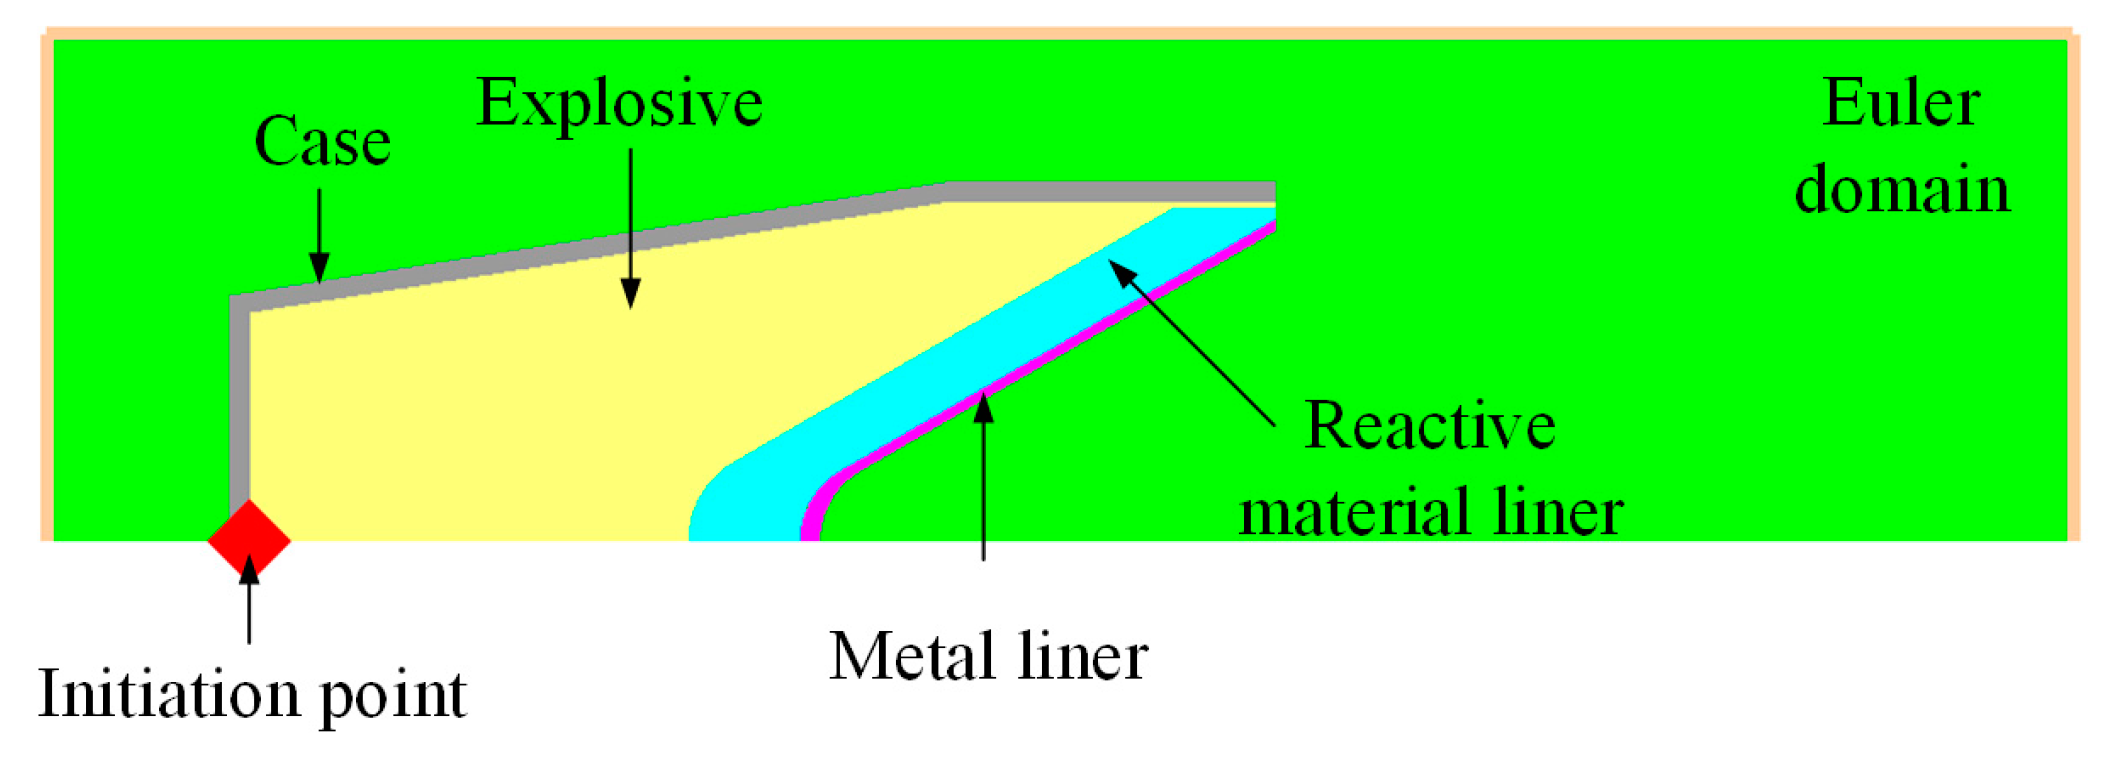
A series of gauge points were set on the outer and inner layers of the reactive material liners to observe the pressure and temperature evolution and distribution laws of the reactive material elements in the forming process of the composite jets, as shown in
Figure 8a. When the jet head reached the standoff of 1.0 CD, a typical distribution of gauge points on the reactive material slug was generated, as shown in
Figure 8b. In addition, five fixed gauge points were set on the Euler domain along the axis of the SC to record the tip velocity of the reactive material composite jets. Gauge #1 was set at the corresponding position of the bottom of the composite liner, and gauge #5 was set at the standoff of 1.0 CD.
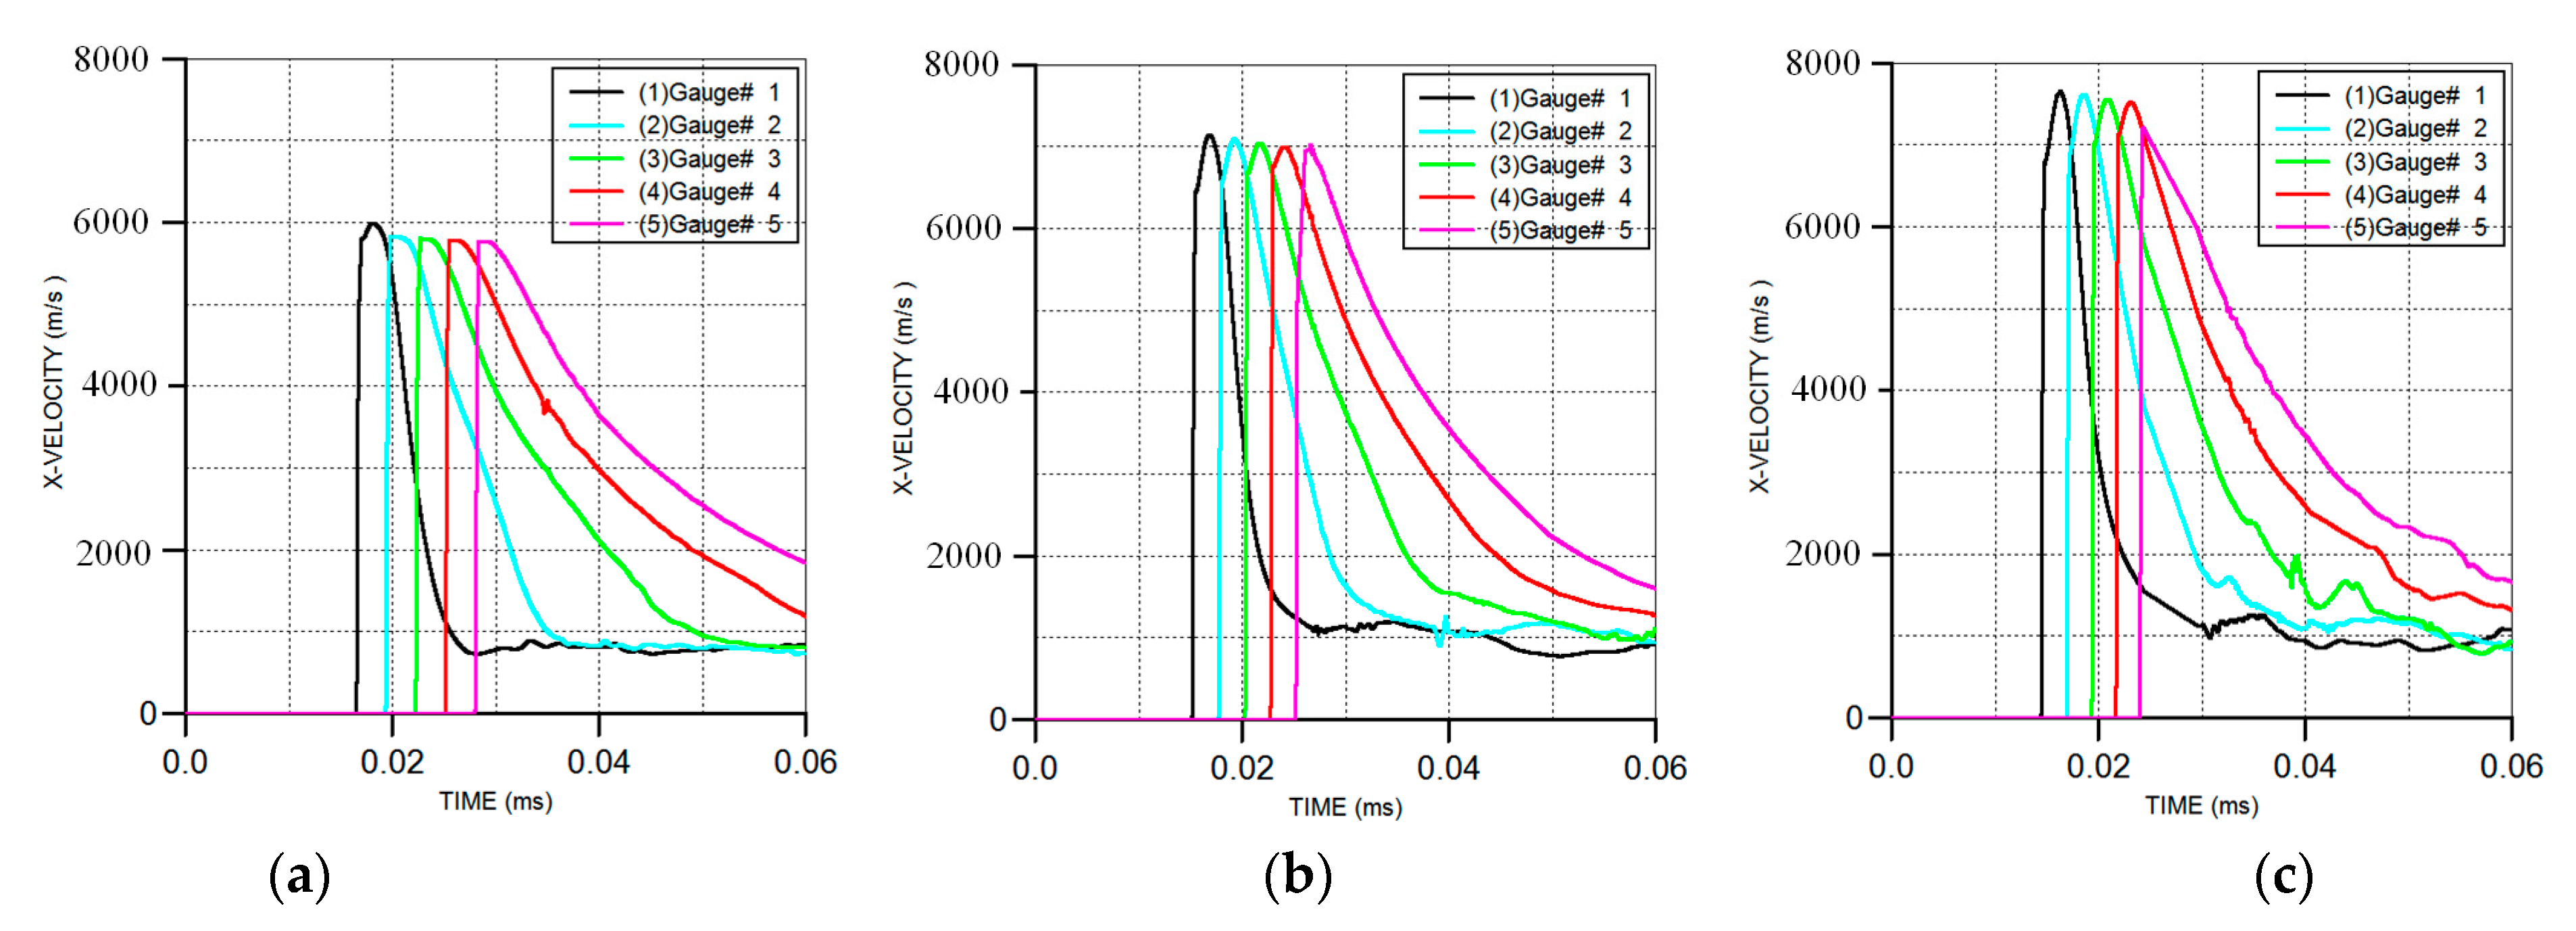
The influence of the metal liner material on the velocity–time curves of the composite jets is shown in
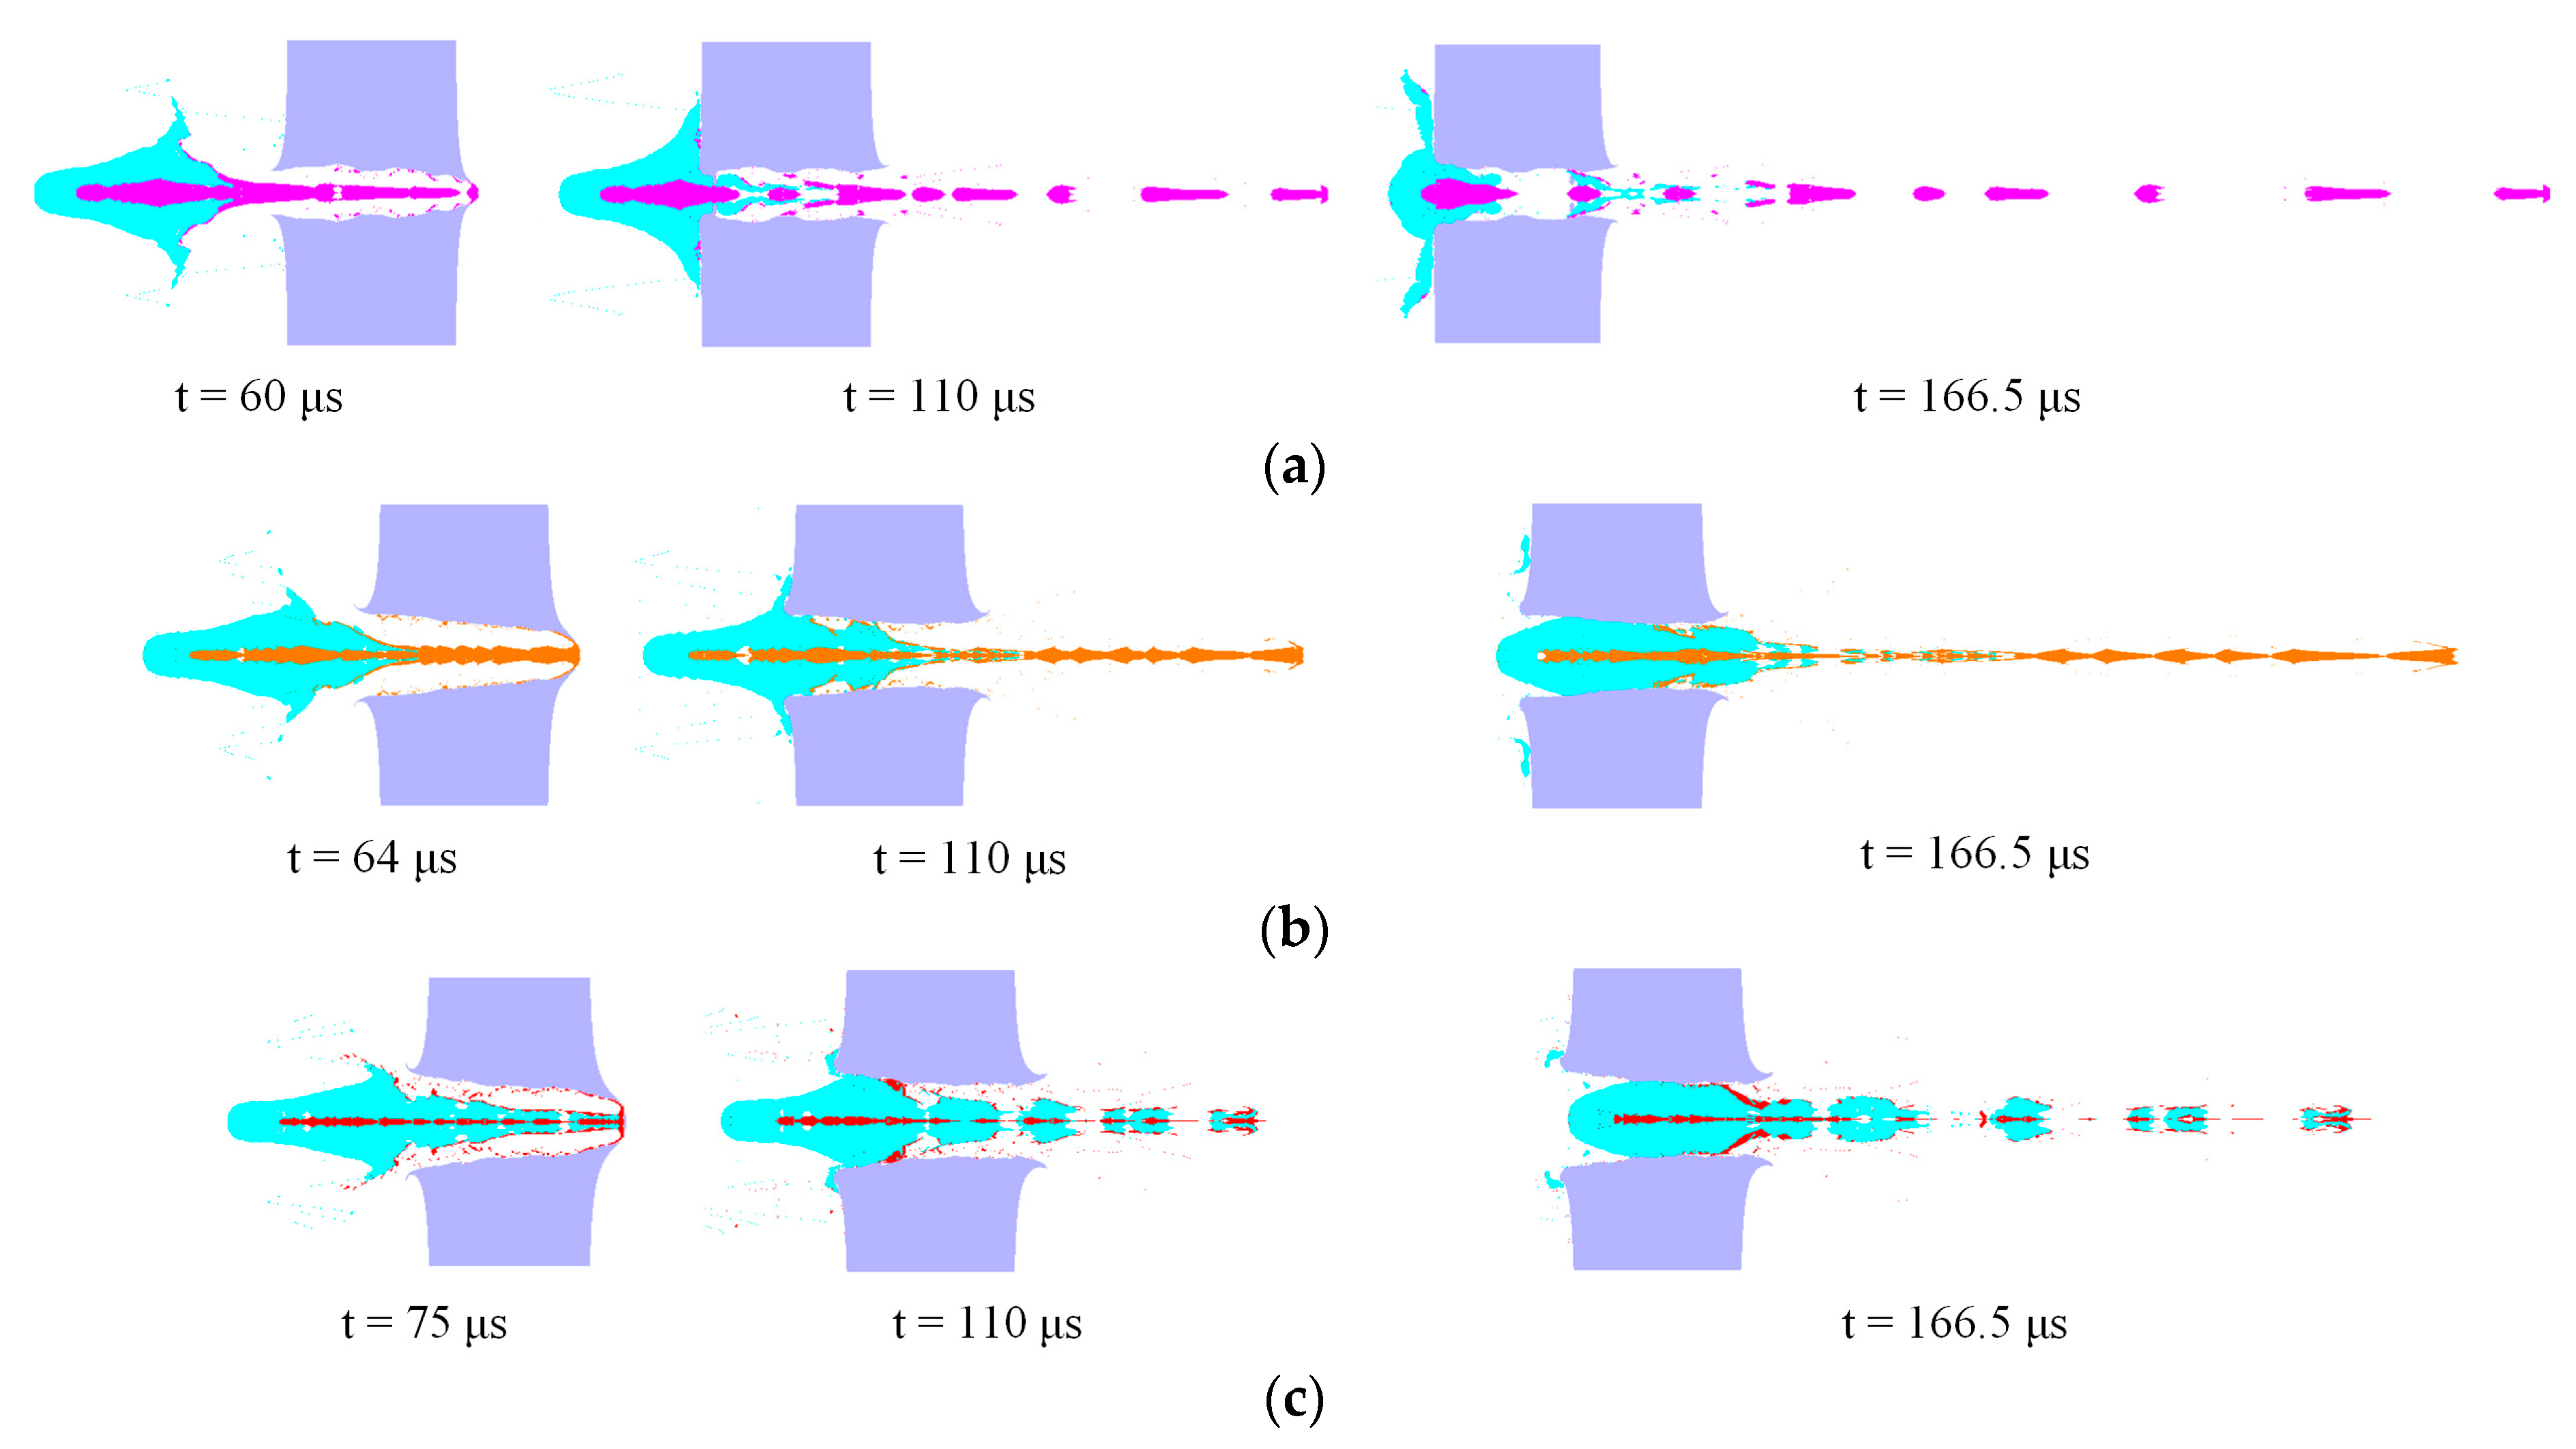
Figure 9. The formation morphology of the three kinds of reactive material composite jets before impacting the targets is shown in
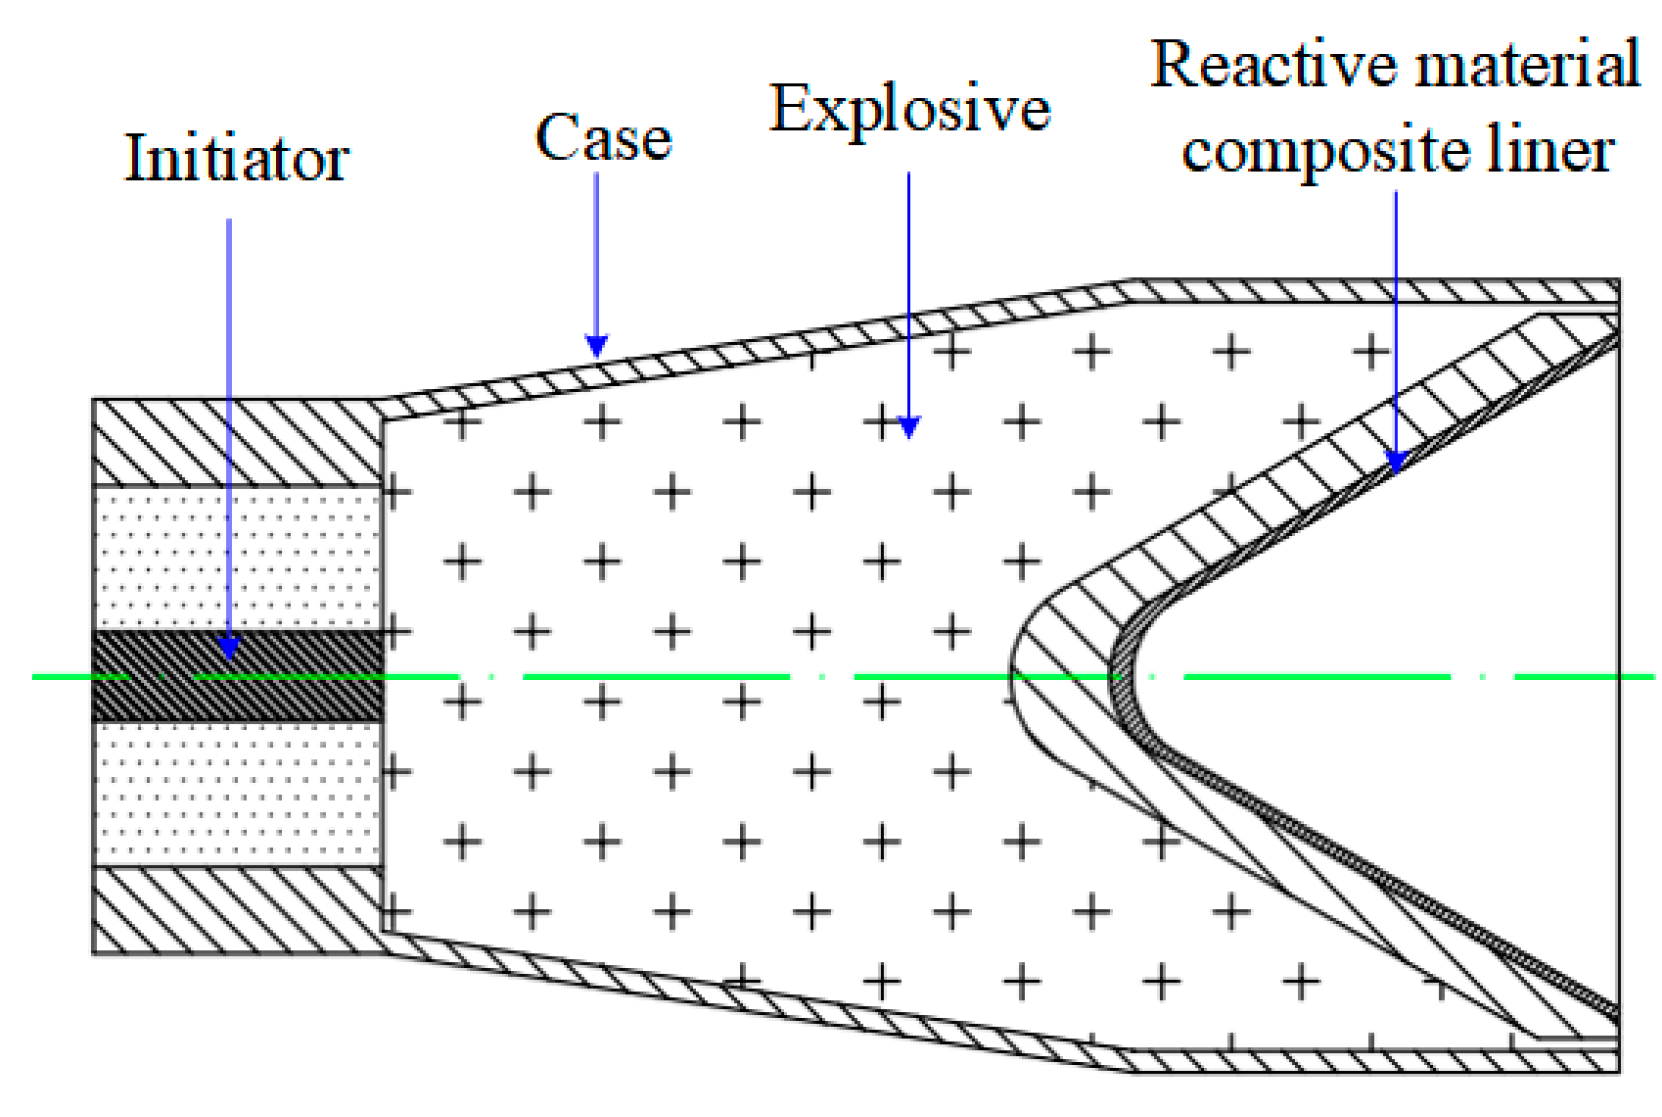
Figure 10. Although the materials of the inner metal liner were different, the morphology of the reactive material composite jets formed by the three kinds of SCs was similar. The inner metal liner mainly formed the high-velocity jet, and the outer reactive material liner became the main part of the slug. From the mechanism analysis, during the movement of the liner elements towards the axis, the detonation energy was concentrated from the outer liner to the inner liner, and the closer to the axis of symmetry, the faster the energy concentration. When moving near the axis, the elements would widen, owing to the pressure near the inner surface increasing sharply, and its movement direction would change, which finally caused the inner metal liner to become a high-velocity jet moving along the axis, as shown in
Figure 11.
According to the simulation results, the performance parameters of the three kinds of reactive material composite jets are listed in
Table 5, where
vj,1 and
vj,5 are the jet velocity at gauges #1 and #5, respectively,
dm,j is the maximum diameter of the jet head and
Lj and
Lj,m are the whole length of the composite jet and the length of the metal jet, respectively. The numerical results showed that
vj,1 and
vj,5 increased gradually as the material of the metal liner changed from Cu to Ti and Al. This was mainly because, for the SC with the same structure, the tip velocity of the jet was inversely proportional to the density of the composite liner. Compared with the reactive material–Cu jet velocity (
vj,5-Cu), the jet velocity values of
vj,5-Ti and
vj,5-Al increased by 18.2% and 25.1%, respectively. In addition, by comparing the velocity of the reactive material–Ti jet with that of the reactive material–Al jet,
vj,1-Al was approximately 7.2% higher than
vj,1-Ti, while
vj,5-Al was only approximately 5.8% higher than
vj,5-Ti. This phenomenon showed that the tip velocity of the reactive material–Al jet was greatly affected by the standoff. Specifically, when the standoff was 1.0 CD, the
vj,5-Al decreased by approximately 5.7% compared with
vj,1-Al.
As to the diameter of the composite jet before impacting the target, the diameter of the reactive material–Cu jet (dm,j-Cu) was the smallest, and the diameter of the reactive material–Al jet (dm,j-Al) was the largest. The value of dm,j-Al was 10 mm, which was approximately 85.2% and 25% larger than dm,j-Cu and dm,j-Ti, respectively. In terms of the length of the composite jet, the total length of the three composite jets was almost the same. However, the length of the metal jet would drop off gradually with the decrease in the material density of the inner liner. That is, the value of Lj,m-Al was the smallest, which was approximately 9.9% and 5.8% smaller than Lj,m-Cu and Lj,m-Ti, respectively.
Figure 11 also shows that the detonation wave spread gradually from the outer layer of the reactive material liner to the inner layer of the metal liner during the process of jet forming. When the jet head formed (
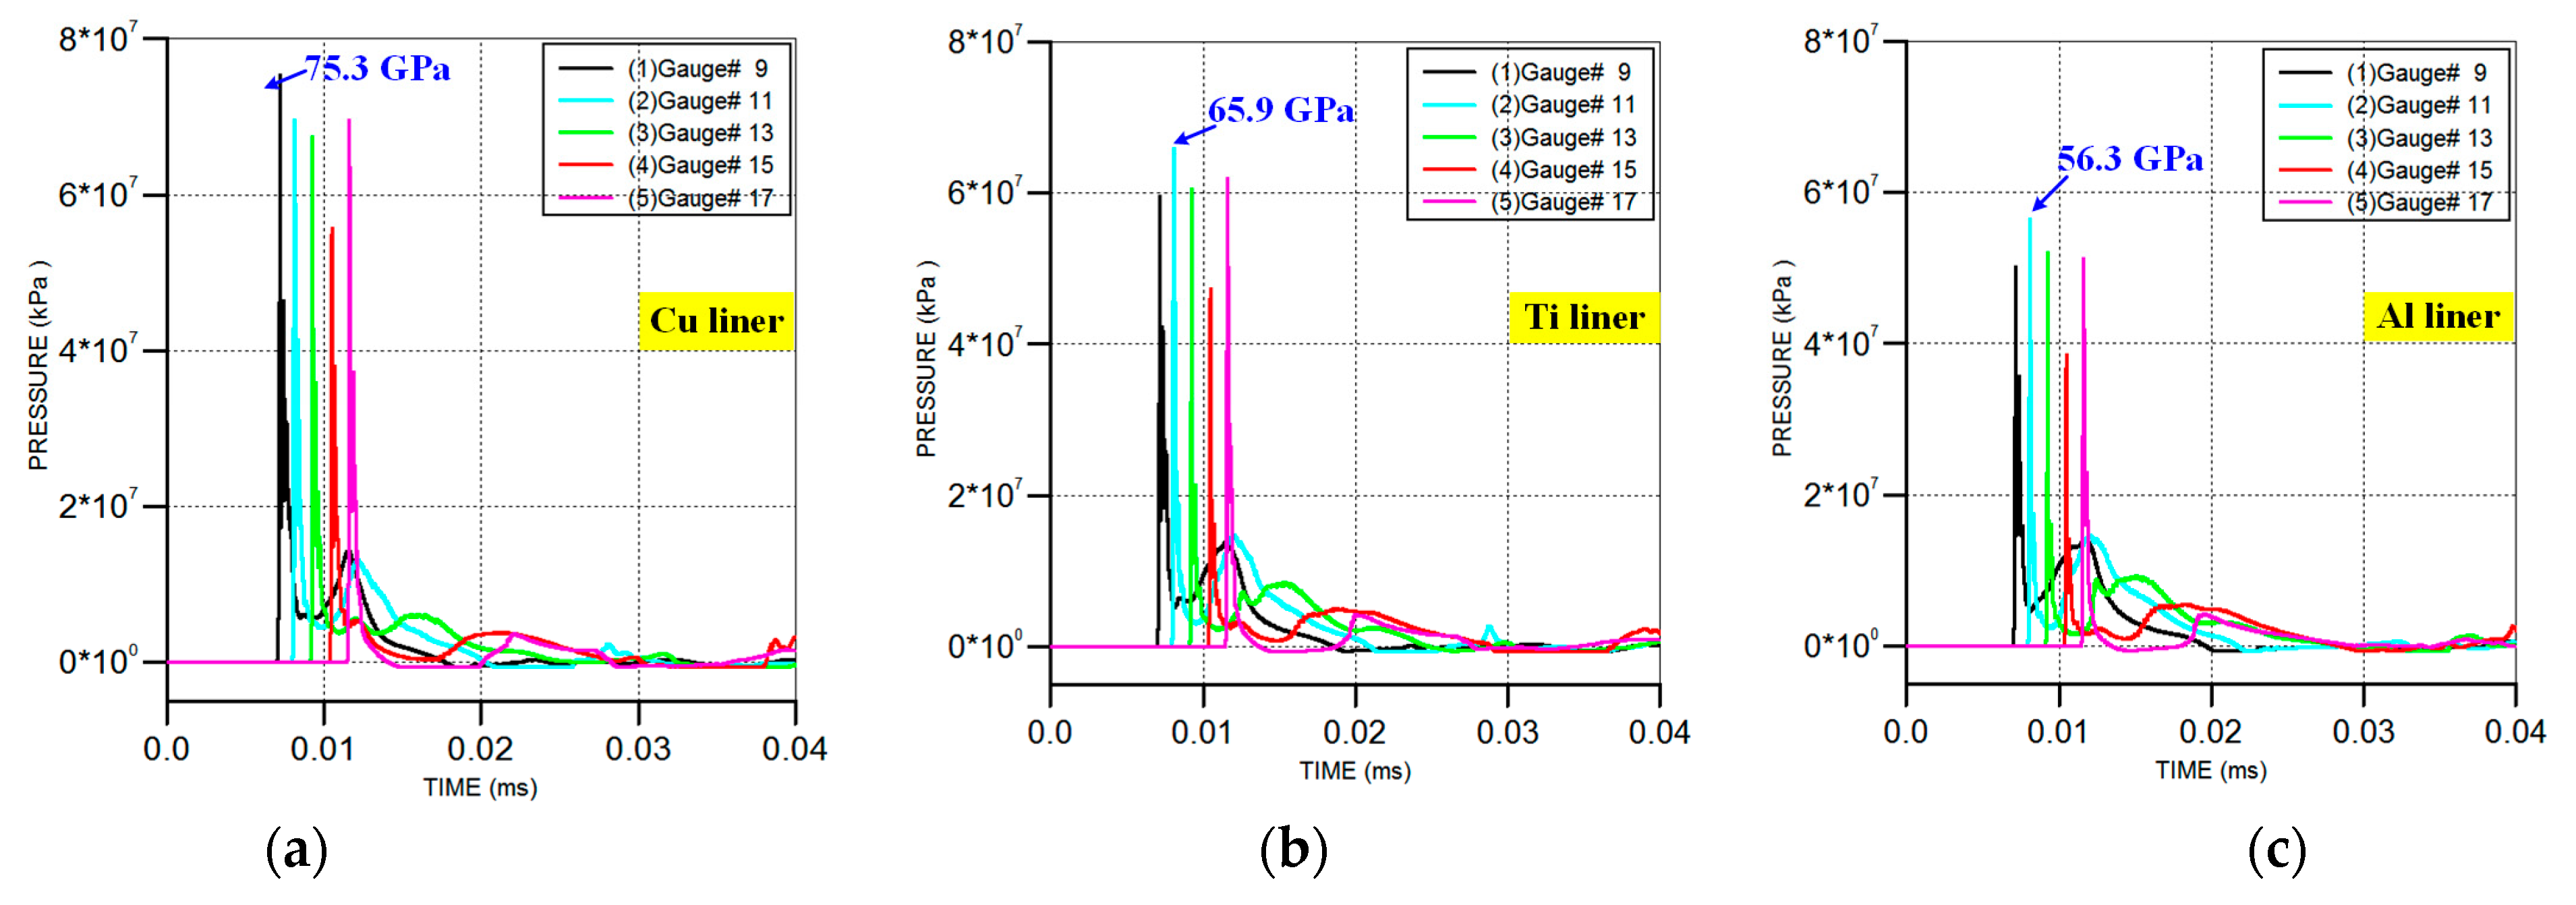
t = 14 µs), a high-pressure zone was produced at the interface between the metal jet and the slug. As the jet head continued to go forward, the high-pressure zone gradually moved to the interface between the two materials. The pressure–time curves of the gauges in the reactive material liner are shown in
Figure 12. It can be seen that there were two pressure peaks at each gauge point. At
t = 7µs, the pressure reached a peak at gauge #9, followed by gauge points 11, 13, 15 and 17. As the material of the metal liner changed from Cu to Ti and Al, the instantaneous peak pressure at the gauge points decreased from 75.3 GPa to 65.9 GPa and 56.3 GPa. At
t = 13µs, the second pressure peak appeared at gauges #9 and #11. However, compared with the first pressure peak, the second peak was significantly lower. Combining
Figure 11, it can be seen that the detonation wave transmitted from the outer layer of the reactive liner to the inner elements, and from the top to the bottom of the liner. As such, the first pressure peak was generated by the explosive detonation wave, while the second peak was generated by the collision between the inner material elements of the reactive liner and the metal ones. The pressure generated by the collision was much lower than that of the explosion. As the jet forming entered a stable state, the pressure at these gauge points gradually decreased and tended to fall to zero.
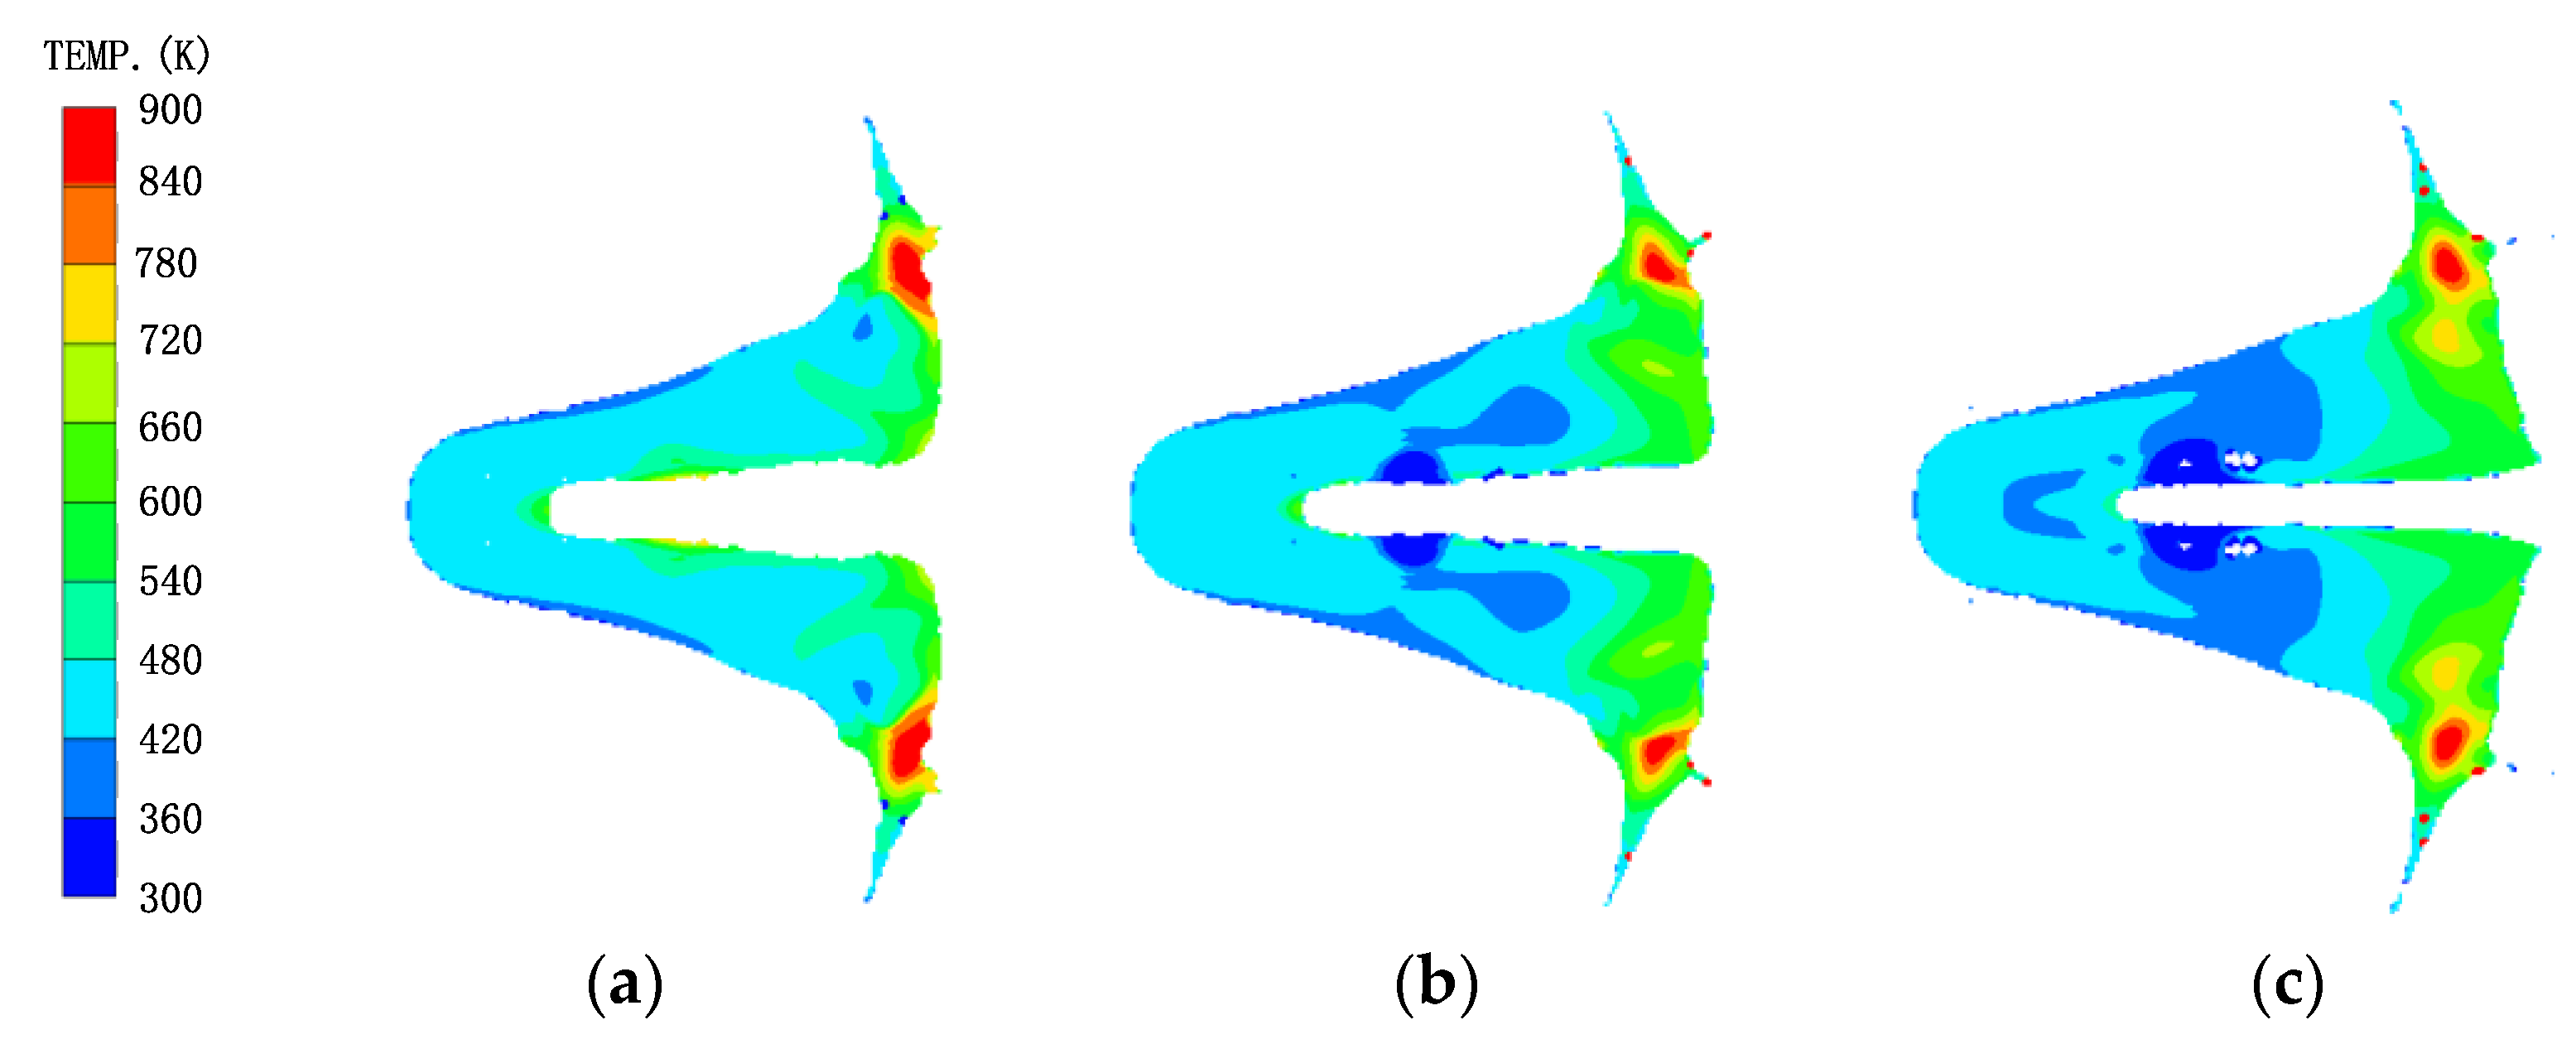
Under the effect of the high-pressure detonation wave, the reactive material liner was be crushed and gradually formed the main part of the slug. The detonation wave propagation and the plastic deformation of the reactive material liner would cause the temperature rise effect [
20]. When the jet head reached the standoff of 1.0 CD, the temperature distribution of the slug formed by the reactive material liner is shown in
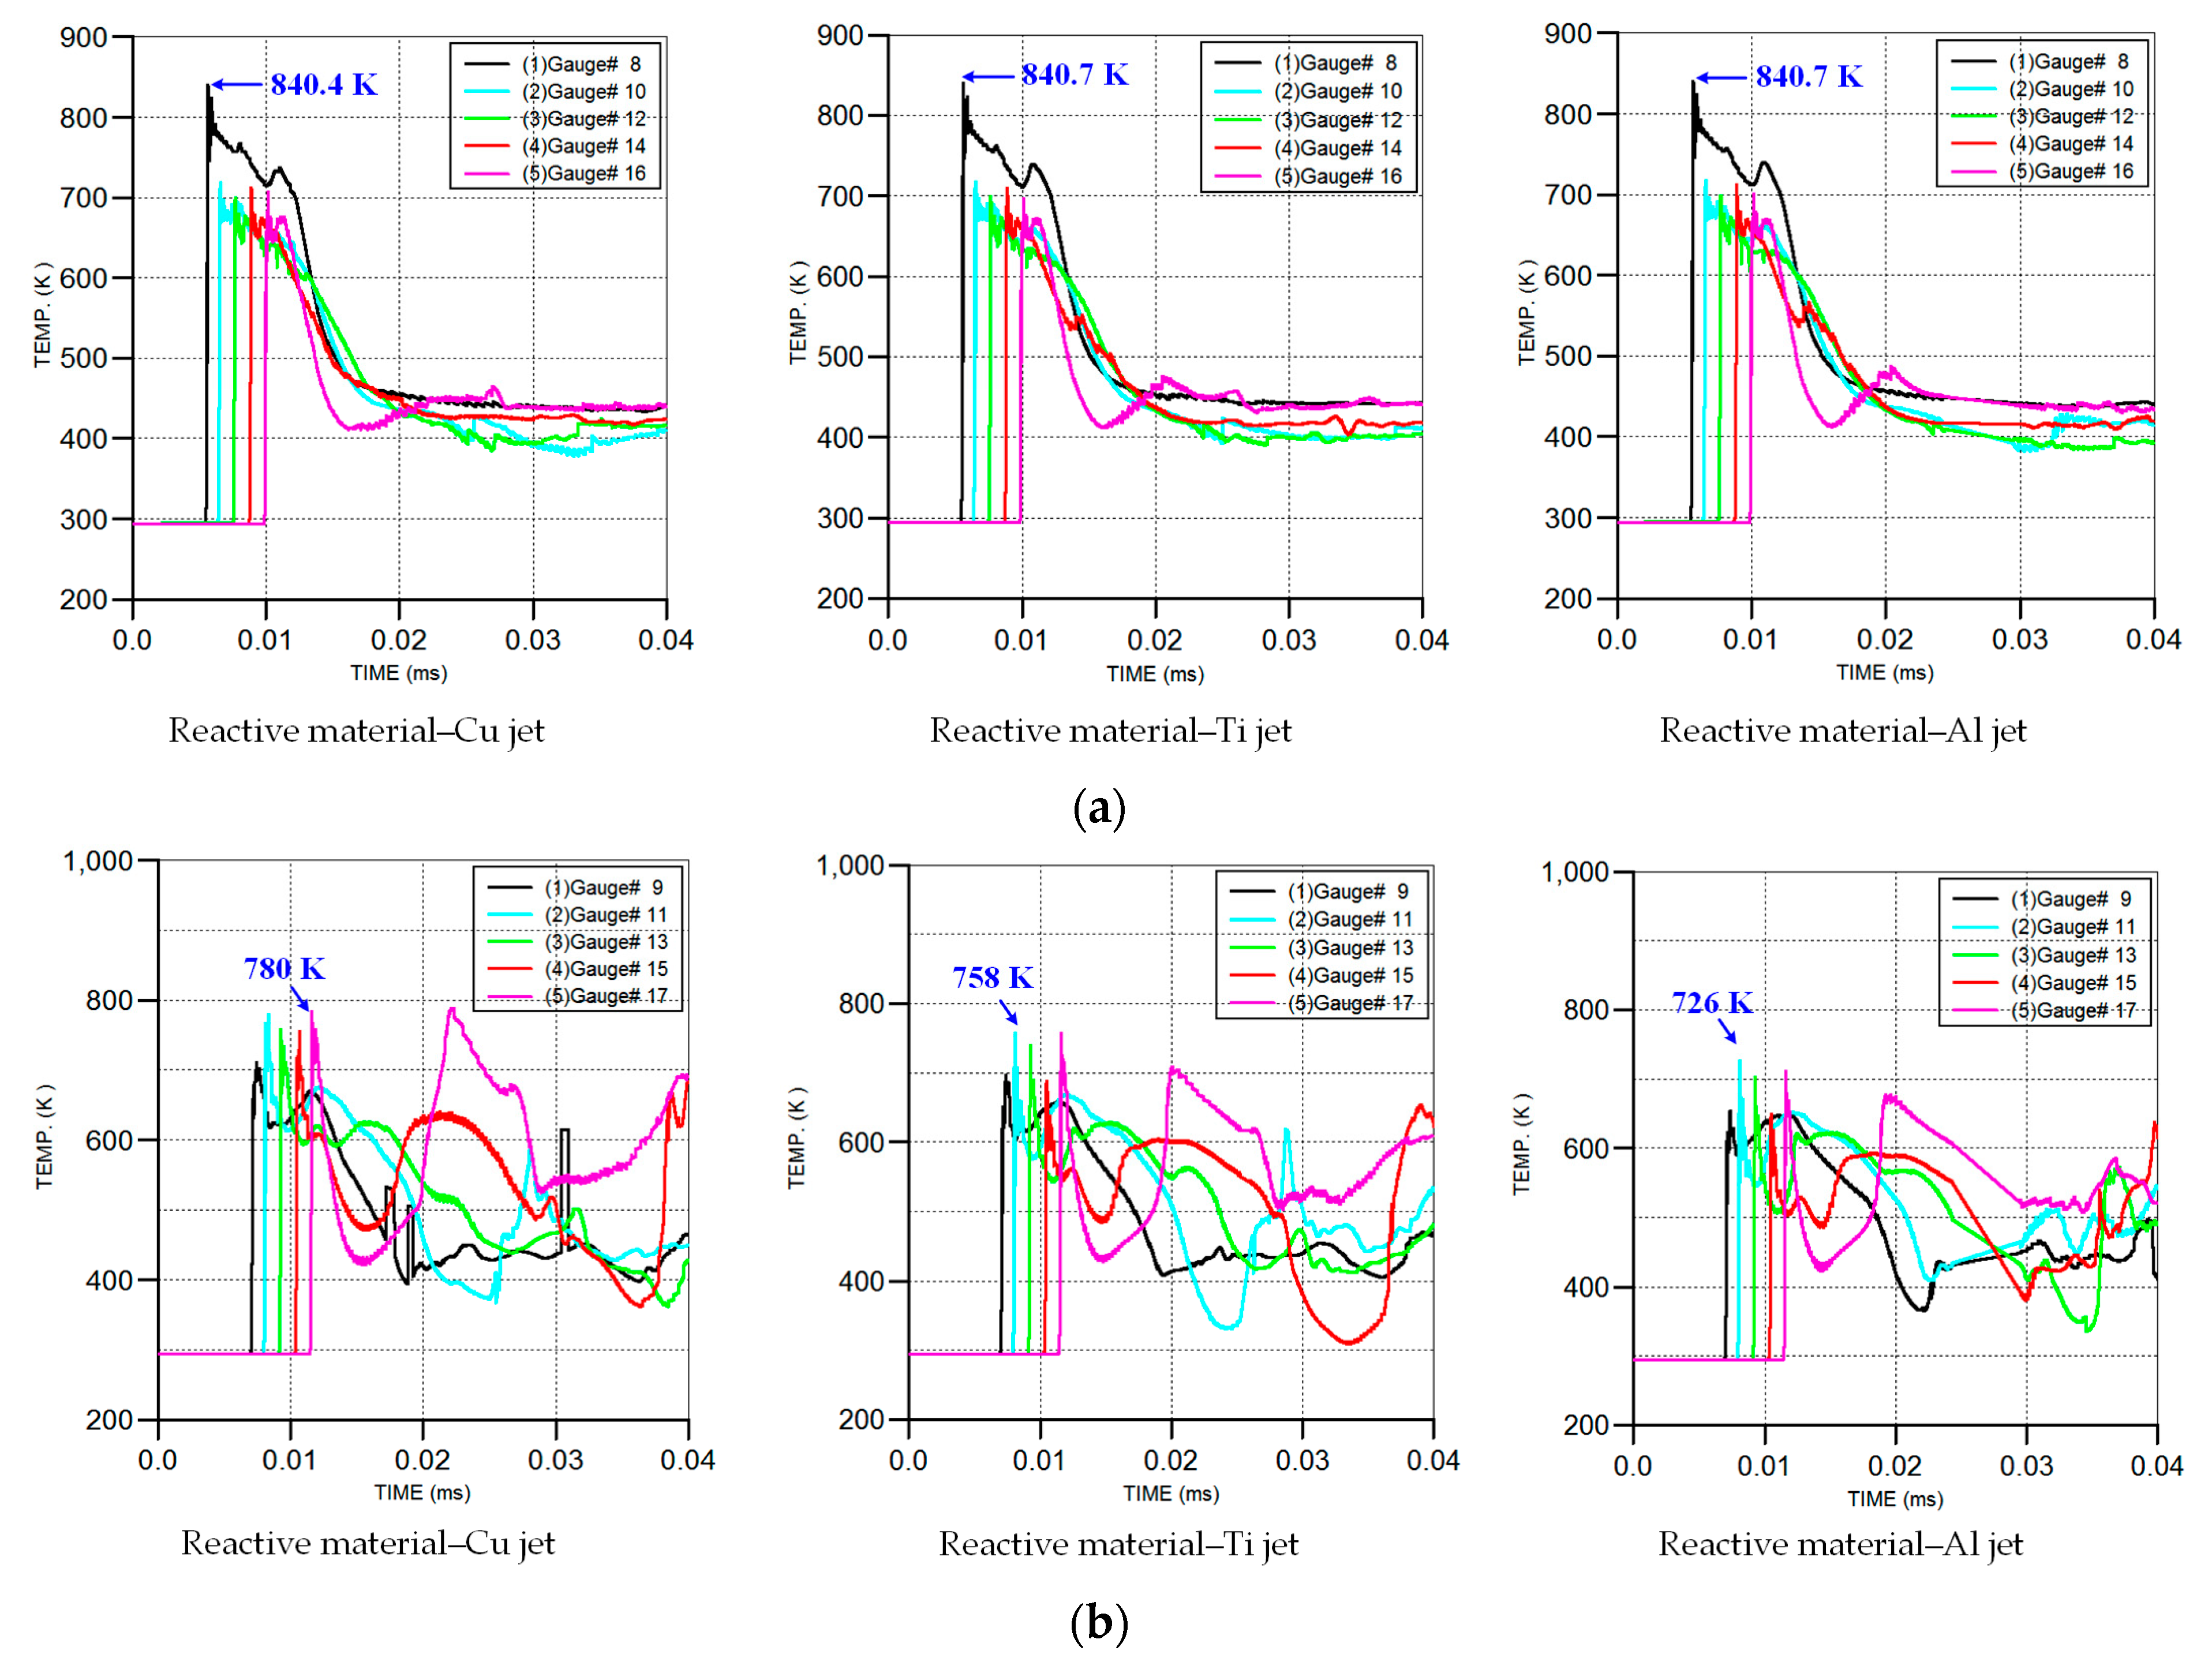
Figure 13. The temperature–time curves of the gauge point settings on the outer and inner layers of the reactive material liner are shown in
Figure 14.
Figure 14a shows that the temperature peak first appeared at gauge #8 on the outer layer of the reactive liner, and then at gauge points 10, 12, 14 and 16. Under the three conditions, the peak temperature at gauge #8 was approximately 840 K, and there was little difference between the peak temperature at other gauge points. This was mainly because of the same structure of the shaped charges; that is, the outer layer elements of the reactive liner were subjected to the same explosive detonation wave, resulting in almost no difference in the temperature rise of these elements. Compared with
Figure 14a, the temperature peaks at several gauge points in the inner layer of the reactive liner in
Figure 14b occurred two or more times. This was mainly because the temperature rise in the inner elements of the reactive liner was mainly composed of three parts: one was the temperature rise caused by the explosive detonation wave, the second was that caused by the plastic deformation and the third was that caused by the collision and extrusion between the inner elements of the reactive liner and the metal liner elements. When the metal liner changed from Cu to Ti and Al, the instantaneous peak temperature of the gauges decreased from 780 K to 758 K and 726 K, respectively.
Meanwhile,
Figure 13 also shows that the temperature of the majority of the reactive material elements was below 700 K, while only some elements at the two wings of the slug were more than 900 K. In fact, the material elements of the PTFE/Al liner could be activated under the detonation wave of the SC, but only when the temperature of the PTFE-based rose to approximately 900 K and decomposed enough oxidant C
2F
4 could the Al particles experience a violent detonation-like reaction with the released oxidant [
12,
31]. As such, the elements at the two wings of the slug may have had a chemical reaction during the process of jet forming and penetration. However, it was difficult to cause the overall reaction of the reactive materials due to their small mass.
These phenomena further verified that the chemical reaction of the PTFE/Al liner material was negligible when time
t <
τ. The time interval between the initiation of the SC and the violent detonation-like reaction is generally called the reaction delay time, and the chemical reaction behavior can be ignored in the time range [
17]. In addition, the reaction delay time
τ was not only affected by the particle size and preparation process of the PTFE/Al liner, but also related to the impact pressure and explosive type [
32]. The time
τ could be obtained through relevant experiments. In this paper, the corresponding parameters of the PTFE/Al liner were consistent with that of the reference [
17], and the reaction delay time
τ was approximately 166.5 μs.


