
Failure Criteria and Constitutive Relationship of Lightweight Aggregate Concrete under Triaxial Compression


Abstract
:1. Introduction
2. Experimental Program
2.1. Materials
2.2. Mixing Proportion
2.3. Specimen Fabrication
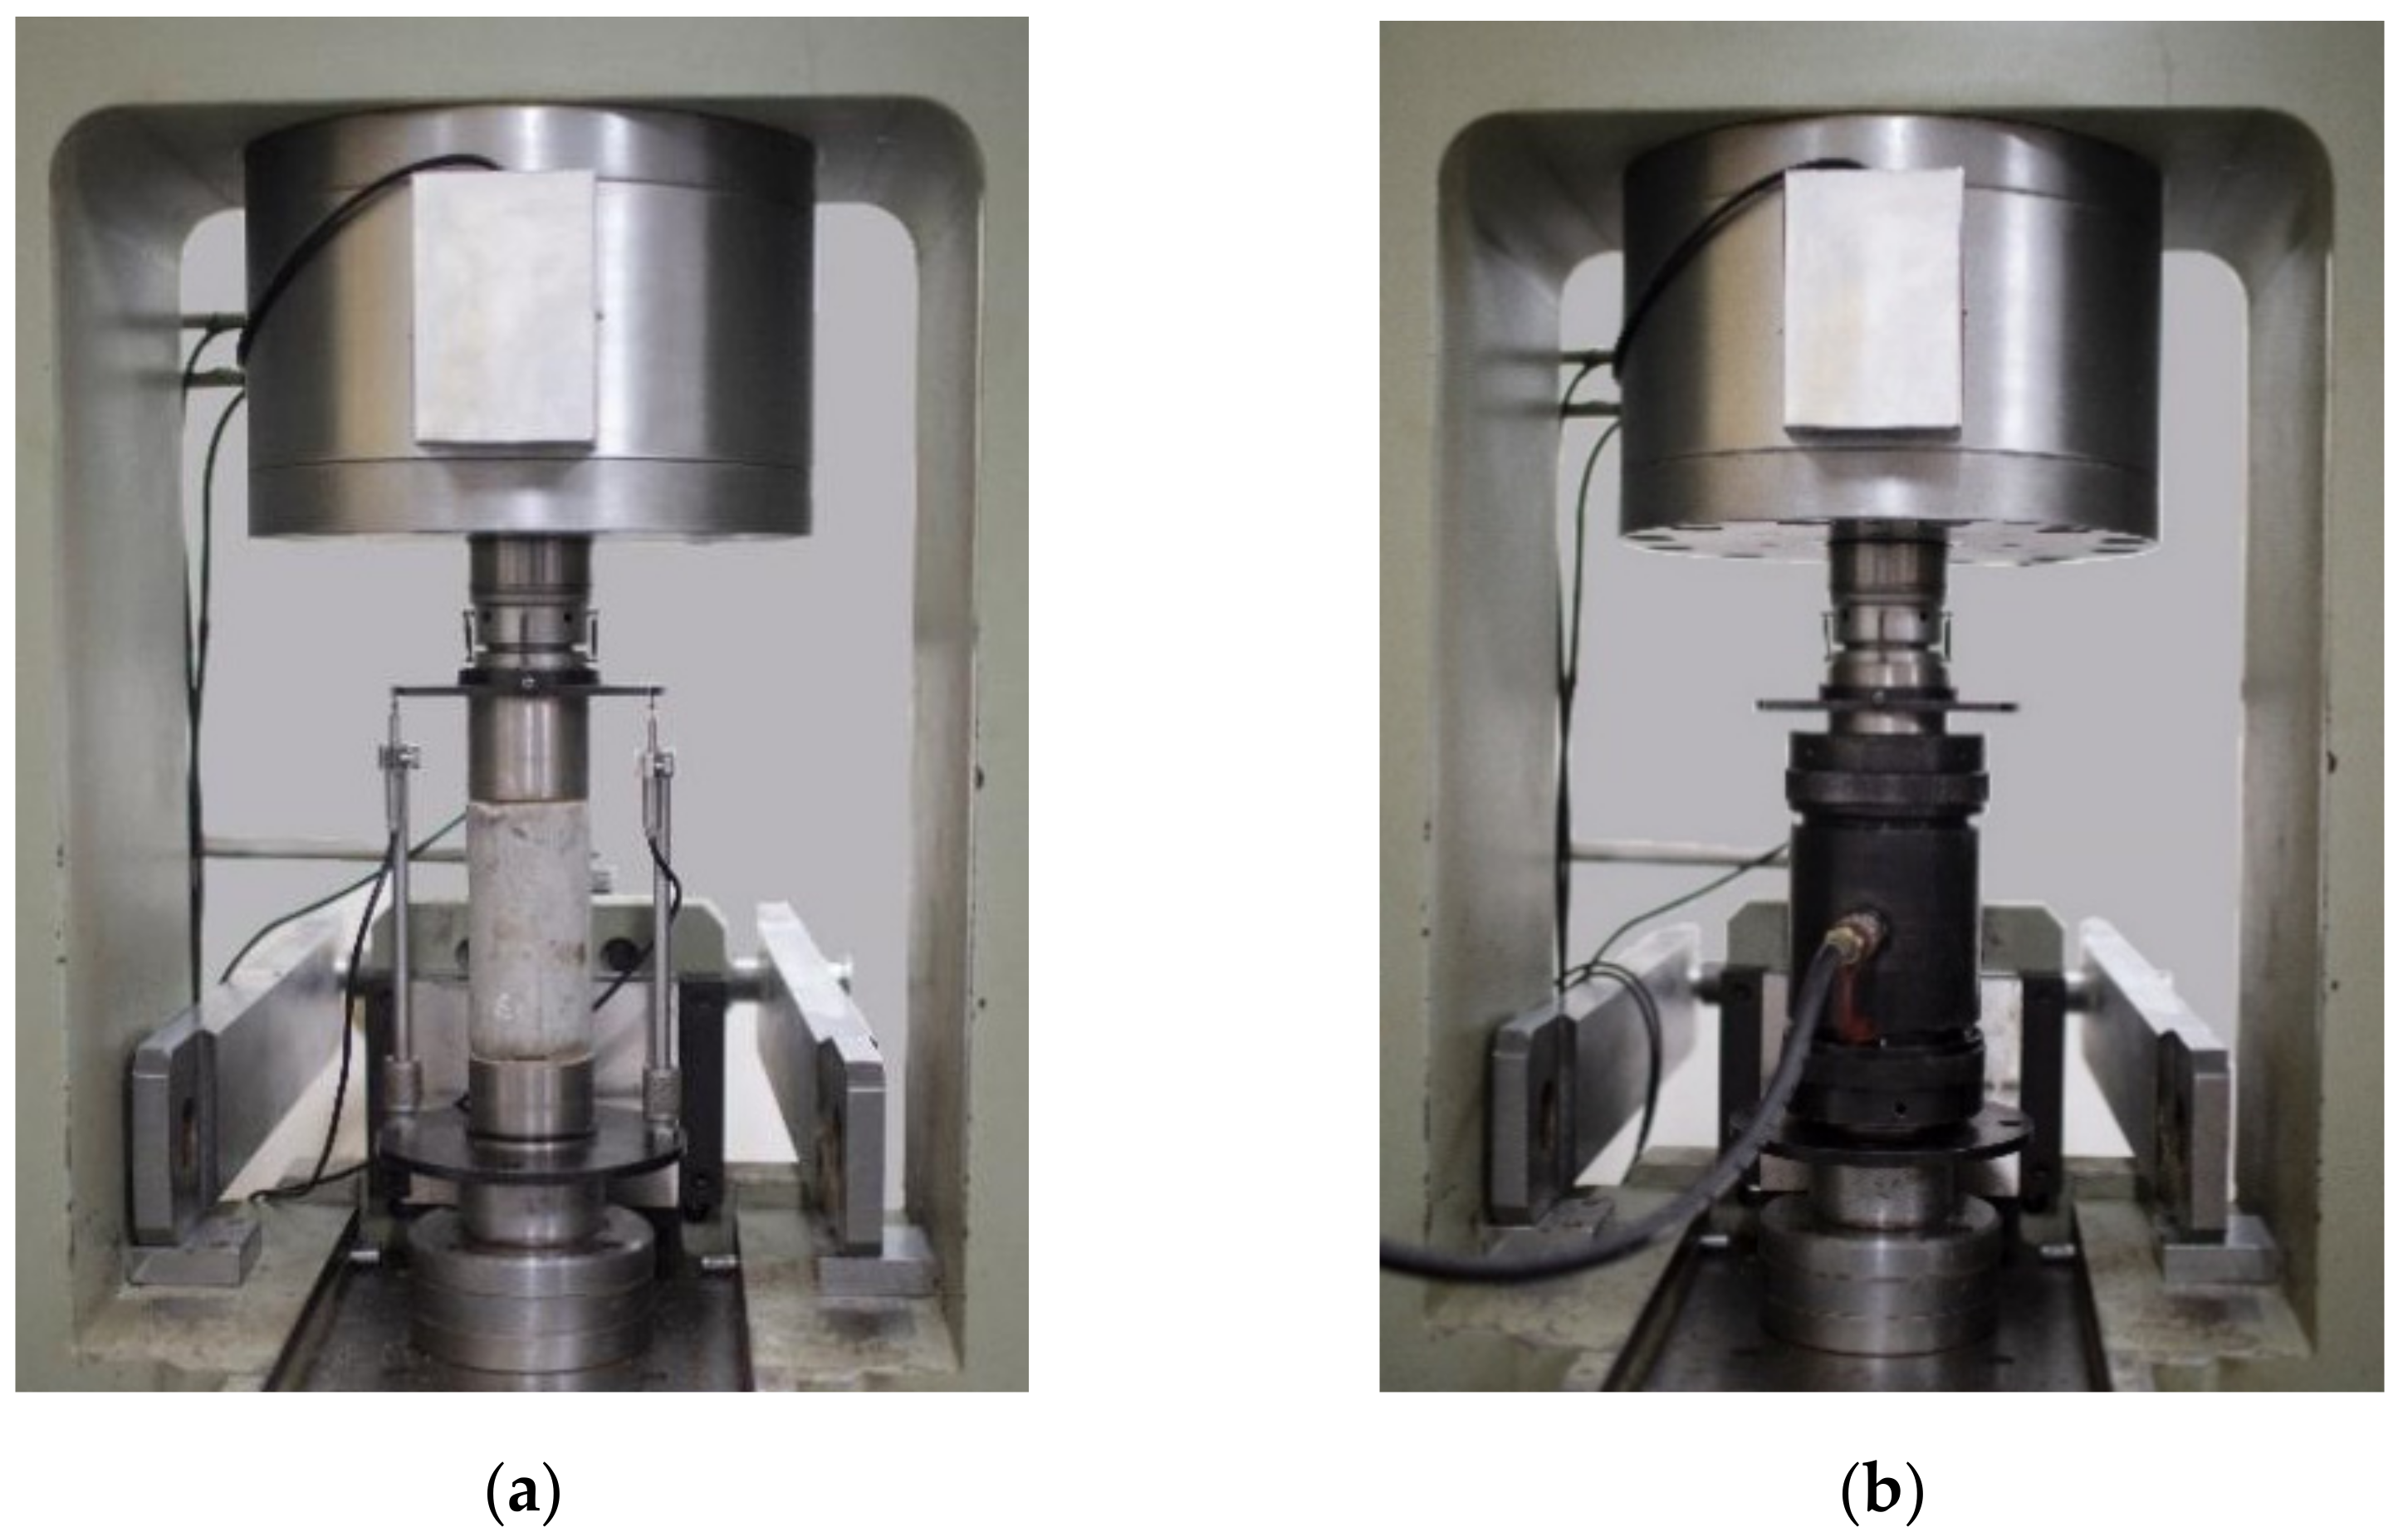
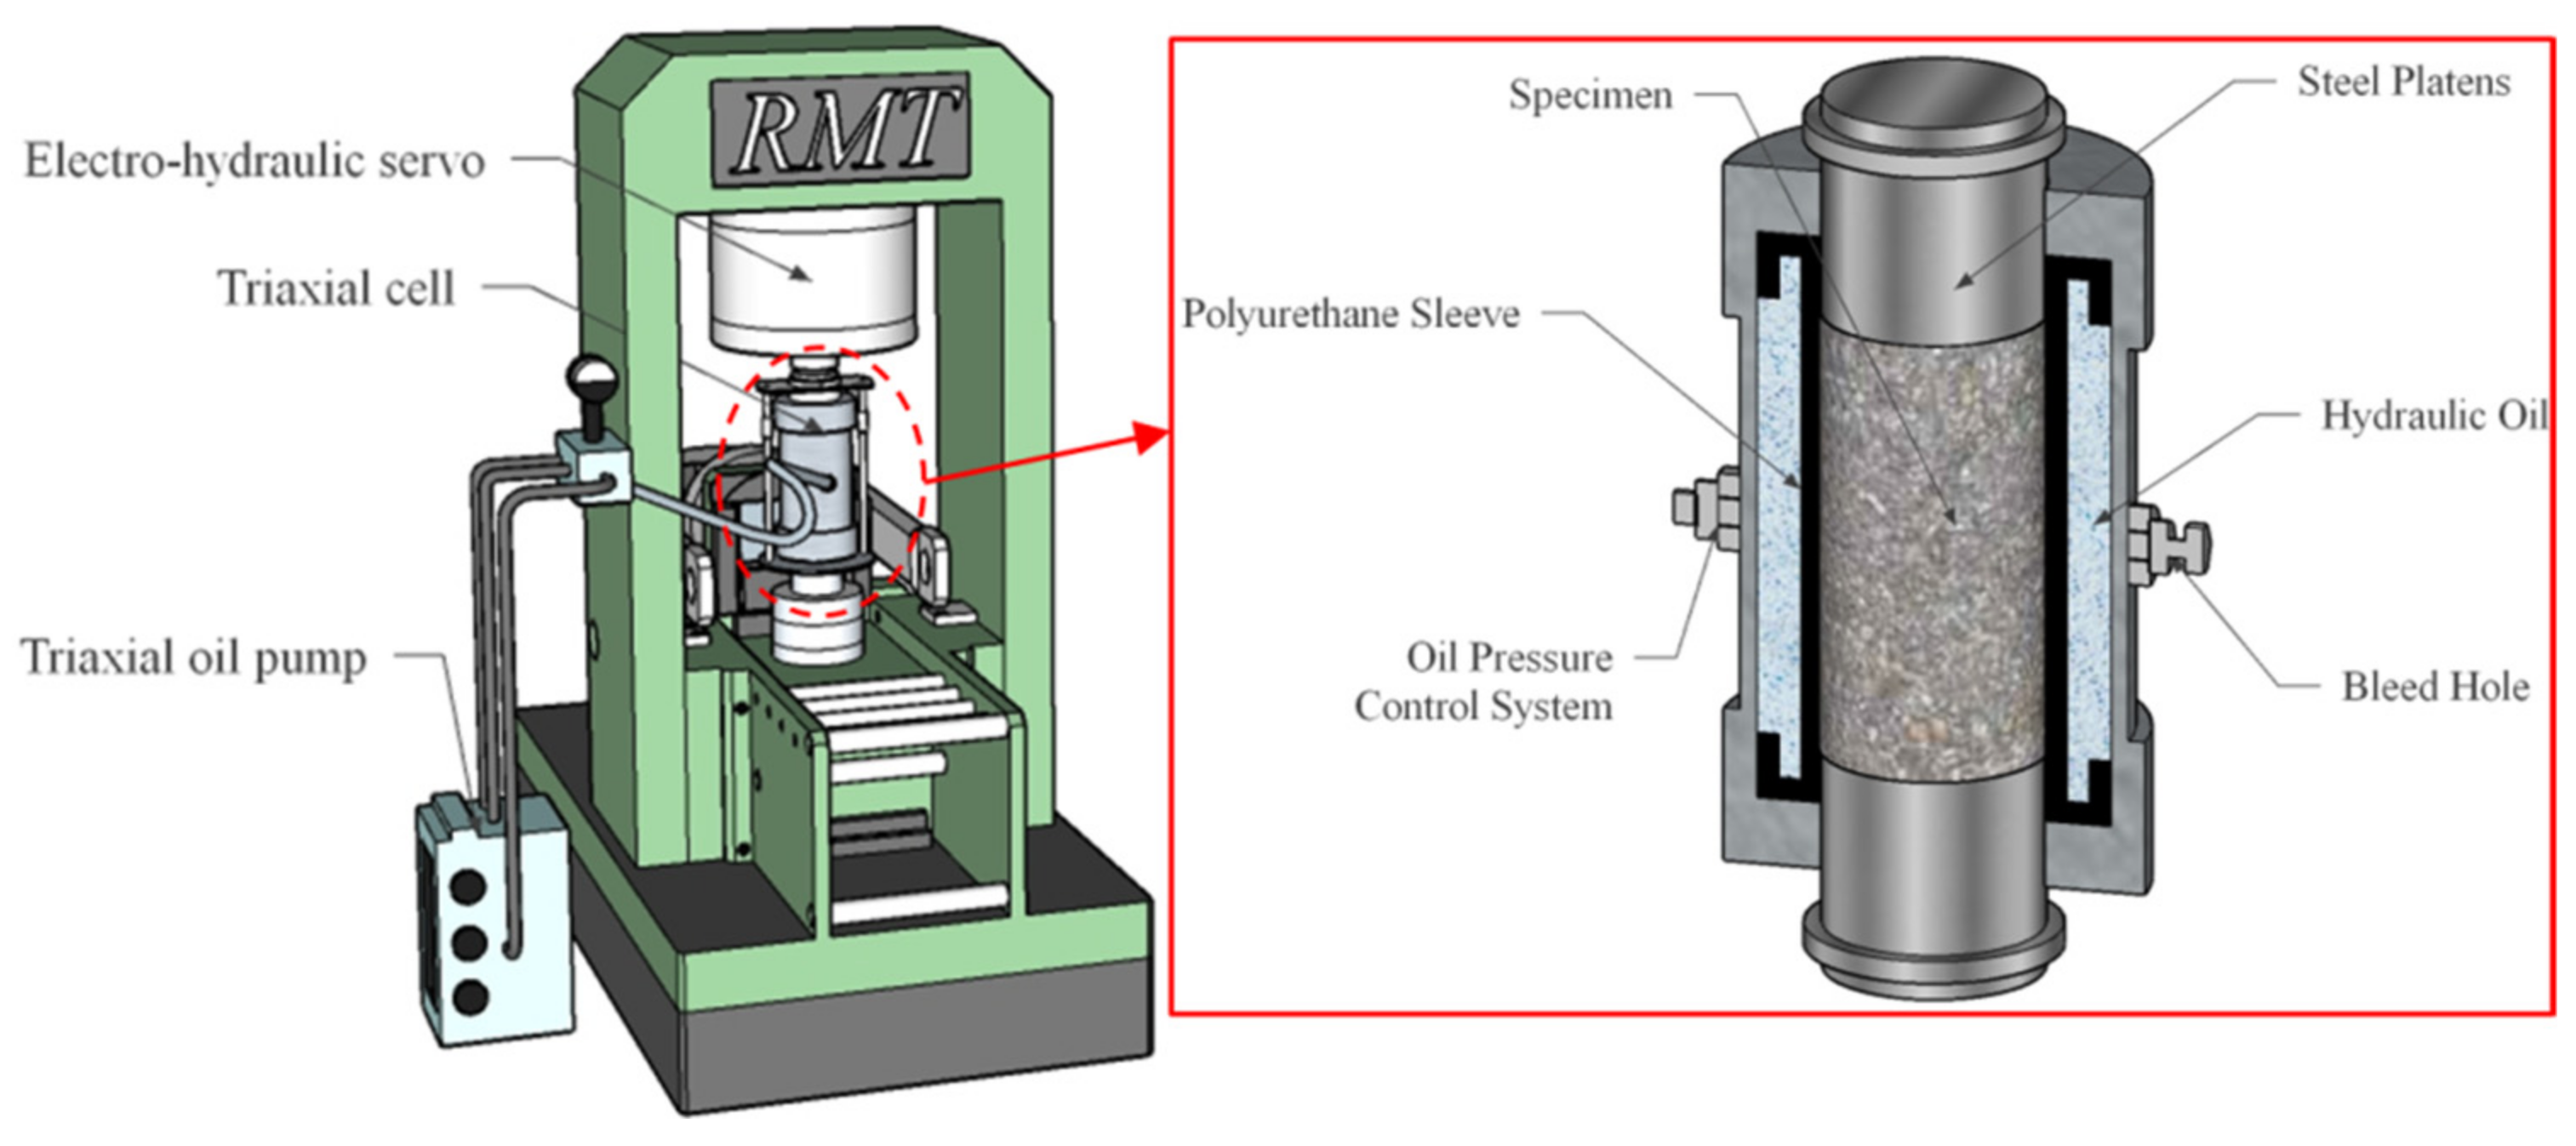
2.4. Mechanical Test Equipment
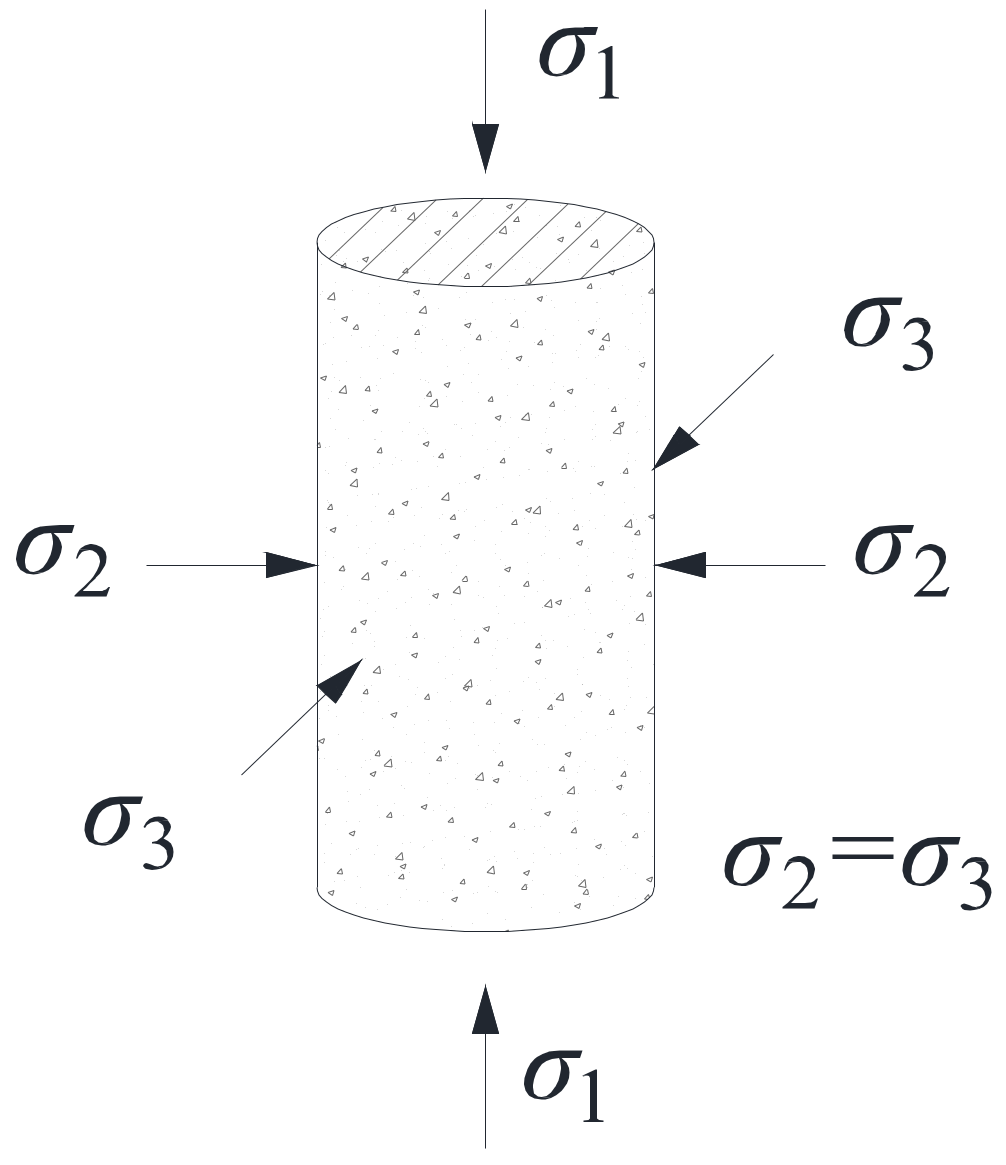
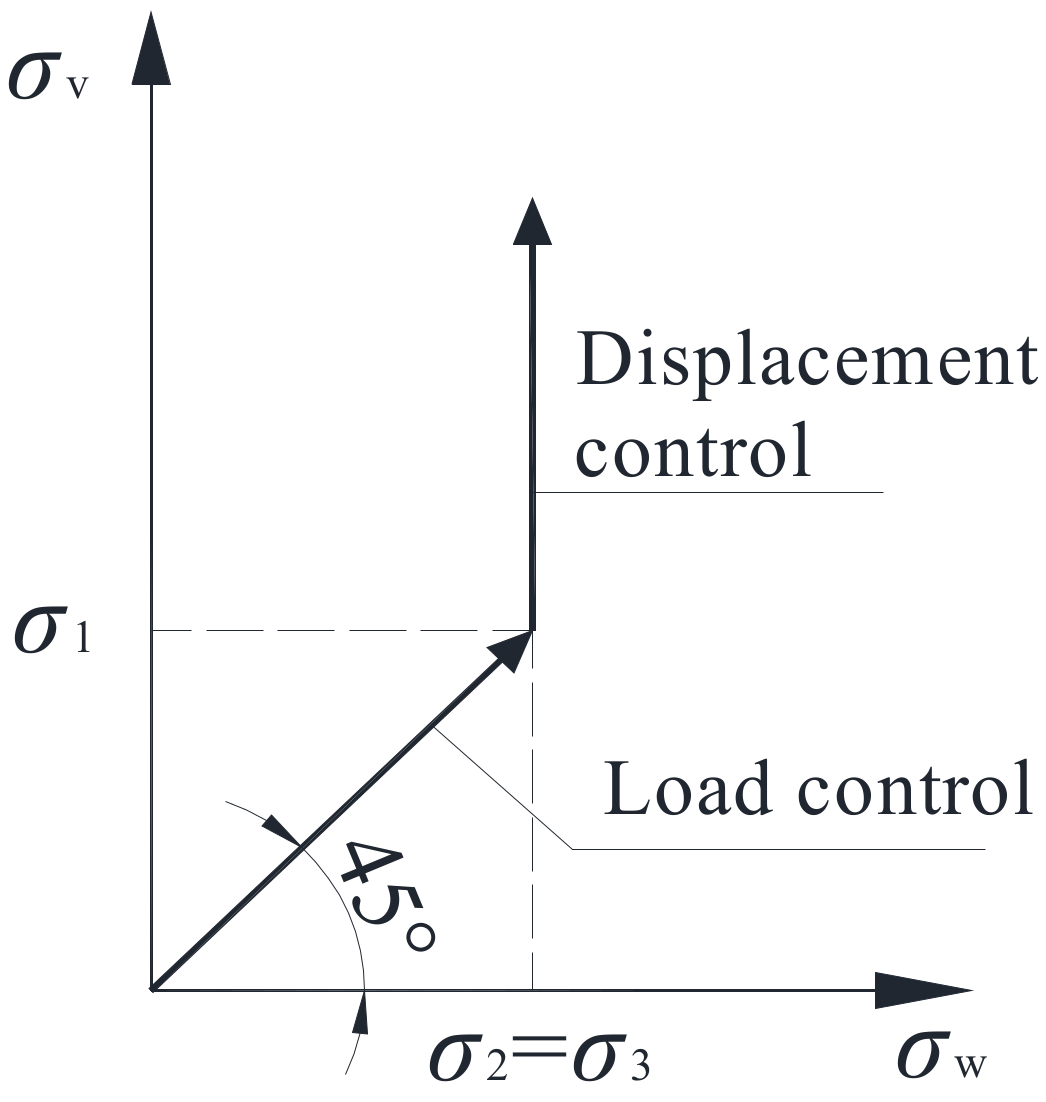
2.5. Loading Protocol
3. Results and Discussion
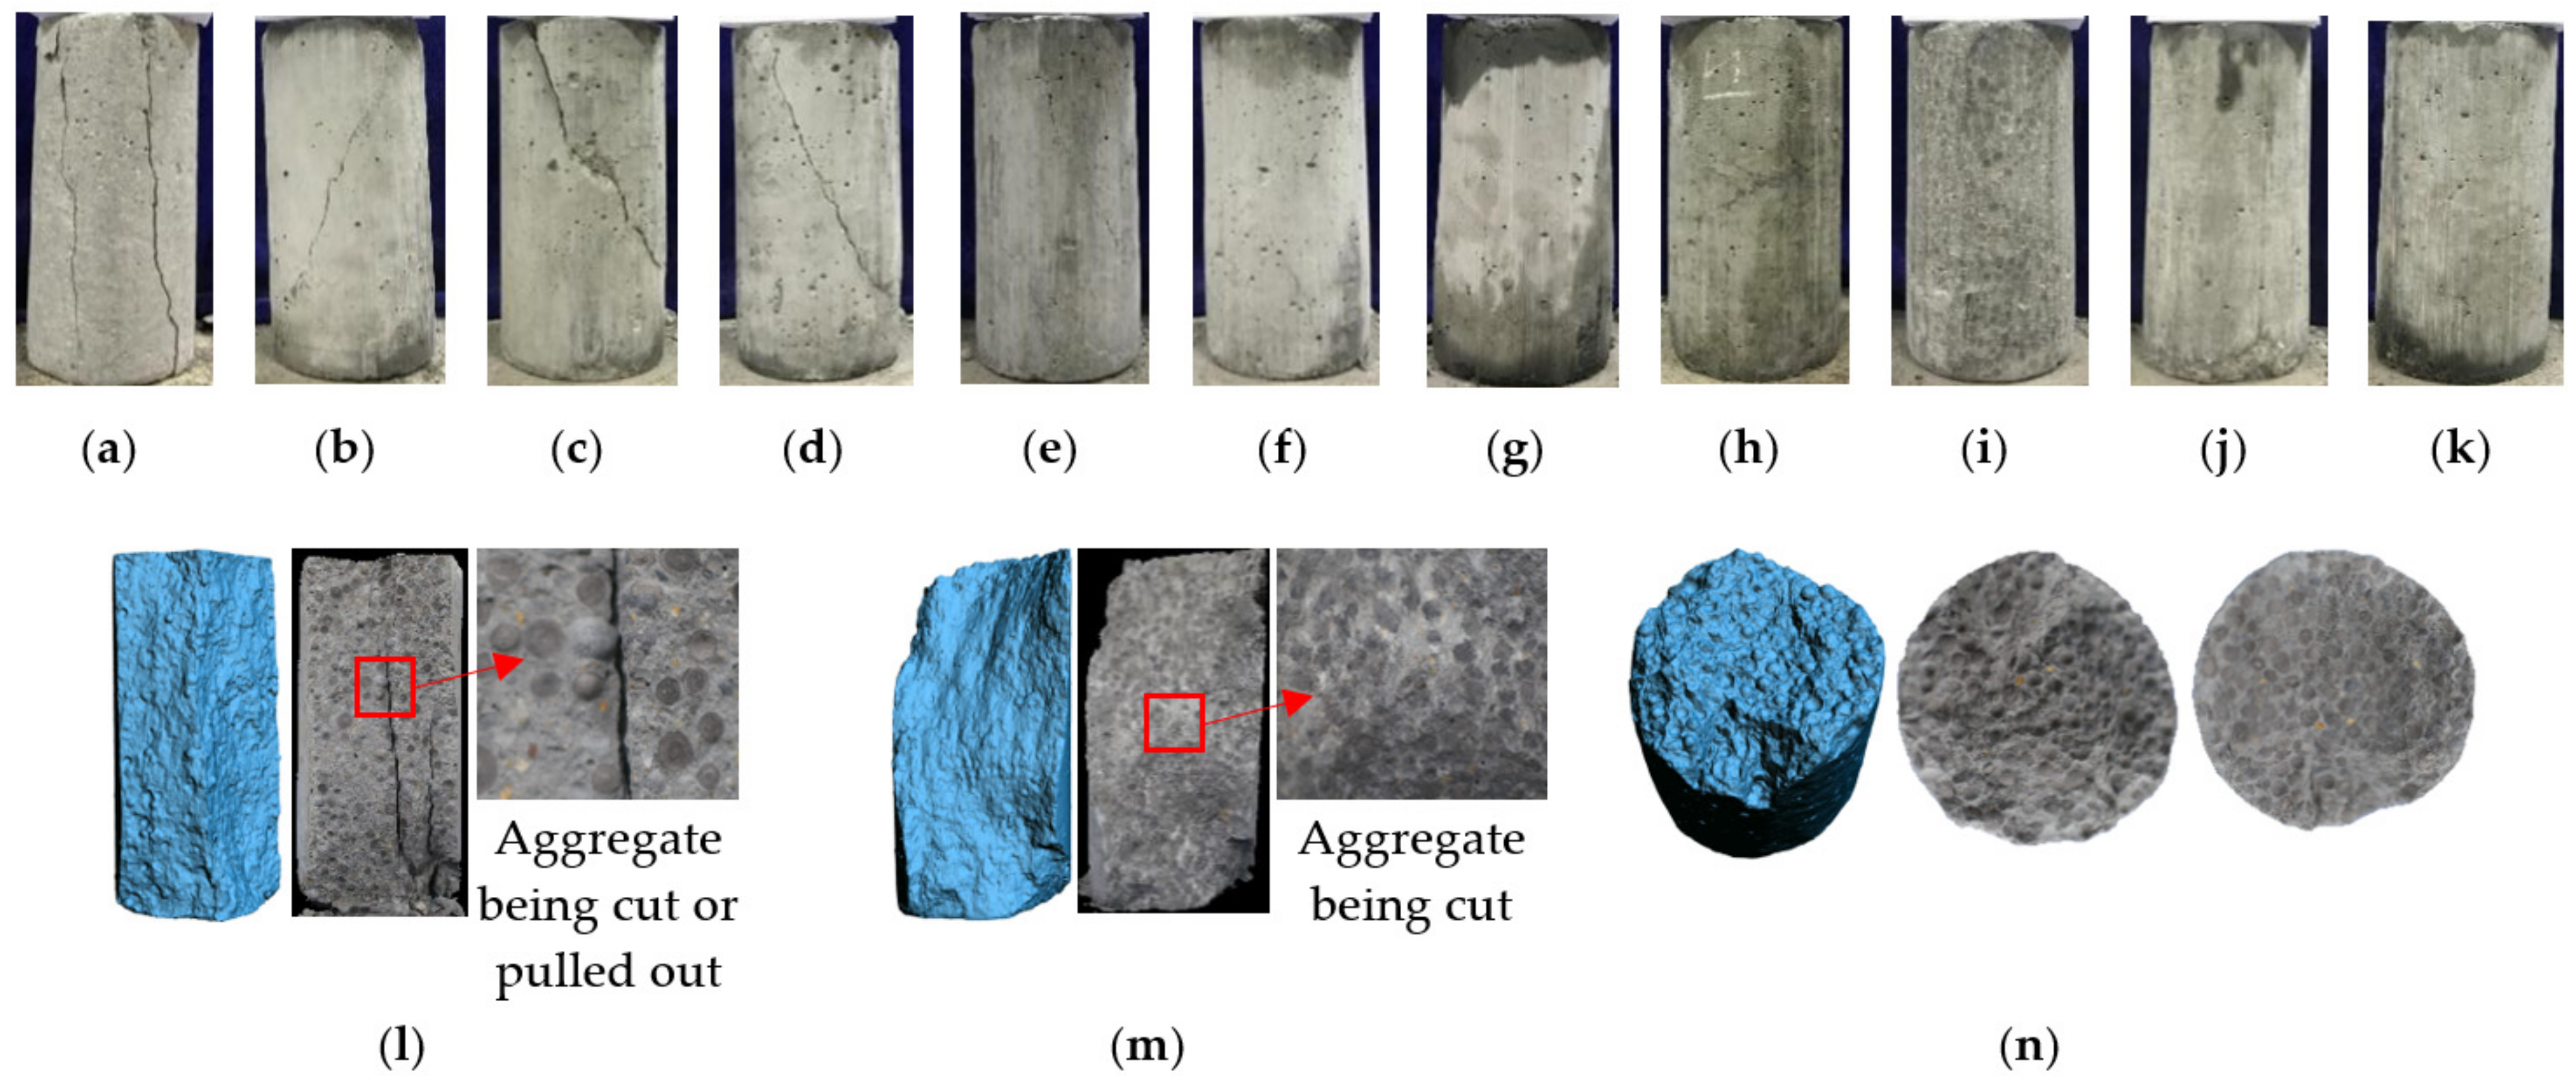
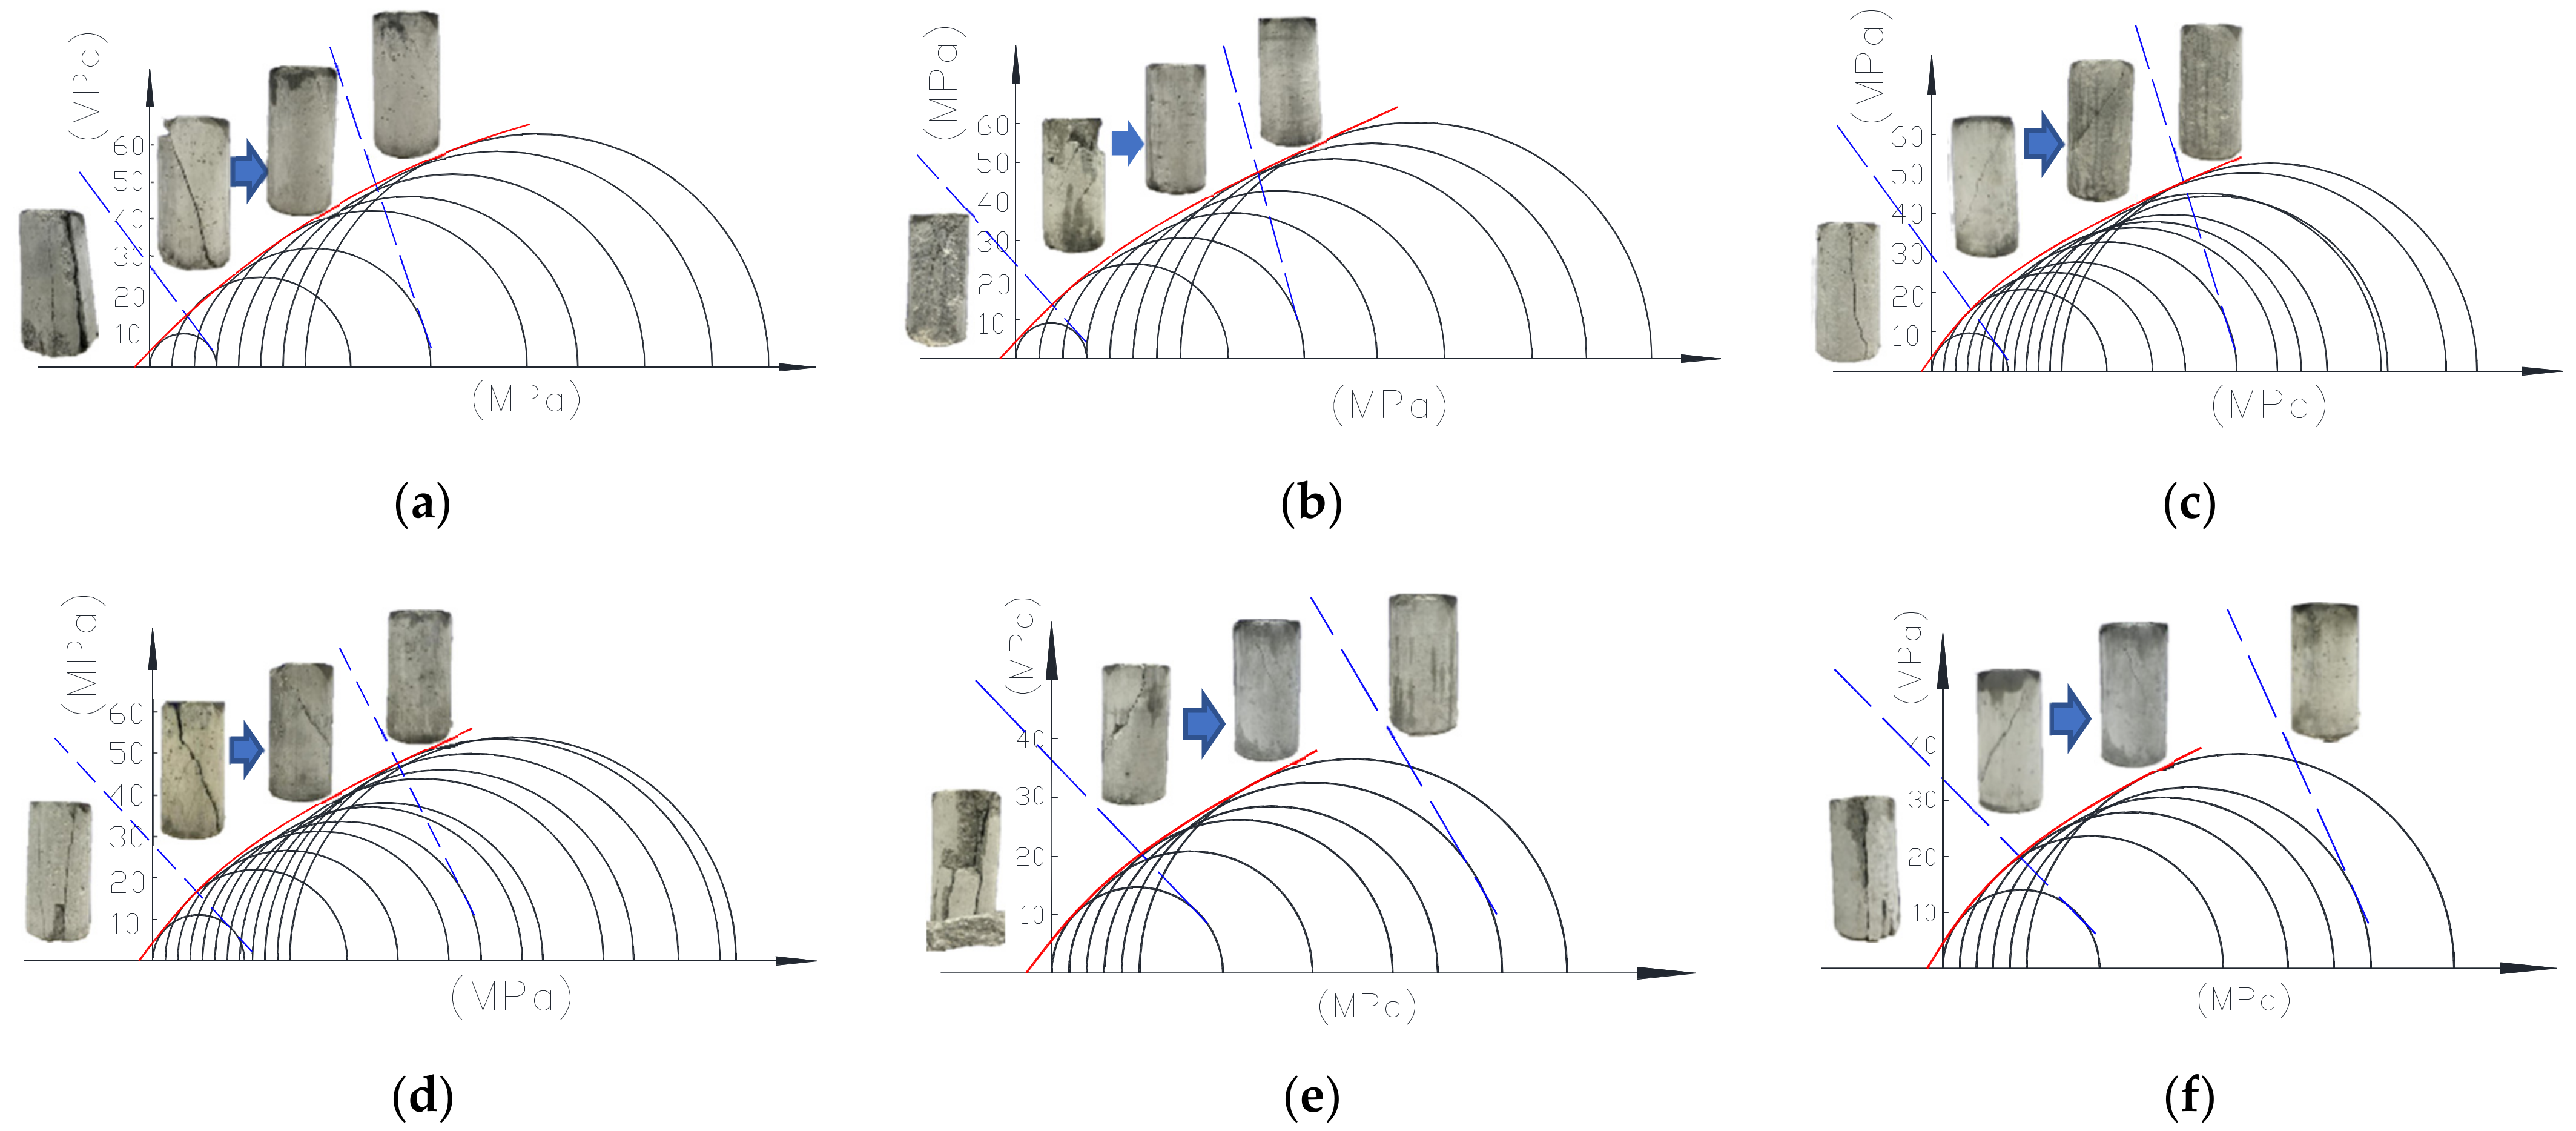
3.1. Failure Modes
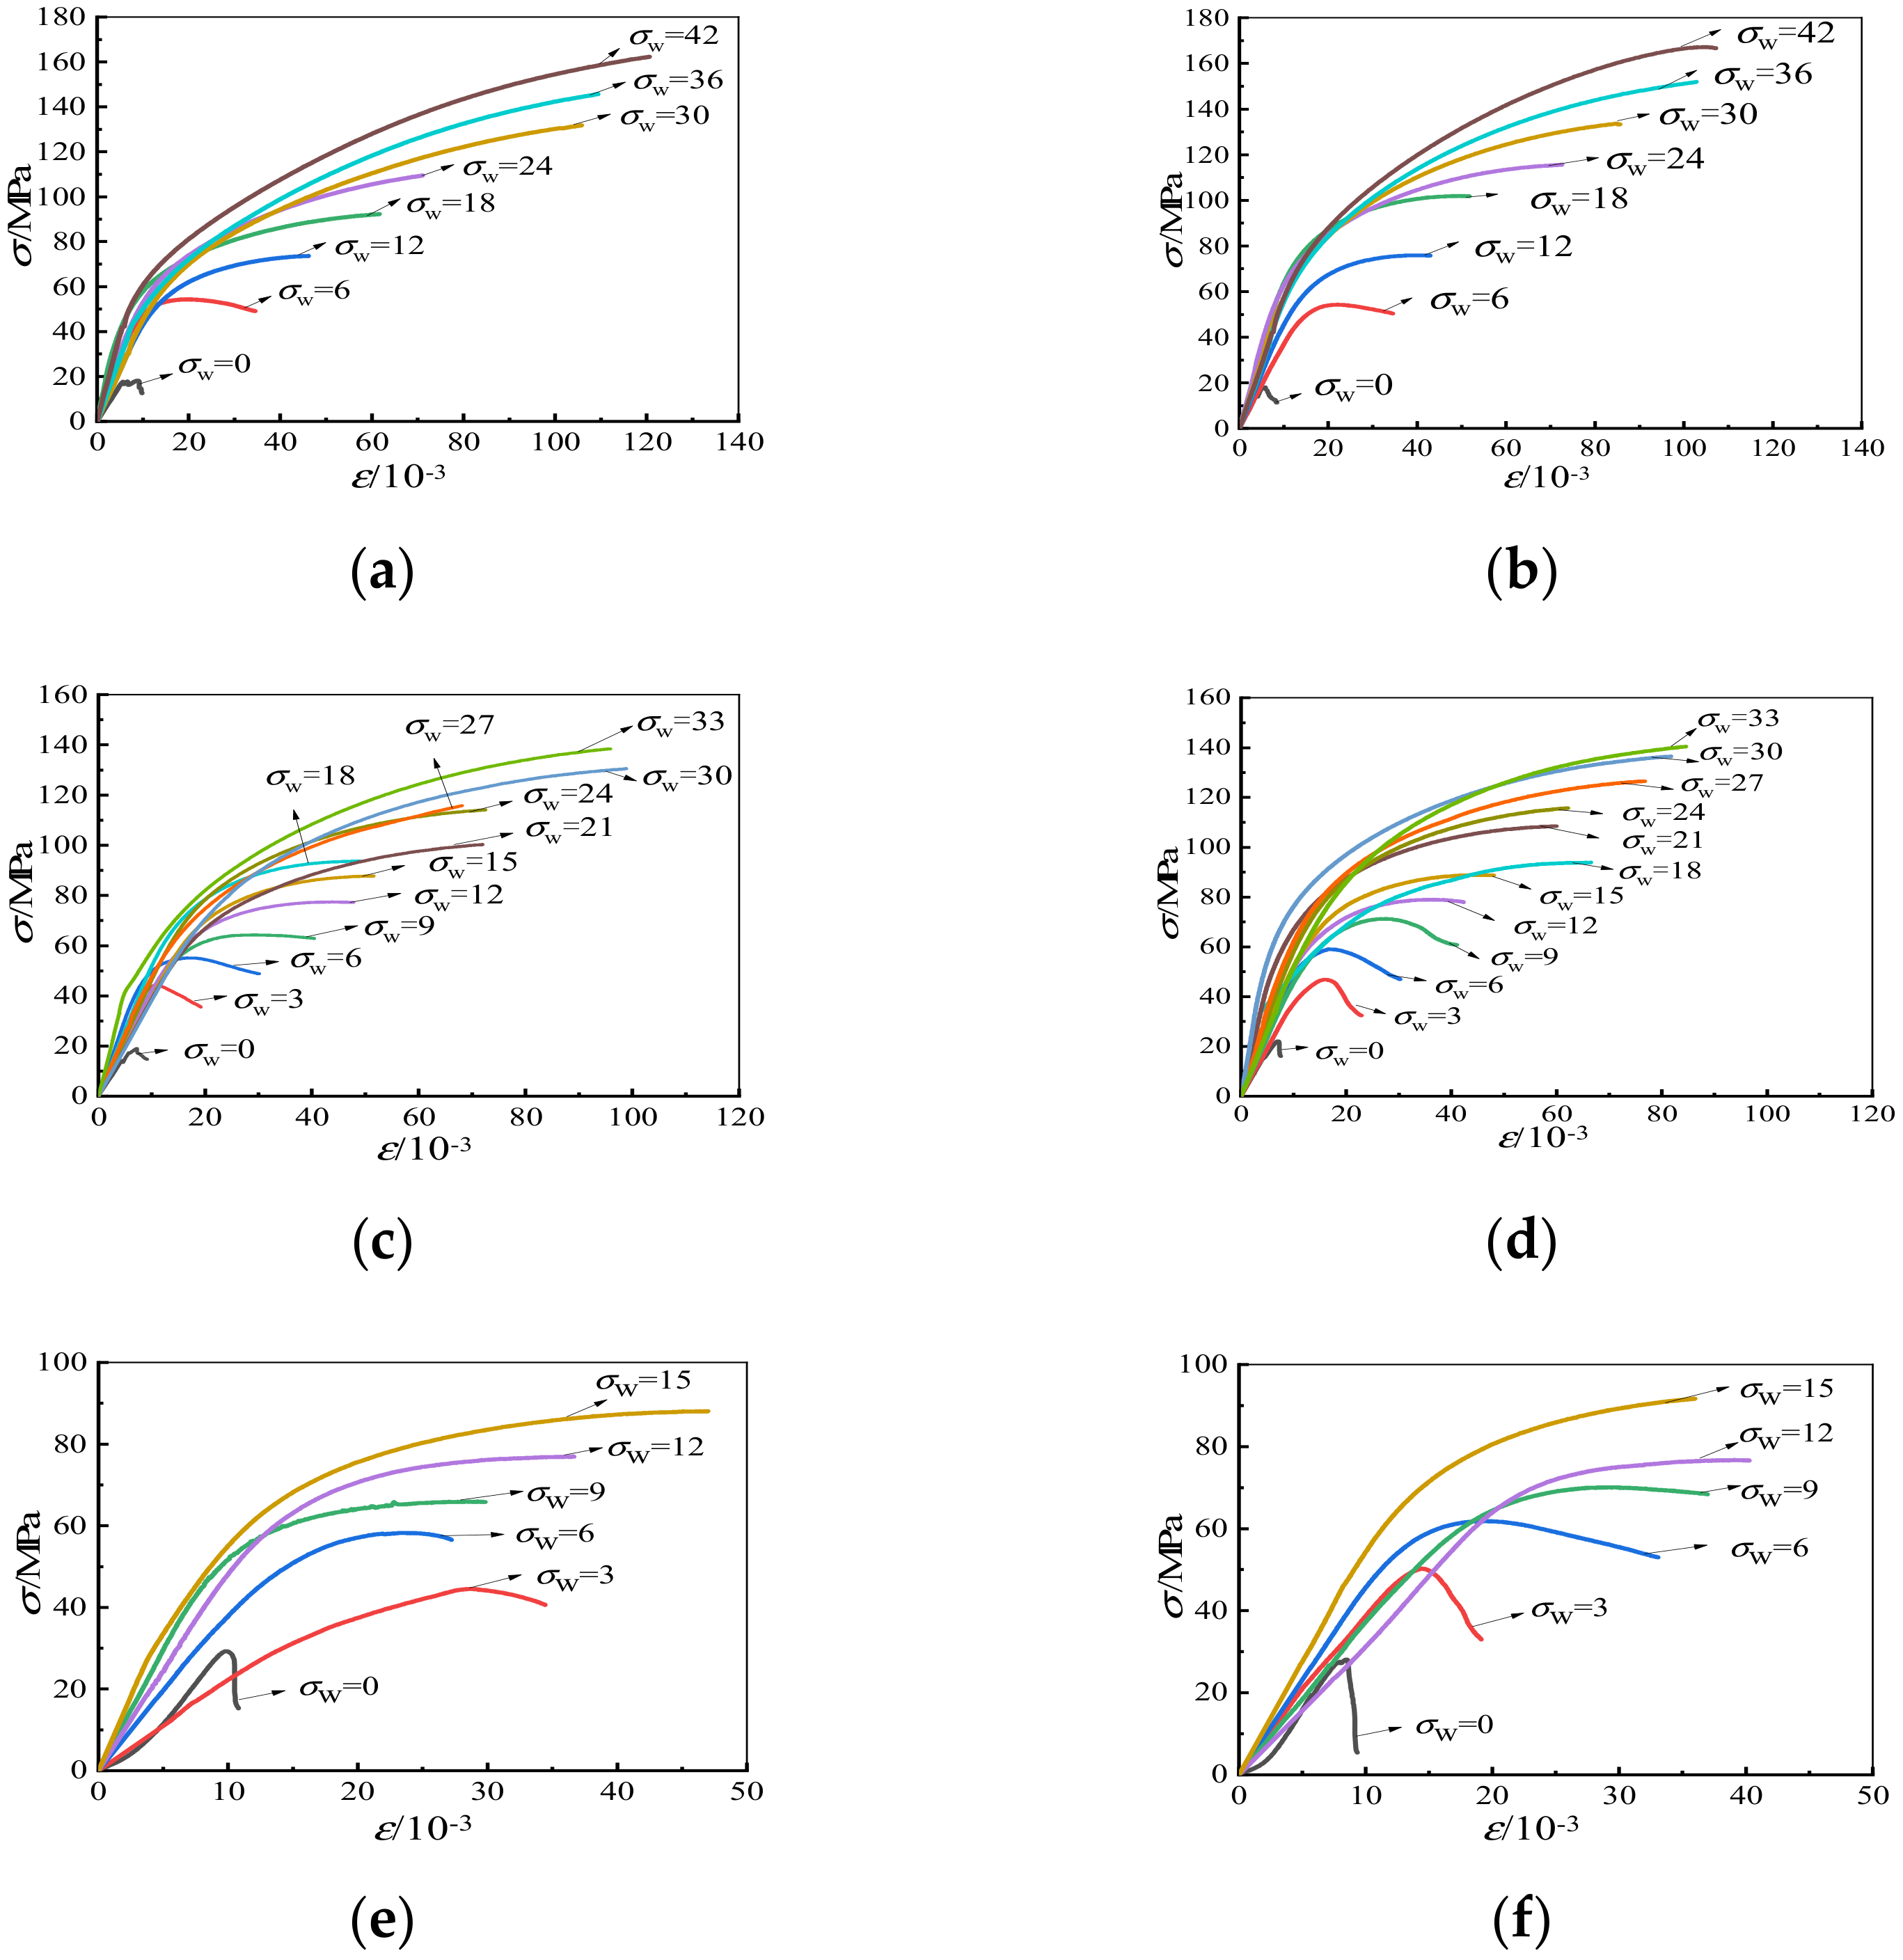
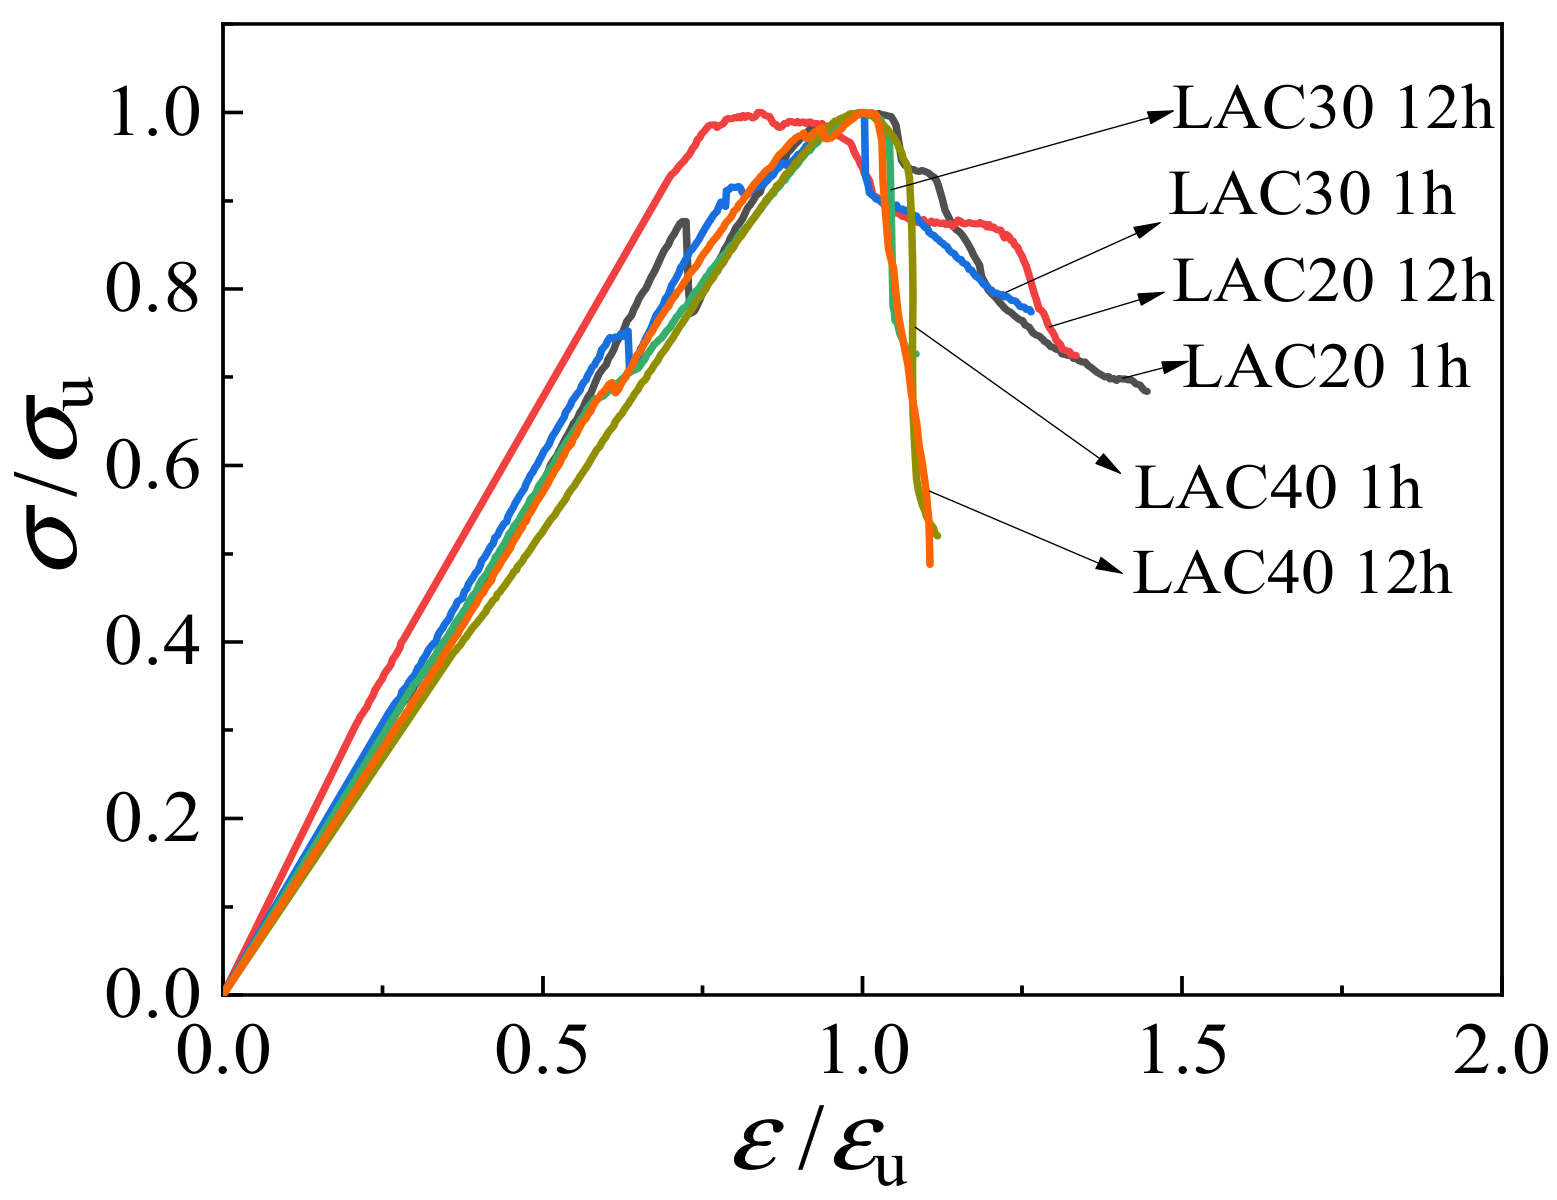
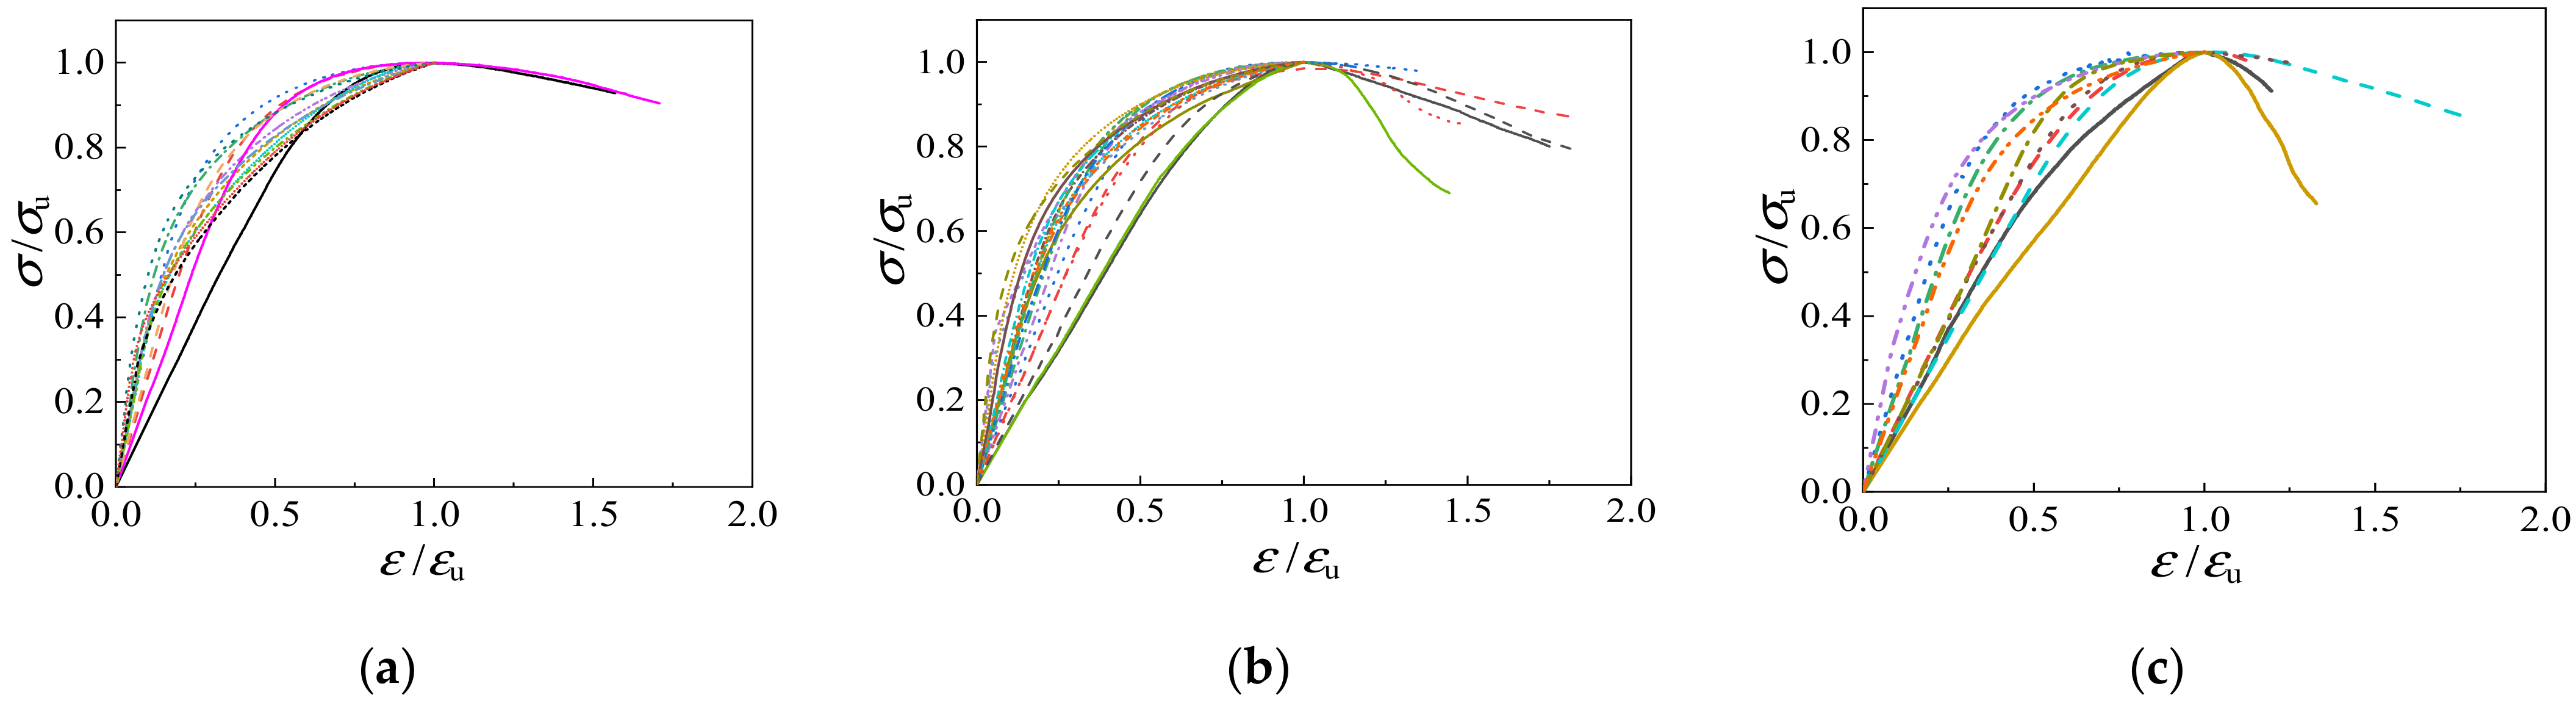
3.2. Stress-Strain Behavior
3.3. Influence of Concrete Strength
3.4. Influence of Confining Pressure
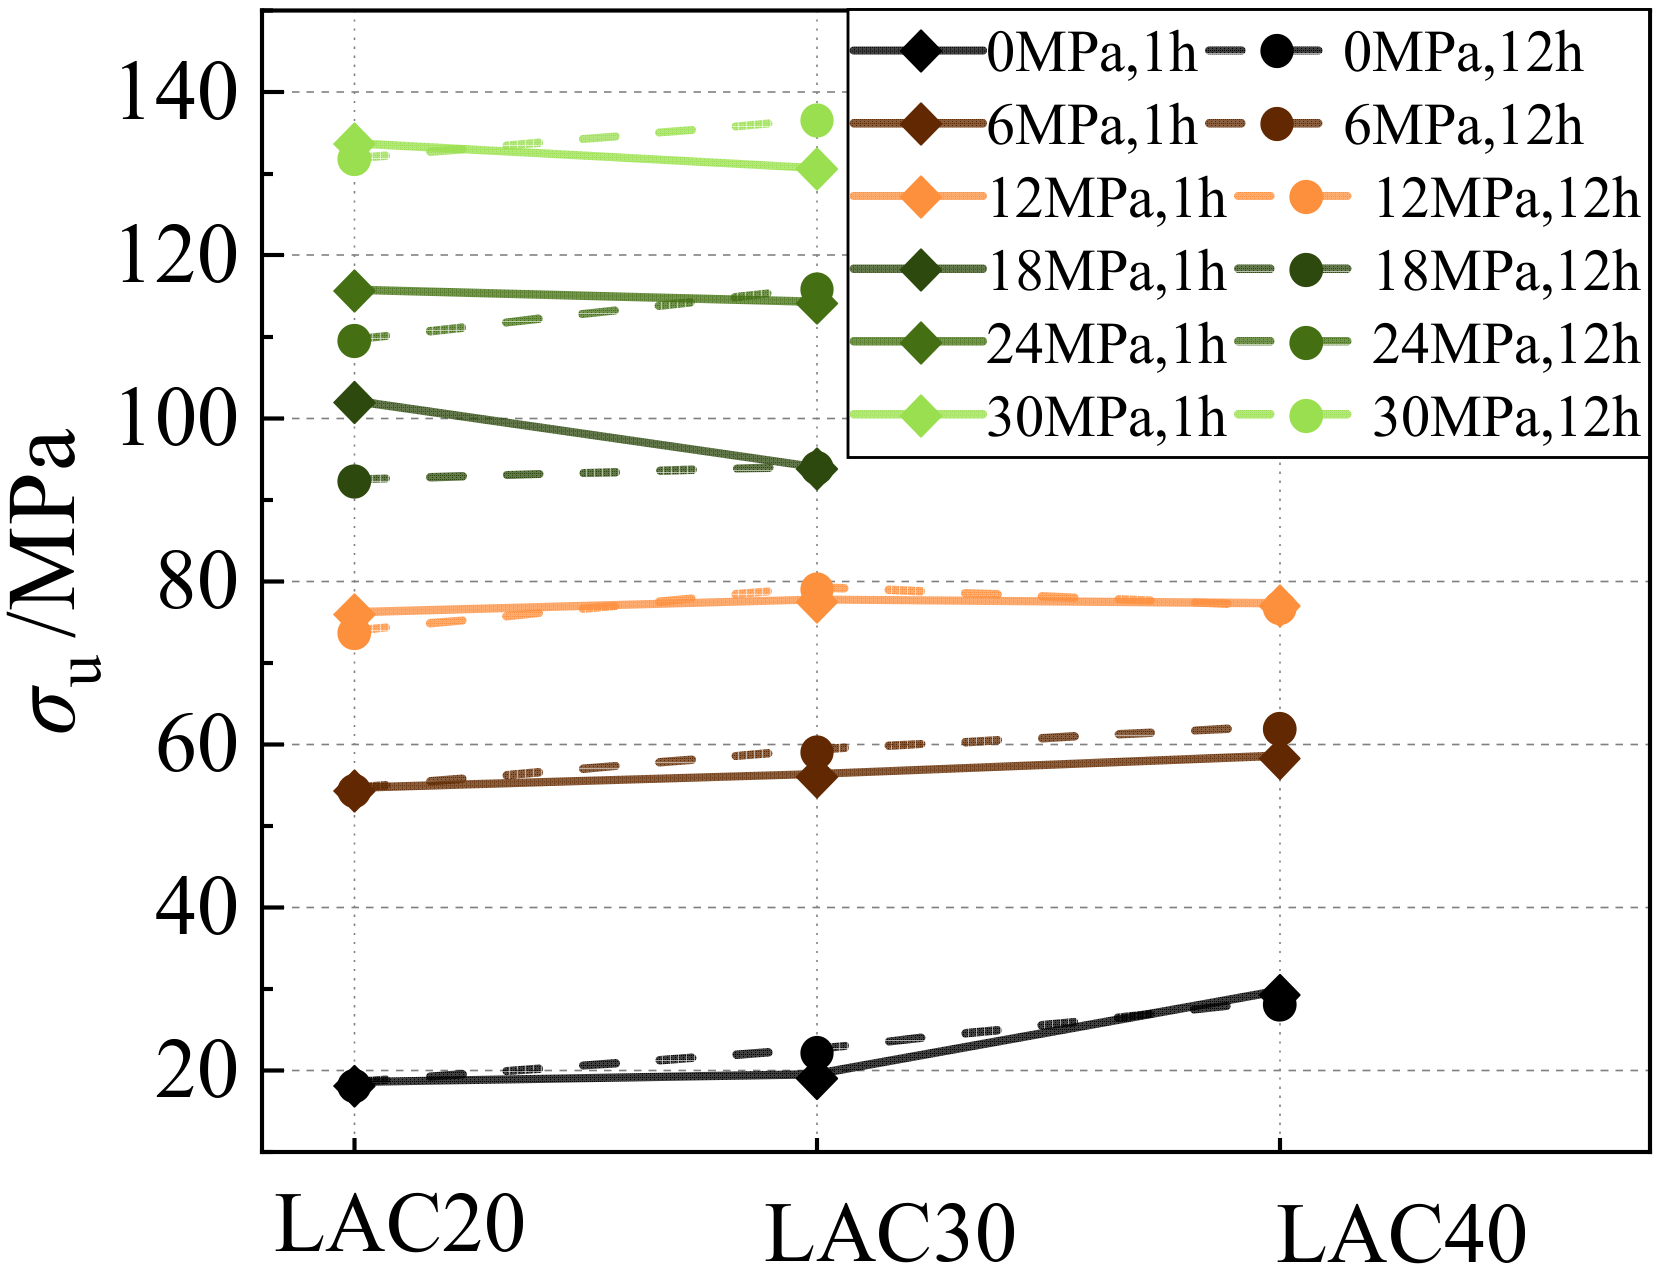
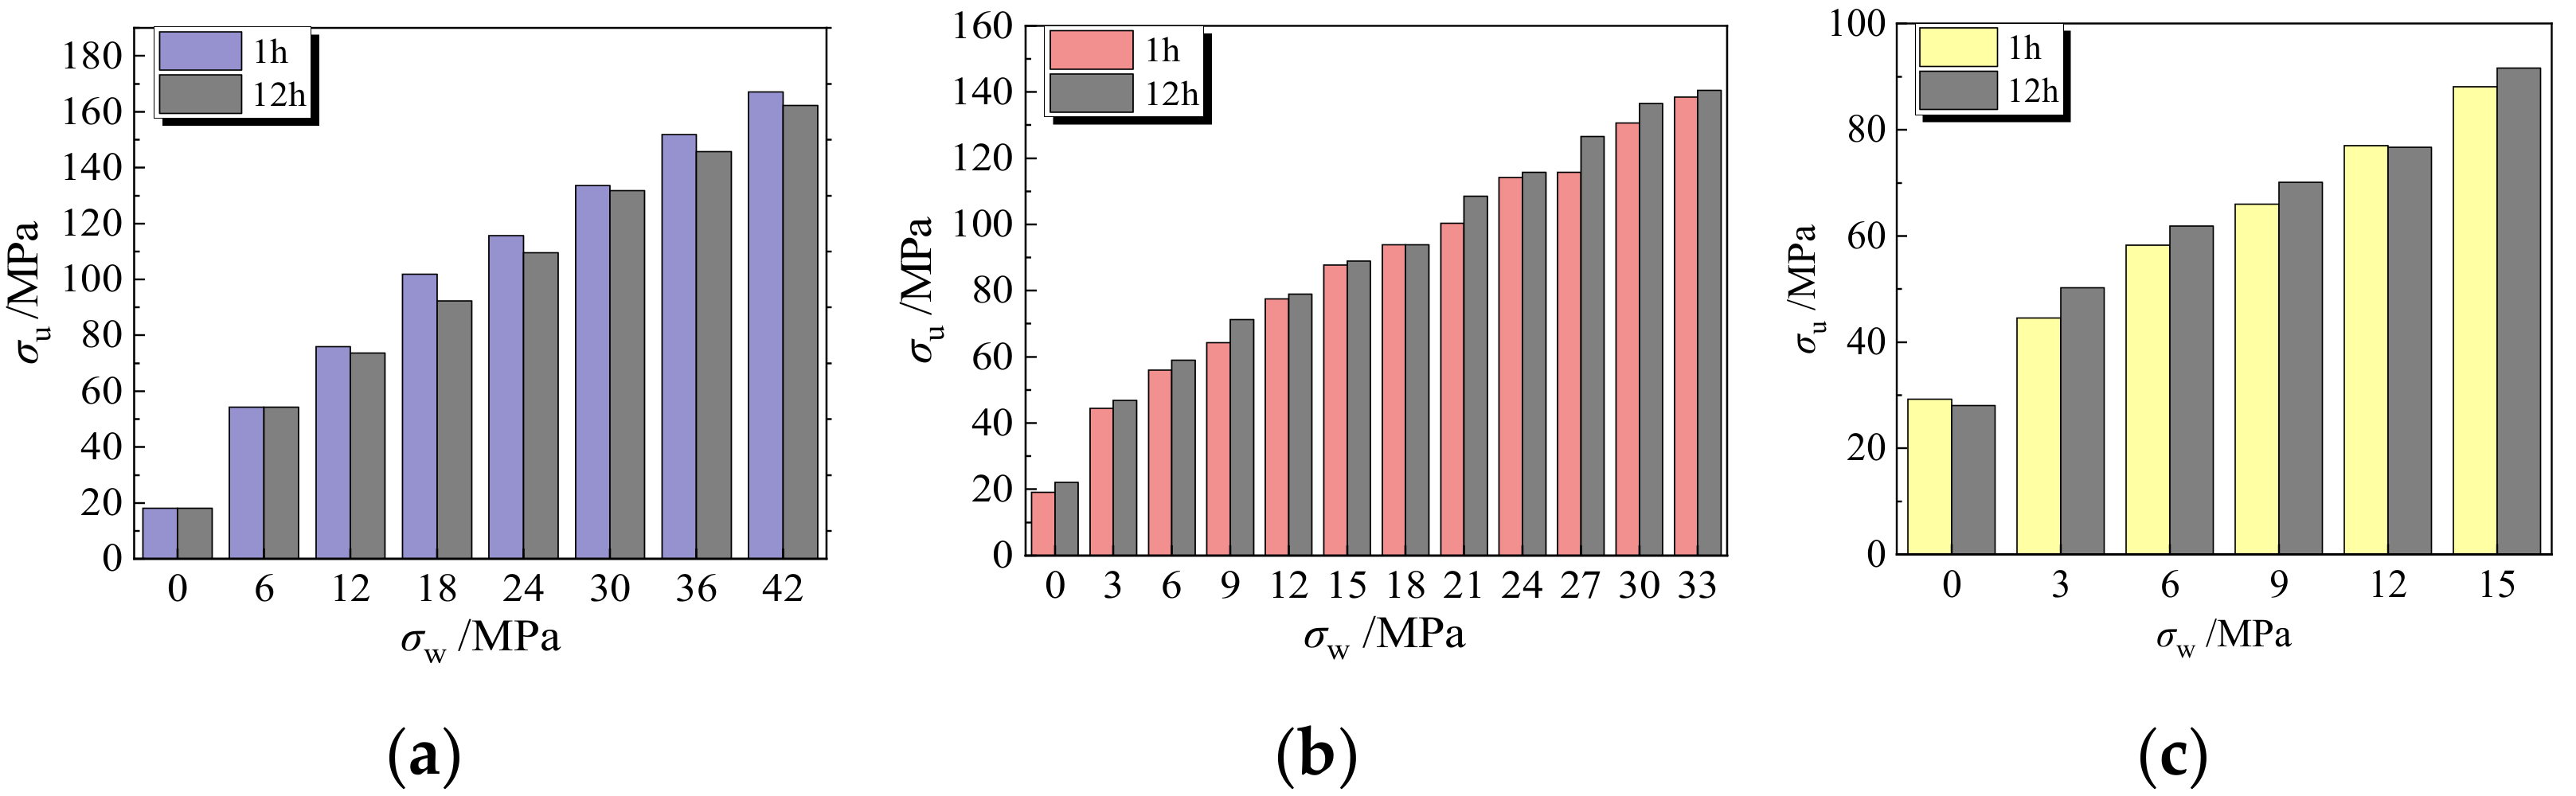
3.5. Influence of Aggregate Immersion Time
3.6. Failure Mechanism Analysis
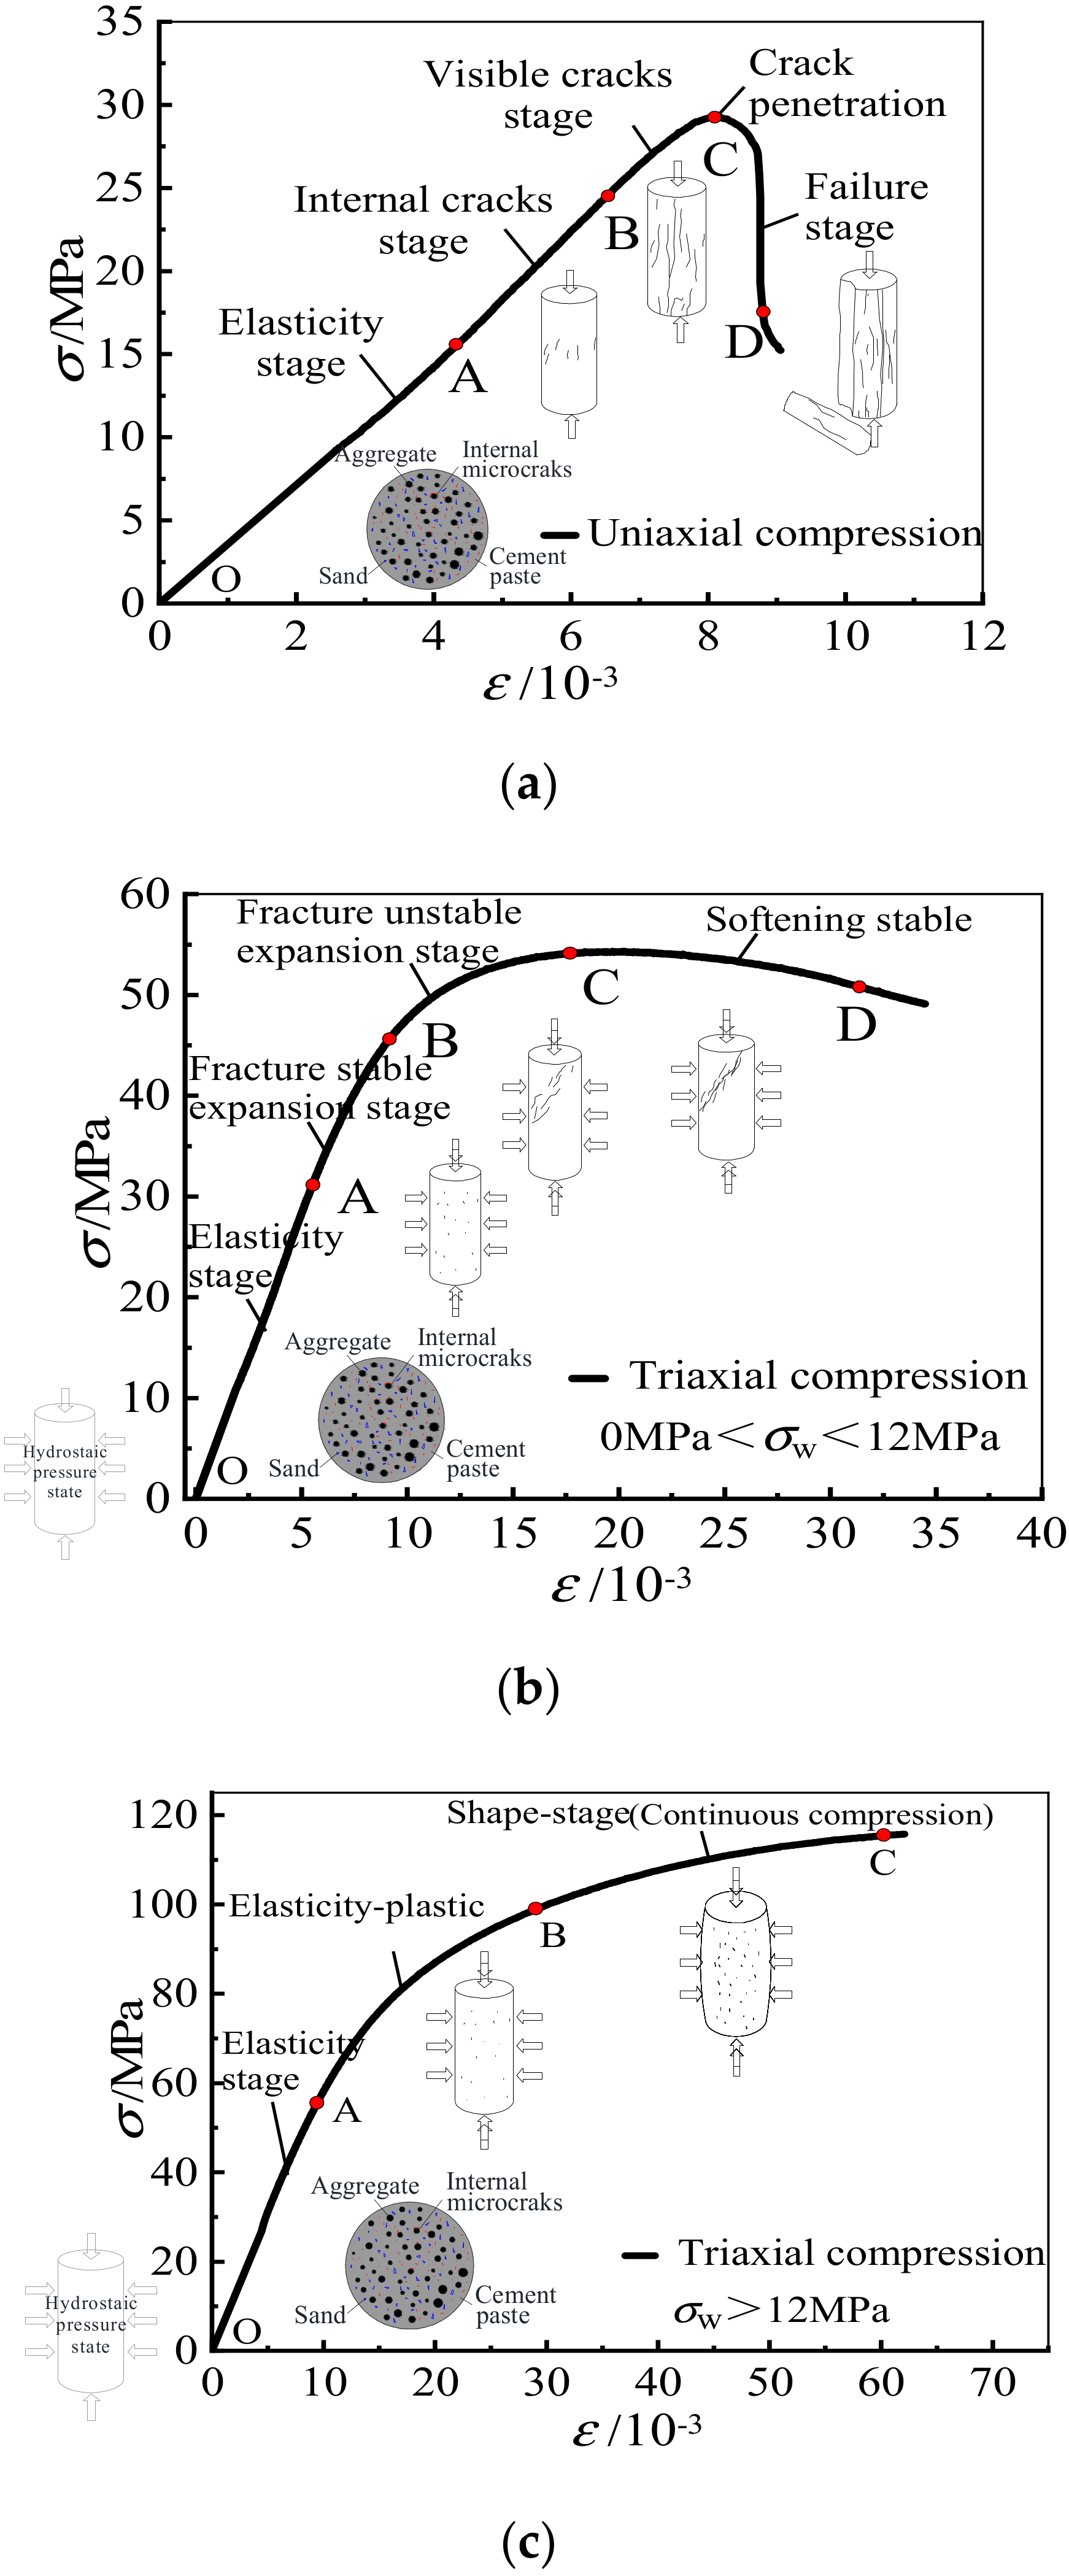
3.6.1. Failure Mechanism under Uniaxial Compression
3.6.2. Failure Mechanism under Triaxial Compression
3.7. Microstructure of LAC
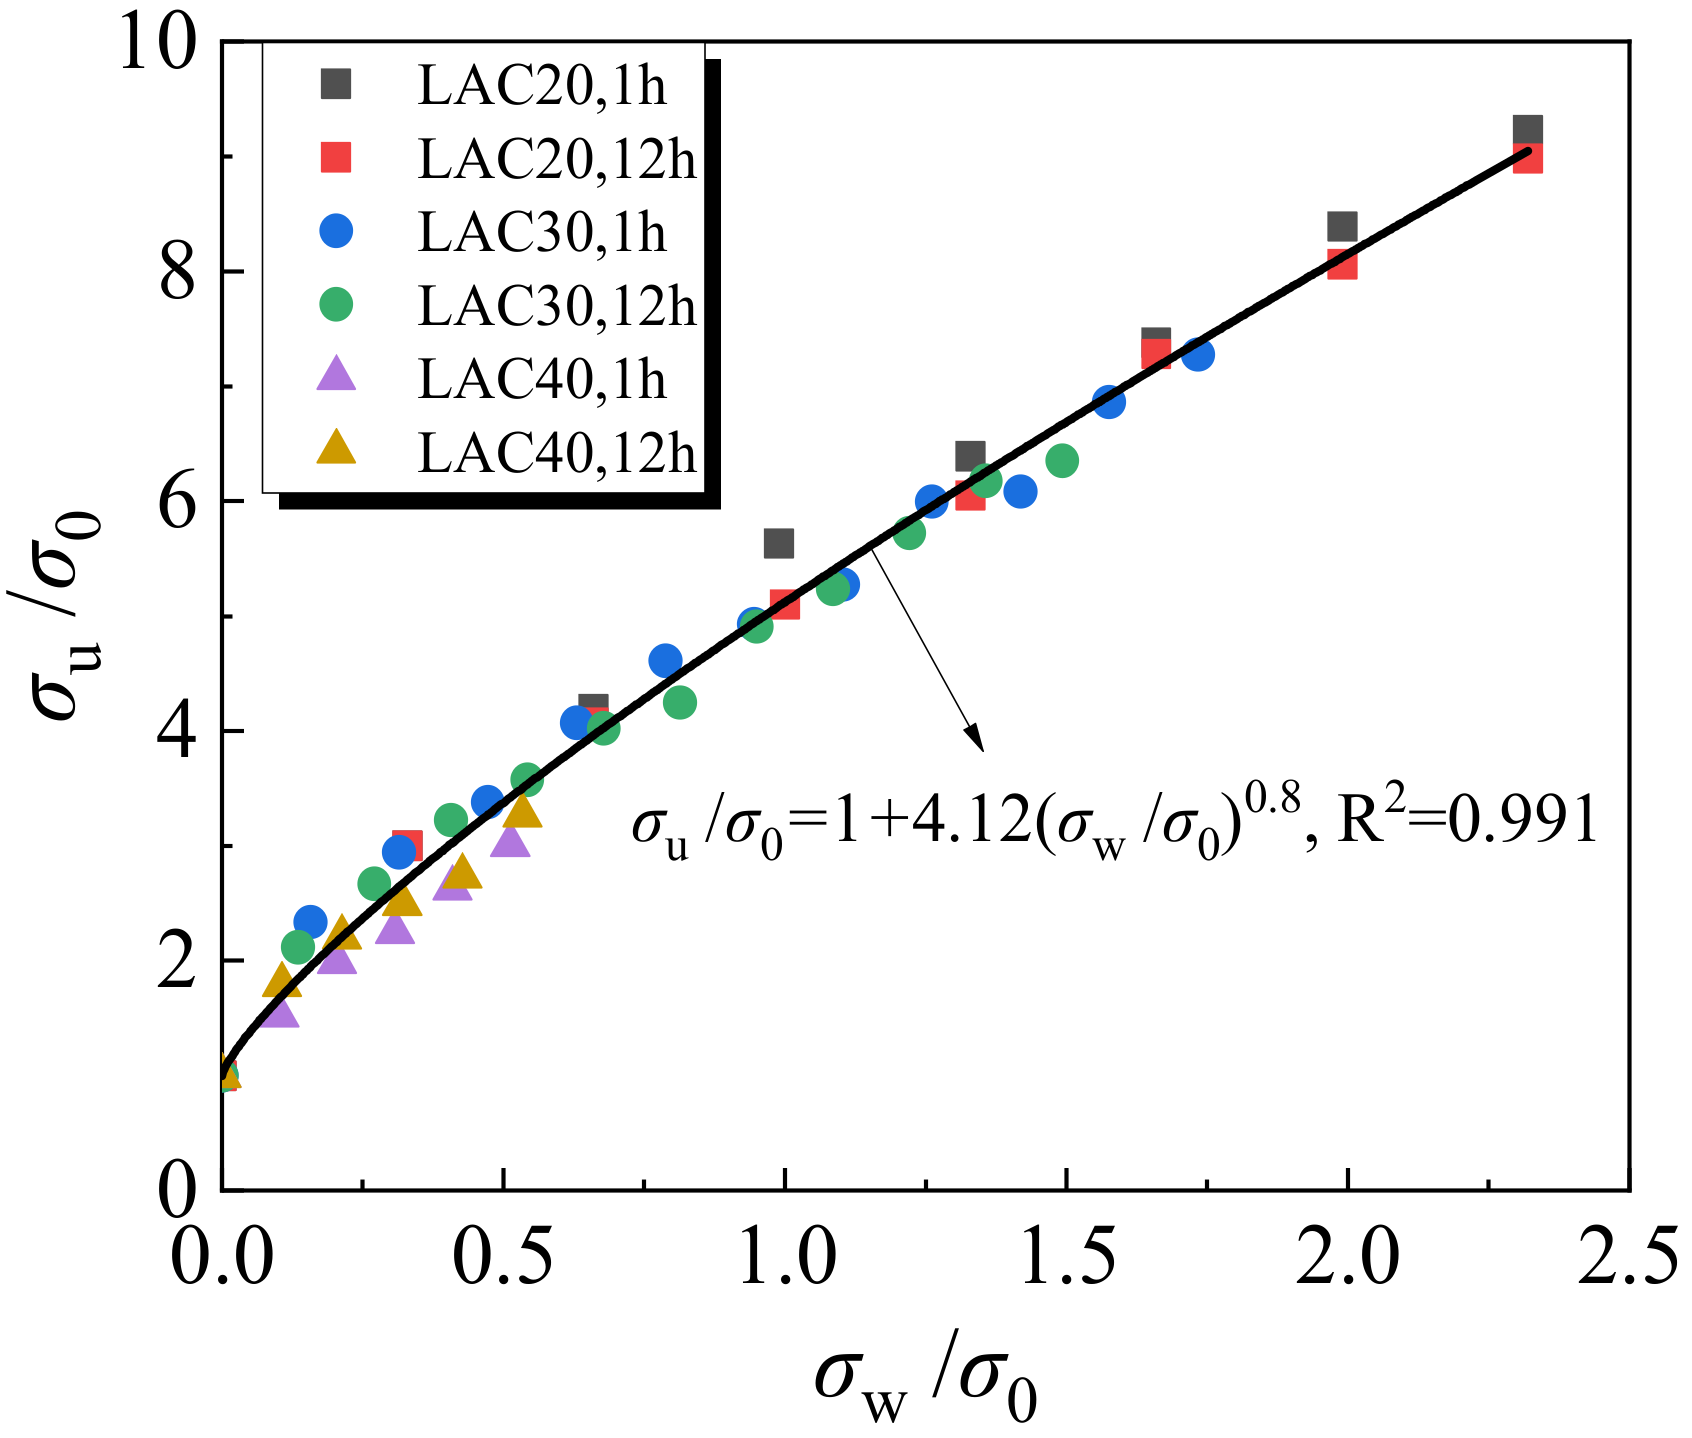
4. Failure Criteria for LAC
4.1. Mohr–Coulomb Criterion
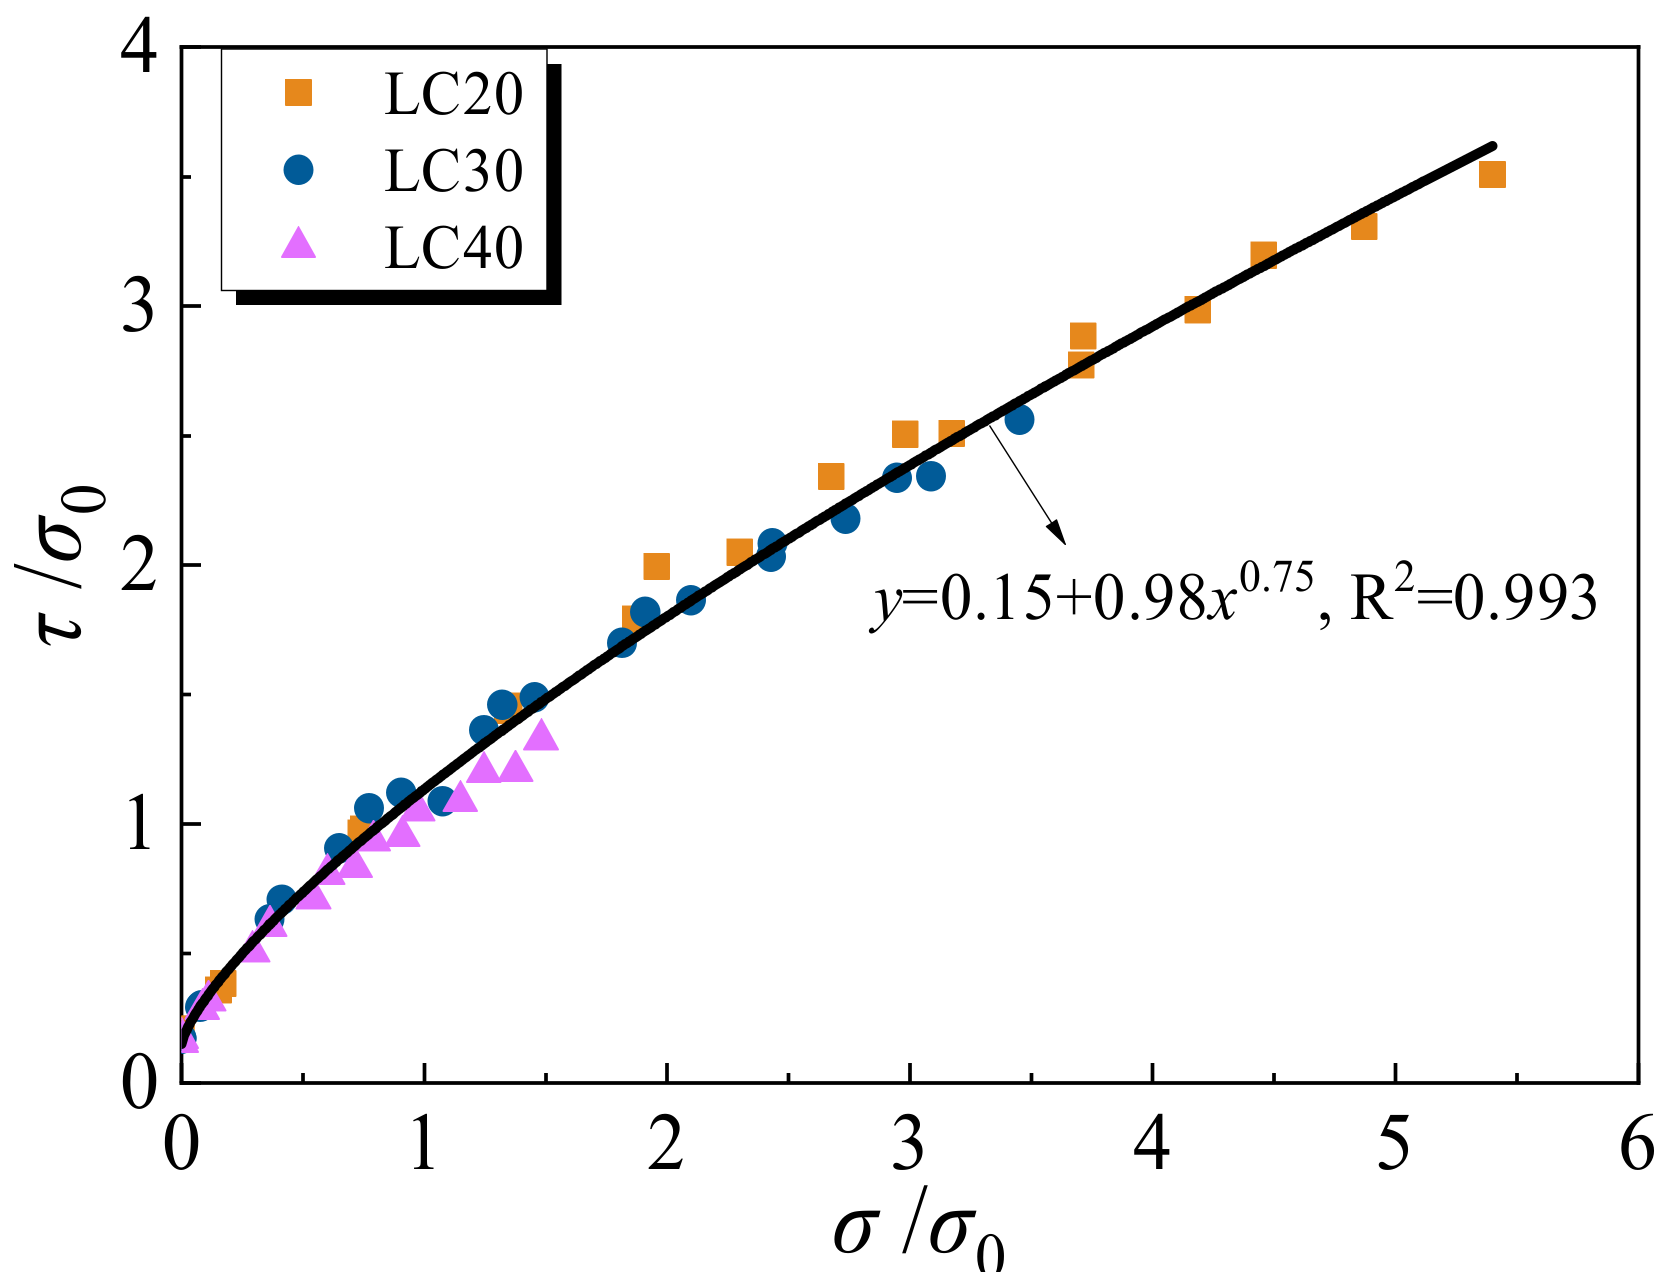
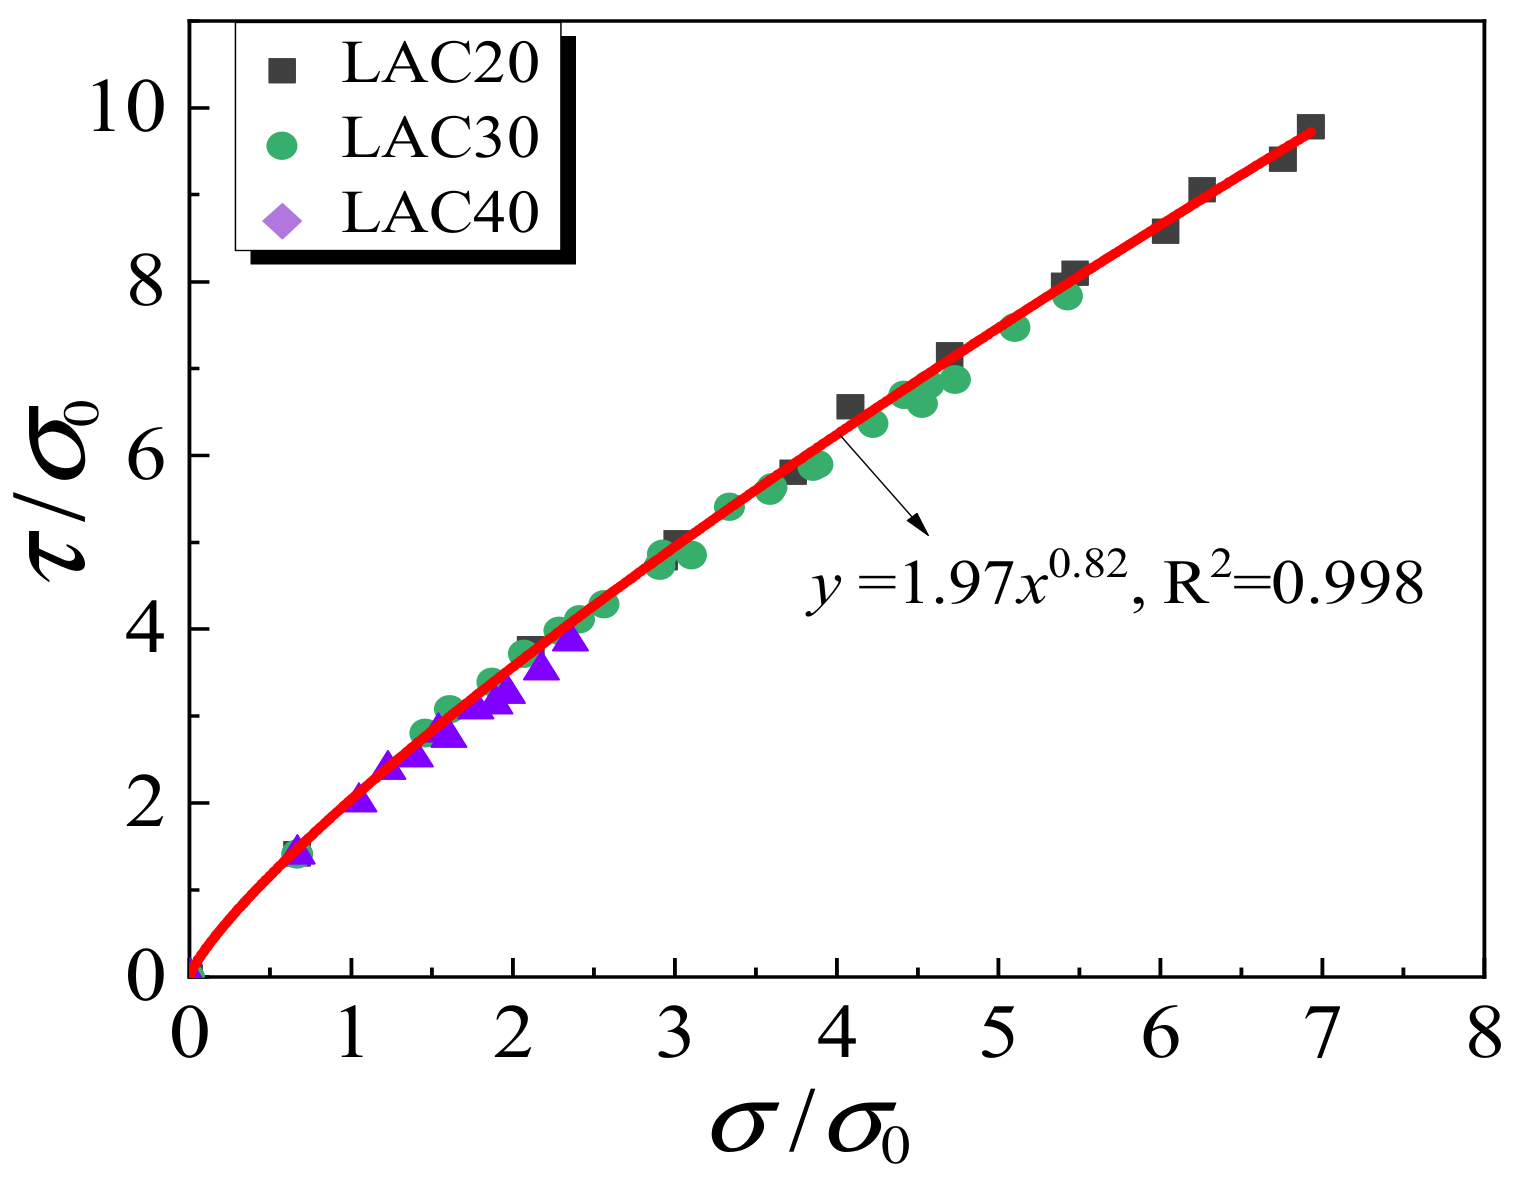
4.2. Shear Stress Failure Criterion
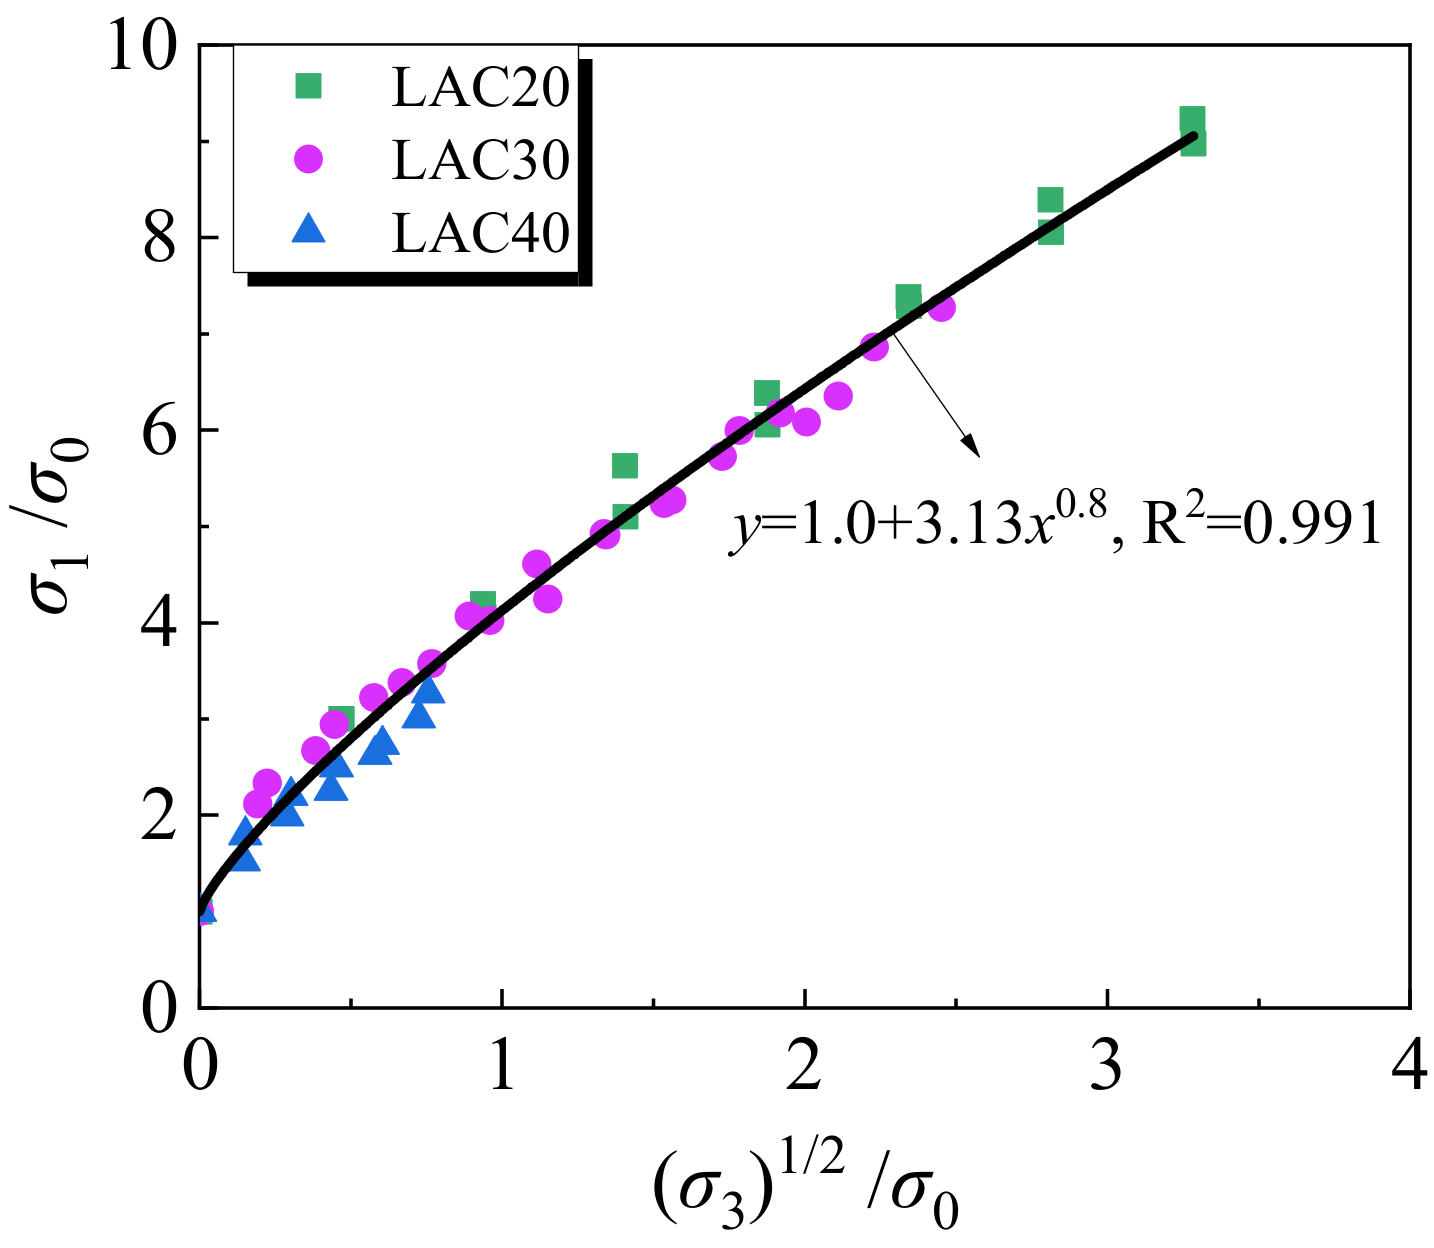
4.3. Compression Meridian Plane Model
5. Stress-Strain Constitutive Relationship Model
5.1. Uniaxial Stress-Strain Constitutive Relationship
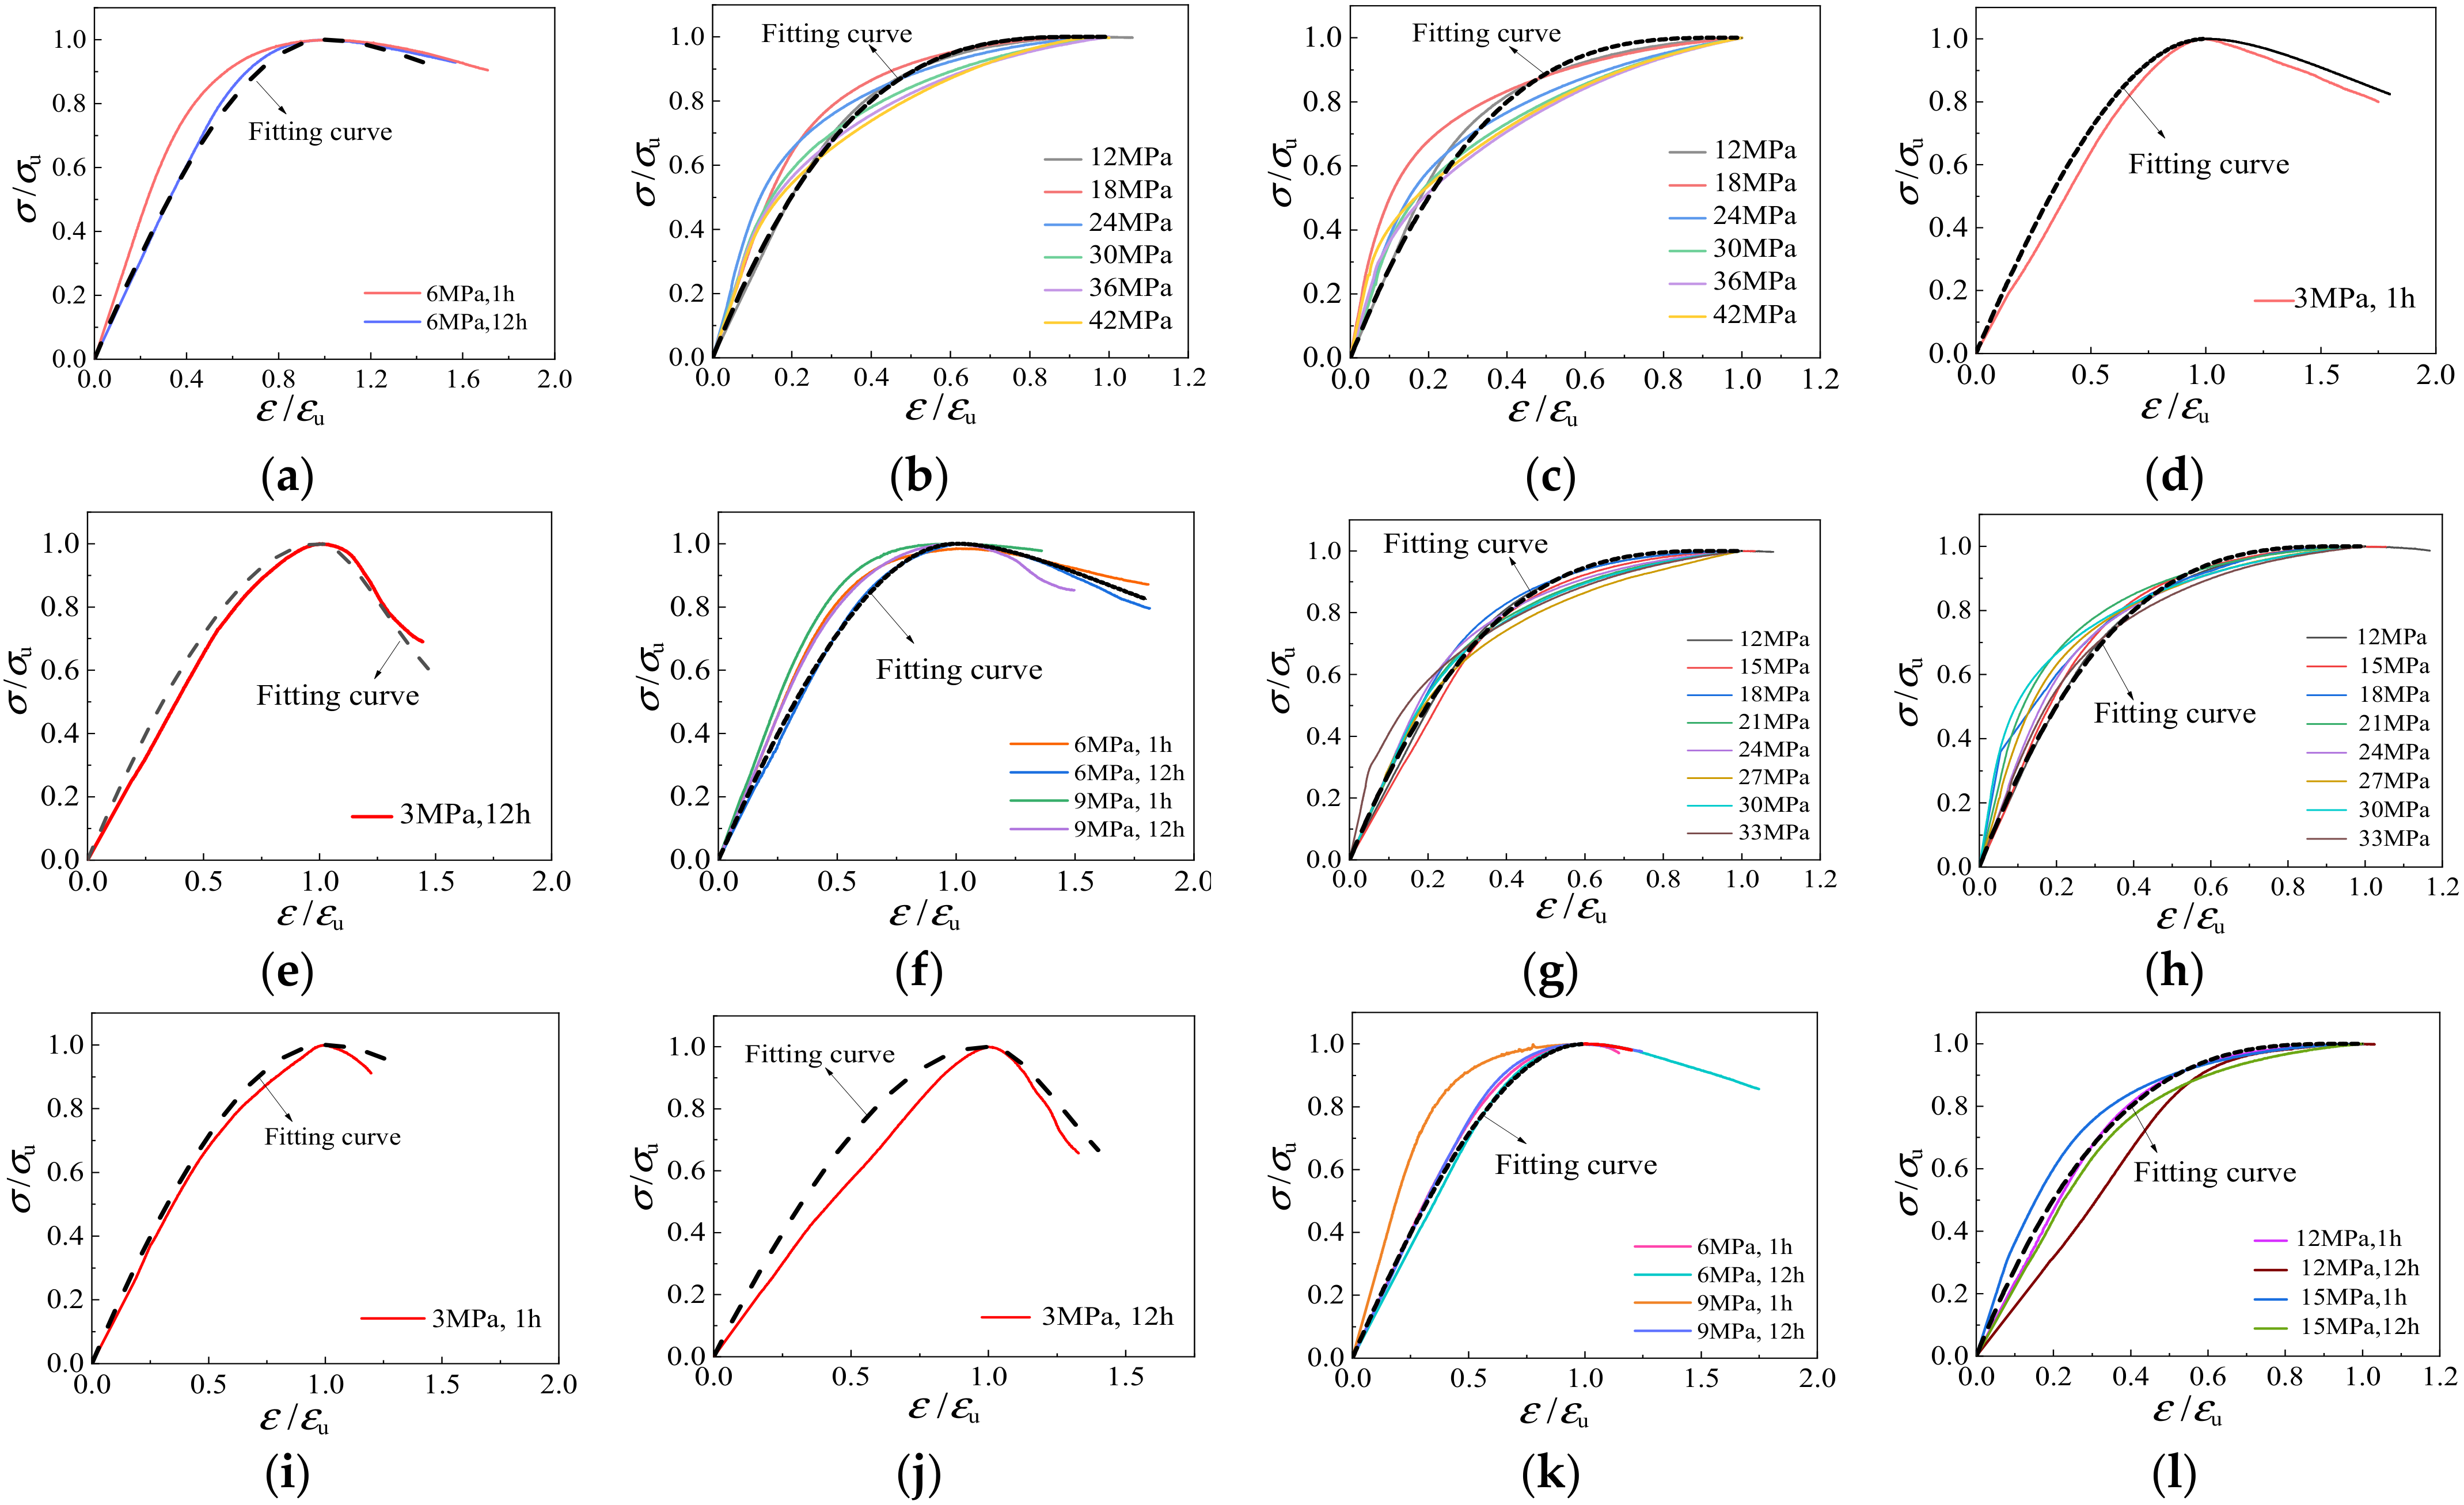
5.2. Triaxial Compression Stress-Strain Constitutive Relationship
6. Conclusions
- The stress-strain curve of LAC under triaxial compression is affected more by the strength grade and lateral confining pressure value and slightly by the soaking time of the aggregate. When the confining pressure is 0 MPa < σw ≤ 12 MPa, the stress-strain curve has a descending branch. Meanwhile, there is an obvious stress plateau in the stress-strain curve when the confining pressure is σw > 12 MPa.
- The value of peak stress is slightly affected by the soaking time of aggregates in LAC. The variable range of peak stress is between −5% and 5% when the soaking time of aggregates increases from 1 h to 12 h.
- There are three different failure mechanisms of LAC under continuous stress. First, the lateral tensile stress caused by vertical load leads to failure under uniaxial compression. Second, in the range of 0 MPa < σw ≤ 12 MPa, the oblique shear failure is caused by the joint action of lateral tensile stress and confining pressure binding. Third, when the confining pressure σw > 12 MPa, there are no visible cracks on the surface of the specimens, and the specimens are continuously pressed and compacted to form the central bulge failure.
- The Mohr–Coulomb theory, octahedral shear stress theory and Rendulic plane theory were applied to analyze the failure criterion of LAC, and the applicable triaxial force calculation formula was obtained by fitting the dimensionless test data.
- Referring to the segmental constitutive model of ordinary concrete proposed by Guo, the triaxial stress-strain constitutive equation of fly ash ceramsite LAC is proposed, and the theoretical results are in good agreement with the experimental results.
Author Contributions
Funding
Institutional Review Board Statement
Informed Consent Statement
Data Availability Statement
Conflicts of Interest
Nomenclature
| a, μ | Curve-fitting constants in Equation (2) |
| φ, γ | Curve-fitting constants in Equation (3) |
| ζ, Φ | Curve-fitting constants in Equation (7) |
| k, q | Curve-fitting constants in Equation (8) |
| λ, ξ | Curve-fitting constants in Equation (9) |
| c | Cohesion of lightweight aggregate concrete |
| σ1, σv | Axial stress |
| σ2, σ3, σw | Confining Pressure |
| σu | Peak stress |
| σ0 | Uniaxial compressive strength of concrete |
| σ | Stress |
| Octahedral normal stress | |
| τ | Shear stress |
| τu | Peak shear stress |
| ε | Axial strain |
| εu | Uniaxial compression strain |
| LAC | Lightweight aggregate concrete |
| NAC | Natural aggregate concrete |
| LAC20 | Design strength of 20 MPa lightweight aggregate concrete |
| LAC30 | Design strength of 30 MPa lightweight aggregate concrete |
| LAC40 | Design strength of 40 MPa lightweight aggregate concrete |
References
- Tunstall, L.E.; Scherer, G.W.; Prud’homme, R.K. A new hypothesis for air loss in cement systems containing fly ash. Cem. Concr. Res. 2021, 142, 106352. [Google Scholar] [CrossRef]
- Gollakota, A.R.K.; Volli, V.; Shu, C.M. Progressive utilisation prospects of coal fly ash: A review. Sci. Total Environ. 2019, 672, 951–989. [Google Scholar] [CrossRef]
- Yao, Z.T.; Ji, X.S.; Sarker, P.K.; Tang, J.H.; Ge, L.Q.; Xia, M.S.; Xi, Y.Q. A comprehensive review on the applications of coal fly ash. Earth Sci. Rev. 2015, 141, 105–121. [Google Scholar] [CrossRef] [Green Version]
- Jayaranjan, M.L.D.; Van Hullebusch, E.D.; Annachhatre, A.P. Reuse options for coal fired power plant bottom ash and fly ash. Rev. Environ. Sci. Bio/Technol. 2014, 13, 467–486. [Google Scholar] [CrossRef] [Green Version]
- Wang, N.; Sun, X.; Zhao, Q.; Yang, Y.; Wang, P. Leachability and adverse effects of coal fly ash: A review. J. Hazard. Mater. 2020, 396, 122725. [Google Scholar] [CrossRef]
- Luo, Y.; Wu, Y.; Ma, S.; Zheng, S.; Zhang, Y.; Chu, P.K. Utilization of coal fly ash in China: A mini-review on challenges and future directions. Environ. Sci. Pollut. Res. 2020, 28, 18727–18740. [Google Scholar] [CrossRef]
- Bhatt, A.; Priyadarshini, S.; Mohanakrishnan, A.A.; Abri, A.; Sattler, M.; Techapaphawit, S. Physical, chemical, and geotechnical properties of coal fly ash: A global review. Case Stud. Constr. Mater. 2019, 11, e00263. [Google Scholar] [CrossRef]
- Sahoo, P.K.; Kim, K.; Powell, M.A.; Equeenuddin, S.M. Recovery of metals and other beneficial products from coal fly ash: A sustainable approach for fly ash management. Int. J. Coal Sci. Technol. 2016, 3, 267–283. [Google Scholar] [CrossRef] [Green Version]
- Huang, X.; Zhao, H.; Hu, X.; Liu, F.; Wang, L.; Zhao, X.; Gao, P.; Ji, P. Optimization of preparation technology for modified coal fly ash and its adsorption properties for Cd2+. J. Hazard. Mater. 2020, 392, 122461. [Google Scholar] [CrossRef]
- Mushtaq, F.; Zahid, M.; Bhatti, I.A.; Nasir, S.; Hussain, T. Possible applications of coal fly ash in wastewater treatment. J. Environ. Manag. 2019, 240, 27–46. [Google Scholar] [CrossRef]
- Hower, J.C.; Fu, B.; Dai, S. Geochemical partitioning from pulverized coal to fly ash and bottom ash. Fuel 2020, 279, 118542. [Google Scholar] [CrossRef]
- Real, S.; Gomes, M.G.; Rodrigues, A.M.; Bogas, J.A. Contribution of structural lightweight aggregate concrete to the reduction of thermal bridging effect in buildings. Constr. Build. Mater. 2016, 121, 460–470. [Google Scholar] [CrossRef]
- Zhang, B.; Poon, C.S. Sound insulation properties of rubberized lightweight aggregate concrete. J. Clean. Prod. 2018, 172, 3176–3185. [Google Scholar] [CrossRef]
- Wang, S.R.; Wu, X.G.; Yang, J.H.; Zhao, J.Q.; Kong, F.L. behavior of lightweight concrete structures subjected to 3D coupled static–dynamic loads. Acta Mech. 2020, 231, 4497–4511. [Google Scholar] [CrossRef]
- Sahoo, S.; Selvaraju, A.K. Mechanical characterization of structural lightweight aggregate concrete made with sintered fly ash aggregates and synthetic fibres. Cem. Concr. Compos. 2020, 113, 103712. [Google Scholar] [CrossRef]
- Hassanpour, M.; Shafigh, P.; Mahmud, H.B. Lightweight aggregate concrete fiber reinforcement—A review. Constr. Build. Mater. 2012, 37, 452–461. [Google Scholar] [CrossRef]
- Chandra, S.; Berntsson, L. Lightweight Aggregate Concrete [M]; Noyes Publications; William Andnew Publishing: New York, NY, USA, 2002. [Google Scholar]
- Cui, H.Z.; Lo, T.Y.; Memon, S.A.; Xu, W. Effect of lightweight aggregates on the mechanical properties and brittleness of lightweight aggregate concrete. Constr. Build. Mater. 2012, 35, 149–158. [Google Scholar] [CrossRef]
- Ji, T.; Zheng, D.D.; Chen, X.F.; Lin, X.J.; Wu, H.C. Effect of prewetting degree of ceramsite on the early-age autogenous shrinkage of lightweight aggregate concrete. Constr. Build. Mater. 2015, 98, 102–111. [Google Scholar] [CrossRef]
- Shen, D.; Feng, Z.; Zhu, P.; Tang, X.; Jiang, G. Effect of pre-wetted lightweight aggregates on residual stress development and stress relaxation in restrained concrete ring specimens. Constr. Build. Mater. 2020, 258, 119151. [Google Scholar] [CrossRef]
- Jing, J.L.; Niu, J.G.; Wan, C.J.; Jin, B.; Yin, Y.L. Investigation on mechanical properties and microstructure of high performance polypropylene fiber reinforced lightweight aggregate concrete. Constr. Build. Mater. 2016, 118, 27–35. [Google Scholar]
- Wu, T.; Yang, X.; Wei, H.; Liu, X. Mechanical properties and microstructure of lightweight aggregate concrete with and without fibers. Constr. Build. Mater. 2018, 199, 526–539. [Google Scholar] [CrossRef]
- Assaad, J.J.; El Mir, A. Durability of polymer-modified lightweight flowable concrete made using expanded polystyrene. Constr. Build. Mater. 2020, 249, 118764. [Google Scholar] [CrossRef]
- Yu, Z.; Tang, R.; Cao, P.; Huang, Q.; Xie, X.; Shi, F. Multi-axial test and failure criterion analysis on self-compacting lightweight aggregate concrete. Constr. Build. Mater. 2019, 215, 786–798. [Google Scholar] [CrossRef]
- Ren, Y.; Yu, Z.; Huang, Q.; Ren, Z. Constitutive model and failure criterions for lightweight aggregate concrete: A true triaxial experimental test. Constr. Build. Mater. 2018, 171, 759–769. [Google Scholar] [CrossRef] [Green Version]
- Yang, J.-H.; Zhang, P.; Tao, W.; Lin, X.-Y.; Wang, Q.-T. The tests and failure criteria of full lightweight shale ceramsite concrete under true triaxial compression. Eng. Mech. 2015, 32, 89–98. [Google Scholar] [CrossRef]
- Wang, L.; Song, Y. Mechanical behavior and failure criterion of the gangue-based haydite concrete under triaxial loading. Mater. Struct. 2015, 48, 1419–1433. [Google Scholar] [CrossRef]
- Fu, Z.Q.; Ji, B.H.; Ge, H.B.; Yang, M. Combined strength of lightweight aggregate concrete-filled steel tube. Mater. Res. Innov. 2015, 19, S5-898–S5-901. [Google Scholar] [CrossRef]
- Zhang, X.; Zhang, S.; Fan, Y.; Ding, Y.; Wang, X.; Meng, E. The axial compressive behavior of stone-lightweight aggregate concrete-filled steel tubular stub columns. Constr. Build. Mater. 2021, 298, 123815. [Google Scholar] [CrossRef]
- Zhou, Y.; Liu, X.; Xing, F.; Cui, H.; Sui, L. Axial compressive behavior of FRP-confined lightweight aggregate concrete: An experimental study and stress-strain relation model. Constr. Build. Mater. 2016, 119, 1–15. [Google Scholar] [CrossRef]
- GB175-2007; Common Portland Cement. Standards Press of China: Beijing, China, 2007.
- JGJ/T 12-2019; Technical Standard for Application of Lightweight Aggregate Concrete. China Architecture & Building Press: Beijing, China, 2019.
- Comité Euro-International du Béton. CEB-FIP Model Code 1990: Design Code; Thomas Telford Ltd.: London, UK, 1993. [Google Scholar]
- Guo, Z.H. Principle of Reinforced Concrete [M]; Tsinghua University Press: Beijing, China, 2014. [Google Scholar]
- GB50010-2010; Chinese Code for the Design of Reinforced Concrete Structures. Chinese Building Construction Publishing Press: Beijing, China, 2010.


| Type | Fly Ash Content | Bulk Density (kg/m3) | Numerical Tube Pressure (MPa) | 1 h Water Absorption | 12 h Water Absorption | Saturated Water Absorption |
|---|---|---|---|---|---|---|
| Fly ash ceramsite | 80% | 650 | 7.2 | 14.96% | 16.12% | 17.22% |
| Concrete Strength | Cement (kg/m3) | Ceramsite (kg/m3) | Sand (kg/m3) | Fly Ash (kg/m3) | Water (kg/m3) | Water-Cement Ratio |
|---|---|---|---|---|---|---|
| LAC20 | 350 | 420.3 | 667.4 | 75 | 170 | 0.40 |
| LAC30 | 400 | 407.7 | 634.3 | 47.4 | 170 | 0.38 |
| LAC40 | 450 | 392 | 609.7 | 22.2 | 170 | 0.36 |
| Specimen ID | Concrete Strength (MPa) | Soaking Time (h) | Confining Pressure (Mpa) | Specimen ID | Concrete Strength (Mpa) | Soaking Time (h) | Confining Pressure (Mpa) |
|---|---|---|---|---|---|---|---|
| LAC20-1-0 | 20 | 1 | 0 | LAC30-1-30 | 30 | 1 | 30 |
| LAC20-1-6 | 20 | 1 | 6 | LAC30-1-33 | 30 | 1 | 33 |
| LAC20-1-12 | 20 | 1 | 12 | LAC30-12-0 | 30 | 12 | 0 |
| LAC20-1-18 | 20 | 1 | 18 | LAC30-12-3 | 30 | 12 | 3 |
| LAC20-1-24 | 20 | 1 | 24 | LAC30-12-6 | 30 | 12 | 6 |
| LAC20-1-30 | 20 | 1 | 30 | LAC30-12-9 | 30 | 12 | 9 |
| LAC20-1-36 | 20 | 1 | 36 | LAC30-12-12 | 30 | 12 | 12 |
| LAC20-1-42 | 20 | 1 | 42 | LAC30-12-15 | 30 | 12 | 15 |
| LAC20-12-0 | 20 | 12 | 0 | LAC30-12-18 | 30 | 12 | 18 |
| LAC20-12-6 | 20 | 12 | 6 | LAC30-12-21 | 30 | 12 | 21 |
| LAC20-12-12 | 20 | 12 | 12 | LAC30-12-24 | 30 | 12 | 24 |
| LAC20-12-18 | 20 | 12 | 18 | LAC30-12-27 | 30 | 12 | 27 |
| LAC20-12-24 | 20 | 12 | 24 | LAC30-12-30 | 30 | 12 | 30 |
| LAC20-12-30 | 20 | 12 | 30 | LAC30-12-33 | 30 | 12 | 33 |
| LAC20-12-36 | 20 | 12 | 36 | LAC40-1-0 | 40 | 1 | 0 |
| LAC20-12-42 | 20 | 12 | 42 | LAC40-1-3 | 40 | 1 | 3 |
| LAC30-1-0 | 30 | 1 | 0 | LAC40-1-6 | 40 | 1 | 6 |
| LAC30-1-3 | 30 | 1 | 3 | LAC40-1-9 | 40 | 1 | 9 |
| LAC30-1-6 | 30 | 1 | 6 | LAC40-1-12 | 40 | 1 | 12 |
| LAC30-1-9 | 30 | 1 | 9 | LAC40-1-15 | 40 | 1 | 15 |
| LAC30-1-12 | 30 | 1 | 12 | LAC40-12-0 | 40 | 12 | 0 |
| LAC30-1-15 | 30 | 1 | 15 | LAC40-12-3 | 40 | 12 | 3 |
| LAC30-1-18 | 30 | 1 | 18 | LAC40-12-6 | 40 | 12 | 6 |
| LAC30-1-21 | 30 | 1 | 21 | LAC40-12-9 | 40 | 12 | 9 |
| LAC30-1-24 | 30 | 1 | 24 | LAC40-12-12 | 40 | 12 | 12 |
| LAC30-1-27 | 30 | 1 | 27 | LAC40-12-15 | 40 | 12 | 15 |
| Specimen | σu/Mpa | Specimen | σu/Mpa | Specimen | σu/Mpa |
|---|---|---|---|---|---|
| LAC20-1-00 | 18.10 | LAC30-1-00 | 19.03 | LAC30-12-18 | 93.88 |
| LAC20-1-06 | 54.30 | LAC30-1-03 | 44.43 | LAC30-12-21 | 108.49 |
| LAC20-1-12 | 75.92 | LAC30-1-06 | 56.01 | LAC30-12-24 | 115.76 |
| LAC20-1-18 | 101.93 | LAC30-1-09 | 64.34 | LAC30-12-27 | 126.55 |
| LAC20-1-24 | 115.61 | LAC30-1-12 | 77.45 | LAC30-12-30 | 136.52 |
| LAC20-1-30 | 133.65 | LAC30-1-15 | 87.76 | LAC30-12-33 | 140.43 |
| LAC20-1-36 | 151.90 | LAC30-1-18 | 93.79 | LAC40-1-00 | 29.27 |
| LAC20-1-42 | 167.17 | LAC30-1-21 | 100.36 | LAC40-1-03 | 44.55 |
| LAC20-12-00 | 18.09 | LAC30-1-24 | 114.11 | LAC40-1-06 | 58.26 |
| LAC20-12-06 | 54.29 | LAC30-1-27 | 115.75 | LAC40-1-09 | 65.95 |
| LAC20-12-12 | 73.64 | LAC30-1-30 | 130.57 | LAC40-1-12 | 76.98 |
| LAC20-12-18 | 92.25 | LAC30-1-33 | 138.43 | LAC40-1-15 | 88.06 |
| LAC20-12-24 | 109.49 | LAC30-12-00 | 22.11 | LAC40-12-00 | 28.07 |
| LAC20-12-30 | 131.77 | LAC30-12-03 | 46.83 | LAC40-12-03 | 50.26 |
| LAC20-12-36 | 145.72 | LAC30-12-06 | 59.02 | LAC40-12-06 | 61.84 |
| LAC20-12-42 | 162.35 | LAC30-12-09 | 71.25 | LAC40-12-09 | 70.09 |
| LAC30-12-12 | 79.02 | LAC40-12-12 | 76.73 | ||
| LAC30-12-15 | 88.91 | LAC40-12-15 | 91.65 |
| Curve Branch | Confining Pressure Value | Fit Coefficient |
|---|---|---|
| Ascending Curve | 0 MPa < σw ≤ 3 MPa | α = 1.712 |
| 3 MPa < σw ≤ 9 MP | α = 2.043 | |
| σw > 9 MPa | α = 3.120 | |
| descending branch | 0 MPa < σw ≤ 3 MPa | β = 0.32 T + 0.548 (T = 1, 12) |
| 3 MPa < σw ≤ 9 MP | β = 0.474 | |
| σw > 9 MPa | descending branch |
Publisher’s Note: MDPI stays neutral with regard to jurisdictional claims in published maps and institutional affiliations. |
© 2022 by the authors. Licensee MDPI, Basel, Switzerland. This article is an open access article distributed under the terms and conditions of the Creative Commons Attribution (CC BY) license (https://creativecommons.org/licenses/by/4.0/).
Share and Cite
Ye, P.; Chen, Y.; Chen, Z.; Xu, J.; Wu, H. Failure Criteria and Constitutive Relationship of Lightweight Aggregate Concrete under Triaxial Compression. Materials 2022, 15, 507. https://doi.org/10.3390/ma15020507
Ye P, Chen Y, Chen Z, Xu J, Wu H. Failure Criteria and Constitutive Relationship of Lightweight Aggregate Concrete under Triaxial Compression. Materials. 2022; 15(2):507. https://doi.org/10.3390/ma15020507
Chicago/Turabian StyleYe, Peihuan, Yuliang Chen, Zongping Chen, Jinjun Xu, and Huiqin Wu. 2022. "Failure Criteria and Constitutive Relationship of Lightweight Aggregate Concrete under Triaxial Compression" Materials 15, no. 2: 507. https://doi.org/10.3390/ma15020507
APA StyleYe, P., Chen, Y., Chen, Z., Xu, J., & Wu, H. (2022). Failure Criteria and Constitutive Relationship of Lightweight Aggregate Concrete under Triaxial Compression. Materials, 15(2), 507. https://doi.org/10.3390/ma15020507