
Building and Breaking Bonds by Homogenous Nucleation in Glass-Forming Melts Leading to Transitions in Three Liquid States


Abstract

1. Introduction
2. The Homogeneous Nucleation
3. Exothermic or Endothermic Heats Observed above the Melting Temperature Tm
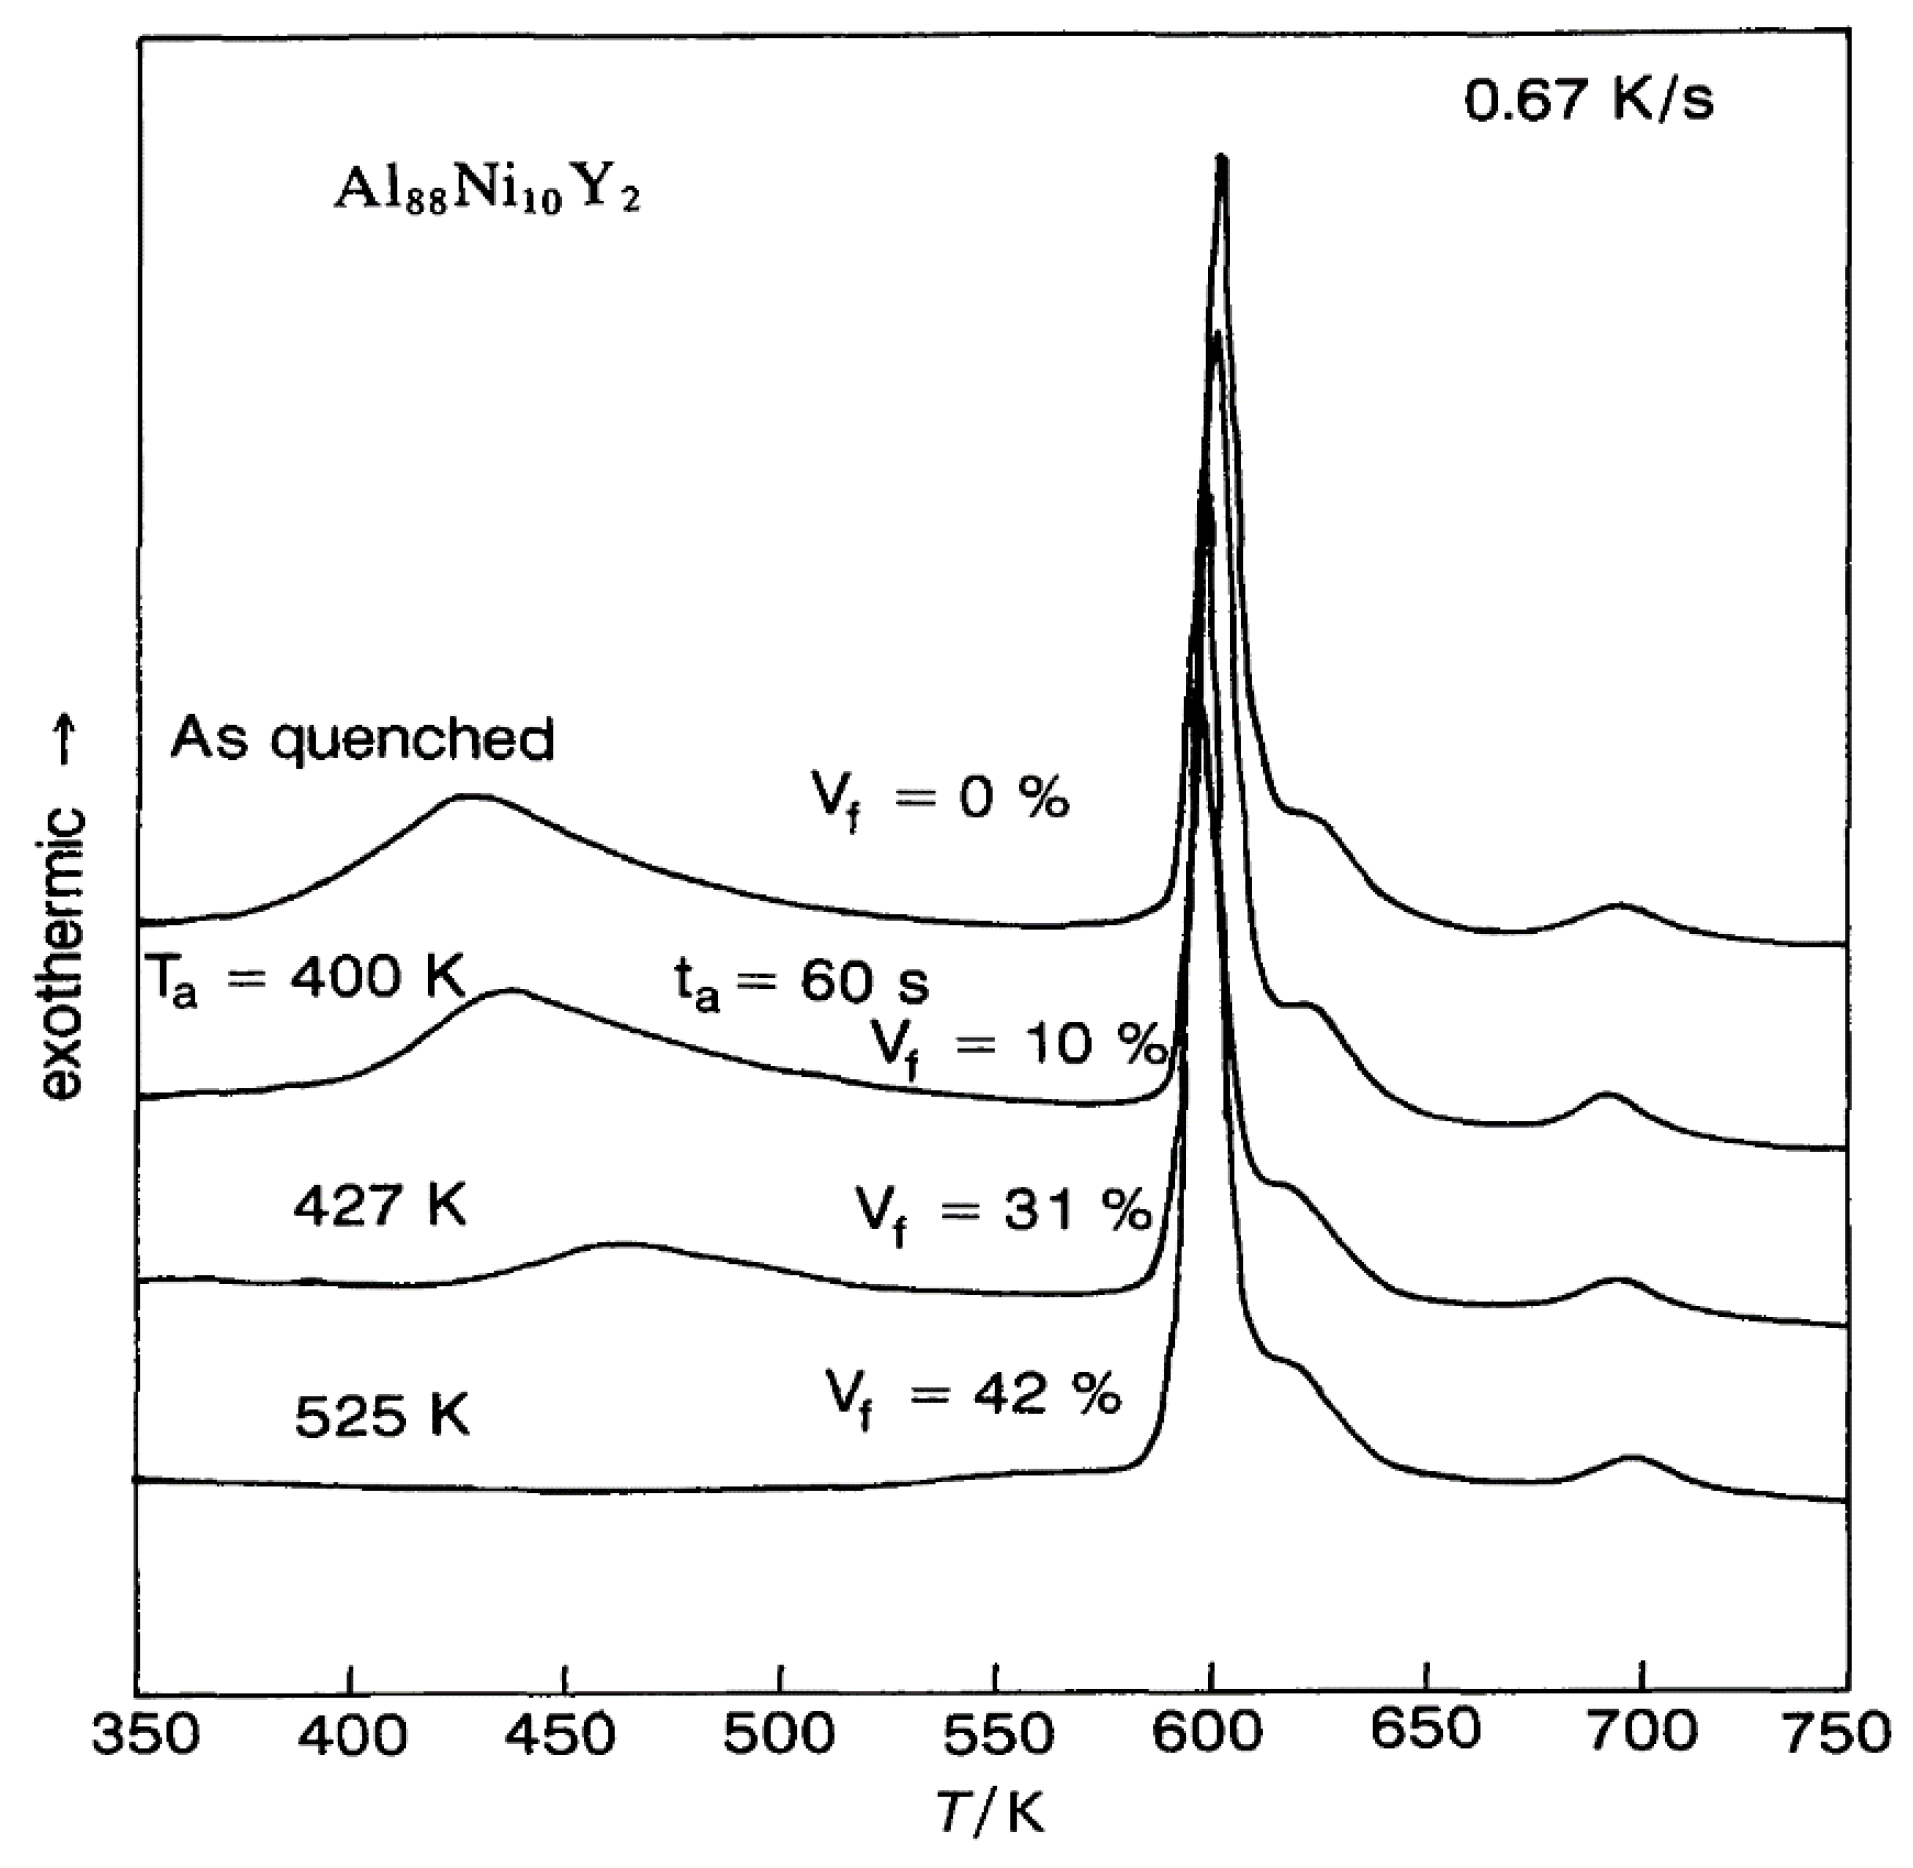
3.1. Exothermic Enthalpy Delivered at 688 K in Al88Ni10Y2 for Tm = 602 K
3.2. Exothermic Enthalpy Delivered at Tn+ = 1622 K in (Fe71.2B24Y4.8)96Nb4
3.3. Exothermic Enthalpy Delivered at 1835 K in Ni77.5B22.5.
3.4. Exothermic Enthalpy Delivered at 1356 K in Cu47.5Zr45.1Al7.4
3.5. Endothermic Enthalpy Recovered at 1453–1475 K in a Silicate Liquid
3.6. Endothermic Enthalpy Recovered at 1114 K in Zr41.2Ti13.8Cu12.5Ni10Be22.5 (Vit1)
3.7. Endothermic Enthalpy Recovered at 980–1000 K for Tm = 876–881 K in PdNiP Liquid Alloys
4. Predictions of Enthalpy Recovery Temperatures at Tn+ > Tm
4.1. Exothermic Enthalpy Delivered at Tn+ = 688 K in Al88Ni10Y2
4.2. Exothermic Enthalpy Delivered at Tn+ = 1622 K in (Fe71.2B24Y4.8)96Nb4
4.3. Exothermic Enthalpy Delivered at Tn+ = 1835 K in Ni77.5B22.5
4.4. Exothermic Enthalpy Delivered at Tn+ = 1356 K in Cu47.5Zr45.1Al7.4
4.5. Endothermic Enthalpy Recovered at Tn+ = 1470 K in a Silicate Liquid
4.6. Endothermic Enthalpy Recovered at Tn+ = 1114 K in Zr41.2Ti13.8Cu12.5Ni10Be22.5 (Vit1)
5. Three Liquid States above the Melting Temperature
6. First-Order Liquid–Liquid Transitions Observed in Pd42.5Ni42.5P15, La50Al35Ni15, and Fe2B
6.1. Pd42.5Ni42.5P15
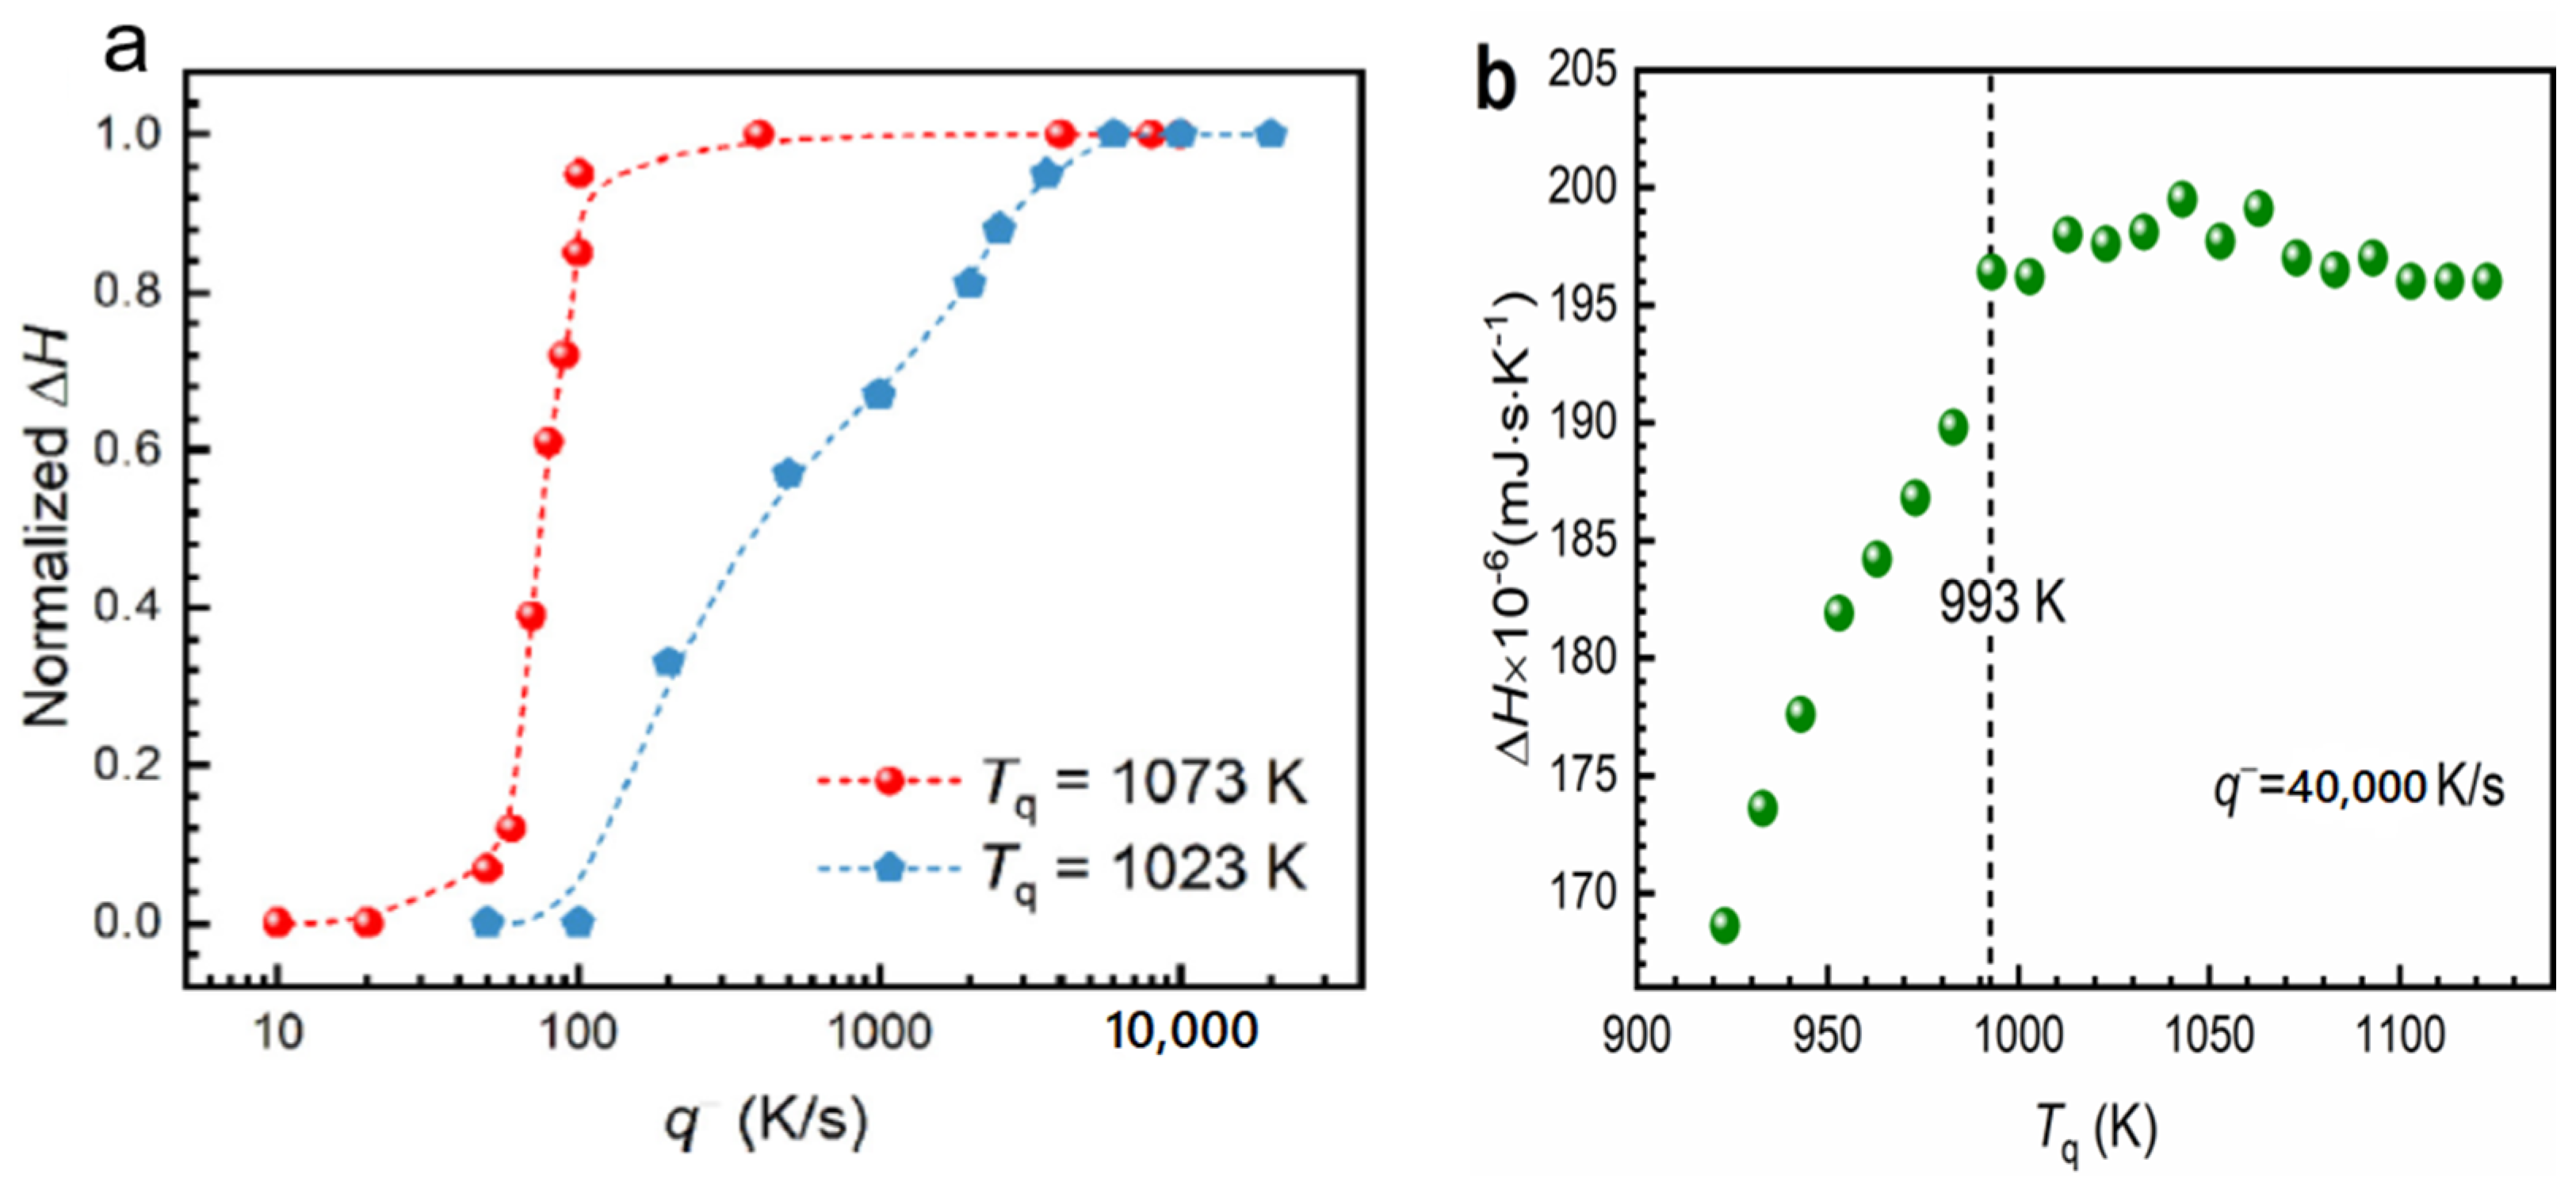
6.1.1. Fast Differential Scanning Calorimetry at 100 K/s
6.1.2. Melting Transition Observed at 993 K above the Solidus Temperature Tsol = 876 K of Pd42.5Ni42.5P15
6.1.3. First-Order Transition Observed by 31P Nuclear Magnetic Resonance (NMR)
6.2. La50Al35Ni15
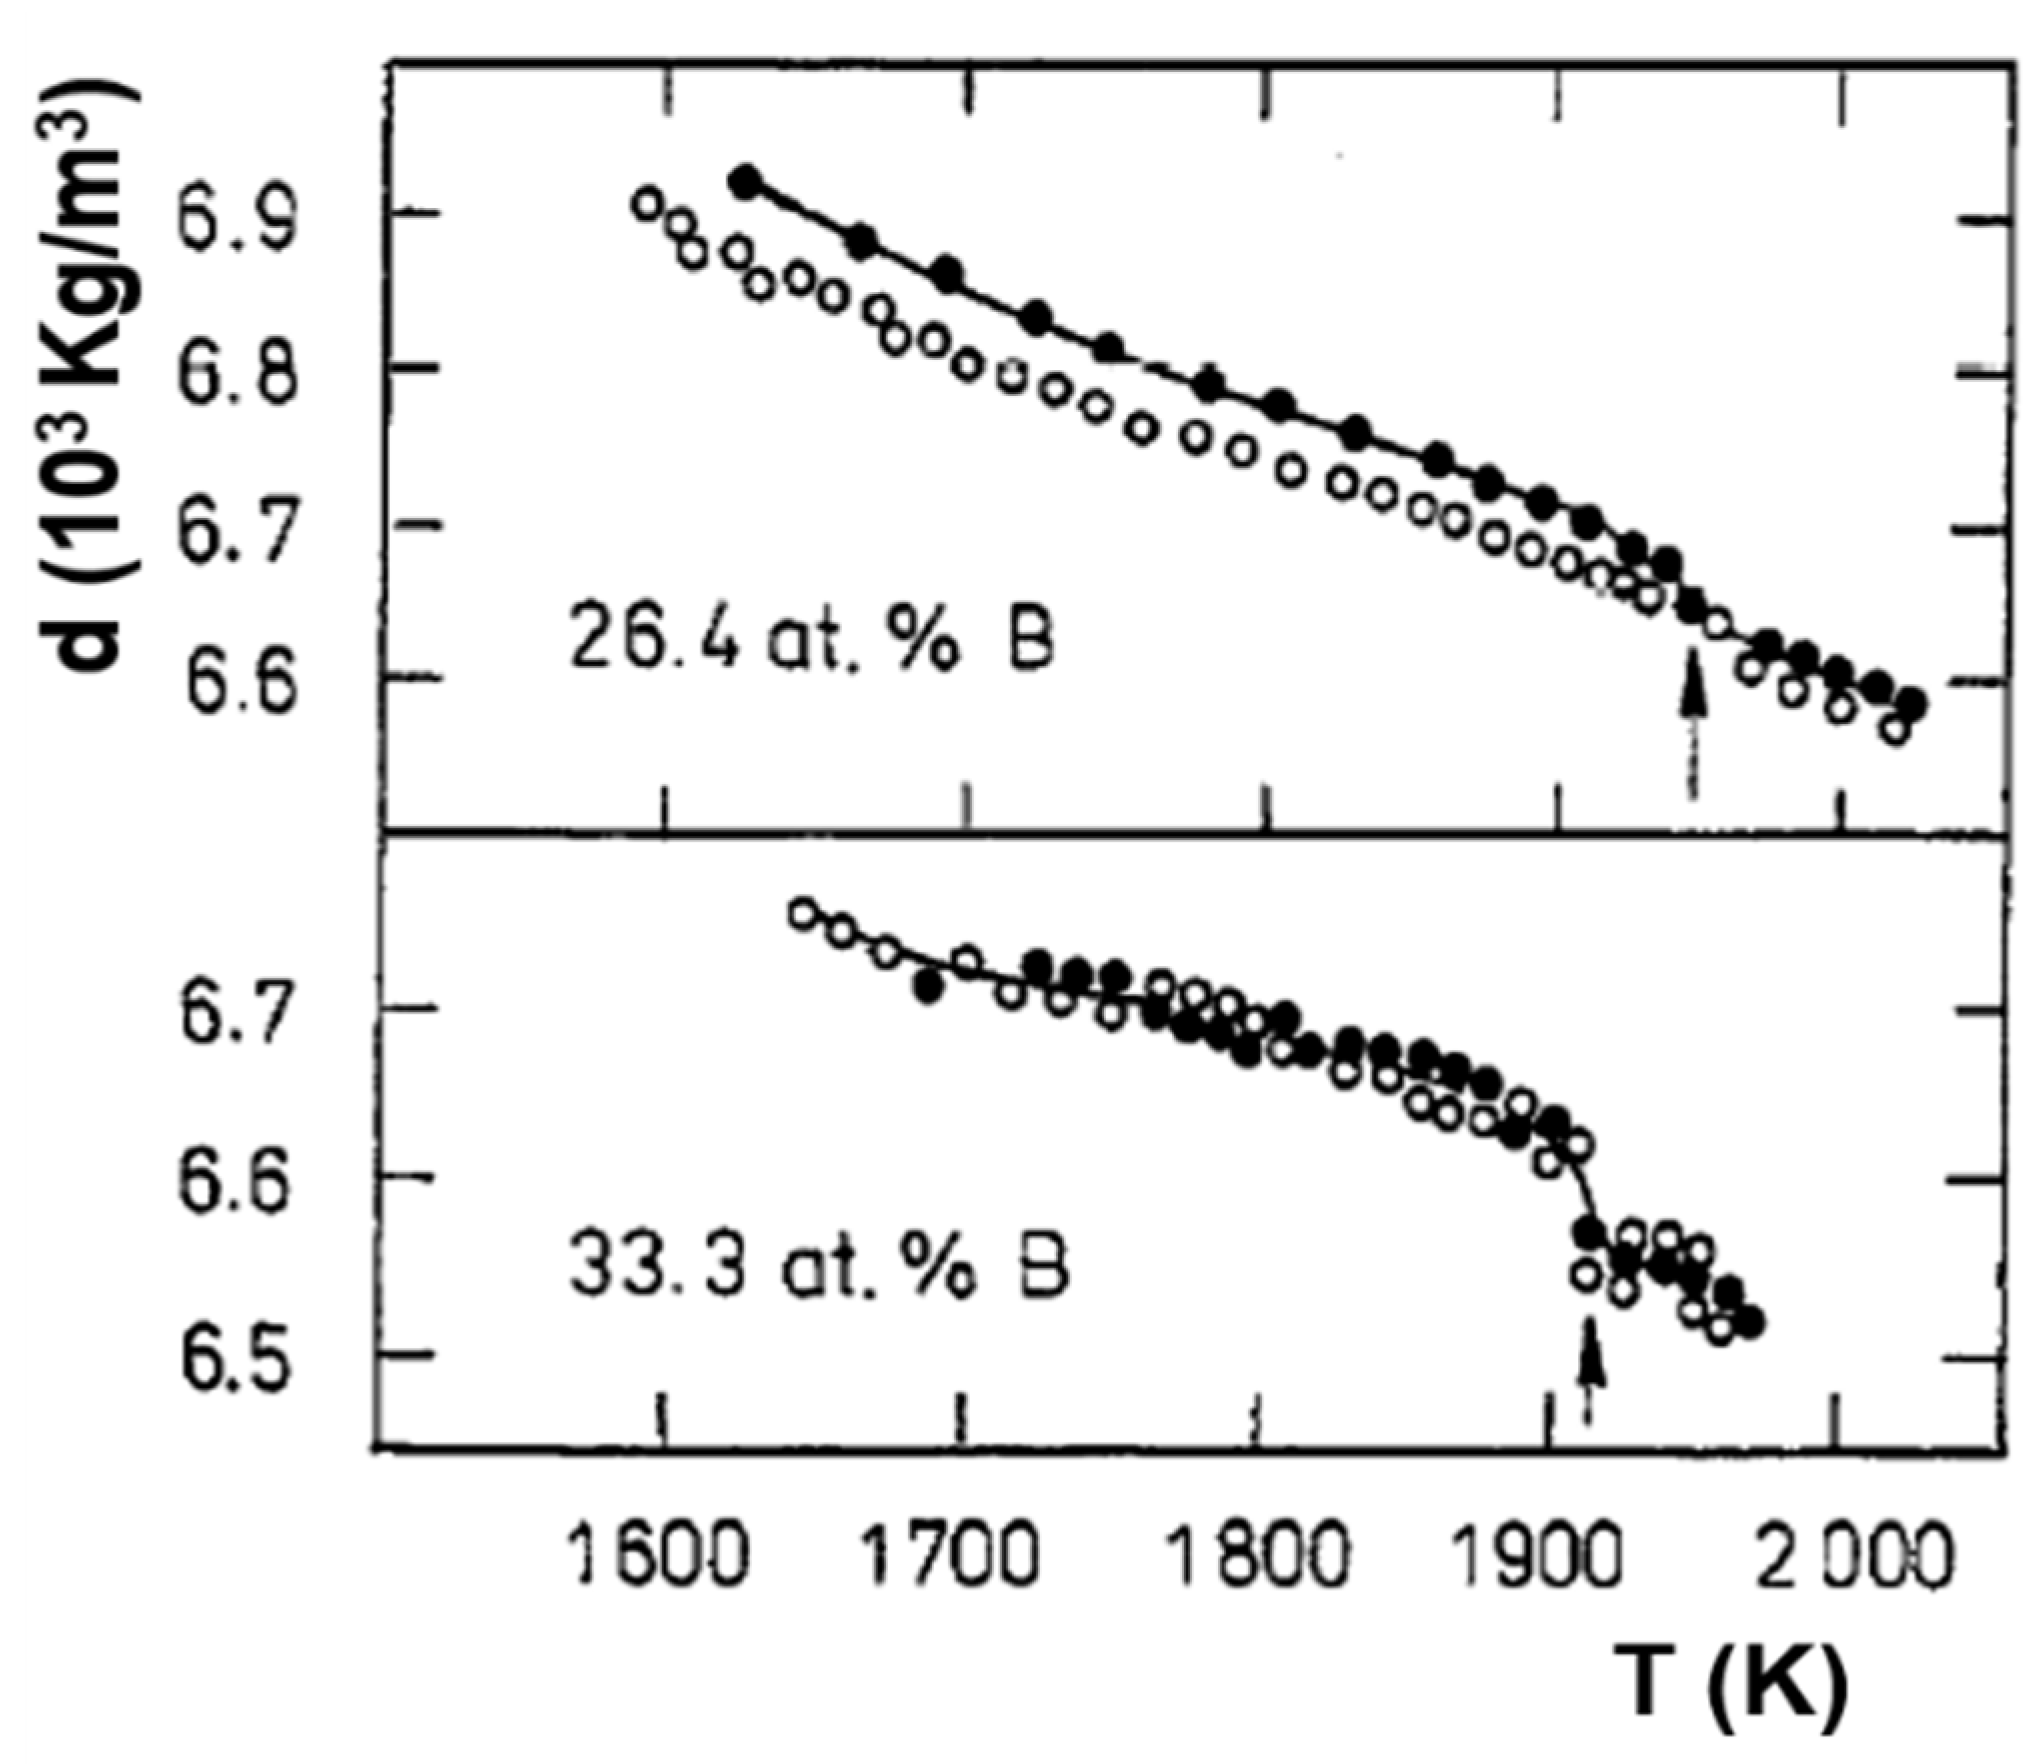
6.3. Fe2B
7. Predictions of First-Order Transition Temperatures by Homogenous Nucleation in Pd42.5Ni42.5P15, La50Al35Ni15 and Fe2B Melts
7.1. Predictions of Transitions in Pd42.5Ni42.5P15 Melt
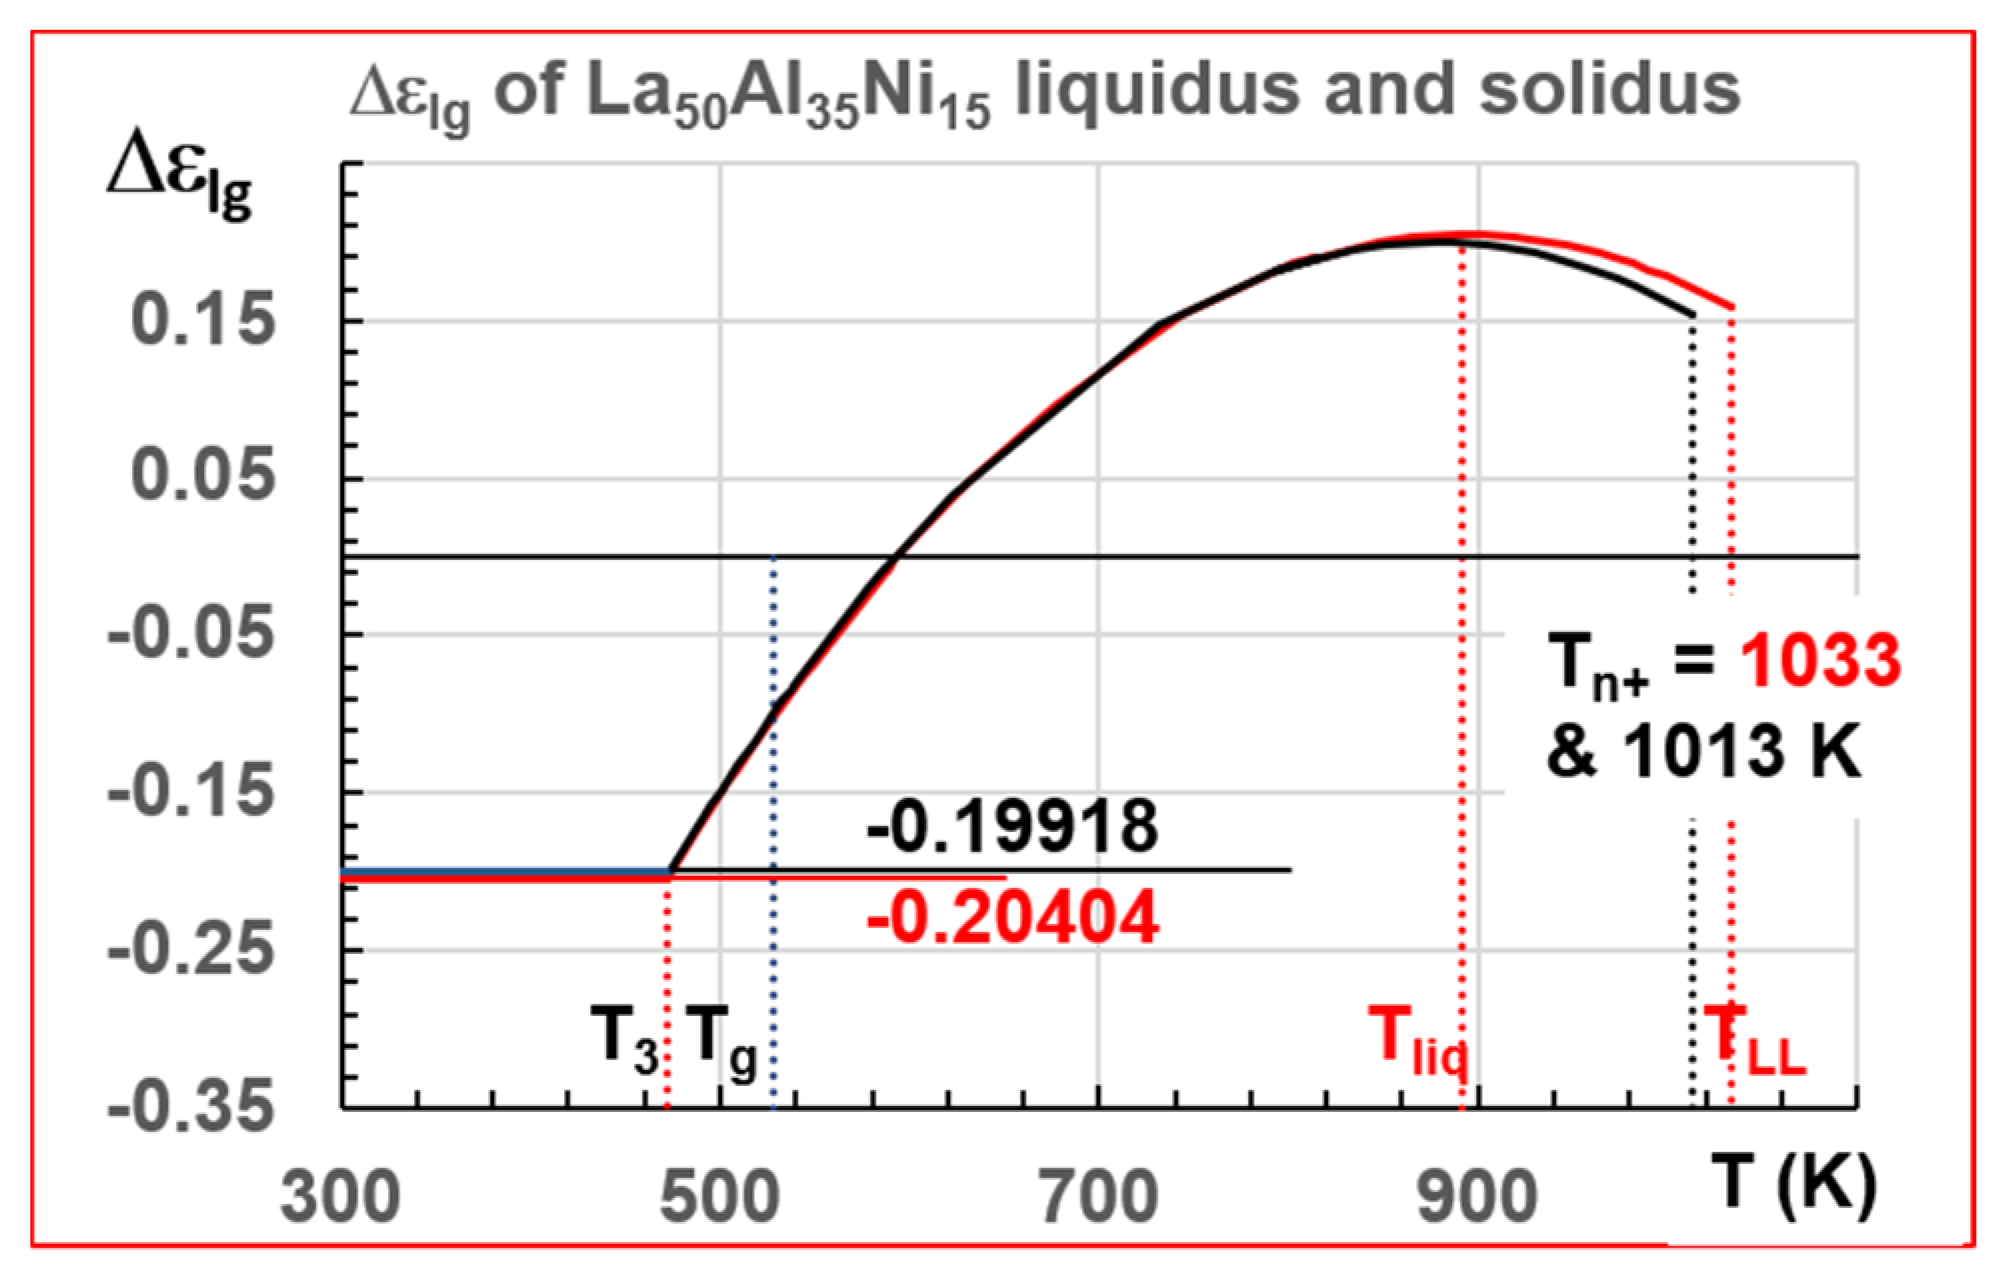
7.2. Predictions of First-Order Transitions in La50Al35Ni15 Glass-Forming Melt
7.3. Predictions of Glass Transition Temperature of Fe2B Melt
7.4. One Liquid–Liquid Transition at Tn+ = TLL in Congruent Materials and Two in the Others
8. Perspectives: Mpemba Effect and Bonding-Antibonding of Superatoms
8.1. Mpemba Effect and Its Inverse Relation to the Existence of Three Liquid States above the Melting Temperature
8.2. Three Liquid States Associated with Bonding–Antibonding of Superatoms
9. Conclusions
Author Contributions
Funding
Institutional Review Board Statement
Informed Consent Statement
Data Availability Statement
Acknowledgments
Conflicts of Interest
References
- De Rango, P.; Lees, M.; Lejay, P.; Sulpice, A.; Tournier, R.; Ingold, M.; Germi, P.; Pernet, M. Texturing of magnetic materials at high temperature by solidification in a magnetic field. Nature 1991, 349, 770–772. [Google Scholar] [CrossRef]
- Tournier, R.F.; Beaugnon, E. Texturing by cooling a metallic melt in a magnetic field. Sci. Technol. Adv. Mater. 2009, 10, 014501. [Google Scholar] [CrossRef]
- Porcar, L.; De Rango, P.; Bourgault, D.; Tournier, R.F. Magnetic Texturing of High-Tc Superconductors; Gabovitch, A., Ed.; BoD-Books on demand: Norderstedt, Germany, 2012; p. 171. [Google Scholar]
- Turnbull, D. Kinetics of solidification of supercooled liquid mercury. J. Chem. Phys. 1952, 20, 411. [Google Scholar] [CrossRef]
- Vinet, P.; Magnusson, L.; Frederikssen, H.; Desré, P.J. Correlations between surface and interface energies with respect to crystal nucleation. J. Colloid Interf. Sci. 2002, 255, 363–374. [Google Scholar] [CrossRef]
- Tournier, R.F. Presence of intrinsic growth nuclei in overheated and undercooled liquid elements. Phys. B 2007, 392, 79–91. [Google Scholar] [CrossRef]
- Tournier, R.F. Influence of Fermi energy equalization on crystal nucleation in glass melts. J. Alloys Comp. 2009, 483, 94–96. [Google Scholar] [CrossRef]
- Tournier, R.F. Thermodynamic origin of the vitreous transition. Materials 2011, 4, 869–892. [Google Scholar] [CrossRef]
- Tournier, R.F. Fragile-to-fragile liquid transition at Tg and stable-glass phase nucleation rate maximum at the Kauzmann temperature. Phys. B 2014, 454, 253–271. [Google Scholar] [CrossRef]
- Wool, R.P. Twinkling fractal theory of the glass transition. J. Polym. Sci. Part B Polym. Phys. 2008, 46, 2765–2778. [Google Scholar] [CrossRef]
- Wool, R.P.; Campanella, A. Twinkling fractal theory of the glass transition: Rate dependence and time-temperature superposition. J. Polym. Sci. Part B Polym. Phys. 2009, 47, 2578–2589. [Google Scholar] [CrossRef]
- Stanzione, J.F., III; Strawhecker, K.E.; Wool, R.P. Observing the twinkling nature of the glass transition. J. Non-Cryst. Sol. 2011, 357, 311. [Google Scholar] [CrossRef]
- Ojovan, M.I.; Travis, K.P.; Hand, R.J. Thermodynamic parameters of bonds in in glassy materials from viscosity temperature relationships. J. Phys. Cond. Matter. 2007, 19, 415107. [Google Scholar] [CrossRef] [PubMed]
- Ojovan, M.I.; Lee, W.E. Connectivity and glass transition in disordered oxide systems. J. Non-Cryst. Sol. 2010, 356, 2534–2540. [Google Scholar] [CrossRef]
- Ojovan, M.I. Ordering and structural changes at the glass-liquid transition. J. Non-Cryst. Sol. 2013, 382, 79. [Google Scholar] [CrossRef]
- Ojovan, M.I. Louzguine Luzgin, D.V. Revealing structural changes at glass transition via radial distribution functions. J. Phys. Chem. B. 2020, 124, 3186–3194. [Google Scholar] [CrossRef] [PubMed]
- Sanditov, D.S.; Ojovan, M.I.; Darmaev, M.V. Glass transition criterion and plastic deformation of glass. Phys. B 2020, 582, 411914. [Google Scholar] [CrossRef]
- Tournier, R.F.; Ojovan, M.I. Undercooled Phase Behind the Glass Phase with Superheated Medium-Range Order above Glass Transition Temperature. Phys. B 2021, 602, 412542. [Google Scholar] [CrossRef]
- Tournier, R.F.; Ojovan, M.I. Dewetting temperatures of prefrozen and grafted layers in ultrathin films viewed as melt-memory effects. Phys. B 2021, 611, 412796. [Google Scholar] [CrossRef]
- Xu, W.; Sandor, M.T.; Yu, Y.; Ke, H.-B.; Zhang, H.-B.; Li, M.-Z.; Wang, M.-Z.; Liu, L.; Wu, Y. Evidence of liquid-liquid transition in glass-forming La50Al35Ni15 melt above liquidus temperature. Nat. Commun. 2015, 6, 7696. [Google Scholar] [CrossRef]
- Chen, E.-Y.; Peng, S.-X.; Peng, L.; Michiel, M.D.; Vaughan, G.B.M.; Yu, Y.; Yu, H.-B.; Ruta, B.; Wei, S.; Liu, L. Glass-forming ability correlated with the liquid-liquid transition in Pd42.5Ni42.5P15 alloy. Scr. Mater. 2021, 193, 117–121. [Google Scholar] [CrossRef]
- Tanaka, H. Liquid-liquid transition and polyamorphism. J. Chem. Phys. 2020, 153, 130901. [Google Scholar] [CrossRef] [PubMed]
- Popel, P.S.; Chikova, O.A.; Matveev, V.M. Metastable colloidal states of liquid metallic solutions. High Temp. Mater. Proc. 1995, 4, 219–233. [Google Scholar] [CrossRef]
- Popel, P.S.; Sidorov, V.E. Microheterogeneity of liquid metallic solutions and its influence on the structure and propertes of rapidly quenched alloys. Mater. Sci. Eng. 1997, A226-2289, 237–244. [Google Scholar] [CrossRef]
- Dahlborg, U.; Calvo-Dahlborg, M.; Popel, P.S.; Sidorov, V.R. Structure and properties of some glass-forming liquid alloys. Eur. Phys. J. 2000, B14, 639–648. [Google Scholar] [CrossRef]
- Manov, V.; Popel, P.; Brook-Levinson, F.; Molokanov, V.; Calvo-Dahlborg, M.; Dahlborg, U.; Sidorov, V.; Son, L.; Tarakanov, Y. Influence of the treatment of melt on the properties of amorphous materials: Ribbons, bulks and glass coated microwires. Mater. Sci. Eng. 2001, A304–A306, 54–60. [Google Scholar] [CrossRef]
- Popel, P.; Dahlborg, U.; Calvo-Dahlborg, M. On the existence of metastable microheterogeneities in metallic melts. IOP Conf. Ser. Mater. Sci. Eng. 2017, 192, 012012. [Google Scholar] [CrossRef]
- Yang, B.; Perepezko, J.H.; Schmelzer, J.W.P.; GaO, Y.; Schick, C. Dependence of crystal nucleation on prior liquid overheating by differential fast scanning calorimeter. J. Chem. Phys. 2014, 140, 104513. [Google Scholar] [CrossRef]
- He, Y.; Li, J.; Wang, J.; Kou, H.; Beaugnon, E. Liquid-liquid structure transition and nucleation in undercooled Co-B eutectic alloys. Appl. Phys. A 2017, 123, 391. [Google Scholar] [CrossRef]
- Adams, G.; Gibbs, J.H. On the temperatutre dependence of cooperative relaxation properties in glass-forming liquids. J. Chem. Phys. 1965, 43, 139. [Google Scholar] [CrossRef]
- Liu, C.-Y.; He, J.; Keunings, R.; Bailly, C. New linearized relation for the universal viscosity-temperature behavior of polymer melts. Macromolecules 2006, 39, 8867–8869. [Google Scholar] [CrossRef]
- Tournier, R.F. Thermodynamic and kinetic origin of the vitreous transition. Intermetallics 2012, 30, 104–110. [Google Scholar] [CrossRef]
- Tournier, R.F. Predicting glass-to-glass and liquid-to-liquid phase transitions in supercooled water using classical nucleation theory. Chem. Phys. 2018, 500, 45–53. [Google Scholar] [CrossRef]
- Tournier, R.F. Homogeneous nucleation of phase transformations in supercooled water. Phys. B 2020, 579, 411895. [Google Scholar] [CrossRef]
- Tournier, R.F. First-order transitions in glasses and melts induced by solid superclusters nucleated by homogeneous nucleation instead of surface melting. Chem. Phys. 2019, 524, 40–54. [Google Scholar] [CrossRef]
- Angell, C.A.; Rao, K.J. Configurational excitations in condensed matter and the “bond lattice”. Model for the liquid-glass transition. J. Chem. Phys. 1972, 57, 470–481. [Google Scholar] [CrossRef]
- Iwashita, T.; Micholson, D.M.; Egami, T. Elementary excitations and crossover phenomenon in liquids. Phys. Rev. Lett. 2013, 110, 205504. [Google Scholar] [CrossRef] [PubMed]
- Ozhovan, M.I. Topological characteristics of bonds in SiO2 and GeO2 oxide systems at glass-liquid transition. J. Exp. Theor. Phys. 2006, 103, 819–829. [Google Scholar] [CrossRef]
- Benigni, P. Coupling of phase diagrams and thermochemistry. Calphad 2021, 72, 102228. [Google Scholar]
- Wunderlich, B. Study of the change in specific heat of monomeric and polymeric glasses during the glass transition. J. Chem. Phys. 1960, 64, 1052. [Google Scholar] [CrossRef]
- Kim, Y.H.; Kiraga, K.; Inoue, A.; Masumoto, T.; Jo, H.H. Crystallization and high mechanical strength of Al-based amorphous alloys. Mater. Trans. 1994, 35, 293–302. [Google Scholar] [CrossRef]
- Hu, Q.; Sheng, H.C.; Fu, M.W.; Zeng, X.R. Influence of melt temperature on the Invar effect in (Fe71.2B.024Y4.8)96Nb4 bulk metallic glasses. J. Mater. Sci. 2019, 48, 6900–6906. [Google Scholar]
- Jiang, H.-R.; Bochtler, B.; Riegler, S.S.; Wei, X.-S.; Neuber, N.; Frey, M.; Gallino, I.; Busch, R.; Shen, J. Thermodynamic and kinetic studies of the Cu-Zr-Al(-Sn) bulk metallic glasses. J. Alloys Comp. 2020, 844, 156126. [Google Scholar] [CrossRef]
- Yue., Y. Experimental evidence for the existence of an ordered structure in a silicate liquid above its liquidus temperature. J. Non-Cryst. Sol. 2004, 345–346, 523–527. [Google Scholar] [CrossRef]
- Wei, S.; Yang, F.; Bednarcik, J.; Kaban, I.; Shuleshova, O.; Meyer, A.; Busch, R. Liquid-liquid transition in a strong bulk metallic glass-forming liquid. Nat. Commun. 2013, 4, 2083. [Google Scholar] [CrossRef] [PubMed]
- Way, C.; Wadhwa, P.; Busch, R. The influence of shear rate and temperature on the viscosity and fragility of the Zr41.2Ti13.8Cu12.5Ni10.0Be22.5 metallic-glass-forming liquid. Acta Mater. 2007, 55, 2977–2983. [Google Scholar] [CrossRef]
- Lan, L.; Ren, Y.; Wei, X.Y.; Wang, B.; Gilbert, E.P.; Shibayama, T.; Watanabe, S.; Ohnuma, M.; Wang, X.-L. Hidden amorphous phase and reentrant supercooled liquid in Pd-Ni-P metallic glass. Nat. Commun. 2017, 8, 14679. [Google Scholar] [CrossRef]
- Tournier, R.F. Glass phase and other multiple liquid-to-liquid transitions resulting from two-liquid competition. Chem. Phys. Lett. 2016, 665, 64–70. [Google Scholar] [CrossRef]
- Wang, L.-M.; Borick, S.; Angell, C.A. An electrospray technique for hyperquenched glass calorimetry studies: Propylene glycol and di-n-butylphthalate. J. Non-Cryst. Sol. 2007, 353, 3829–3837. [Google Scholar] [CrossRef]
- Hornboll, L.; Yue, Y. Enthalpy relaxation in hyperquenched glasses of different fragility. J. Non-Cryst. Sol. 2008, 354, 1832–1870. [Google Scholar] [CrossRef]
- Hu, L.; Zhang, C.; Yue, Y. Thermodynamic anomaly of the sub-Tg relaxation in hyperquenched metallic glasses. J. Chem. Phys. 2013, 138, 174508. [Google Scholar] [CrossRef]
- Passamani, F.C.; Tagarro, J.R.B.; Lareka, C.; Fernades, A.A.R. Thermal studies and magnetic properties of mechanical alloyed Fe2B. J. Phys. Cond. Mater. 2002, 14, 1975–1983. [Google Scholar] [CrossRef]
- Tournier, R.F. Crystallization of supercooled liquid elements induced by superclusters containing magic atom numbers. Metals 2014, 4, 359–387. [Google Scholar] [CrossRef]
- Mpemba, E.B.; Osborne, D.G. Cool? Phys. Educ. 1969, 4, 172–175. [Google Scholar] [CrossRef]
- Aristotle; Ross, W.D. Aristotle’s Metaphysics; Clarendon: Oxford, UK, 1923. [Google Scholar]
- Takaiwa, D.; Atano, I.; Koga, K.; Tanaka, H. Phase diagram of water in carbon nanotubes. PNAS 2008, 105, 39–43. [Google Scholar] [CrossRef] [PubMed]
- Raju, M.; Van Duin, A. Phase transitions of ordered ice in graphene nanocapillaries and carbon nanotubes. Sci. Rep. 2018, 8, 3851. [Google Scholar] [CrossRef] [PubMed]
- Nie, G.X.; Huang, J.Y.; Huang, J.P. Melting-freezing transition of monolayer water confined by phosphorene plates. J. Phys. Chem. B 2016, 120, 9011–9018. [Google Scholar] [CrossRef]
- Lu, Z.; Raz, O. Nonequilibrium thermodynamics of the markovian Mpemba effect and its inverse. PNAS 2017, 114, 5883–5888. [Google Scholar] [CrossRef]
- Kumar, A.; Bechhoefer, J. Exponentially faster cooling in a colloidal system. Nature 2020, 584, 64–68. [Google Scholar] [CrossRef]
- Kuzmin, V.I.; Tytik, D.L.; Belashchenko, D.K.; Sirenko, A.V. Structure of silver cluster with magic numbers of atoms by data of molecular thermodynamics. Colloid. J. 2008, 70, 284–296. [Google Scholar] [CrossRef]
- Wu, Q.; Xu, C.; Wu, X.; Cheng, L. Evidence for the super-atom bonding from bond energies. ACS Omega. 2018, 3, 14425–14430. [Google Scholar]
- Koley, S.; Cui, J.Y.; Panfil, E.; Banin, U. Coupled colloidal quantum dot molecules. Account Chem. Phys. 2021, in press. [Google Scholar] [CrossRef] [PubMed]


Publisher’s Note: MDPI stays neutral with regard to jurisdictional claims in published maps and institutional affiliations. |
© 2021 by the authors. Licensee MDPI, Basel, Switzerland. This article is an open access article distributed under the terms and conditions of the Creative Commons Attribution (CC BY) license (https://creativecommons.org/licenses/by/4.0/).
Share and Cite
Tournier, R.F.; Ojovan, M.I. Building and Breaking Bonds by Homogenous Nucleation in Glass-Forming Melts Leading to Transitions in Three Liquid States. Materials 2021, 14, 2287. https://doi.org/10.3390/ma14092287
Tournier RF, Ojovan MI. Building and Breaking Bonds by Homogenous Nucleation in Glass-Forming Melts Leading to Transitions in Three Liquid States. Materials. 2021; 14(9):2287. https://doi.org/10.3390/ma14092287
Chicago/Turabian StyleTournier, Robert F., and Michael I. Ojovan. 2021. "Building and Breaking Bonds by Homogenous Nucleation in Glass-Forming Melts Leading to Transitions in Three Liquid States" Materials 14, no. 9: 2287. https://doi.org/10.3390/ma14092287
APA StyleTournier, R. F., & Ojovan, M. I. (2021). Building and Breaking Bonds by Homogenous Nucleation in Glass-Forming Melts Leading to Transitions in Three Liquid States. Materials, 14(9), 2287. https://doi.org/10.3390/ma14092287