
Investigation of Molten Metal Infiltration into Micropore Carbon Refractory Materials Using X-ray Computed Tomography

 ,
, 
Abstract
1. Introduction
2. Materials and Methods
2.1. Materials
2.2. Hot Metal Penetration Test and Its Modification
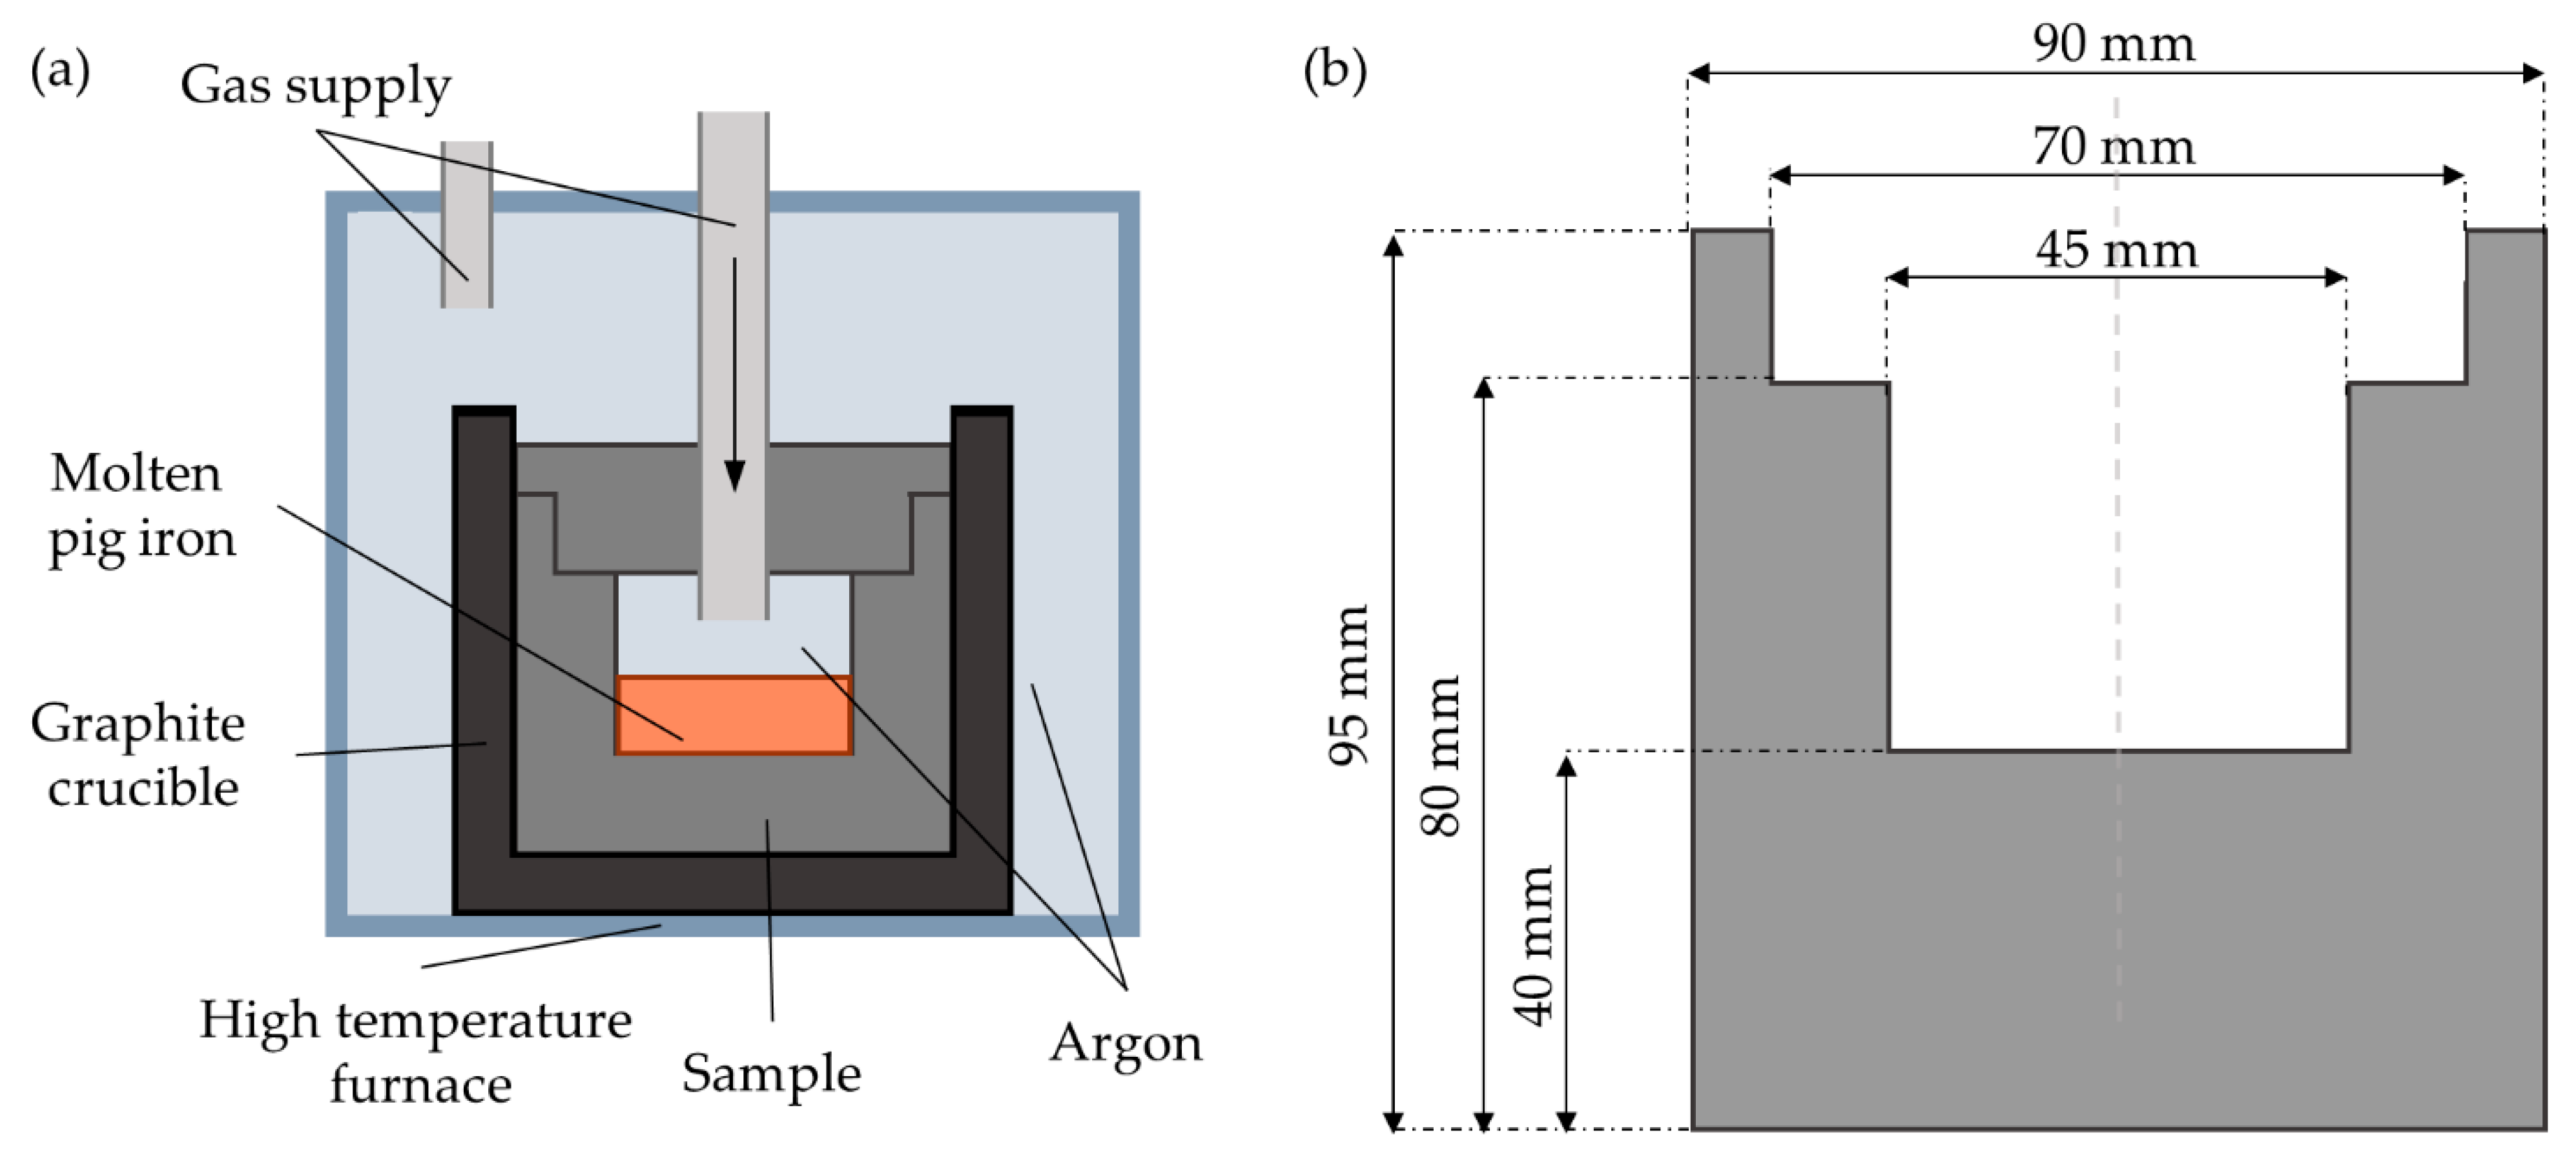
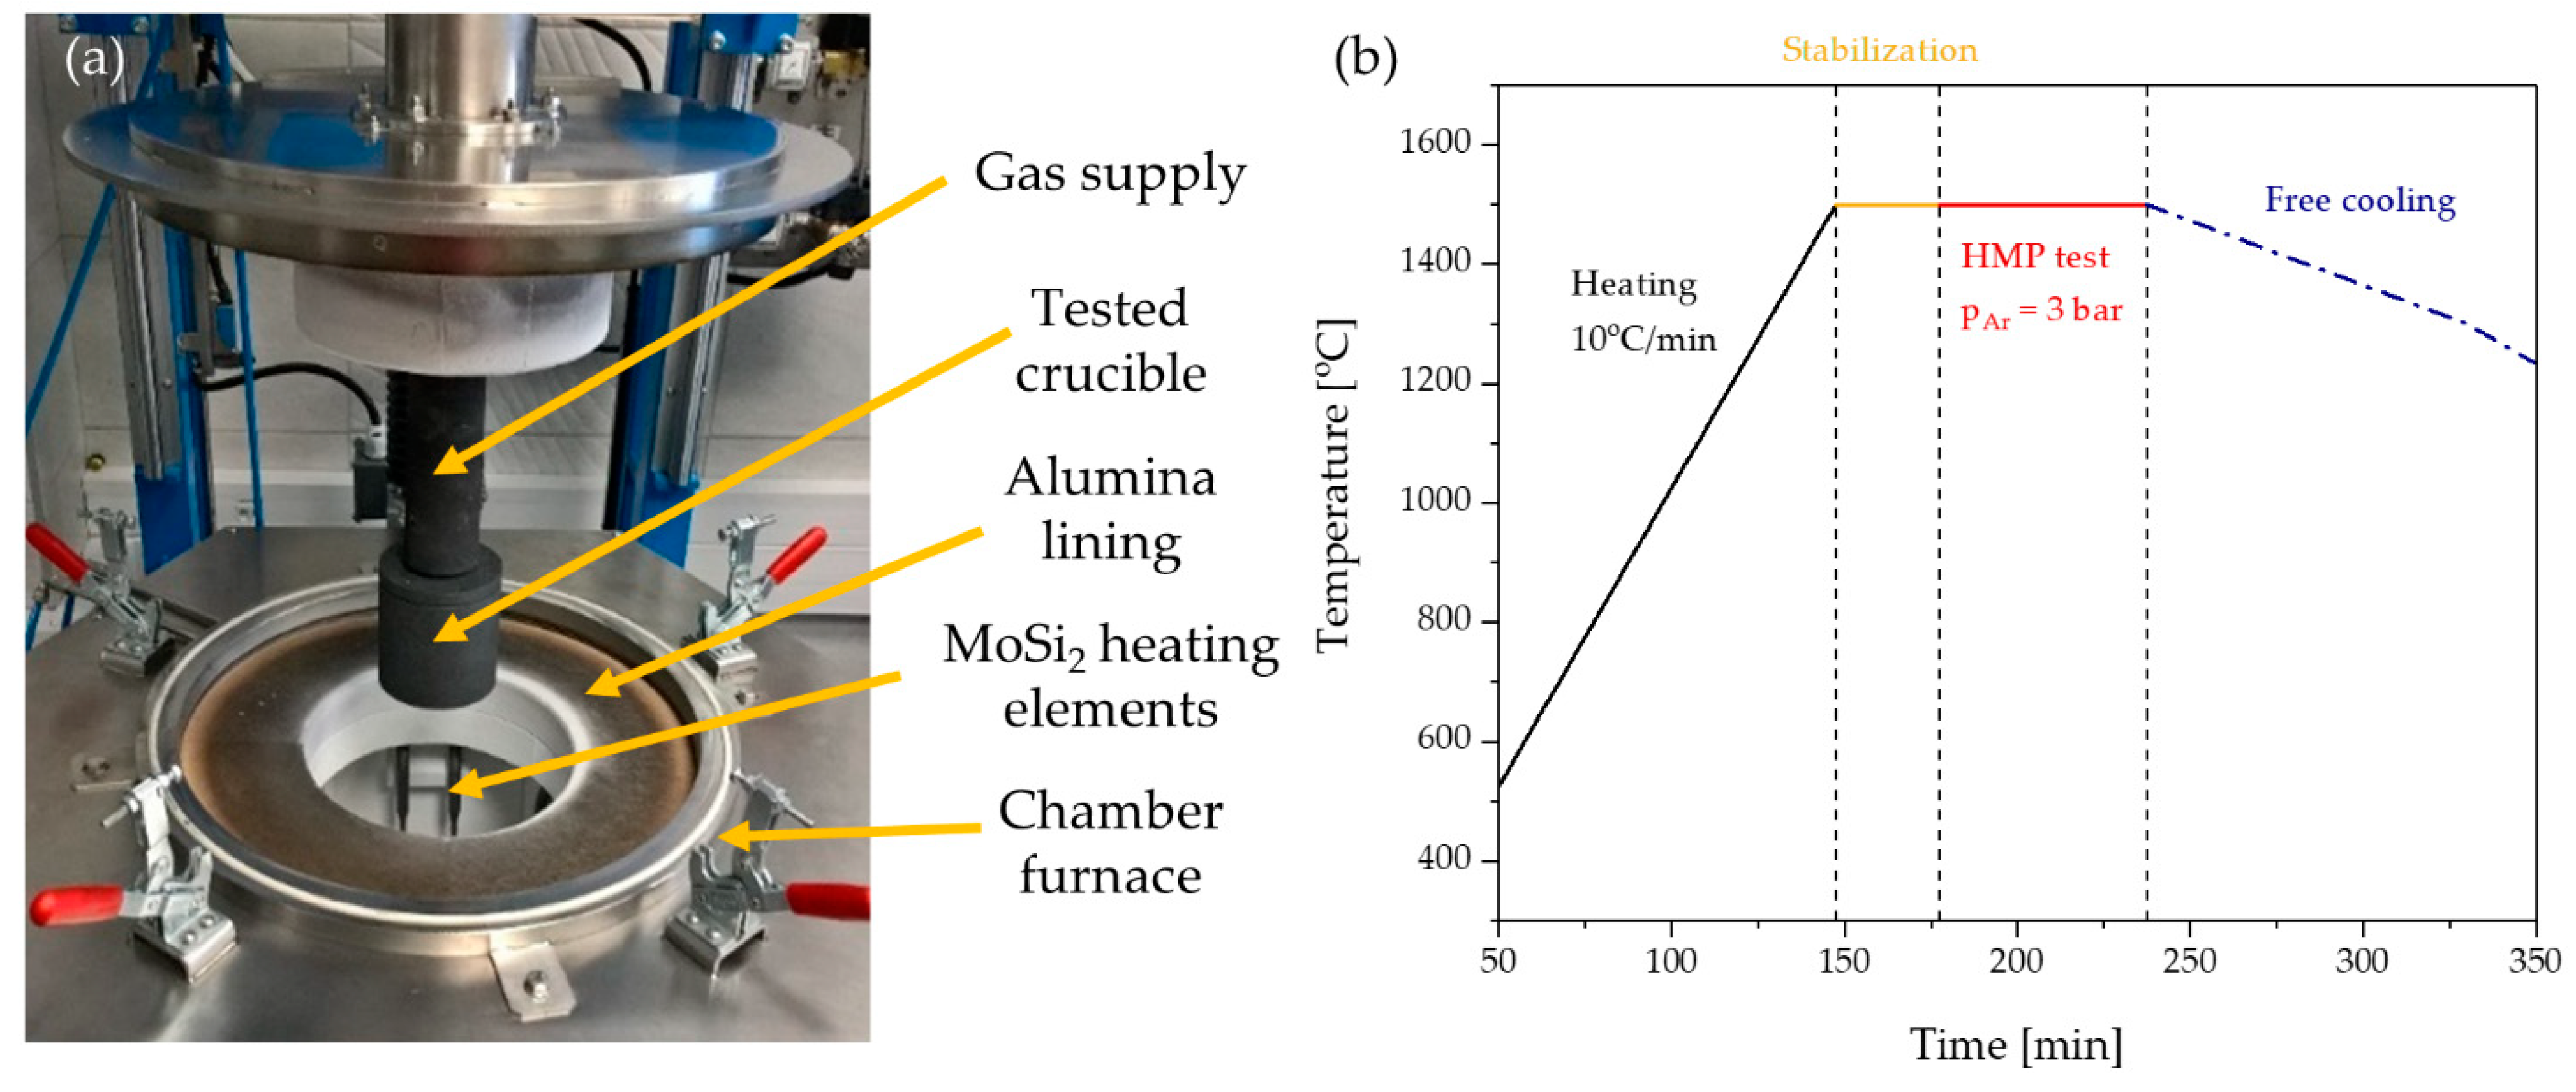
2.2.1. Standard HMP Test
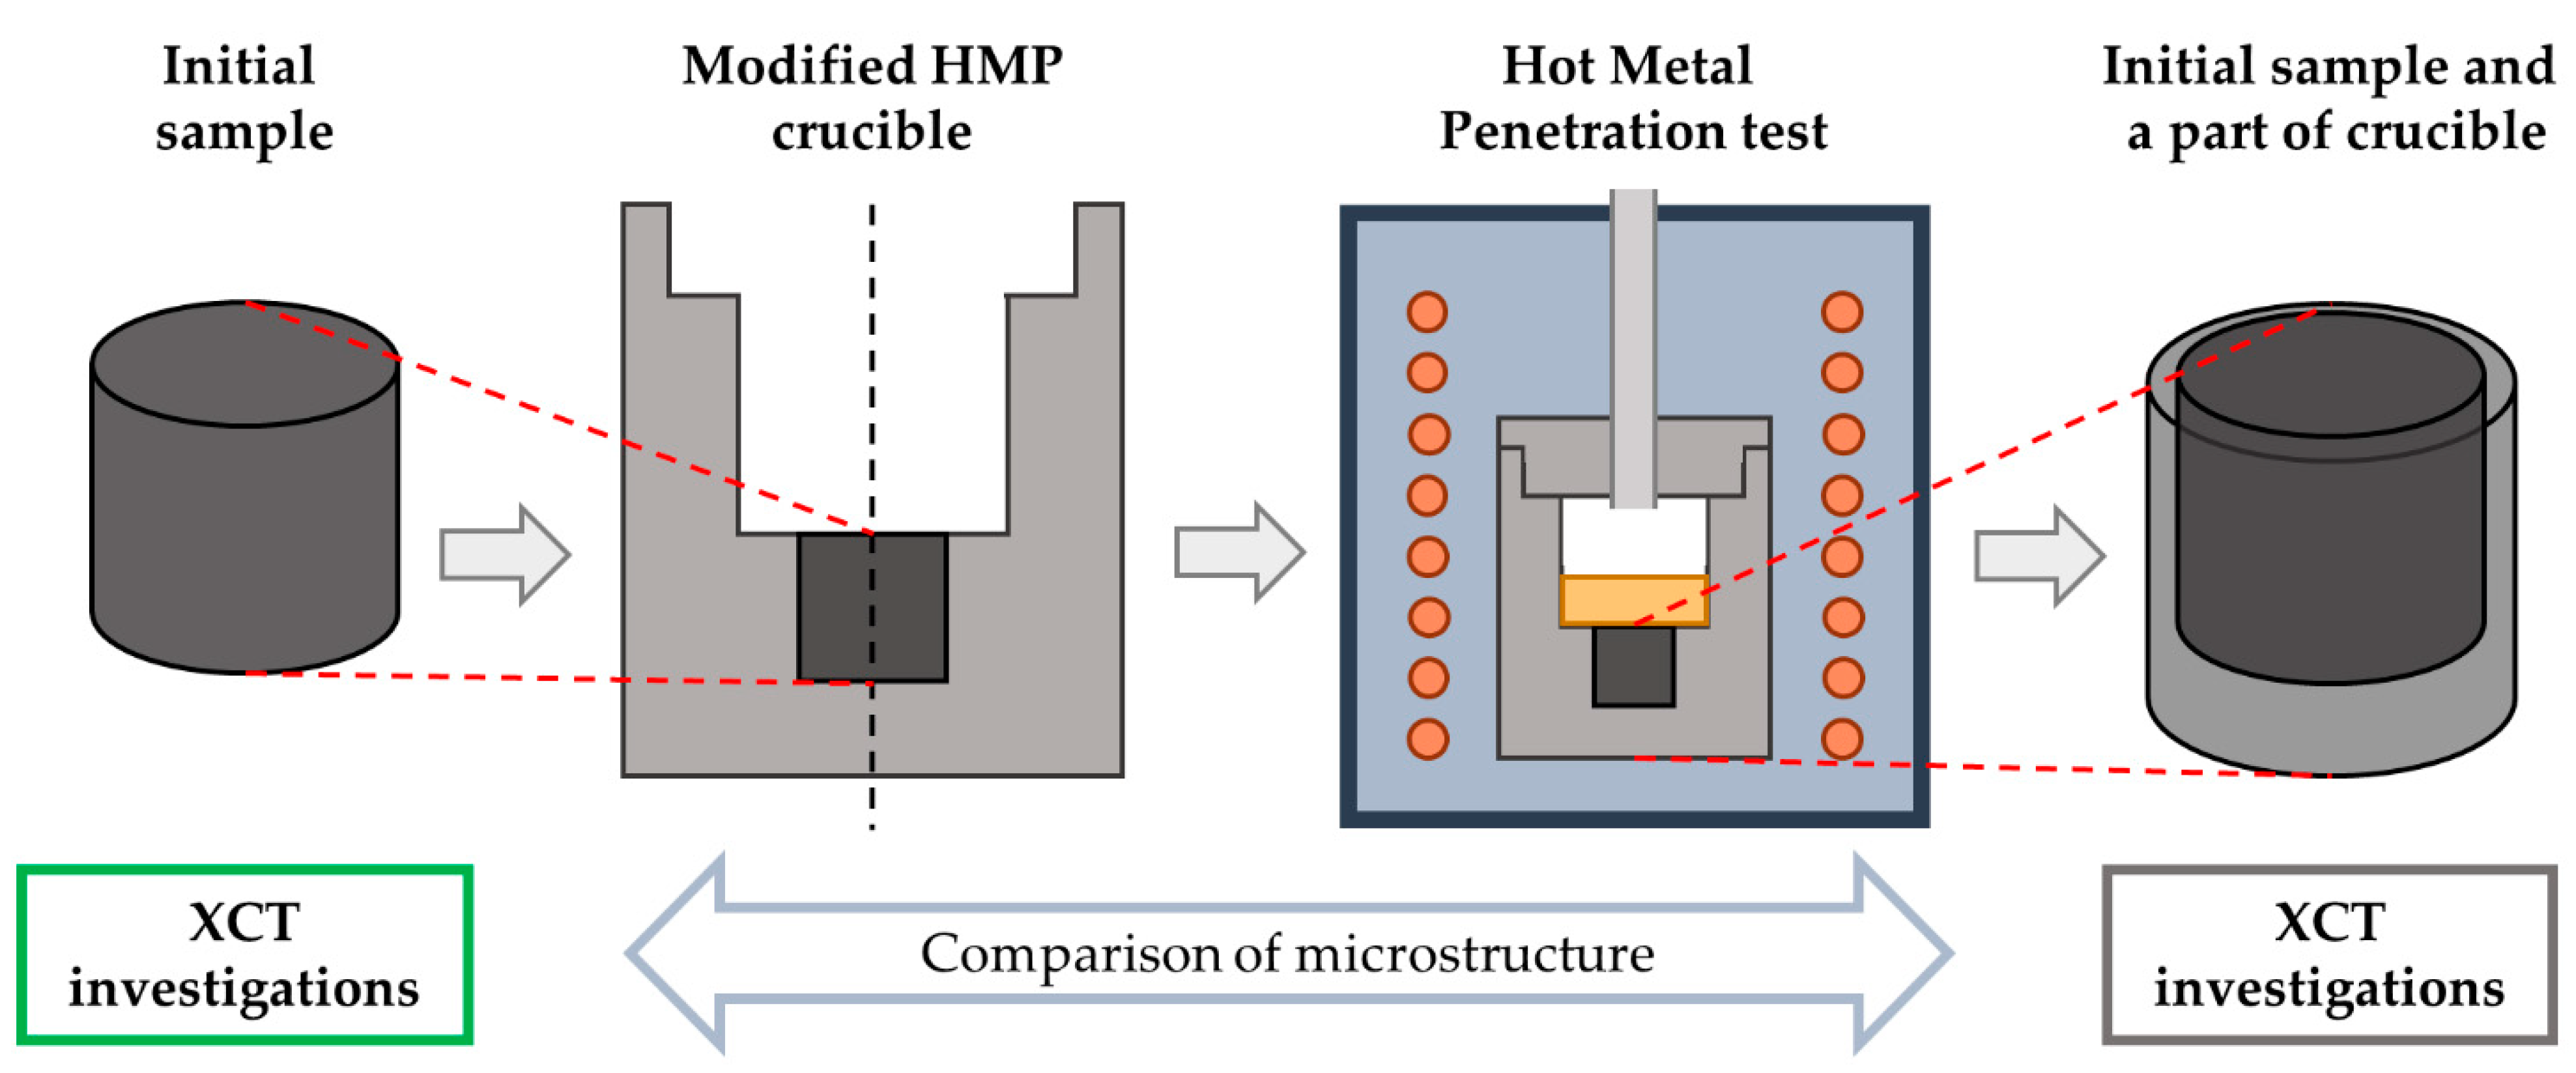
2.2.2. Modification—XCT–HMP Test
2.3. X-ray Computed Tomography
2.3.1. X-ray Computed Tomography (XCT) Measurements
2.3.2. Processing of XCT Data
2.4. Microstructure and Chemical Composition Analysis
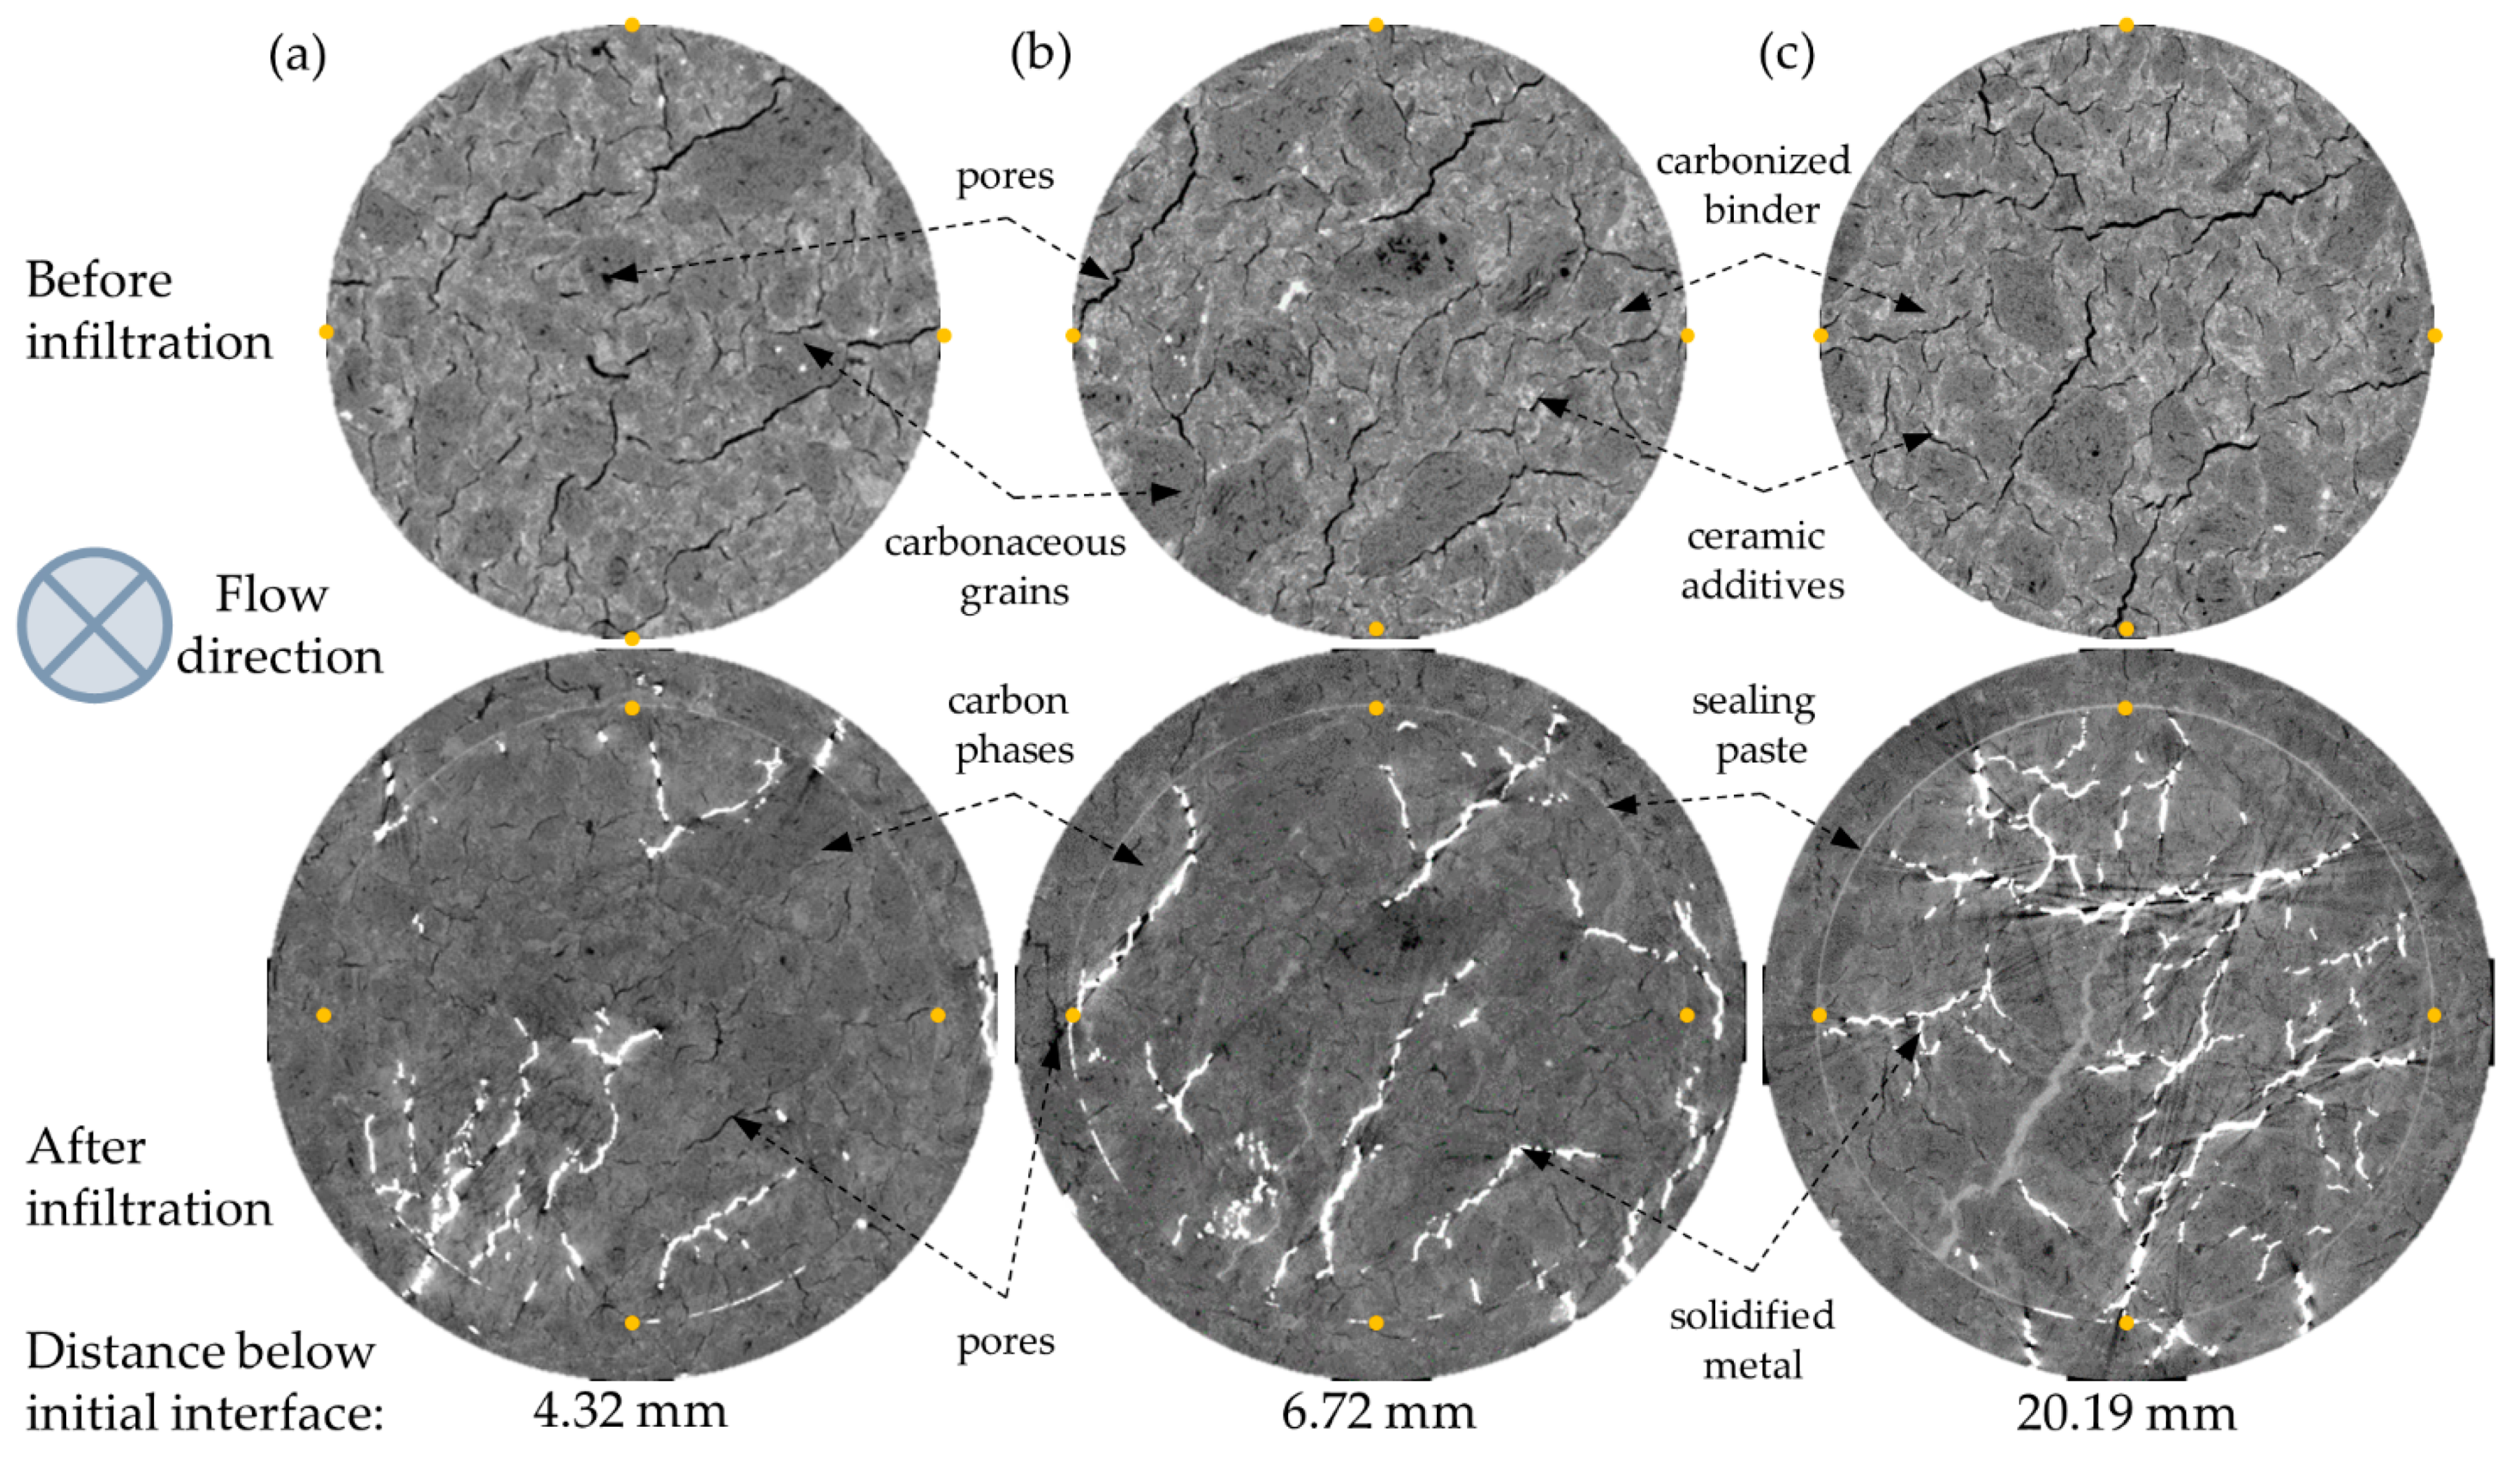
3. Results
4. Discussion and Conclusions
Supplementary Materials
Author Contributions
Funding
Institutional Review Board Statement
Informed Consent Statement
Data Availability Statement
Acknowledgments
Conflicts of Interest
References
- Kawoka, K.; Tsuda, A.; Matsuoka, Y.; Nishioka, K.; Anan, K.; Kakiuchi, K.; Takeshida, H.; Takasaki, H. Latest blast furnace relining technology at Nippon Steel. Nippon Steel Tech. Rep. 2006, 94, 127–132. [Google Scholar]
- Silva, S.N.; Vernilli, F.; Justus, S.M.; Marques, O.R.; Mazine, A.; Baldo, J.B.; Longo, E.; Varela, J.A. Wear mechanism for blast furnace hearth refractory lining. Ironmak. Steelmak. 2005, 32, 459–467. [Google Scholar] [CrossRef]
- Raipala, K. On Hearth Phenomena and Hot Metal Content in a Blast Furnace. Ph.D. Thesis, Helsinki University of Technology, Espoo, Finland, 2003. [Google Scholar]
- Joubert, H. Analysis of Blast Furnace Lining/Cooling Systems Using Computational Fluid Dynamics. Master’s Thesis, Rand Afrikaans University, Johannesburg, South Africa, 1997. [Google Scholar]
- Dzermejko, A.J.; Baret, D.F.; Hubble, D.H. Ironmaking refractory systems. In Making, Shaping and Treating of Steel–Ironmaking, 11th ed.; The AISE Steel Foundation: Pittsburgh, PA, USA, 1991; Volume 2, pp. 229–258. [Google Scholar]
- Silva, S.N.; Vernilli, F.; Justus, S.M.; Longo, E.; Baldo, J.B.; Varela, J.A.; Lopes, J.M.G. A methodology to investigate the wear of blast furnace hearth carbon refractory lining. Mater. Corros. 2012, 64, 1032–1038. [Google Scholar] [CrossRef]
- Deng, Y.; Lyu, Q.; Zhang, J.; Jiao, K. Erosion of Carbon Brick by Zinc in Hearth of Blast Furnace. ISIJ Int. 2020, 60, 226–232. [Google Scholar] [CrossRef]
- Swarup, D.; Sataravala, R.P. Deterioration of Blast Furnace Linings by the Action of Carbon Monoxide. Trans. Indian Ceram. Soc. 1943, 2, 15–31. [Google Scholar] [CrossRef]
- Deng, Y.; Zhang, J.; Jiao, K. Dissolution mechanism of carbon brick into molten metal. ISIJ Int. 2018, 58, 815–822. [Google Scholar] [CrossRef]
- Xilai, C.; Li, Y.; Li, Y.; Sang, S.; Lei, Z.; Jin, S.; Li, S.; Ge, S. Effect of carbon aggregates on the properties of carbon refractories for a blast furnace. Metall. Mater. Trans. B 2013, 41, 420–429. [Google Scholar]
- Kowalski, W.; Lüngen, H.; Stricker, K. State of the art for prolonging blast furnace campaigns. Revue Métallurgie 2000, 97, 493–505. [Google Scholar] [CrossRef]
- Shinotake, A.; Nakamura, H.; Yadoumaru, N.; Morizane, Y.; Meguro, M. Investigation of Blast-furnace Hearth Sidewall Erosion by Core Sample Analysis and Consideration of Campaign Operation. ISIJ Int. 2003, 43, 321–330. [Google Scholar] [CrossRef]
- De Almeida, B.V.; Neves, E.S.; Silva, S.N.; Junior, F.V. Blast Furnace Hearth Lining: Post Mortem Analysis. Mater. Res. 2017, 20, 814–818. [Google Scholar] [CrossRef][Green Version]
- Lee, W.E.; Zhang, S. Melt corrosion of oxide and oxide–carbon refractories. Int. Mater. Rev. 1999, 44, 77–104. [Google Scholar] [CrossRef]
- Torrkulla, J.; Saxe, H. Model of the state of the blast furnace hearth. ISIJ Int. 2000, 40, 438–447. [Google Scholar] [CrossRef]
- Internal Tokai COBEX procedures—Hot Metal Penetration test. 2014.
- Stec, J. Develop/Evaluate a Hot Metal Penetration Test for Furnace Lining Materials. Master’s Thesis, AGH University of Science and Technology, Kraków, Poland, 2015. [Google Scholar]
- Wejrzanowski, T.; Gluch, J.; Ibrahim, S.H.; Cwieka, K.; Milewski, J.; Zschech, E. Characterization of Spatial Distribution of Electrolyte in Molten Carbonate Fuel Cell Cathodes. Adv. Eng. Mater. 2018, 20, 1700909. [Google Scholar] [CrossRef]
- Chuaypradit, S.; Puncreobutr, C.; Phillion, A.B.; Fife, J.L.; Lee, P.D. Quantifying the Effects of Grain Refiner Addition on the Solidification of Fe-Rich Intermetallics in Al–Si–Cu Alloys Using In Situ Synchrotron X-ray Tomography. In Proceedings of the International Conference on Martensitic Transformations; Springer International Publishing: Chicago, IL, USA, 2018; pp. 1067–1073. [Google Scholar] [CrossRef]
- Echlin, M.P.; Mottura, A.; Wang, M.; Mignone, P.J.; Riley, D.P.; Franks, G.V.; Pollock, T.M. Three-dimensional characterization of the permeability of W-Cu composites using a new “TriBeam” technique. Acta Mater. 2014, 64, 307–315. [Google Scholar] [CrossRef]
- Ibrahim, S.H.; Skibinski, J.; Oliver, G.; Wejrzanowski, T. Microstructure effect on the permeability of the tape-cast open-porous materials. Mater. Des. 2019, 167, 107639. [Google Scholar] [CrossRef]
- Weber, E.; Fernandez, M.; Wapner, P.; Hoffman, W. Comparison of X-ray micro-tomography measurements of densities and porosity principally to values measured by mercury porosimetry for carbon–carbon composites. Carbon 2010, 48, 2151–2158. [Google Scholar] [CrossRef]
- Shanti, N.O.; Chan, V.W.; Stock, S.R.; De Carlo, F.; Thornton, K.; Faber, K.T. X-ray micro-computed tomography and tortuosity calculations of percolating pore networks. Acta Mater. 2014, 71, 126–135. [Google Scholar] [CrossRef]
- Holzer, L.; Wiedenmann, D.; Münch, B.; Keller, L.; Prestat, M.; Gasser, P.; Robertson, I.; Grobéty, B. The influence of constric-tivity on the effective transport properties of porous layers in electrolysis and fuel cells. J. Mater. Sci. 2013, 48, 2934–2954. [Google Scholar] [CrossRef]
- Stec, J.; Tarasiuk, J.; Nagy, S.; Smulski, R.; Gluch, J.; Filipek, R. Non-destructive investigations of pore morphology of micropore carbon materials. Ceram. Int. 2019, 45, 3483–3491. [Google Scholar] [CrossRef]
- Rørvik, S.; Lossius, L.P. Measurement of tortuosity of anode porosity by 3D micro X-ray computed tomography. Light Met. 2017, 2–5. [Google Scholar]
- Rørvik, S.; Lossius, L.P. Characterization of prebaked anodes by micro X-ray computed tomography. Light Met. 2017, 1237–1245. [Google Scholar]
- Steenkamp, J.; Joalet, D.; Pistorius, P.C.; Tangstad, M. Wear Mechanisms of Carbon-Based Refractory Materials in Silicomanganese Tap Holes—Part I: Equilibrium Calculations and Slag and Refractory Characterization. Met. Mater. Trans. A 2015, 46, 653–667. [Google Scholar] [CrossRef][Green Version]
- Baux, A.; Goillot, A.; Jacques, S.; Heisel, C.; Rochais, D.; Charpentier, L.; David, P.; Piquero, T.; Chartier, T.; Chollon, G. Synthesis and properties of macroporous SiC ceramics synthesized by 3D printing and chemical vapor infiltration/deposition. J. Eur. Ceram. Soc. 2020, 40, 2834–2854. [Google Scholar] [CrossRef]
- Zhou, Y.; Zheng, Y.; Pan, J.; Sui, L.; Xing, F.; Sun, H.; Li, P. Experimental investigations on corrosion resistance of innovative steel-FRP composite bars using X-ray microcomputed tomography. Compos. Part. B Eng. 2019, 161, 272–284. [Google Scholar] [CrossRef]
- Quiney, Z.; Weston, E.; Nicholson, P.I.; Pattison, S.; Bache, M.R. Volumetric assessment of fatigue damage in a SiCf/SiC ce-ramic matrix composite via in situ X-ray computed tomography. J. Eur. Ceram. Soc. 2020, 40, 3788–3794. [Google Scholar] [CrossRef]
- Qiu, Q.; Zhu, J.; Dai, J.-G. In-situ X-ray microcomputed tomography monitoring of steel corrosion in engineered cementitious composite (ECC). Constr. Build. Mater. 2020, 262, 120844. [Google Scholar] [CrossRef]
- Hiltmann, F.; Daimer, J.; Hohl, B.; Nowak, R.; Tomala, J. Cathode Quality Improvement by Application of an Intensive Ho-mogenizer for Green Mix Preparation. Light Met. 2004, 593–596. [Google Scholar]
- Feldkamp, L.A.; Davis, L.C.; Kress, J.W. Practical one-beam algorithm. J. Opt. Soc. Am. 1984, 1, 612–619. [Google Scholar] [CrossRef]
- Volume Graphic GmbH. Available online: http://www.volumegraphics.com/en/products/vgstudio-max/ (accessed on 16 December 2020).
- Abràmoff, M.D.; Magalhães, P.J.; Ram, S.J. Image processing with Image. J. Biophotonics Int. 2004, 11, 36–41. [Google Scholar]
- Dougherty, R.; Kunzelmann, K.-H. Computing Local Thickness of 3D Structures with Image. J. Microsc. Microanal. 2007, 13, 1678–1679. [Google Scholar] [CrossRef]
- Simpleware ScanIP. Available online: https://www.synopsys.com/simpleware/software/scanip.html/ (accessed on 21 January 2021).
- Stec, J. 3D Pore Structure and Infiltration Resistance of Micropore Carbon Materials. Ph.D. Thesis, AGH University of Science and Technology. Wydawnictwo Naukowe AKAPIT, Kraków, Poland, 2020. [Google Scholar]
- Stock, S.R. Microcomputed Tomography. Methodology and Applications; CRC Press: Boca Raton, FL, USA, 2009. [Google Scholar]
- Stec, J.; Smulski, R.; Nagy, S.; Szyszkiewicz-Warzecha, K.; Tomala, J.; Filipek, R. Permeability of carbon refractory materials used in a blast furnace hearth. Ceram. Int. 2021, 47, 16538–16546. [Google Scholar] [CrossRef]


| Crude Iron Composition [wt.%] | |||||||
|---|---|---|---|---|---|---|---|
| Fe | C | Si | Mn | P | S | Ti | Zn |
| 94.619 | 4.780 | 0.400 | 0.085 | 0.073 | 0.024 | 0.014 | 0.005 |
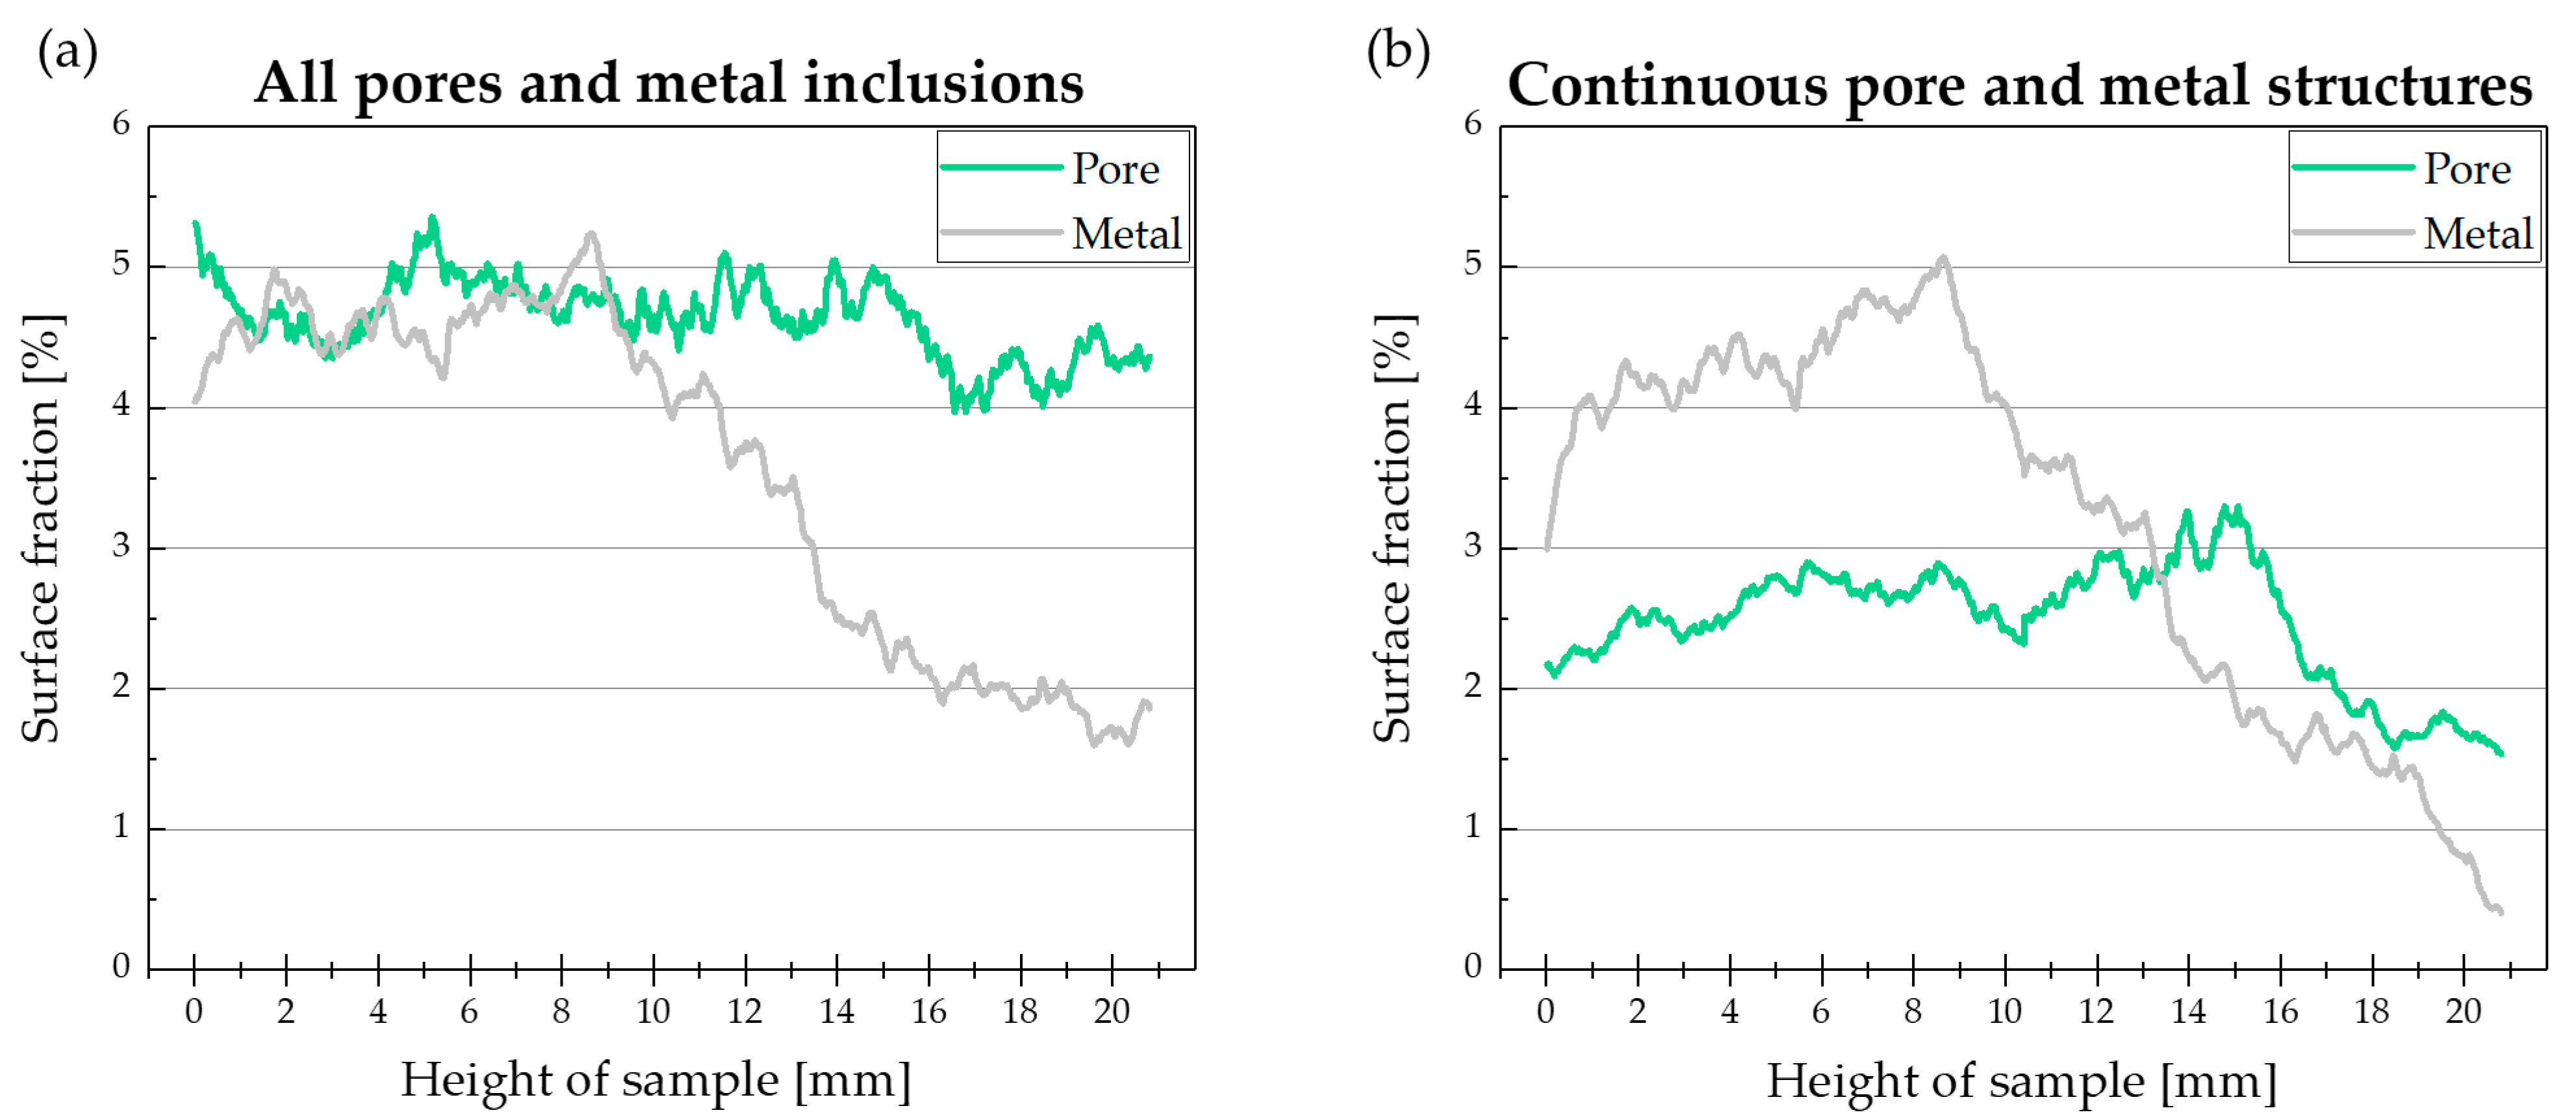
| All Pores and Metal Inclusions | Volume Fraction [%] | Increase | σ [%] | V [mm3] |
|---|---|---|---|---|
| Pores | 4.64 | −23% | 0.27 | 474 |
| Metal | 3.59 | 1.19 | 366 | |
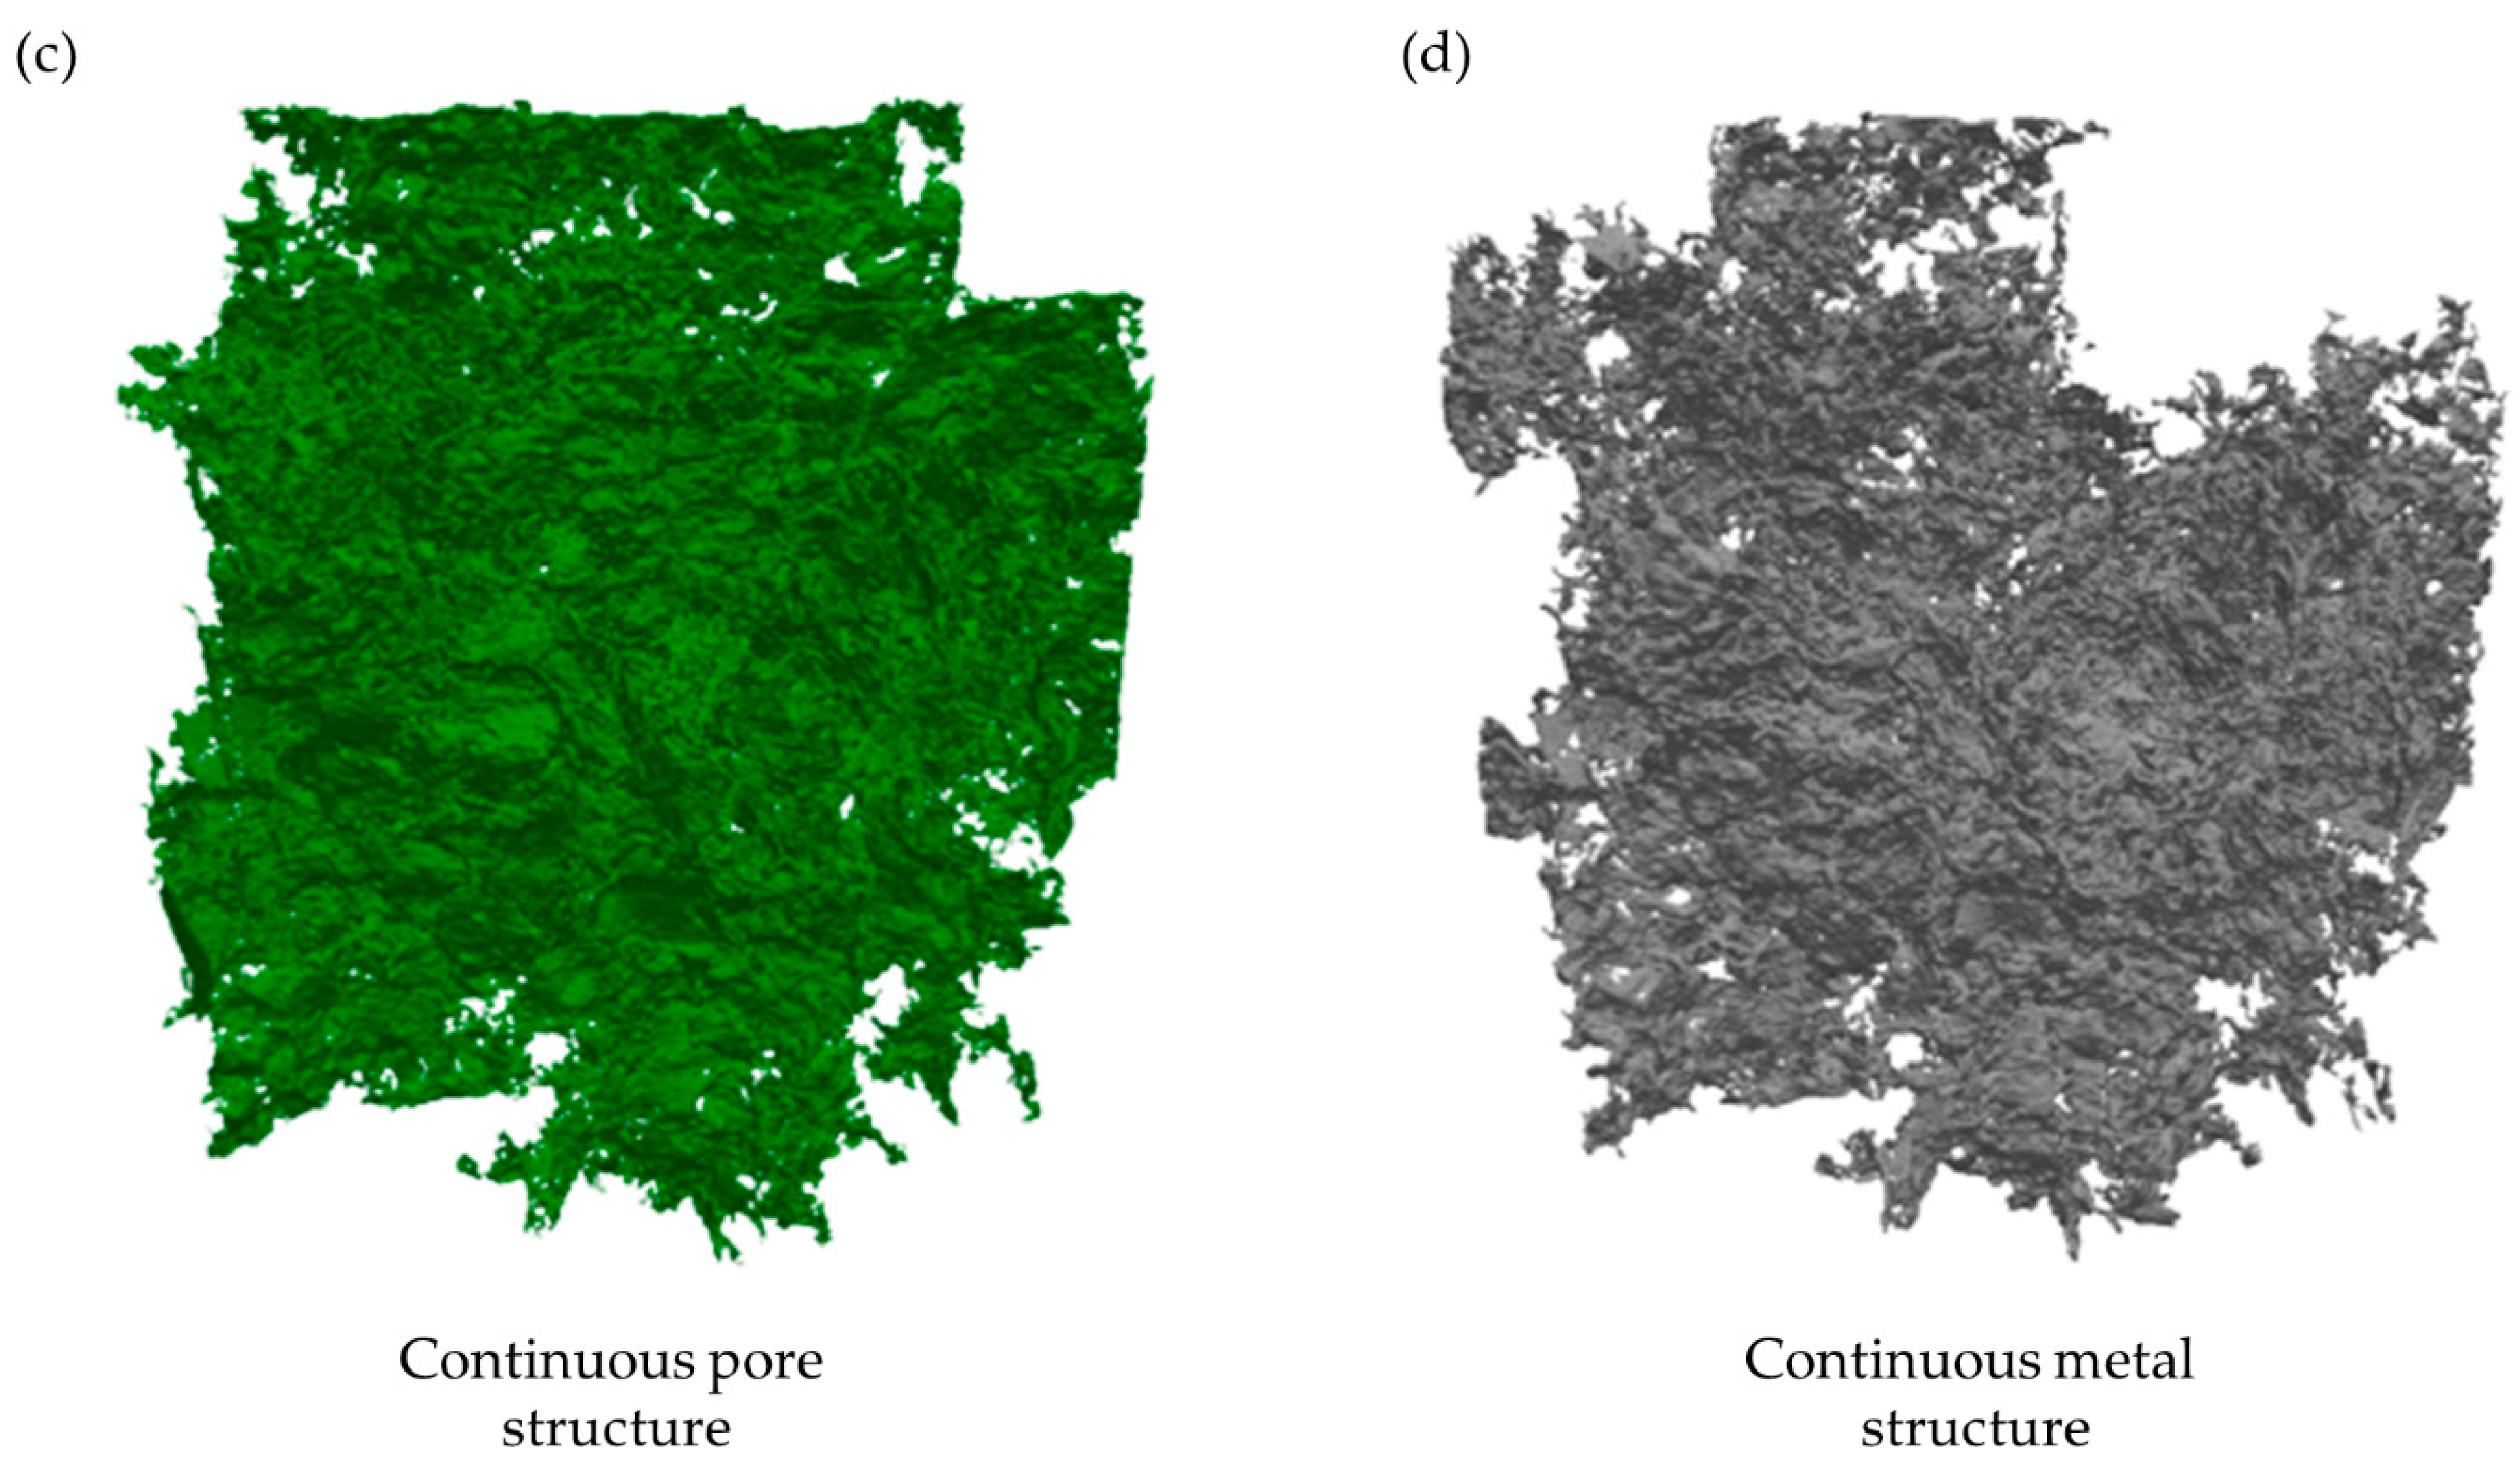
| Continuous Pore and Metal Structures | Volume Fraction [%] | Increase | σ [%] | V [mm3] |
| Pore | 2.48 | 29% | 0.42 | 253 |
| Metal | 3.19 | 1.33 | 326 |
| Local Thickness [µm] | ||||
|---|---|---|---|---|
| All | Pores | 115 | 54 | 703 |
| Metal | 190 | 84 | 843 | |
| Increase | 65% | 20% | ||
| Continuous structure | Pore | 135 | 50 | 410 |
| Metal | 194 | 85 | 843 | |
| Increase | 44% | 106% | ||
Publisher’s Note: MDPI stays neutral with regard to jurisdictional claims in published maps and institutional affiliations. |
© 2021 by the authors. Licensee MDPI, Basel, Switzerland. This article is an open access article distributed under the terms and conditions of the Creative Commons Attribution (CC BY) license (https://creativecommons.org/licenses/by/4.0/).
Share and Cite
Stec, J.; Tarasiuk, J.; Wroński, S.; Kubica, P.; Tomala, J.; Filipek, R. Investigation of Molten Metal Infiltration into Micropore Carbon Refractory Materials Using X-ray Computed Tomography. Materials 2021, 14, 3148. https://doi.org/10.3390/ma14123148
Stec J, Tarasiuk J, Wroński S, Kubica P, Tomala J, Filipek R. Investigation of Molten Metal Infiltration into Micropore Carbon Refractory Materials Using X-ray Computed Tomography. Materials. 2021; 14(12):3148. https://doi.org/10.3390/ma14123148
Chicago/Turabian StyleStec, Jakub, Jacek Tarasiuk, Sebastian Wroński, Piotr Kubica, Janusz Tomala, and Robert Filipek. 2021. "Investigation of Molten Metal Infiltration into Micropore Carbon Refractory Materials Using X-ray Computed Tomography" Materials 14, no. 12: 3148. https://doi.org/10.3390/ma14123148
APA StyleStec, J., Tarasiuk, J., Wroński, S., Kubica, P., Tomala, J., & Filipek, R. (2021). Investigation of Molten Metal Infiltration into Micropore Carbon Refractory Materials Using X-ray Computed Tomography. Materials, 14(12), 3148. https://doi.org/10.3390/ma14123148