The Importance of Phase Composition for Corrosion Resistance of Borided Layers Produced on Nickel Alloys


Abstract
:1. Introduction
2. Experimental Procedure
2.1. Material
2.2. Boriding
2.3. Microstructure Characterization
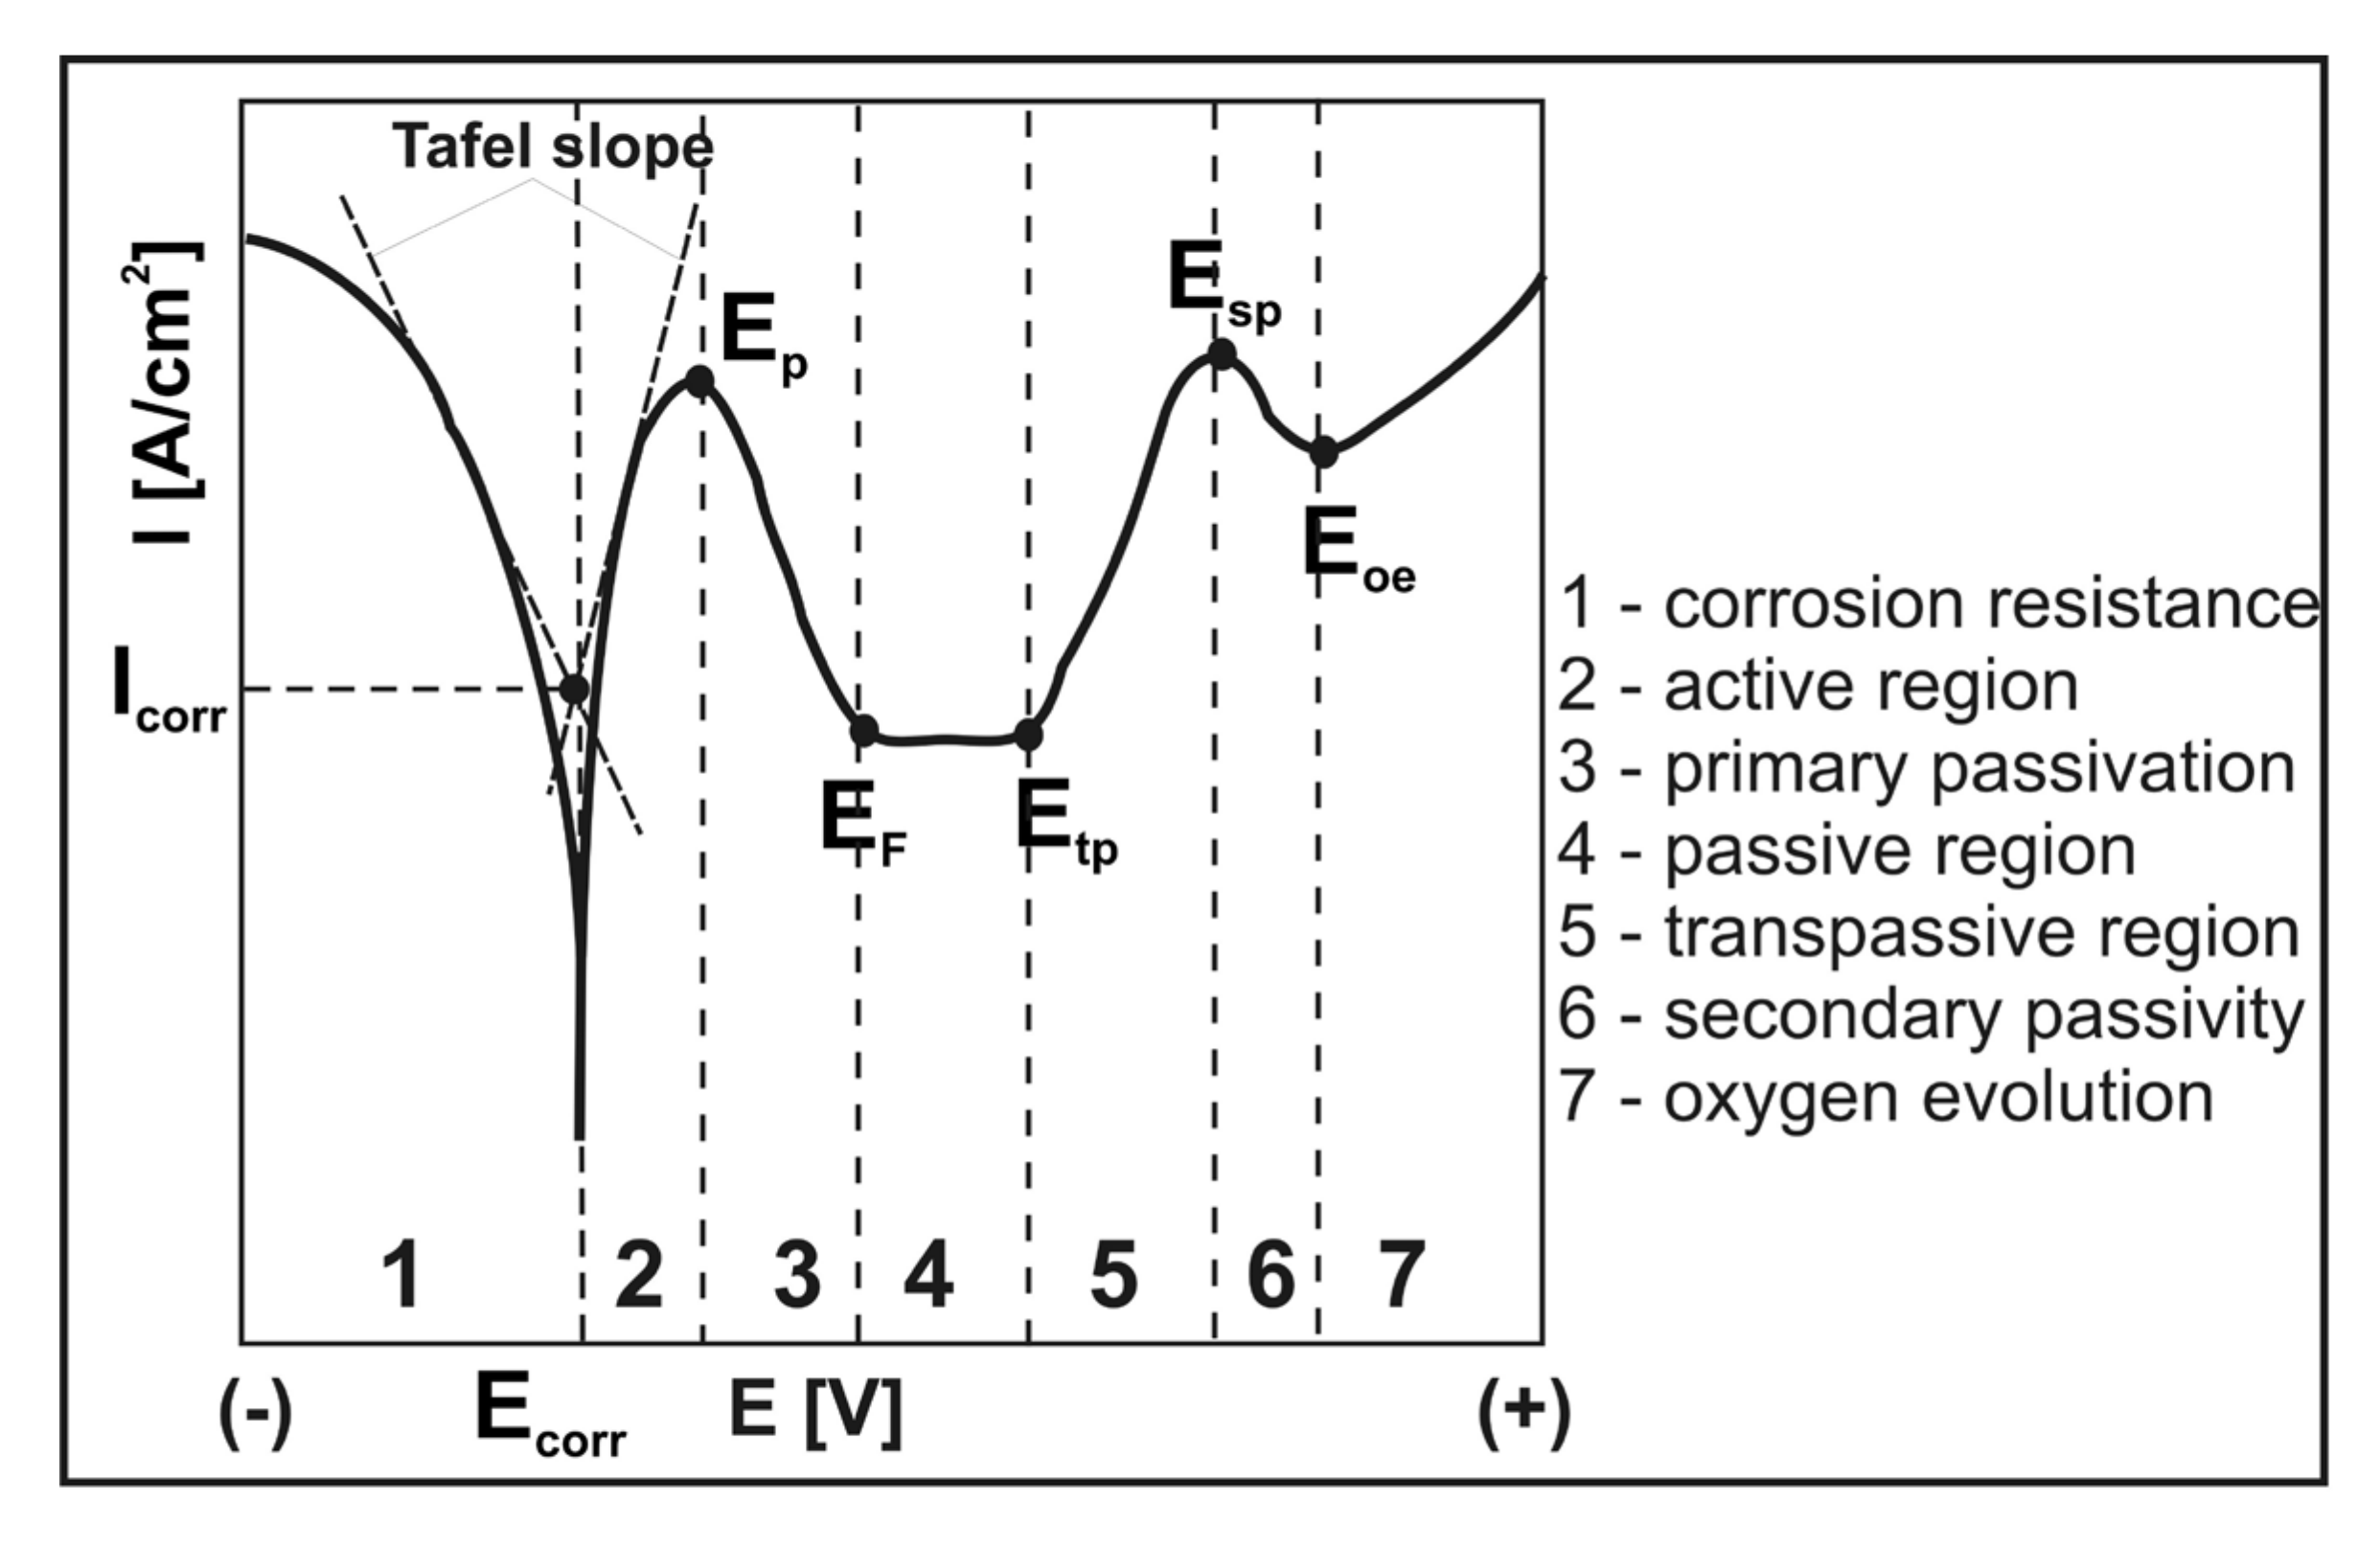
2.4. Corrosion Resistance Evaluation
3. Results and Discussion
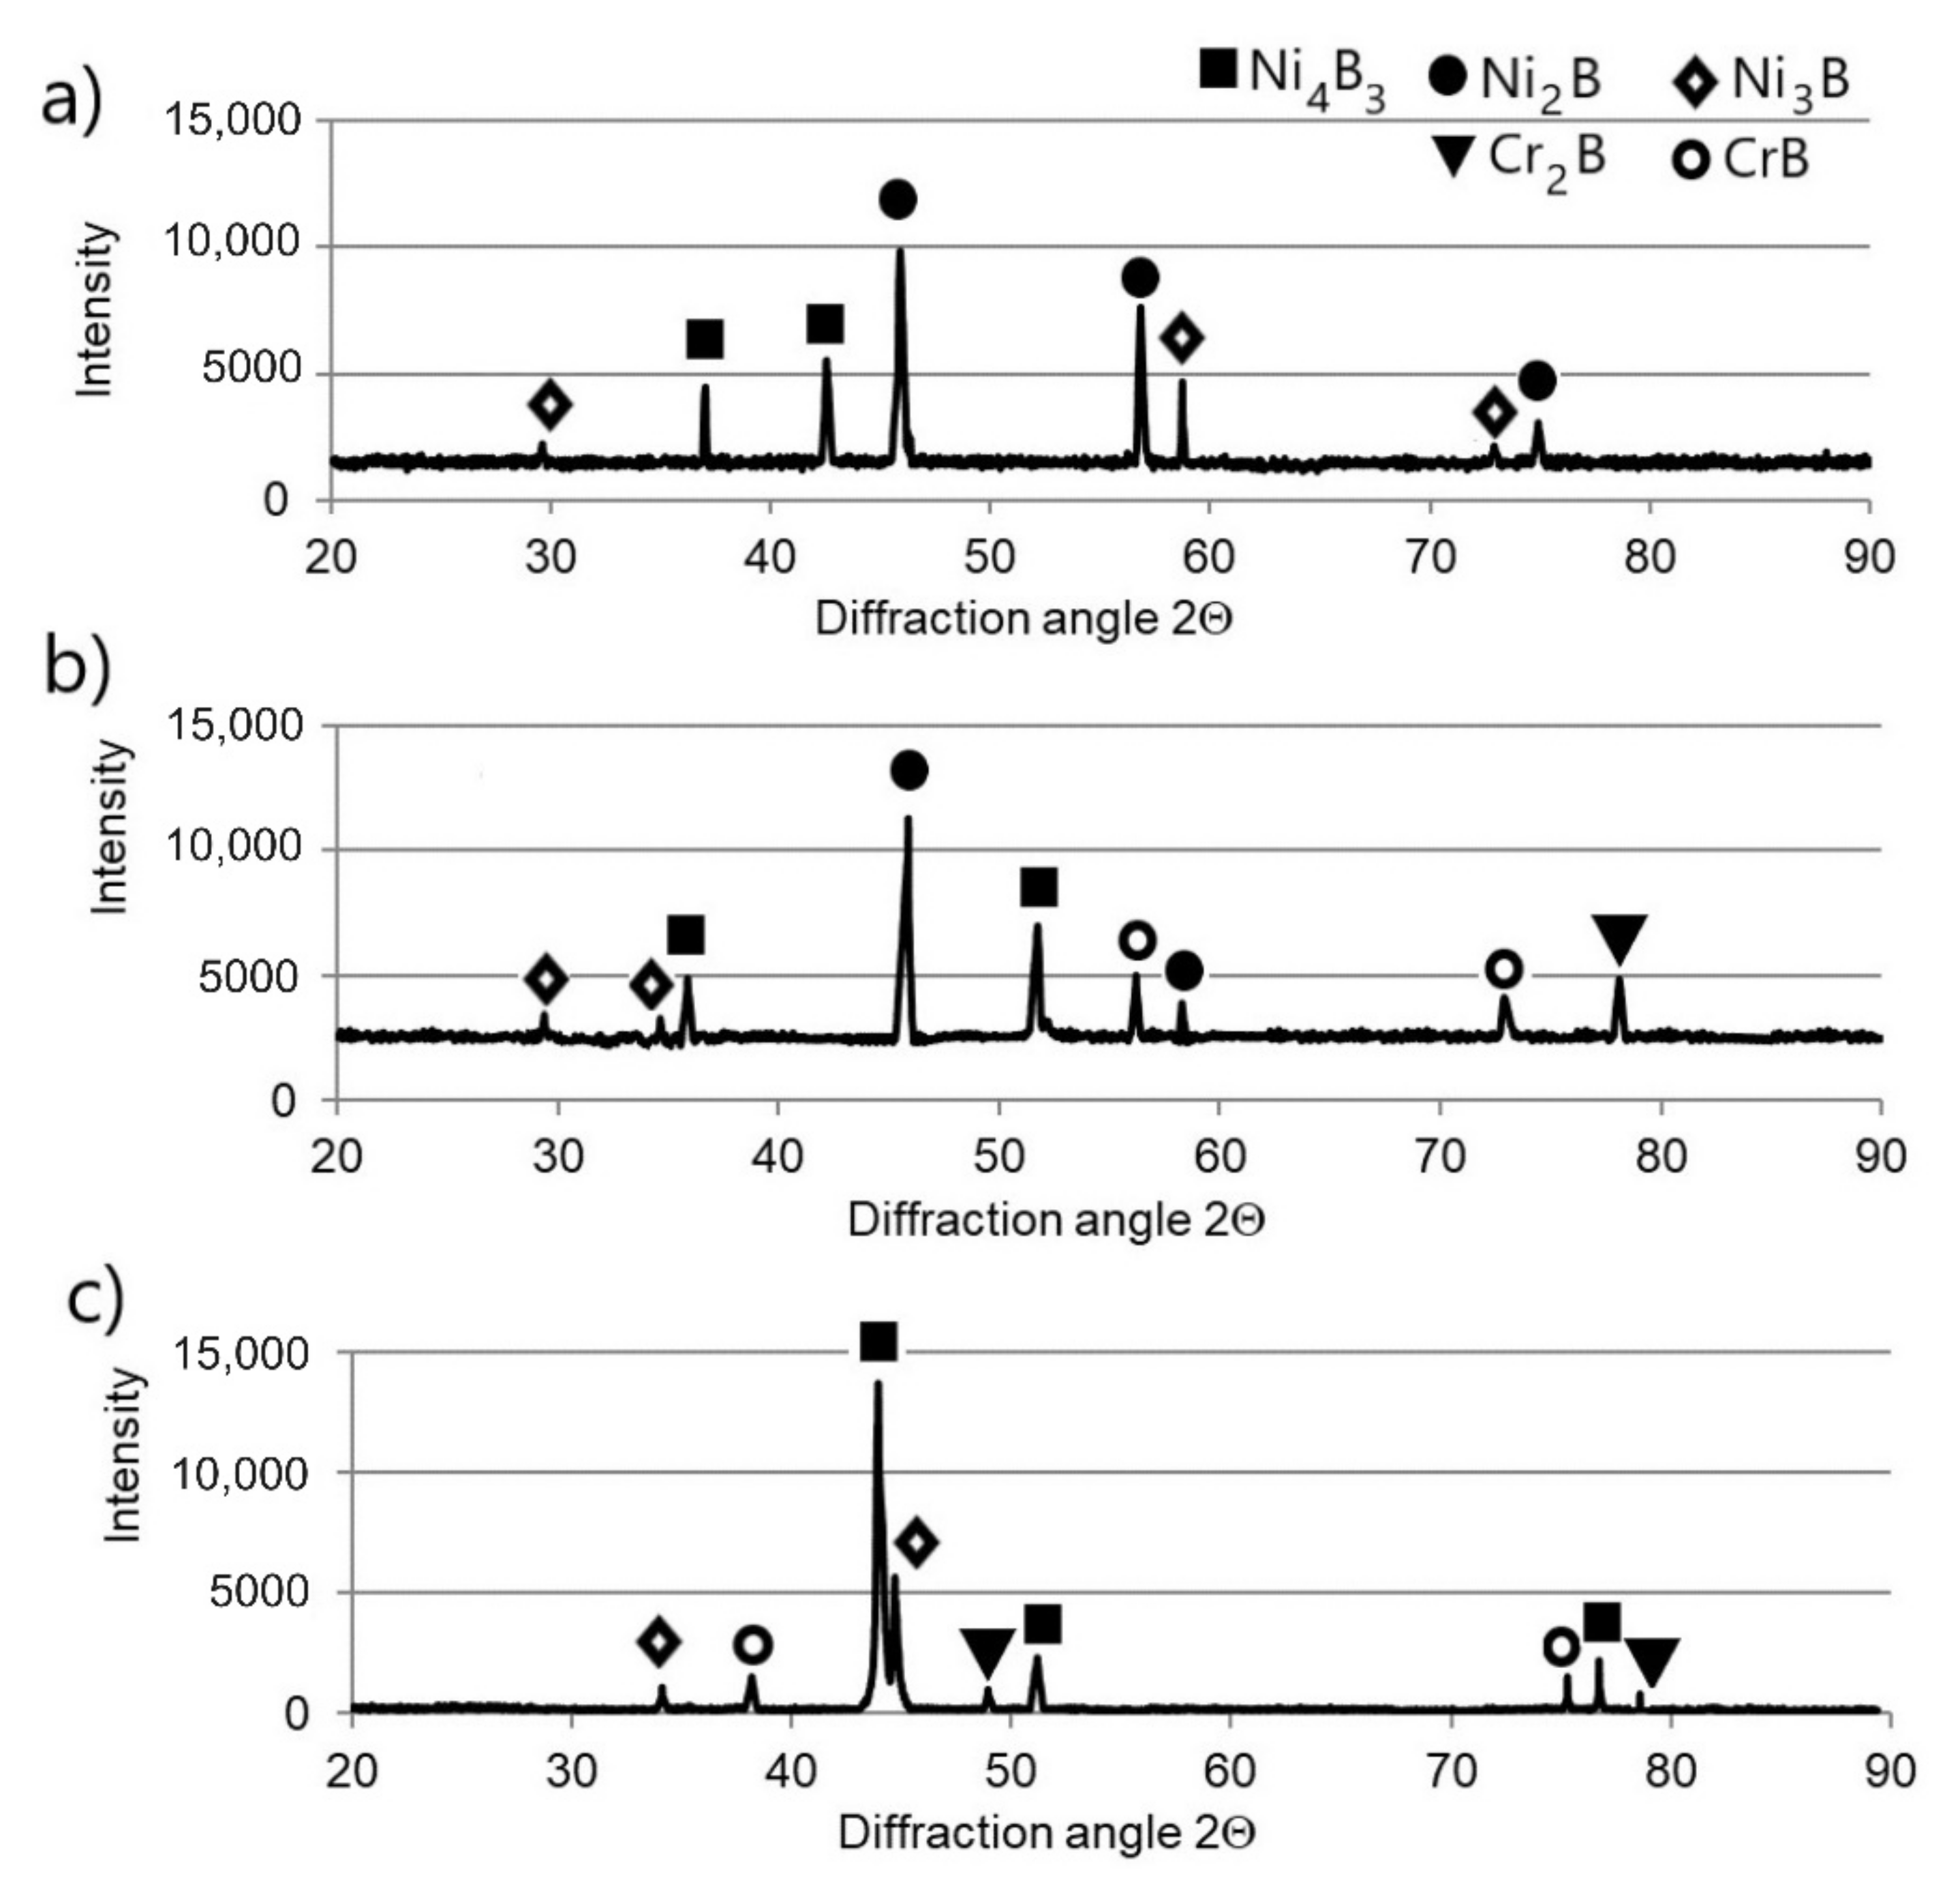
3.1. Microstructure
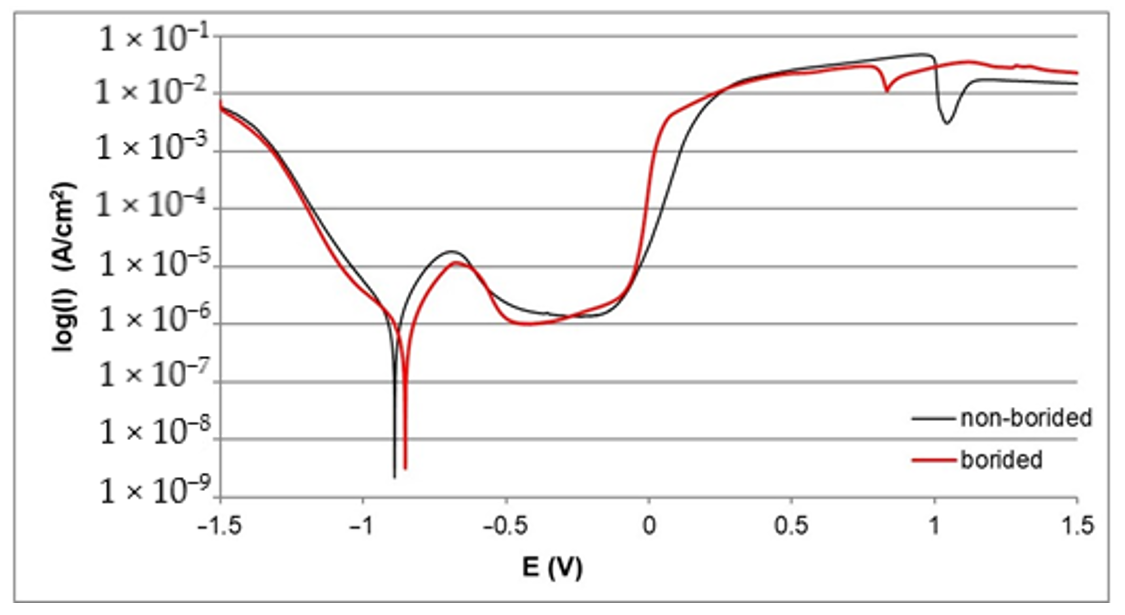
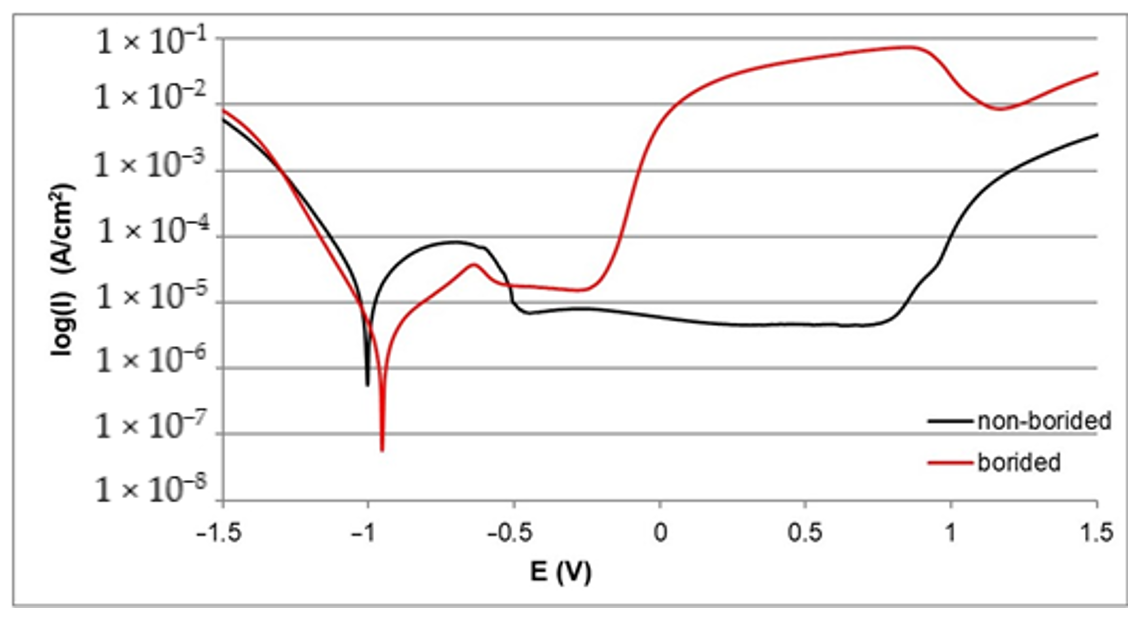
3.2. Corrosion Resistance
4. Summary and Conclusions
- Among all the non-borided samples, the highest corrosion resistance and the highest resistance to pitting corrosion were characteristic of a pure nickel sample.
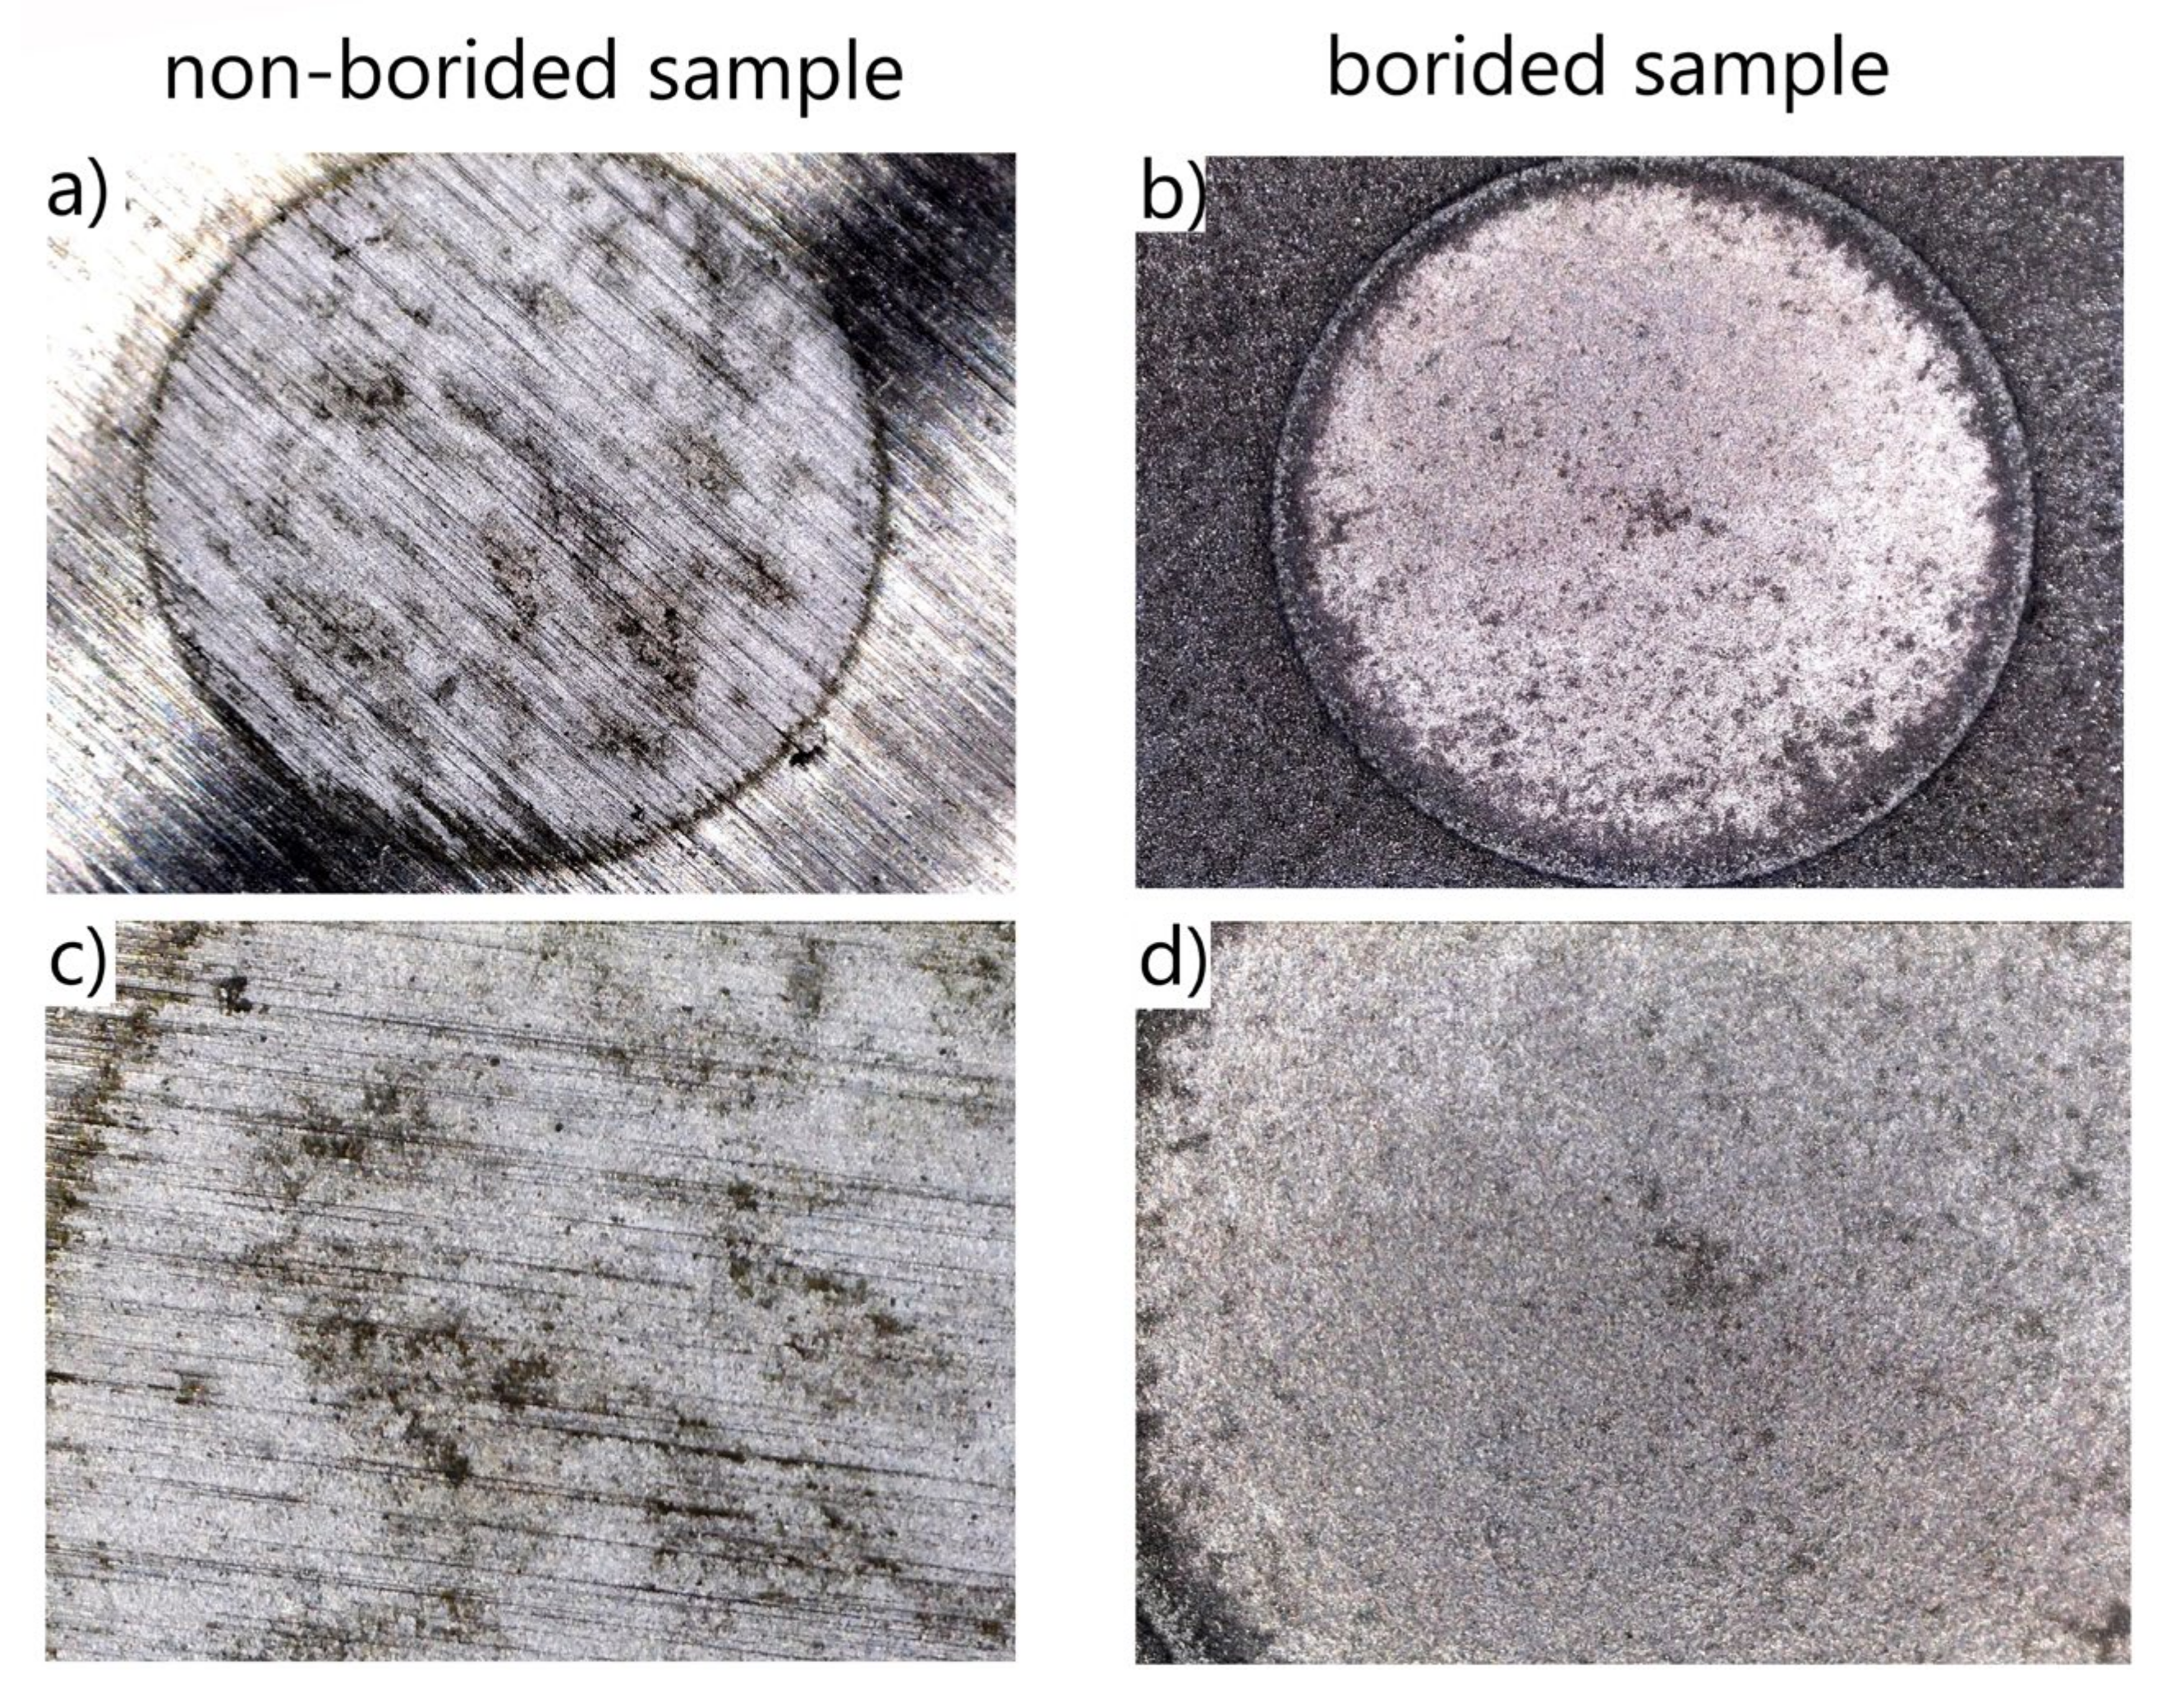
- The high chromium concentration in Inconel®600 and Nimonic®80A alloys resulted in high susceptibility of these alloys to pitting corrosion, as the presence of chromium ions caused a decrease in pH value at the bottom of the corrosion pits. Therefore, the intensive material dissolution was observed.
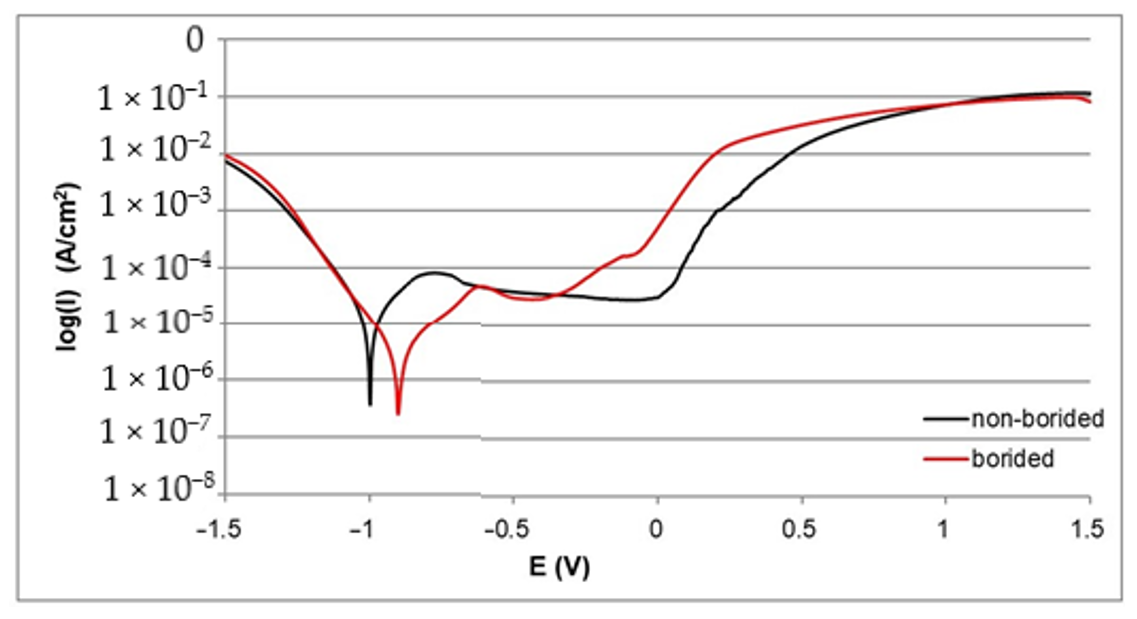
- The electrochemical parameters Icorr and Ecorr derived from the polarization curves indicated a higher corrosion resistance of all borided samples compared to the non-borided samples.
- The highest corrosion resistance was obtained for plasma paste borided Nickel 201, due to the microstructure consisting only of nickel borides.
- Differences between electrochemical properties of nickel borides and chromium borides caused the formation of micro-cells during the potentiodynamic polarization test of borided Inconel®600 and Nimonic®80A alloys; consequently, the intensive corrosion of the anodic regions occurred. Therefore, the corrosion resistance of borided layers formed on nickel-chromium alloys was lower when compared to the borided pure nickel.
- Plasma paste boriding can be an effective barrier against corrosion in a 3.5% NaCl water solution.
Funding
Conflicts of Interest
References
- Aytekin, H.; Akçin, Y. Characterization of borided Incoloy 825 alloy. Mater. Des. 2013, 50, 515–521. [Google Scholar] [CrossRef]
- Kulka, M.; Makuch, N.; Popławski, M. Two-stage gas boriding of Nisil in N2–H2–BCl3 atmosphere. Surf. Coat. Technol. 2014, 244, 78–86. [Google Scholar] [CrossRef]
- Anthymidis, K.; Zinoviadis, P.; Roussos, D.; Tsipas, D. Boriding of nickel in a fluidized bed reactor. Mater. Res. Bull. 2002, 37, 515–522. [Google Scholar] [CrossRef]
- Ueda, N.; Mizukoshi, T.; Demizu, K.; Sone, T.; Ikenaga, A.; Kawamoto, M. Boriding of nickel by the powder-pack method. Surf. Coat. Technol. 2000, 126, 25–30. [Google Scholar] [CrossRef]
- Petrova, R.S.; Suwattananont, N.; Samardzic, V. The Effect of Boronizing on Metallic Alloys for Automotive Applications. J. Mater. Eng. Perform. 2008, 17, 340–345. [Google Scholar] [CrossRef]
- Makuch, N. Nanomechanical properties and fracture toughness of hard ceramic layer produced by gas boriding of Inconel 600 alloy. Trans. Nonferrous Met. Soc. China 2020, 30, 428–448. [Google Scholar] [CrossRef]
- Makuch, N.; Kulka, M.; Mikołajczak, D. Corrosion Behavior of Hard Boride Layer Produced on Nimonic 80A-Alloy by Gas Boriding. Trans. Indian Inst. Met. 2017, 26, 248–252. [Google Scholar] [CrossRef]
- Makuch, N.; Kulka, M.; Piasecki, A. The effects of chemical composition of Nimonic 80A-alloy on the microstructure and properties of gas-borided layer. Surf. Coat. Technol. 2015, 276, 440–455. [Google Scholar] [CrossRef]
- Makuch, N.; Kulka, M. Fracture toughness of hard ceramic phases produced on Nimonic 80A-alloy by gas boriding. Ceram. Int. 2016, 42, 3275–3289. [Google Scholar] [CrossRef]
- Makuch, N.; Kulka, M. Microstructural characterization and some mechanical properties of gas-borided Inconel 600-alloy. Appl. Surf. Sci. 2014, 314, 1007–1018. [Google Scholar] [CrossRef]
- Sista, V.; Kahvecioglu, O.; Kartal, G.; Zeng, Q.; Kim, J.; Eryilmaz, O.; Erdemir, A. Evaluation of electrochemical boriding of Inconel 600. Surf. Coat. Technol. 2013, 215, 452–459. [Google Scholar] [CrossRef]
- Lou, D.; Solberg, J.; Akselsen, O.; Dahl, N. Microstructure and property investigation of paste boronized pure nickel and Nimonic 90 superalloy. Mater. Chem. Phys. 2009, 115, 239–244. [Google Scholar] [CrossRef]
- Cabeo, E.R.; Laudien, G.; Biemer, S.; Rie, K.T.; Hoppe, S. Plasma-assisted boriding of industrial components in a pulsed d.c. glow discharge. Surf. Coat. Technol. 1999, 116, 229–233. [Google Scholar] [CrossRef]
- Yoon, J.; Jee, Y.; Lee, S. Plasma paste boronizing treatment of the stainless steel AISI 304. Surf. Coat. Technol. 1999, 112, 71–75. [Google Scholar] [CrossRef]
- Gunes, I.; Ulker, S.; Taktak, S. Plasma paste boronizing of AISI 8620, 52100 and 440C steels. Mater. Des. 2011, 32, 2380–2386. [Google Scholar] [CrossRef]
- Kaestner, P.; Olfe, J.; Rie, K.T. Plasma-assisted boriding of pure titanium and TiAl6V4. Surf. Coat. Technol. 2001, 142, 248–252. [Google Scholar] [CrossRef]
- Ataibis, V.; Taktak, S. Characteristics and growth kinetics of plasma paste borided Cp–Ti and Ti6Al4V alloy. Surf. Coat. Technol. 2015, 279, 65–71. [Google Scholar] [CrossRef]
- Makuch, N.; Kulka, M.; Dziarski, P.; Taktak, S. The influence of chemical composition of Ni-based alloys on microstructure and mechanical properties of plasma paste borided layers. Surf. Coat. Technol. 2019, 367, 187–202. [Google Scholar] [CrossRef]
- Craig, B.D.; Anderson, D.B. Handbook of Corrosion Data; ASM International: Materials Park, OH, USA, 1995; pp. 50–51. [Google Scholar]
- Cramer, S.D.; Covino, B.S. ASM Handbook. Volume 13B Corrosion: Materials; ASM International: Materials Park, OH, USA, 2005; pp. 228–240. [Google Scholar]
- Aspden, R.G.; Economy, G.; Pement, F.W.; Wilson, I.L. Relationship between magnetic properties, sensitization, and corrosion of incoloy alloy 800 and inconel alloy 600. Met. Mater. Trans. A 1972, 3, 2691–2697. [Google Scholar] [CrossRef]
- Li, H.; Ma, J.R.; Liu, X.R.; Xia, S.; Liu, W.Q.; Zhou, B.X. Morphology Evolution of Grain Boundary Carbides in Highly Twinned Inconel Alloy 600. Mater. Sci. Forum 2016, 879, 1111–1116. [Google Scholar] [CrossRef]
- Lee, T.H.; Lee, Y.J.; Joo, S.H.; Nersisyan, H.; Park, K.T.; Lee, J.H. Intergranular M23C6 Carbide Precipitation Behavior and Its Effect on Mechanical Properties of Inconel 690 Tubes. Met. Mater. Trans. A 2015, 46, 4020–4026. [Google Scholar] [CrossRef]
- Dziarski, P.; Makuch, N.; Kulka, M. Influence of gas boriding on corrosion resistance of Inconel 600-alloy. Arch. Mater. Sci. Eng. 2017, 1, 23–33. [Google Scholar] [CrossRef]
- Fontana, M.G.; Staehle, R.W. Advances in Corrosion Science and Technology; Pleneum Press: New York, NY, USA, 1973; p. 301. [Google Scholar]
- Perez, N. Electrochemistry and Corrosion Science; Kluwer Academic Publishers: Boston, MA, USA, 2004; pp. 16–17. [Google Scholar]
- Fontana, M.G.; Greene, N.D.; Klerer, J. Corrosion Engineering. J. Electrochem. Soc. 1968, 115, 142. [Google Scholar] [CrossRef]
- Shreir, L.L.; Jarman, R.A.; Burstein, G.T. Corrosion. Vol. I: Metal/Environment Reactions; Butterworth Heinemann: Oxford, UK, 1994; pp. 92–100. [Google Scholar]
- Yang, L. Techniques for Corrosion Monitoring; Woodhead Publishing: Cambridge, UK, 2008; pp. 58–67. [Google Scholar]
- Davis, J.R. Corrosion. Understanding the Basics; ASM International: Materials Park, OH, USA, 2000; pp. 459–464. [Google Scholar]


| Elements and Material | Cr | Mn | Cu | Fe | Ti | Si | C | Al | Ni |
|---|---|---|---|---|---|---|---|---|---|
| Nickel 201 | - | ≤0.35 | ≤0.25 | ≤0.40 | - | ≤0.40 | ≤0.02 | - | Balance |
| Inconel®600 Alloy | 15.72 | 0.16 | 0.04 | 8.63 | - | 0.18 | 0.078 | 0.06 | Balance |
| Nimonic®80A Alloy | 19.52 | ≤0.01 | 0.01 | 0.25 | 2.55 | 0.09 | 0.085 | 1.44 | Balance |
| Material | Icorr[A/cm2] | Ecorr[V] |
|---|---|---|
| Non-Borided Nickel 201 | 9.1 × 10⁻⁷ | −0.889 |
| Borided Nickel 201 | 8.3 × 10⁻⁷ | −0.853 |
| Non-borided Inconel®600 | 9.8 × 10⁻⁶ | −1.002 |
| Borided Inconel®600 | 1.1 × 10⁻⁶ | −0.953 |
| Non-borided Nimonic®80A | 9.7 × 10⁻⁶ | −1.003 |
| Borided Nimonic®80A | 1.9 × 10⁻⁶ | −0.902 |
| Roughness Parameters Material | Line Roughness | Area Roughness | |||||
|---|---|---|---|---|---|---|---|
| Ra (µm) | Rq (µm) | Rp (µm) | Sa (µm) | Sq (µm) | Sp (µm) | Sz (µm) | |
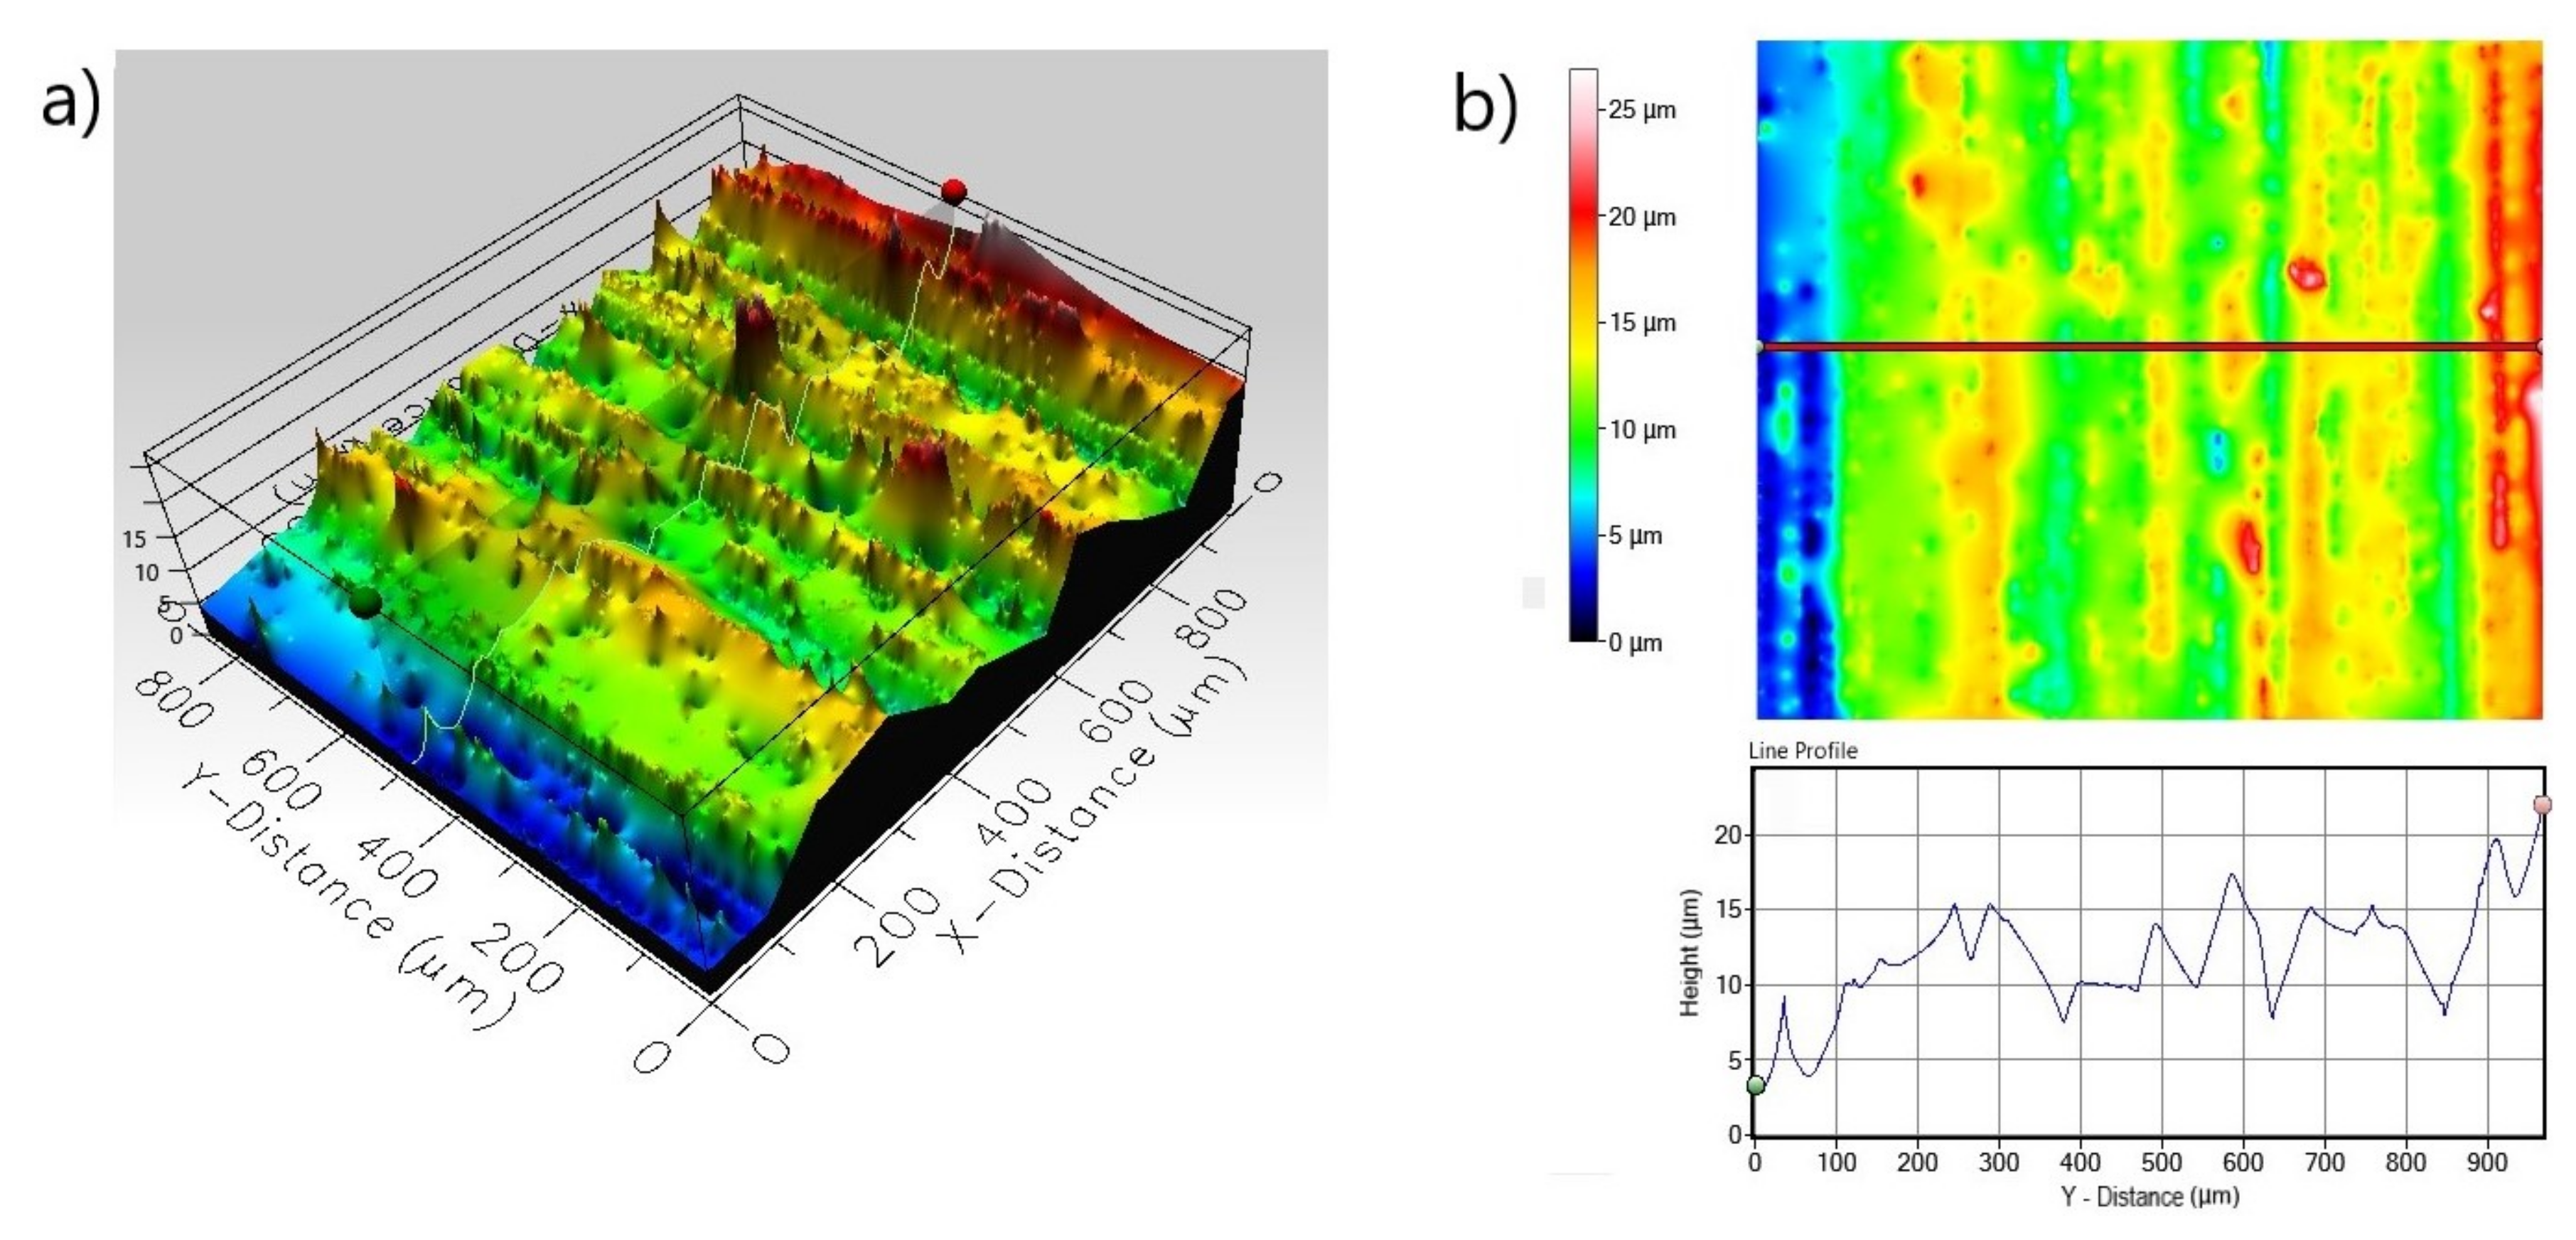
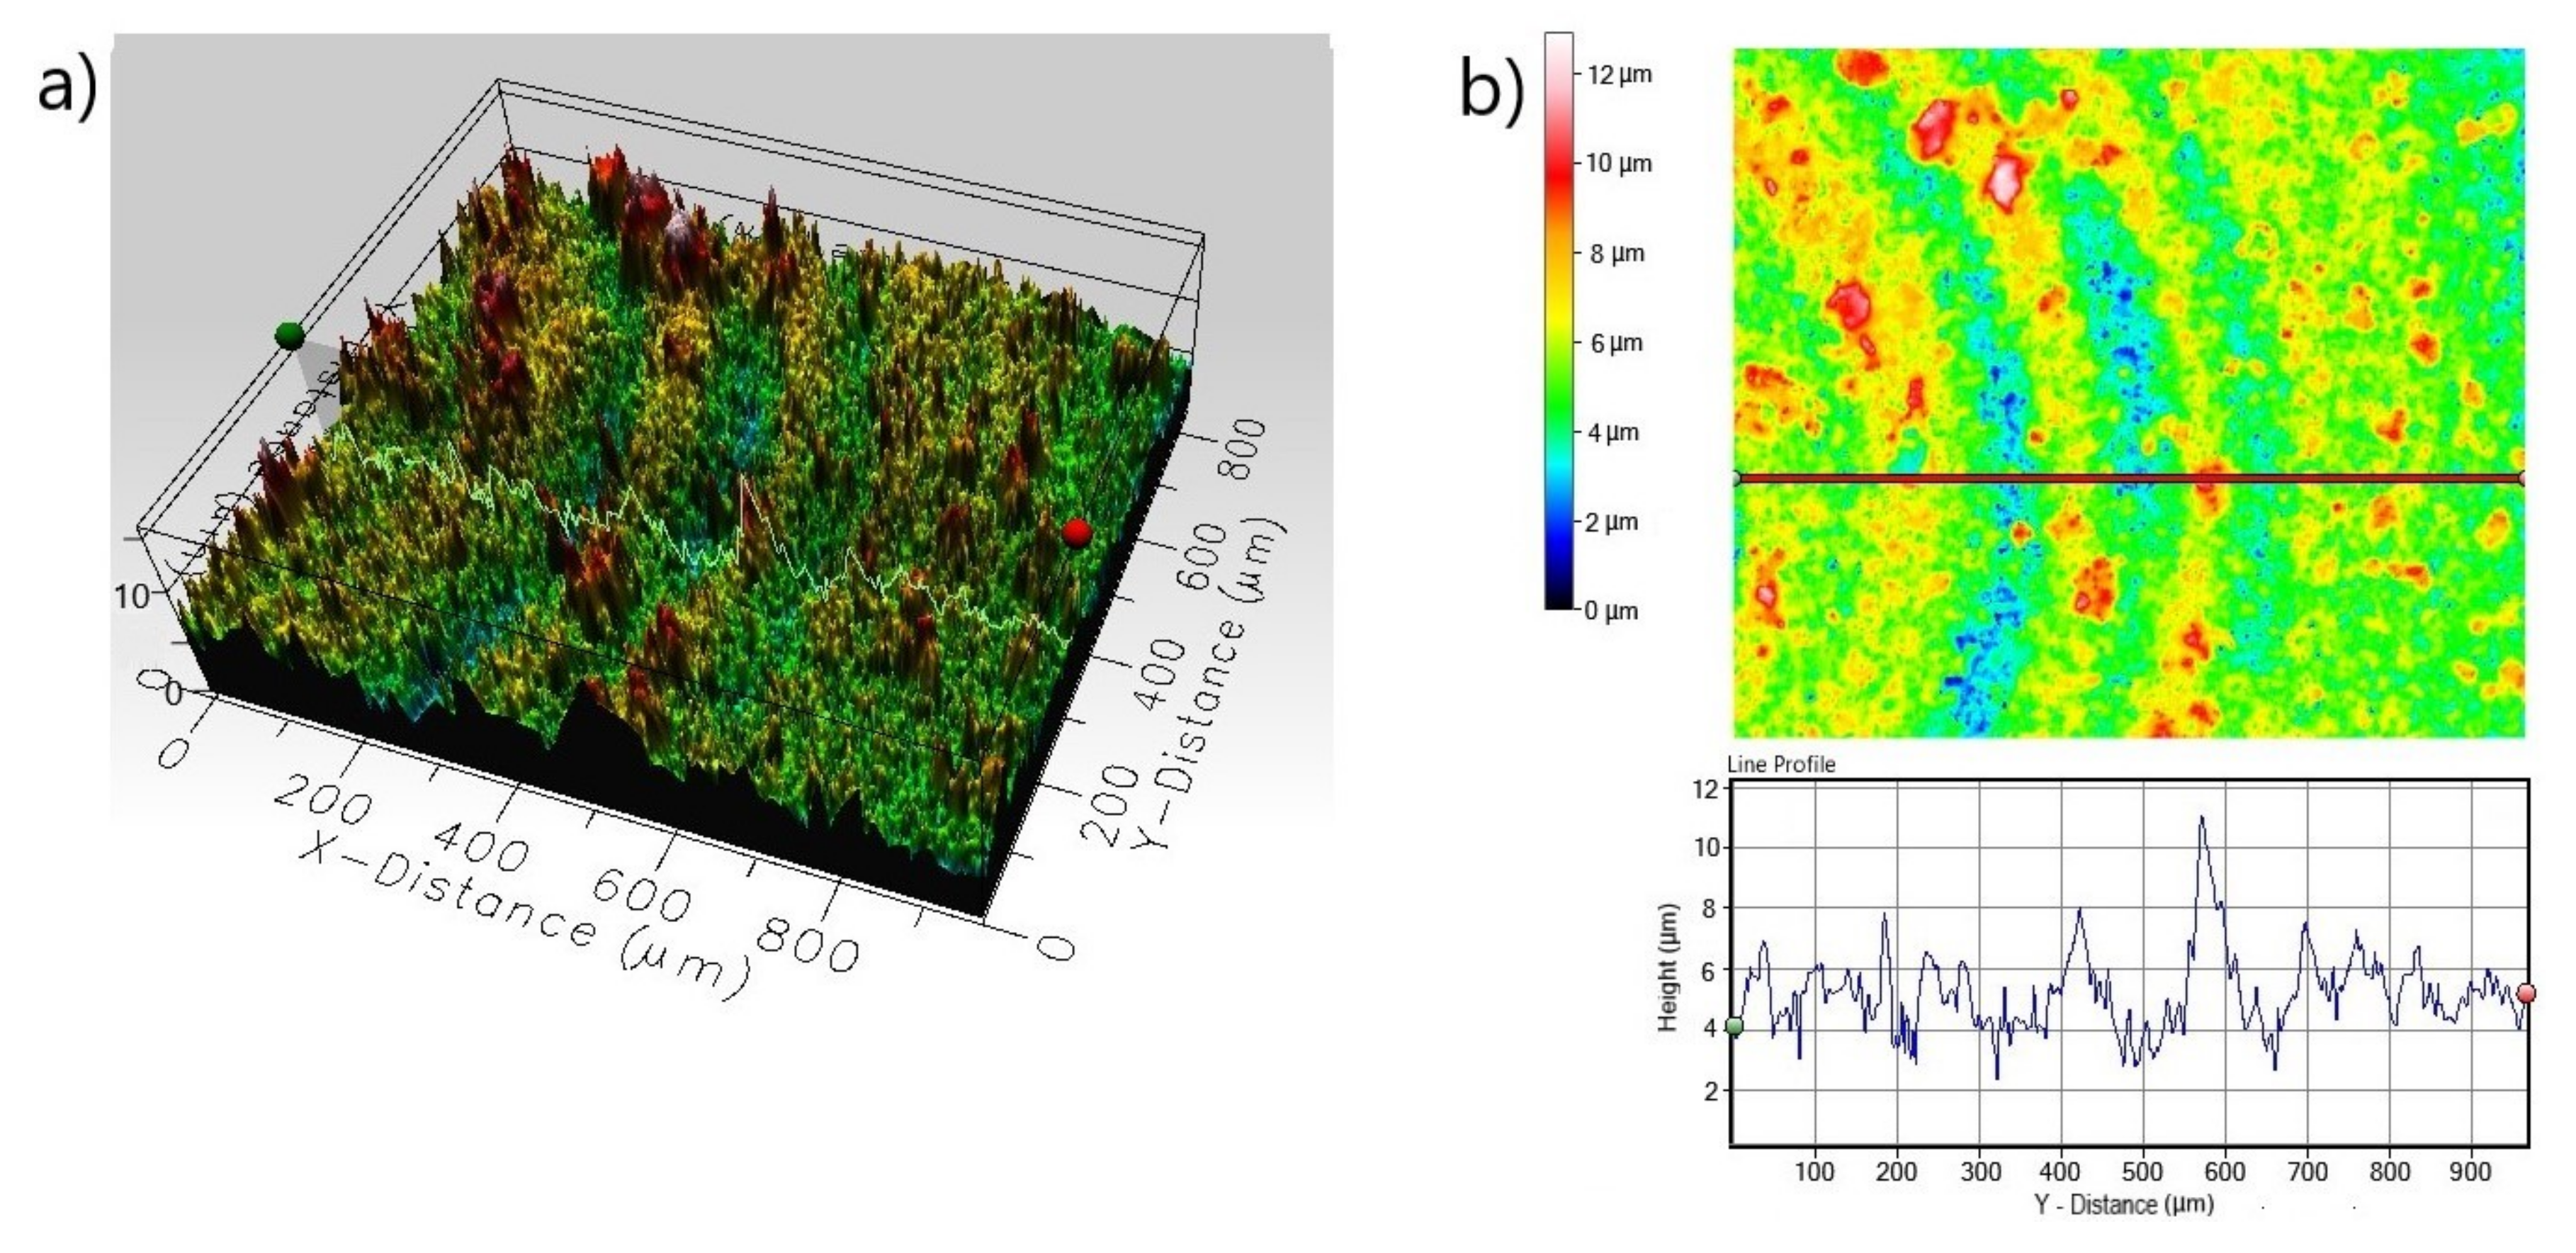
| Non-Borided Nickel 201 | 0.485 | 0.686 | 2.767 | 2.672 | 3.589 | 15.150 | 26.85 |
| Borided Nickel 201 | 0.352 | 0.526 | 2.282 | 1.127 | 1.463 | 7.372 | 11.892 |
| Non-Borided Inconel®600 | 1.121 | 1.484 | 5.147 | 7.779 | 10.812 | 20.441 | 58.144 |
| Borided Inconel®600 | 0.253 | 0.336 | 2.074 | 1.191 | 1.534 | 8.209 | 16.880 |
| Non-Borided Nimonic®80A | 1.114 | 1.432 | 5.527 | 7.875 | 10.670 | 23.480 | 72.591 |
| Borided Nimonic®80A | 0.465 | 0.615 | 1.769 | 1.188 | 1.529 | 7.024 | 15.940 |
Publisher’s Note: MDPI stays neutral with regard to jurisdictional claims in published maps and institutional affiliations. |
© 2020 by the author. Licensee MDPI, Basel, Switzerland. This article is an open access article distributed under the terms and conditions of the Creative Commons Attribution (CC BY) license (http://creativecommons.org/licenses/by/4.0/).
Share and Cite
Makuch, N. The Importance of Phase Composition for Corrosion Resistance of Borided Layers Produced on Nickel Alloys. Materials 2020, 13, 5131. https://doi.org/10.3390/ma13225131
Makuch N. The Importance of Phase Composition for Corrosion Resistance of Borided Layers Produced on Nickel Alloys. Materials. 2020; 13(22):5131. https://doi.org/10.3390/ma13225131
Chicago/Turabian StyleMakuch, Natalia. 2020. "The Importance of Phase Composition for Corrosion Resistance of Borided Layers Produced on Nickel Alloys" Materials 13, no. 22: 5131. https://doi.org/10.3390/ma13225131
APA StyleMakuch, N. (2020). The Importance of Phase Composition for Corrosion Resistance of Borided Layers Produced on Nickel Alloys. Materials, 13(22), 5131. https://doi.org/10.3390/ma13225131