Article

Thickness-Dependence Electrical Characterization of the One-Dimensional van der Waals TaSe3 Crystal

1
SKKU Advanced Institute of Nanotechnology (SAINT), Sungkyunkwan University, Suwon 16419, Korea
2
School of Advanced Materials Science & Engineering, Sungkyunkwan University, Suwon 16419, Korea
3
Department of Materials Science and Engineering, Department of Energy Systems Research, Ajou University, Suwon 16499, Korea
*
Authors to whom correspondence should be addressed.
These authors contributed equally to this study.
Materials 2019, 12(15), 2462; https://doi.org/10.3390/ma12152462
Submission received: 16 June 2019 / Revised: 18 July 2019 / Accepted: 30 July 2019 / Published: 2 August 2019
(This article belongs to the Special Issue Recent Progress in Graphene and 2D Materials)

Abstract

:
Needle-like single crystalline wires of TaSe3 were massively synthesized using the chemical vapor transport method. Since the wedged-shaped single TaSe3 molecular chains were stacked along the b-axis by weak van der Waals interactions, a few layers of TaSe3 flakes could be easily isolated using a typical mechanical exfoliation method. The exfoliated TaSe3 flakes had an anisotropic planar structure, and the number of layers could be controlled by a repeated peeling process until a monolayer of TaSe3 nanoribbon was obtained. Through atomic force and scanning Kelvin probe microscope analyses, it was found that the variation in the work function with the thickness of the TaSe3 flakes was due to the interlayer screening effect. We believe that our results will not only help to add a novel quasi-1D block for nanoelectronics devices based on 2D van der Waals heterostructures, but also provide crucial information for designing proper contacts in device architecture.

1. Introduction

The demand for novel device architecture and materials has been increasing tremendously due to the physical limitations of the current Si-based semiconductor technology, which arise as the size of a single transistor decreases to nanometer size [1,2,3,4]. Even though the issues arising from high-density integration in electronic manufacturing have been partly solved using a three-dimensional (3D) gate structure, more fundamental solutions should be proposed to meet the requirements for the new era of artificial intelligence technology, for which quicker data processing with a small amount of energy is required [5,6,7,8,9]. Among the alternatives, two-dimensional (2D) layered materials with a single atomic thickness have been regarded since the past decade as strong candidates for overcoming the Si-based technology, thanks to their superior mechanical, physical, and chemical properties compared to conventional 3D bulk materials [2,4,10,11,12,13]. In particular, by using the 2D van der Waals (vdWs) heterostructure, in which the stacking sequence and angle can be controlled at the atomic level, semiconductor devices with a thickness of a few nanometers can be manufactured [4,12,13]. Additionally, a new quantum physical phenomenon can be observed [13]. However, in order to achieve high integration for mass production and the desired device structure, micro-patterning processes are inevitable. Unfortunately, the method of selectively etching a specific layer in vdWs heterostructure is still challenging, and it can lead to a drastic degradation of the electrical characteristics because of extensive dangling bonds at the edge sites [11]. To address the aforementioned problems, research has been conducted on the synthesis and application of chain-based layered materials, which can be used directly as quasi-1D conducting channels in a 2D vdWs heterostructure without an additional patterning process [14]. Several research groups have successfully demonstrated that Mo6S9xIx [15], Nb2Se9 [16,17,18], V2Se9 [19,20,21,22], and TaSe3 [14,23,24,25,26,27,28,29,30,31,32] consisting of multiple single molecular chains linked by weak vdWs interaction, can be exfoliated and used in electronic devices, optoelectronic devices, and energy storage devices. Recently, Balandin et al. researched the trigonal prismatic TaSe3 material, on which superconducting properties were observed decades ago [14]. The authors found that this material had a high current-carrying capacity, and had the potential of being employed as an interconnector in electronic devices [18]. Shur et al. further proved that the quasi-1D nanowires of TaSe3 had lower levels of normalized noise spectral density, and had a potential for downscaled local interconnect applications [24,27,31]. However, despite the nano-effects of layered materials observed in the few-layered regions, previous studies of TaSe3 only considered materials with a diameter of 20 nm or greater. In particular, for use as a component of the conducting channels of the 2D vdWs heterostructure, it is ultimately necessary to assess the electrical characteristics at sizes ranging from monolayer to multi-layers. In this study, we synthesized bundles of TaSe3 crystal by a typical chemical vapor transport (CVT) method, and cleaved them to a thickness of a few layers through a simple mechanical exfoliation approach. Exfoliated TaSe3 flakes have an anisotropic 2D structure with a flat surface, which shows that as-grown TaSe3 crystals consist of innumerable single TaSe3 molecular chains bonded by the weak vdWs interaction along the b-axis. Topological characteristics of TaSe3 were investigated by atomic force microscopy (AFM), and the calculated thickness-dependent work functions were analyzed by a scanning Kelvin probe microscope (SKPM).

2. Materials and Methods
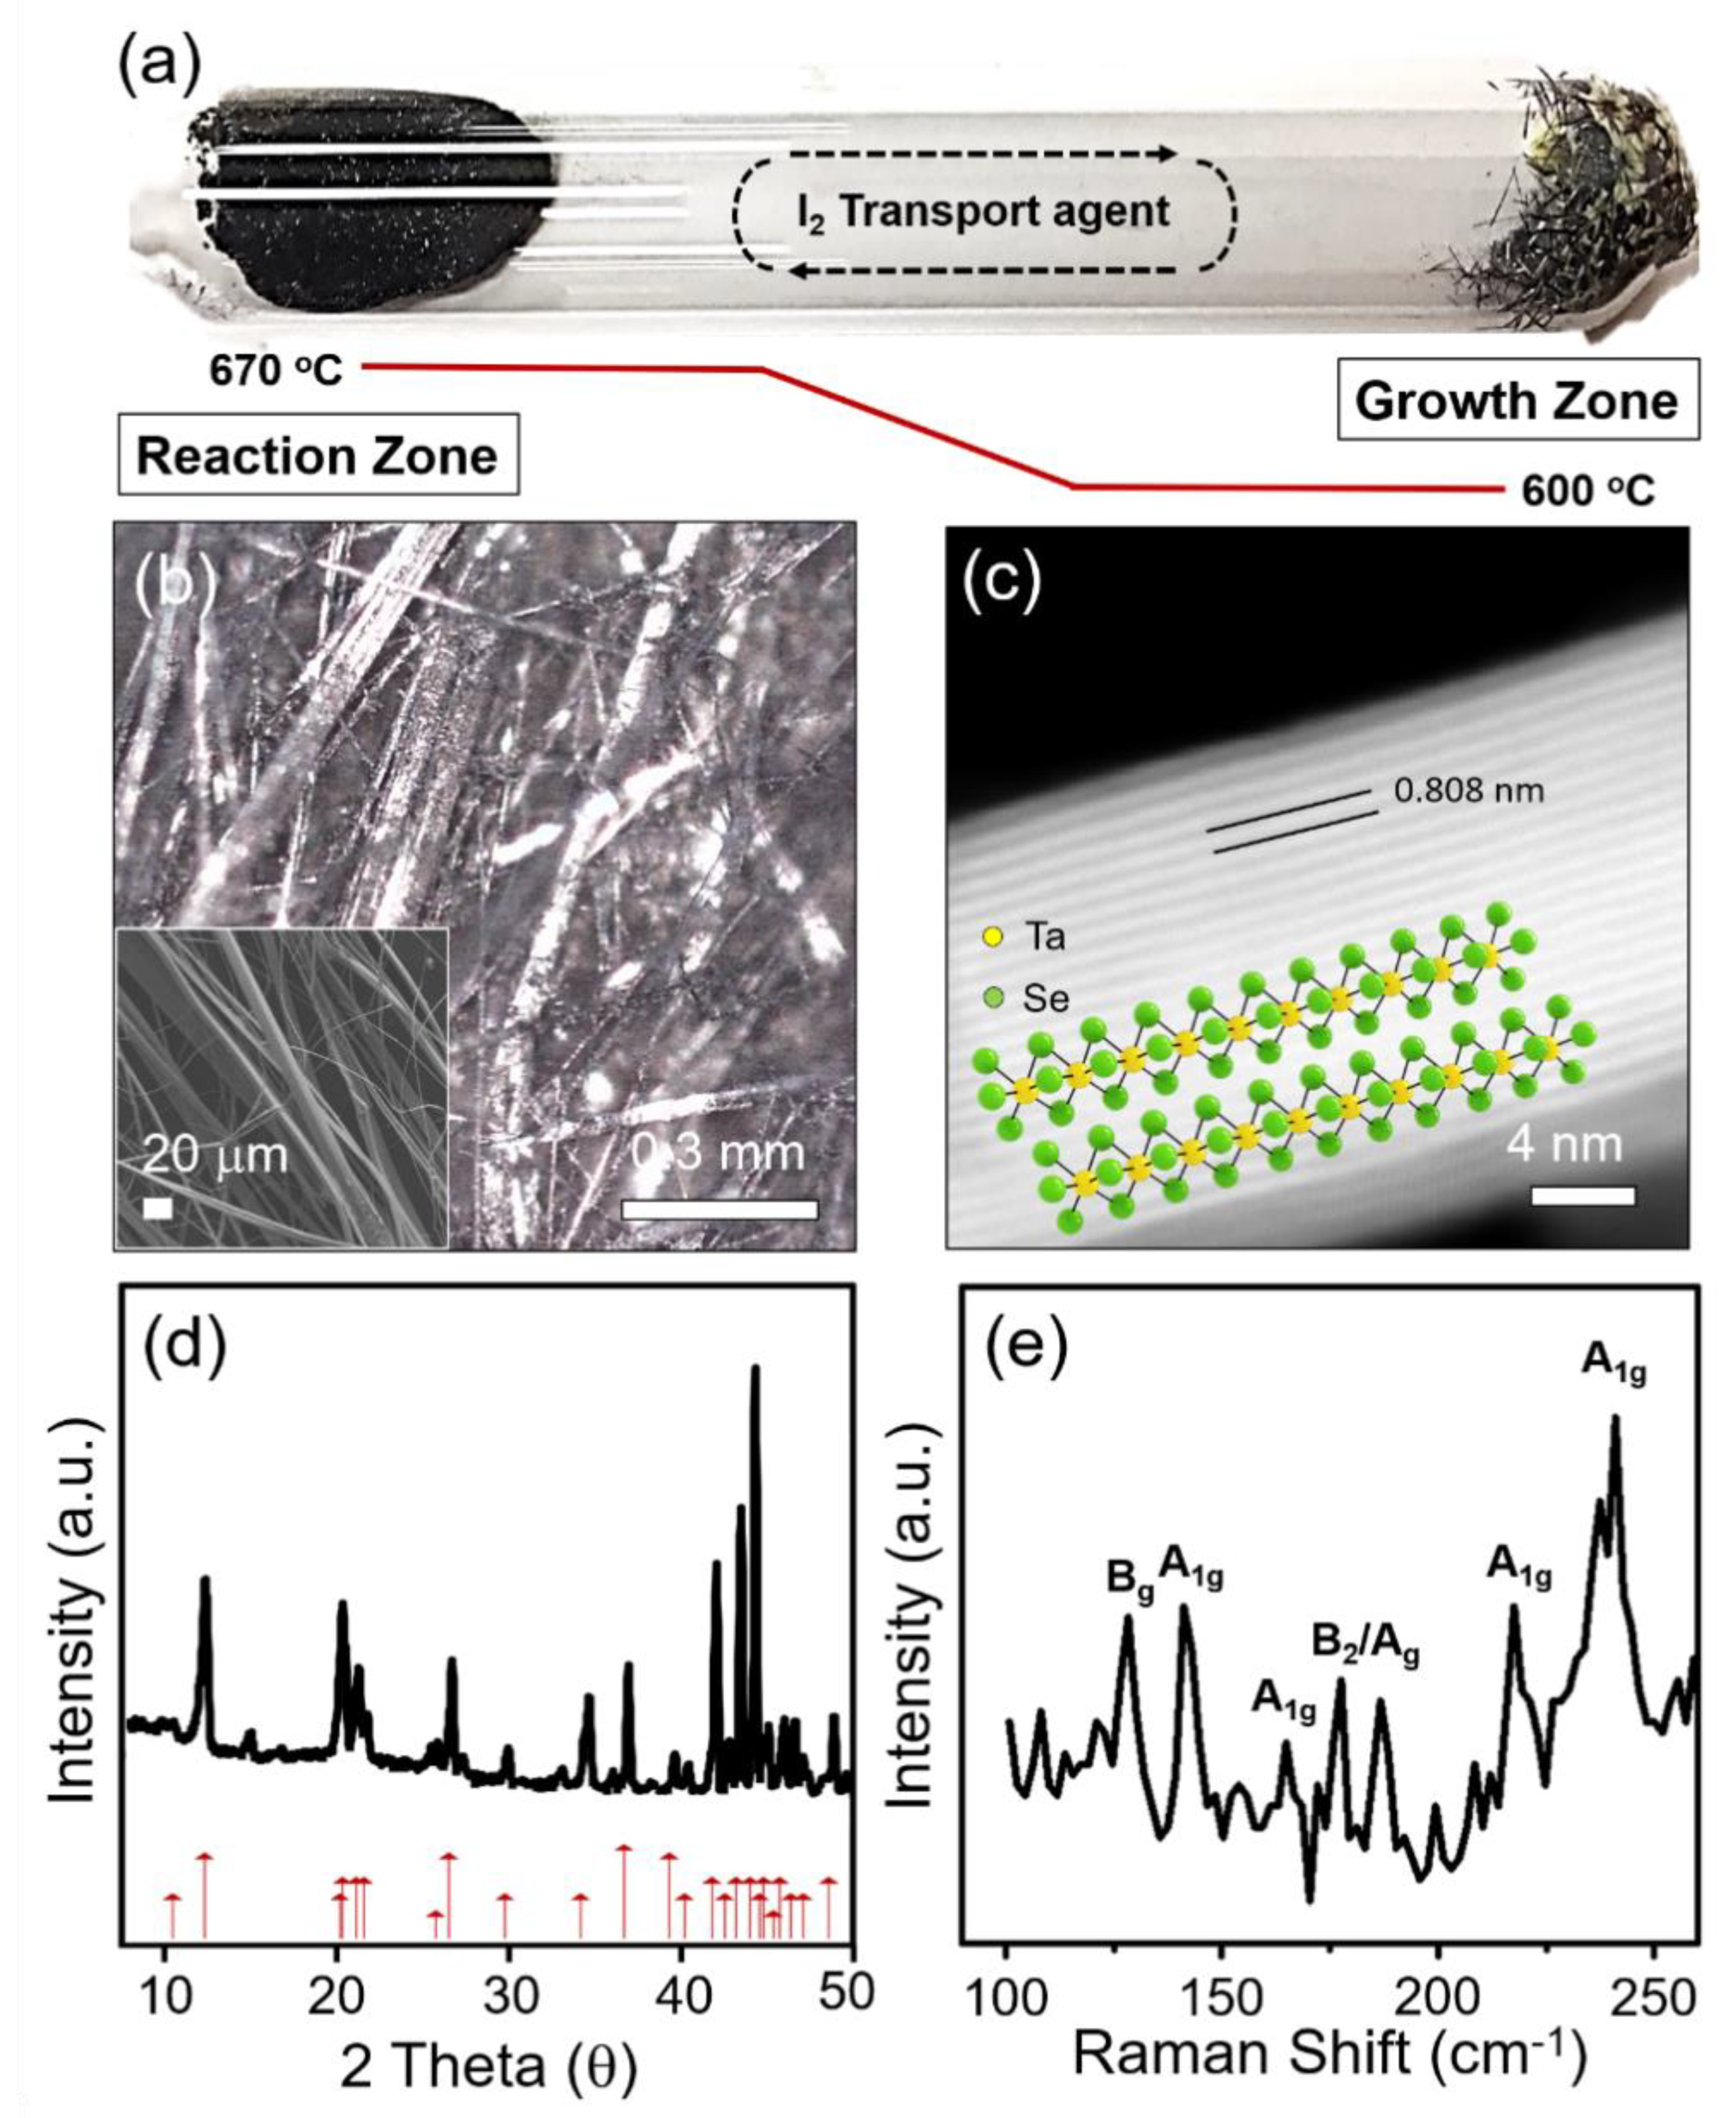
2.1. Synthesis

The single-crystalline TaSe3 was prepared by the CVT method (as described in Figure 1a). For the growth of TaSe3, stoichiometric amounts of tantalum powder (0.42 g, Alfa Aesar, 99.97%, Haverhill, MA, USA) and selenium powder (0.58 g, Alfa Aesar, 99.999%, Haverhill, MA, USA), with iodine (10 mg, Sigma Aldrich, 99.999%, Saint Louis, MO, USA) as a transport agent, were placed in a quartz tube (18 × 1 cm) that was subsequently evacuated and sealed. After that, the tube was placed in a home-made two-zone tube furnace. The reaction zone was slowly heated to 670 °C, and maintained at constant temperature for 10 days to allow for the compound synthesis. Similarly, the temperature of the growing zone was maintained at 600 °C (heating rate: 200 °C/h). Finally, the furnace was switched off, and cooled down to room temperature (cooling rate: 50 °C/h).

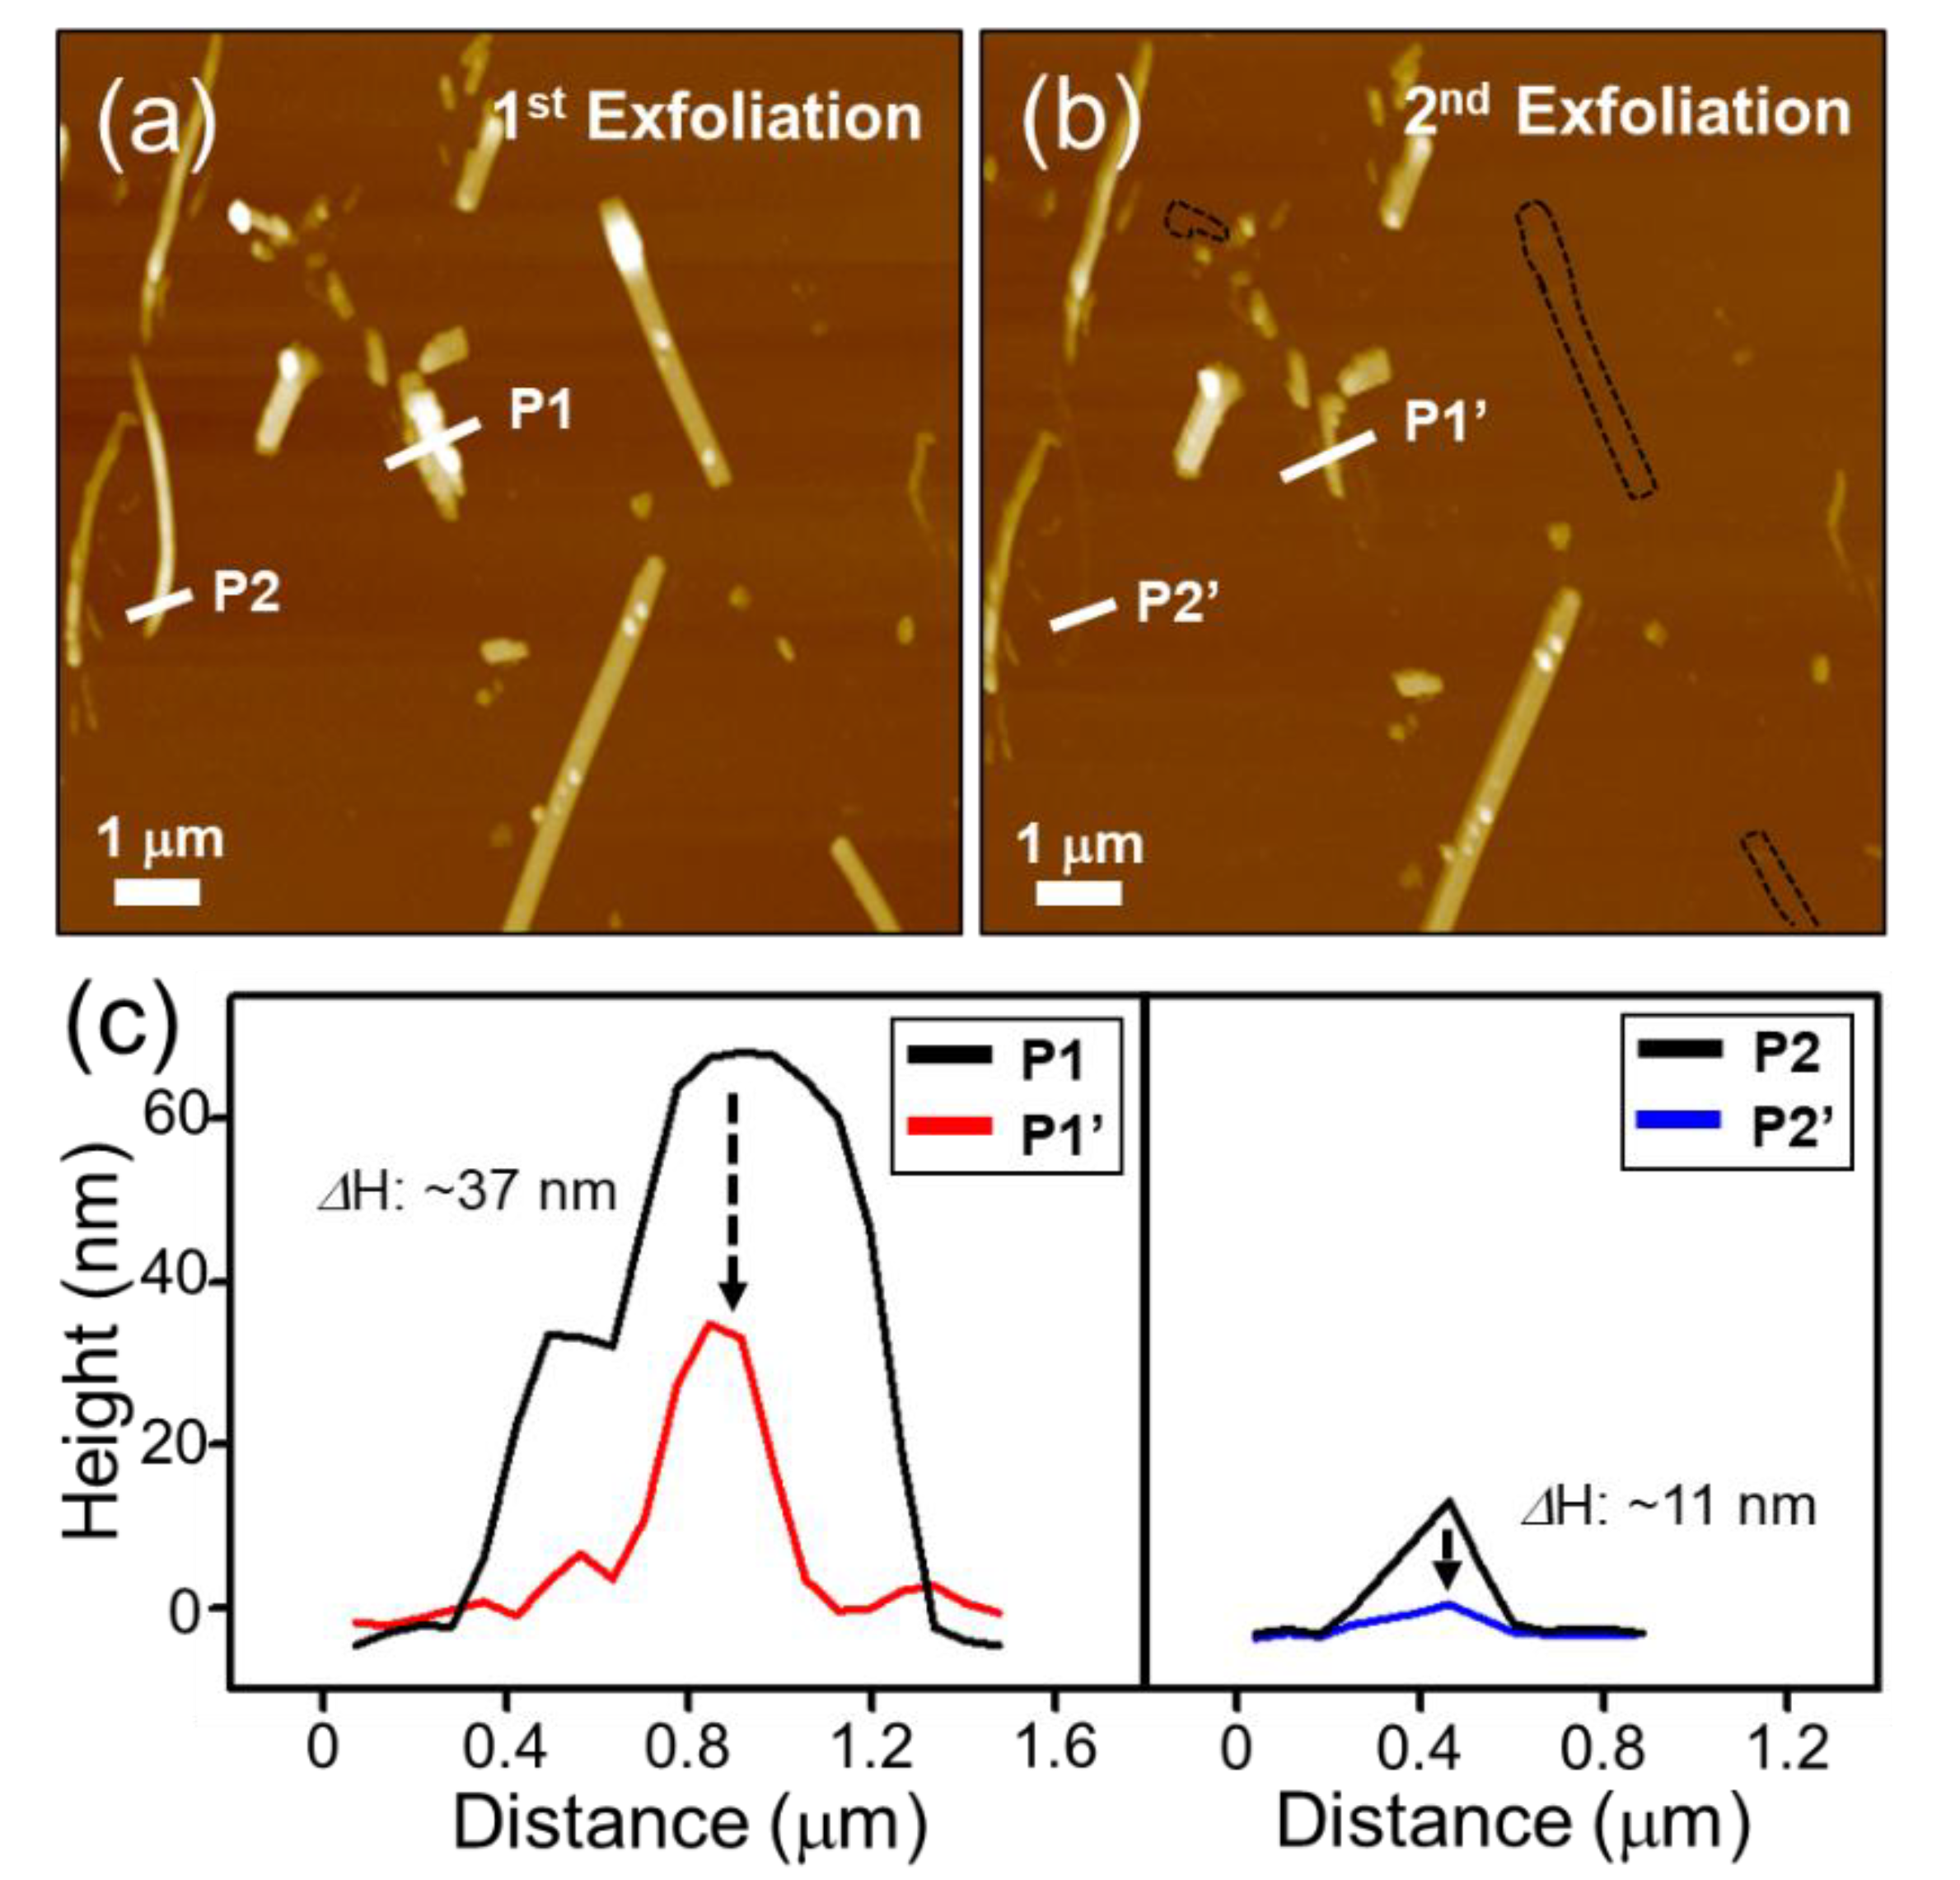
2.2. Mechanical Exfoliation

As-grown bulk TaSe3 was placed on a wafer dicing tape (BT150EKL, Nitto, Umeda, Japan) and stuck several times to obtain a thinner-than-bulk material. A 300 nm SiO2/Si substrate was cleaned by ultrasonication in acetone, ethanol, and deionized water for 15 min, followed by heating at 100 °C to remove moisture from the surface. The polymer tape was then pressed firmly, and adhered to the 300 nm SiO2/Si substrate. After adhesion, the polymer tape was removed from the substrate, and the process was repeated.

2.3. Characterization

Powder X-ray diffraction (XRD) (Mac Science, M18XHF22, Tilburg, the Netherlands) was performed using Cu–Kα radiation (λ = 0.154 nm), and a step size of 0.04/s. Optical Microscope (OM) (OLYMPUS, BX51M, Tokyo, Japan) was performed in bright field condition. AFM (Park systems, NX10, Suwon, Korea) was performed in non-contact mode for the topographic analysis. Field emission scanning electron microscopy (FE-SEM) (Hitachi, S4300SE, Tokyo, Japan) and scanning transmission electron microscopy (STEM) (JEOL, JEM-2100F, Tokyo, Japan) were used to evaluate morphology and crystallinity of exfoliated TaSe3. For TEM imaging, TaSe3 flakes ultrasonicated in an ethanol solution were dispersed onto a Cu grid with a lacy carbon support film, and imaged at an accelerating voltage of 200 kV. Raman spectroscopy (HORIBA, LabRAM HV, Kyoto, Japan) with excitation energy of 1.58 eV (785 nm, 5 mW) was used to characterize the TaSe3 flakes on a 300 nm SiO2/Si substrate. SKPM (Park systems, NX10, Suwon, Korea) measurements were performed using n-type Si tips coated with Cr–Au (NSC36/Cr–Au, Mikromash Inc., Watsonville, CA, USA) at a resonance frequency of 65 kHz, scan rate of 0.5 Hz, and sample bias of ±1 V. The Cr–Au tip was calibrated by highly ordered pyrolytic graphite ( φ HOPG = 4.65 eV) and the calculated work function of the Cr–Au tip was about 4.88 eV.

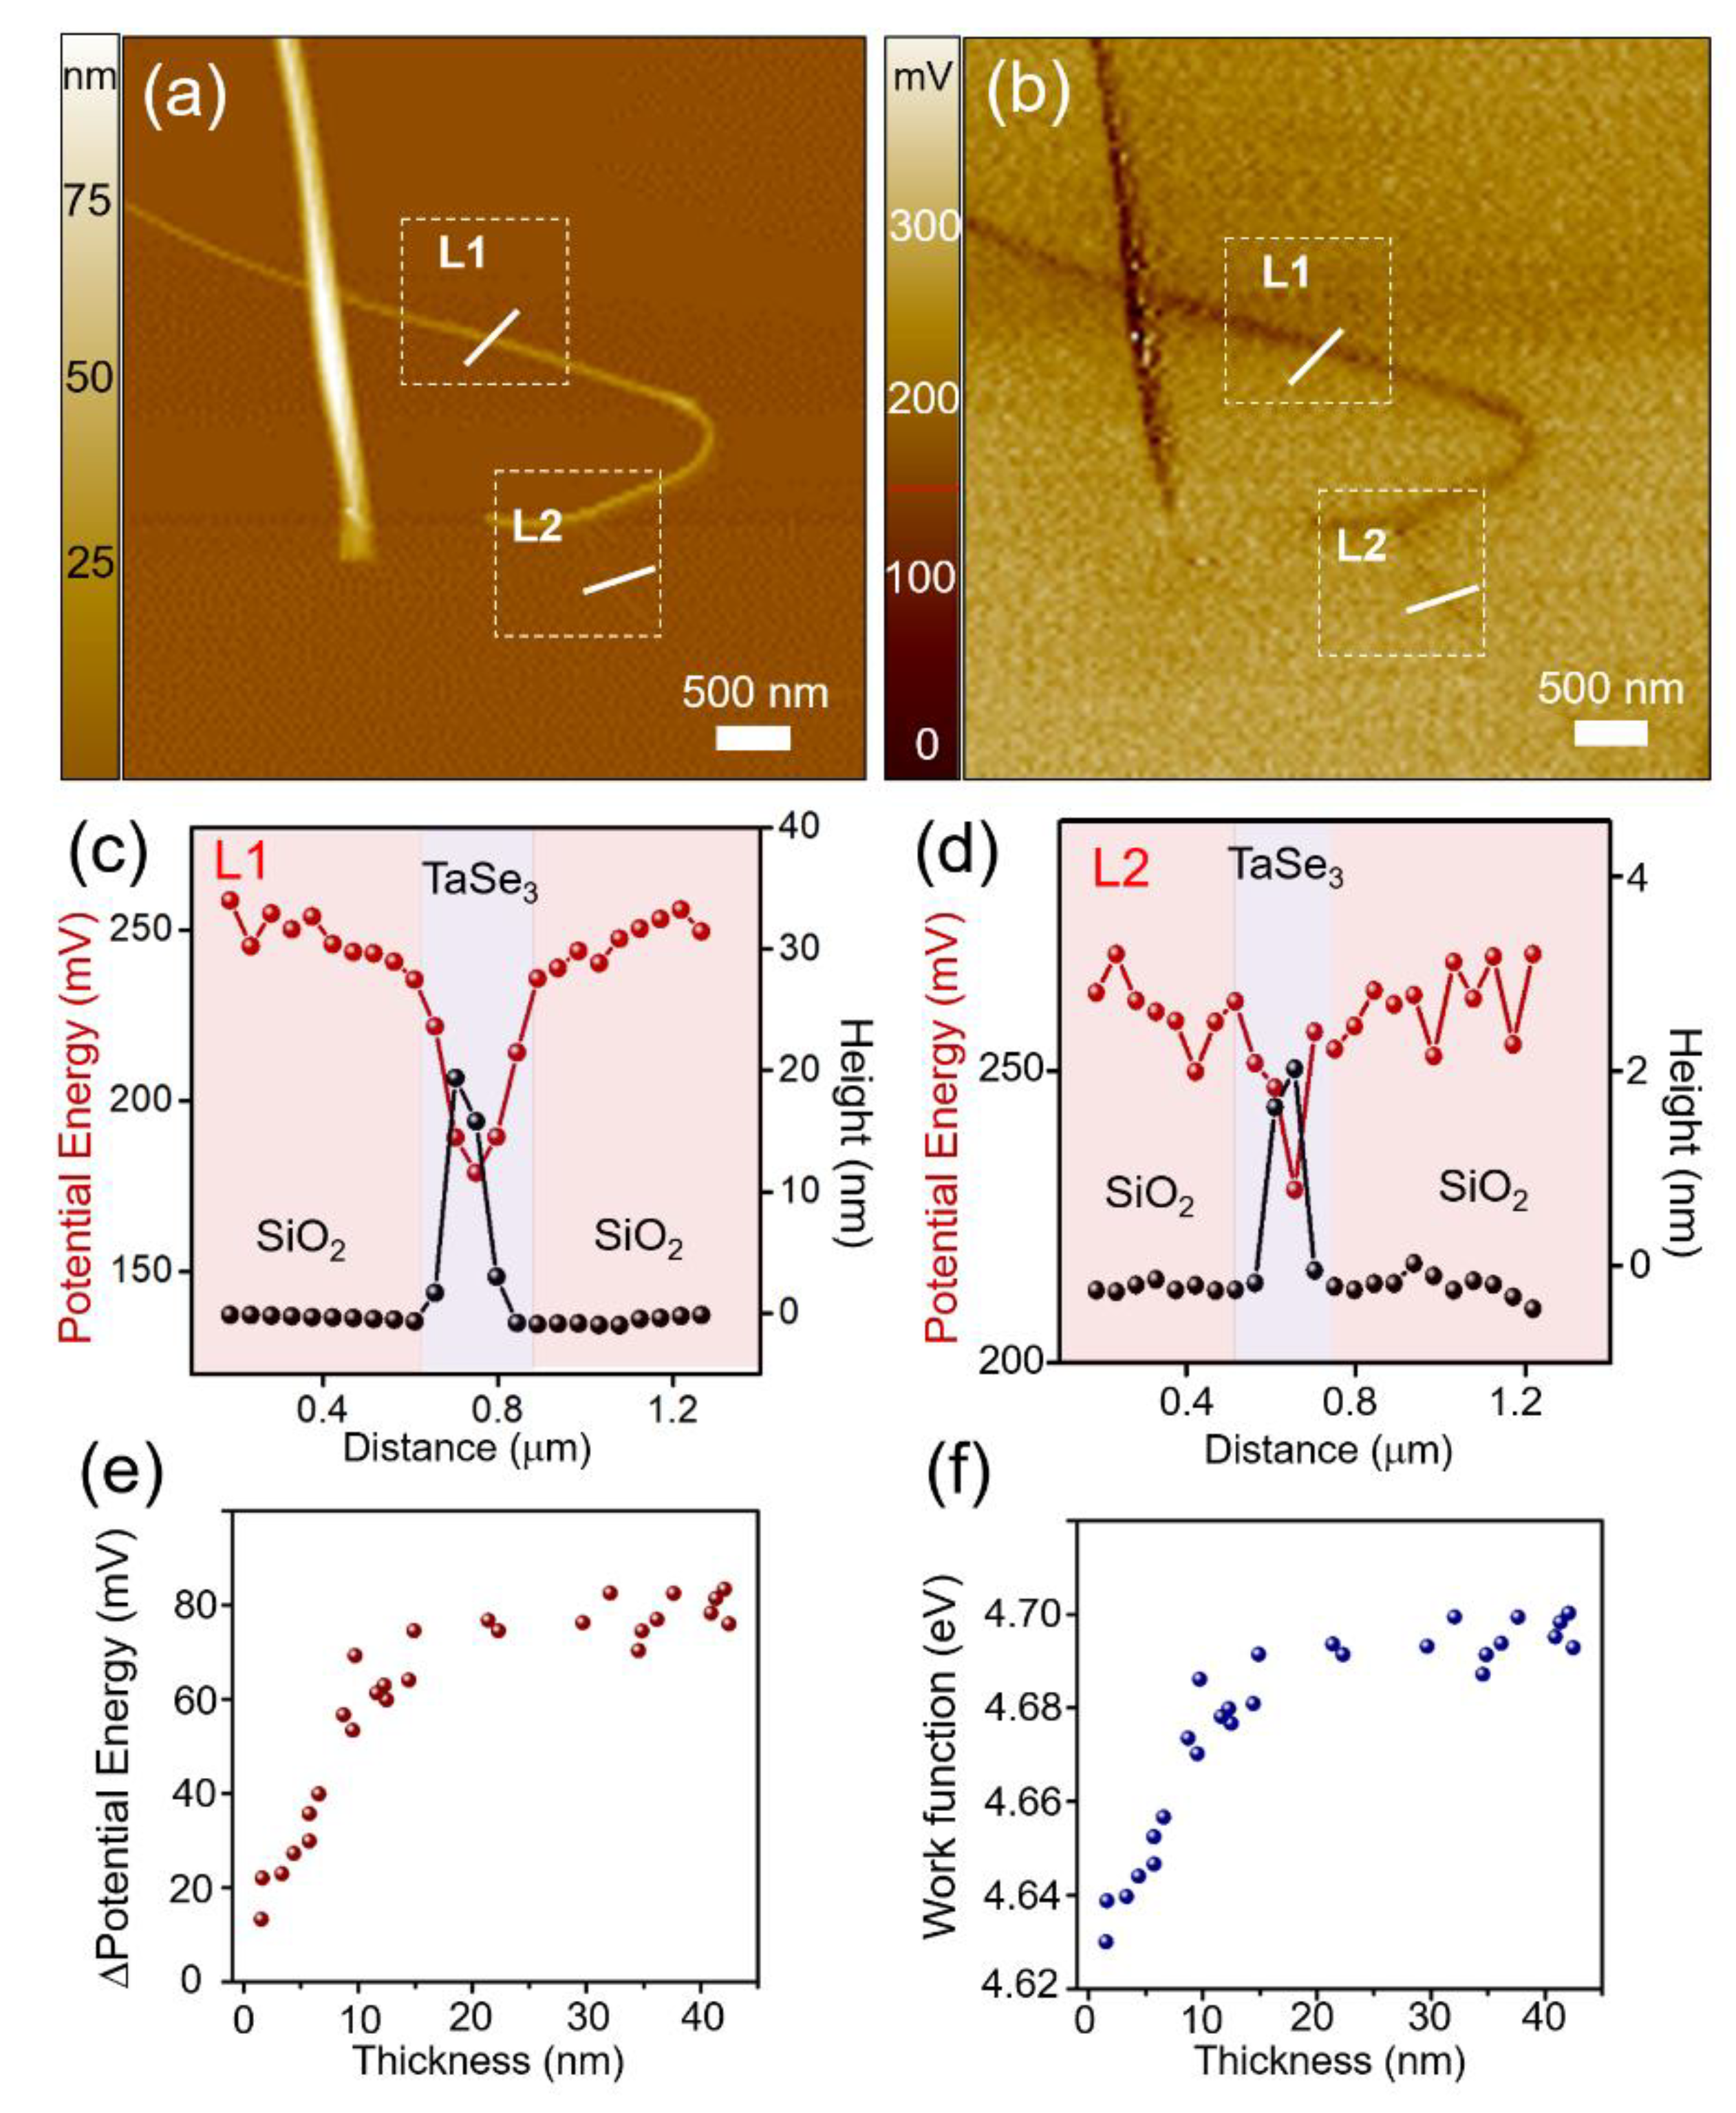
3. Results and Discussion

Shiny and needle-like TaSe3 wires are obtained by the CVT method (see Section 2 and Figure 1a,b). As shown in the inset of Figure 1b, individual TaSe3 bundles—tens of nanometers in diameter—have weak vdWs forces of attraction, and thus can be separated into multiple strands of chains during sample preparation for FE-SEM. The STEM image of the exfoliated TaSe3 flake showed continuous and clean lattice fringes of 0.808 nm gap, corresponding to the (1, 0, −1) plane (Figure 1c). The crystalline structure of the TaSe3 was further characterized using XRD and Raman spectroscopy as shown in Figure 1d,e. Strong XRD peaks of as-grown TaSe3 wires were consistent with the peaks from the crystallography database of TaSe3 (red arrows in Figure 1d, JCPDS-04-007-1143). Raman spectra for a single TaSe3 wire were obtained under a laser power of 5 mW to avoid laser-induced rupturing and heating effects. The obtained Raman spectra exhibited several distinct peaks at 100 to 260 cm−1, originating from the prismatic chain structure of metal trichalcogenide [14,27,33,34]. The peaks at 141, 164, 217, and 237 cm−1 corresponded to the out-of-plane (A1g) vibration mode, while those at 177 and 186 cm−1 represented vibration symmetry of chain (B2) and crystal (Ag). The relatively strong peak at 128 cm−1 represented the shearing (Bg) vibration of the chains, indicating a strong Ta–Se intrachain bond of TaSe3.
To verify the layered nature of the bulk TaSe3 crystals, the well-known micromechanical cleavage technique was employed (Figure 2a) [2]. Figure 2b–d shows AFM images of the exfoliated TaSe3 flakes with different thicknesses transferred on the 300 nm SiO2/Si substrate. Like other 2D materials (e.g., graphene and h-BN), the color of the flakes changed from yellowish to bluish as the thickness decreased (see the AFM images in Figure S1) [35,36]. The surface of the exfoliated flake was observed to have a semi-infinite planar structure, indicating that TaSe3 is a quasi-1D vdWs material and can be employed as an important component of the 2D vdWs heterostructure.
By using a repeated peeling method [16,21], the thickness of the exfoliated TaSe3 flakes could be controlled. Figure 3 shows that the thickness of the TaSe3 flakes decreased from 70 to 36 nm (P1 to P1’), and from 16 to 5 nm (P2 to P2’), after an additional exfoliation process at the same location using an adhesive tape. Some parts of the TaSe3 flakes disappeared, and are marked as a black dotted line in Figure 3b.
Eventually, we obtained a monolayer of TaSe3 nanoribbons (TaSe3 structure with a single molecule chain thickness of 0.8 nm, and width of approx. 20 nm) on a 300 nm SiO2/Si substrate (Figure 4). We expect that the obtained monolayer of TaSe3 nanoribbon can be applied to 2D heterostructures as a quasi-1D conduction channel with ideal transport characteristics.
The difference in electrical properties according to the number of layers (i.e. thickness) of the exfoliated TaSe3 flakes was evaluated through SKPM analysis. The local surface potential energy difference and the work function were determined by measuring the contact potential difference between the tip and the sample (VCPD) [35,37,38]. Since the TaSe3 bundle was transferred to a 300 nm SiO2/Si substrate, the work function could be calculated using the following equations:
V C P D = 1 e ( φ t φ f )
V C P D = V C P D ( T a S e 3 ) V C P D ( s u b s t r a t e )
= 1 e ( φ t φ f ) 1 e ( φ t φ s )
= 1 e ( φ s φ f )
where φ t , φ s , and φ f represent the work functions of the tip, SiO2, and TaSe3, respectively. Figure 5a,b show an AFM and SKPM image, respectively, of the same TaSe3 flakes on a 300 nm SiO2/Si substrate, while Figure 5c,d illustrate how the value of the surface potential energy varied with the TaSe3 thickness, as marked in L1 and L2, respectively. The thickness and potential energy difference of L1 were approx. 22 nm (approx. 25 layers) and 70 mV, respectively, and those of L2 were approx. 2 nm (approx. 2 layers) and 25 mV, respectively. From the results of further measurements of 27 samples with different thickness, we are able to confirm that, as the thickness of the TaSe3 flake decreased below 24 nm, the surface potential energy difference and work function sharply decreased (Figure 5e,f). The results for the thickness dependence work function variation will be useful for selecting a suitable contact material for future nano-devices that could have a significant impact on performance. These results appear to be caused by the interlayer screening effect, which is commonly observed in other exfoliated layered nanomaterials on substrate. In addition, in comparison with the graphene (~2 nm) and MoS2 (~5 nm), the TaSe3 had longer screening length (24 nm), indicating that chemical property of the TaSe3 might be hydrophilic [35,37,38,39].

4. Conclusions

In this study, we successfully demonstrated that needle-like TaSe3 crystals can be exfoliated to a chain-based quasi-1D layered structure. The thickness (or number of layers) of TaSe3 flakes was controlled by repeated exfoliation and, eventually, a monolayer TaSe3 nanoribbon was obtained. Through AFM and SKPM analysis, we verified that the change in the work function depended on the thickness of the TaSe3 flakes due to the interlayer screening effect. We anticipate that our results will help in developing and designing next-generation devices based on 2D vdWs heterostructure.

Supplementary Materials

The following are available online at https://www.mdpi.com/1996-1944/12/15/2462/s1, Figure S1: (a) OM and (b) AFM image of exfoliated TaSe3 flakes on 300 nm SiO2/Si substrate. (c) Line profile of the corresponding TaSe3 flake, as marked in (b).

Author Contributions

Conceptualization and Supervision, J.-H.L. and J.-Y.C.; SKPM analysis, B.J.K. and B.J.J.; synthesis, S.O., S.C. and K.H.C.; investigation, T.N., S.H.L., H.K.L., I.J.C., M.-K.H. and H.K.Y.

Funding

This work was supported by the Nano Material Technology Development Program through the National Research Foundation of Korea (NRF) funded by the Ministry of Science and ICT (NRF-2019R1F1A1063170 and 2009-0082580). J.H. Lee acknowledges support from the Presidential Postdoctoral Fellowship Program of the NRF in Korea (2014R1A6A3A04058169).

Conflicts of Interest

The authors declare no conflict of interest.

References

  1. Huang, X.J.; Lee, W.-C.; Kuo, C.; Hisamoto, D.; Chang, L.; Kedzierski, J.; Anderson, E.; Takeuchi, H.; Choi, Y.-K.; Asano, K.; et al. Sub-50 nm p-channel FinFET. IEEE Trans. Electron Dev. 2001, 48, 880–886. [Google Scholar] [CrossRef]
  2. Novoselov, K.S.; Geim, A.K.; Morozov, S.; Jiang, D.; Katsnelson, M.I.; Grigorieva, I.; Dubonos, S.V.; Firsov, A.A. Two-dimensional gas of massless Dirac fermions in graphene. Nature 2005, 438, 197–200. [Google Scholar] [CrossRef] [PubMed]
  3. Radisavljevic, B.; Radenovic, A.; Brivio, J.; Giacometti, V.; Kis, A. Single-layer MoS2 transistors. Nat. Nanotechnol. 2011, 6, 147–150. [Google Scholar] [CrossRef] [PubMed]
  4. Geim, A.K.; Grigorieva, I.V. Van der Waals heterostructures. Nature 2013, 499, 419–425. [Google Scholar] [CrossRef] [PubMed]
  5. Huang, X.; Lee, W.C.; Kuo, C.; Hisamoto, D.; Chang, L.; Kedzierski, J.; Anderson, E.; Takeuchi, H.; Choi, Y.-K.; Asano, K.; et al. Sub-50 nm FinFET: PMOS. In Proceedings of the International Electron Devices Meeting, Washington, DC, USA, 5–8 December 1999; pp. 67–70. [Google Scholar]
  6. Pal, R.S.; Sharma, S.; Dasgupta, S. Recent trend of FinFET devices and its challenges: A review. In Proceedings of the 2017 Conference on Emerging Devices and Smart Systems, Tiruchengode, India, 3–4 March 2017; pp. 150–154. [Google Scholar]
  7. Zhang, P.; Wang, F.; Yu, M.; Zhuang, X.; Feng, X. Two-dimensional materials for miniaturized energy storage devices: from individual devices to smart integrated systems. Chem. Soc. Rev. 2018, 47, 7426–7451. [Google Scholar] [CrossRef] [PubMed] [Green Version]
  8. Lee, S.; Shi, Q.; Lee, C. From flexible electronics technology in the era of IoT and artificial intelligence toward future implanted body sensor networks. APL Mater. 2019, 7, 031302. [Google Scholar] [CrossRef] [Green Version]
  9. Lee, J.H.; Kim, B.S.; Choi, S.H.; Jang, Y.; Hwang, S.W.; Whang, D. A facile route to Si nanowire gate-all-around field effect transistors with a steep subthreshold slope. Nanoscale 2013, 5, 8968–8972. [Google Scholar] [CrossRef]
  10. Lee, C.; Wei, X.; Kysar, J.W.; Hone, J. Hone Measurement of the elastic properties and intrinsic strength of monolayer graphene. Science 2008, 321, 385–388. [Google Scholar] [CrossRef]
  11. Schwierz, F. Graphene transistors. Nat. Nanotechnol. 2010, 5, 487–496. [Google Scholar] [CrossRef]
  12. Novoselov, K.S.; Mishchenko, A.; Carvalho, A.; Neto, A.C. 2D materials and van der Waals heterostructures. Science 2016, 353, aac9439. [Google Scholar] [CrossRef] [Green Version]
  13. Cao, Y.; Fatemi, V.; Fang, S.; Watanabe, K.; Taniguchi, T.; Kaxiras, E.; Jarillo-Herrero, P. Unconventional superconductivity in magic-angle graphene superlattices. Nature 2018, 556, 43–50. [Google Scholar] [CrossRef] [PubMed]
  14. Stolyarov, M.A.; Liu, G.; Bloodgood, M.A.; Aytan, E.; Jiang, C.; Samnakay, R.; Salguero, T.T.; Nika, D.L.; Rumyantsev, S.L.; Shur, M.S.; et al. Breakdown current density in h-BN-capped quasi-1D TaSe3 metallic nanowires: prospects of interconnect applications. Nanoscale 2016, 8, 15774–15782. [Google Scholar] [CrossRef] [PubMed]
  15. Meden, A.; Kodre, A.; Gomilsek, J.P.; Arcon, I.; Vilfan, I.; Vrbanic, D.; Mrzel, A.; Mihailovic, D. Atomic and electronic structure of Mo6S9−xIx nanowires. Nanotechnology 2005, 16, 1578–1583. [Google Scholar] [CrossRef]
  16. Kim, B.J.; Jeong, B.J.; Oh, S.; Chae, S.; Choi, K.H.; Nasir, T.; Lee, S.H.; Kim, K.W.; Lim, H.K.; Choi, I.J.; et al. Choi Mechanical exfoliation and electrical characterization of a one-dimensional Nb2Se9 atomic crystal. RSC Adv. 2018, 8, 37724–37728. [Google Scholar] [CrossRef]
  17. Oh, S.; Chae, S.; Kim, B.J.; Siddiqa, A.J.; Choi, K.H.; Jang, W.S.; Lee, K.H.; Kim, H.Y.; Lee, D.K.; Kim, Y.M.; et al. Inorganic Molecular Chain Nb2Se9: Synthesis of Bulk Crystal and One-Atom-Thick Level Exfoliation. Phys. Status Solidi RRL 2018, 12, 1800451. [Google Scholar] [CrossRef]
  18. Chae, S.; Siddiqa, A.J.; Oh, S.; Kim, B.J.; Choi, K.H.; Jang, W.S.; Kim, Y.M.; Yu, H.K.; Choi, J.Y. Isolation of Nb2Se9 Molecular Chain from Bulk One-Dimensional Crystal by Liquid Exfoliation. Nanomaterials 2018, 8, 794. [Google Scholar] [CrossRef] [PubMed]
  19. Oh, S.; Chae, S.; Kim, B.J.; Choi, K.H.; Jang, W.S.; Jang, J.M.; Hussain, Y.; Lee, D.K.; Kim, Y.M.; Yu, H.K.; et al. Synthesis of a one-dimensional atomic crystal of vanadium selenide (V2Se9). RSC Adv. 2018, 8, 33980–33984. [Google Scholar] [CrossRef]
  20. Chae, S.; Siddiqa, A.J.; Kim, B.J.; Oh, S.; Choi, K.H.; Lee, K.H.; Kim, H.Y.; Yu, H.K.; Choi, J.Y. Isolation of inorganic molecular chains from rod-like bulk V2Se9 crystal by liquid exfoliation. RSC Adv. 2018, 8, 35348–35352. [Google Scholar] [CrossRef]
  21. Kim, B.J.; Jeong, B.J.; Oh, S.; Chae, S.; Choi, K.H.; Nasir, T.; Lee, S.H.; Kim, K.W.; Lim, H.K.; Choi, I.J.; et al. Exfoliation and Characterization of V2Se9 Atomic Crystals. Nanomaterials 2018, 8, 737. [Google Scholar] [CrossRef]
  22. Chae, S.; Siddiqa, A.J.; Kim, B.J.; Oh, S.; Choi, K.H.; Kim, H.Y.; Lee, K.H.; Yu, H.K.; Choi, J.Y. Design of dispersant structures for preparing highly concentrated one-dimensional inorganic molecular chains from V2Se9 crystals. Chem. Commun. 2018, 54, 12190–12193. [Google Scholar] [CrossRef]
  23. Nie, S.; Xing, L.; Jin, R.; Xie, W.; Wang, Z.; Prinz, F. Topological phases in the TaSe3 compound. Phys. Rev. B 2018, 98, 125143. [Google Scholar] [CrossRef]
  24. Kumagai, G.; Matsuura, T.; Ichimura, K.; Yamaya, K.; Inagaki, K.; Tanda, S. Topological effects of the superconducting vortex state in a TaSe3 ring crystal: Observation of magnetic torque oscillations. Phys. Rev. B 2010, 81, 184506. [Google Scholar] [CrossRef]
  25. Matsuura, T.; Tanda, S.; Asada, K.; Sakai, Y.; Tsuneta, T.; Inagaki, K.; Yamaya, K. Structural and electrical properties of TaSe3 ring crystals. Physica B 2003, 329, 1550–1551. [Google Scholar] [CrossRef]
  26. Kumagai, G.; Matsuura, T.; Ichimura, K.; Tanda, S. Discovery of new vortex state in TaSe3 topological ring crystals. Physica B 2010, 405, S284–S287. [Google Scholar] [CrossRef]
  27. Liu, G.; Rumyantsev, S.; Bloodgood, M.A.; Salguero, T.T.; Shur, M.; Balandin, A.A. Low-Frequency Electronic Noise in Quasi-1D TaSe3 van der Waals Nanowires. Nano Lett. 2017, 17, 377–383. [Google Scholar] [CrossRef]
  28. Tanda, S.; Kawamoto, H.; Shiobara, M.; Okajima, Y.; Yamaya, K. Ring-shaped crystals of NbSe3 and TaSe3. J. Phys. IV 1999, 9, 379–381. [Google Scholar] [CrossRef]
  29. Geremew, A.; Bloodgood, M.A.; Aytan, E.; Woo, B.W.K.; Corber, S.R.; Liu, G.; Bozhilov, K.; Salguero, T.T.; Rumyantsev, S.; Rao, M.; et al. Current Carrying Capacity of Quasi-1D ZrTe3 Van Der Waals Nanoribbons. IEEE Electron Dev. Lett. 2018, 39, 735–738. [Google Scholar] [CrossRef]
  30. Perucchi, A.; Sondergaard, C.; Mitrovic, S.; Grioni, M.; Barisic, N.; Berger, H.; Forro, L.; Degiorgi, L. Spectroscopic and dc-transport investigations of the electronic properties of TaSe3. Eur. Phys. J. B 2004, 39, 433–440. [Google Scholar] [CrossRef]
  31. Nomura, A.; Yamaya, K.; Takayanagi, S.; Ichimura, K.; Matsuura, T.; Tanda, S. Emergence of a resistance anomaly by Cu-doping in TaSe3. EPL 2017, 119, 17005. [Google Scholar] [CrossRef]
  32. Nomura, A.; Yamaya, K.; Takayanaci, S.; Ichimura, K.; Tanda, S. Effect of Cu doping on superconductivity in TaSe3: Relationship between superconductivity and induced charge density wave. EPL 2018, 124, 67001. [Google Scholar] [CrossRef]
  33. Bjerkelund, E.; Kjekshus, A. On the Crystal Structure of TaSe3. Acta Chem. Scand. 1965, 19, 701–710. [Google Scholar] [CrossRef]
  34. Bjerkelund, E.; Fermor, J.H.; Kjekshus, A. On the properties of TaS3 and TaSe3. Acta Chem. Scand. 1966, 20, 1836–1842. [Google Scholar] [CrossRef]
  35. Lee, N.J.; Yoo, J.W.; Choi, Y.J.; Kang, C.J.; Jeon, D.Y.; Kim, D.C.; Seo, S.; Chung, H.J. The interlayer screening effect of graphene sheets investigated by Kelvin probe force microscopy. Appl. Phys. Lett. 2009, 95, 222107. [Google Scholar] [CrossRef]
  36. Golla, D.; Chattrakun, K.; Watanabe, K.; Taniguchi, T.; LeRoy, B.J.; Sandhu, A. Optical thickness determination of hexagonal boron nitride flakes. Appl. Phys. Lett. 2013, 102, 191606. [Google Scholar] [CrossRef]
  37. Choi, S.; Shaolin, Z.; Yang, W. Layer-number-dependent work function of MoS2 nanoflakes. J. Korean Phys. Soc. 2014, 64, 1550–1555. [Google Scholar] [CrossRef]
  38. Li, Y.; Xu, C.Y.; Zhen, L. Surface potential and interlayer screening effects of few-layer MoS2 nanoflakes. Appl. Phys. Lett. 2013, 102, 143110. [Google Scholar] [CrossRef]
  39. Hao, G.L.; Huang, Z.Y.; Liu, Y.D.; Qi, X.; Ren, L.; Peng, X.Y.; Yang, L.W.; Wei, X.L.; Zhong, J.X. Electrostatic properties of few-layer MoS2 films. AIP Adv. 2013, 3, 042125. [Google Scholar] [CrossRef]
Figure 1. (a) Photograph of the sealed evacuated quartz ampoule after the chemical vapor transport (CVT) process for TaSe3 crystal growth. (b) OM image of entangled needle-like TaSe3 single crystals. The inset shows a high-magnification FE-SEM image of TaSe3 crystals. (c) Scanning transmission electron microscopy (STEM) image of TaSe3 flakes obtained by chemical exfoliation. The inset is an illustration of the crystal structure of the TaSe3. (d) XRD pattern of the bulk TaSe3. (e) Micro-Raman spectra of the bulk TaSe3 on a 300 nm SiO2/Si substrate.
Materials 12 02462 g001
Figure 2. (a) Schematic illustration for the mechanical exfoliation of TaSe3 flakes from bulk TaSe3 crystal using the Scotch tape method and (bd) atomic force microscopy (AFM) images of exfoliated TaSe3 flakes on 300 nm SiO2/Si substrate. Inset of (b) shows line profile of the corresponding TaSe3 flake, as marked in (b) and inset of (c) shows 3D AFM image of the exfoliated TaSe3 flake.
Materials 12 02462 g002
Figure 3. (a) AFM image of the first exfoliated TaSe3 nanoribbon on a 300 nm SiO2/Si substrate, (b) AFM image of second exfoliated TaSe3 nanoribbon on a 300 nm SiO2/Si substrate, and (c) line profile graph before and after exfoliation of the TaSe3 bundles.
Materials 12 02462 g003
Figure 4. (a) 3D image of the monolayer of a quasi-1D TaSe3 nanoribbon on a 300 nm SiO2/Si substrate after multiple peelings, (b) AFM image of an isolated monolayer TaSe3 nanoribbon, and (c) line-profile graph marked as L1, L2, L3, and L4 in Figure 4b.
Materials 12 02462 g004
Figure 5. (a) AFM height image; (b) identical SKPM image of the exfoliated TaSe3 flakes on a 300 nm SiO2/Si substrate; (c,d) height/potential energy profiles of the flakes in (a) and (b); and (e,f) variations in the potential energy difference and work function, respectively, according to the thickness of the TaSe3 flakes.
Materials 12 02462 g005

