Characterization of Cellulase-Treated Fibers and Resulting Cellulose Nanocrystals Generated through Acid Hydrolysis


Abstract
1. Introduction
2. Materials and Methods
2.1. Fiber Structure and Dimensions
2.1.1. SEM Imaging
2.1.2. Image Analysis on Pulp Quality Monitoring System
2.2. CNC Particle Size and Zeta Potential Measurements
2.2.1. Dynamic Light Scattering
Hydrodynamic Diameter
Colloid Stability
2.2.2. Particle Size from TEM Analysis
2.3. Degree of Crystallinity of Fibers and CNCs
2.4. CNC Thermogravimetric Analysis
2.5. Data Analysis
3. Results and Discussion
3.1. Characteristics of Enzyme-Treated Fibers
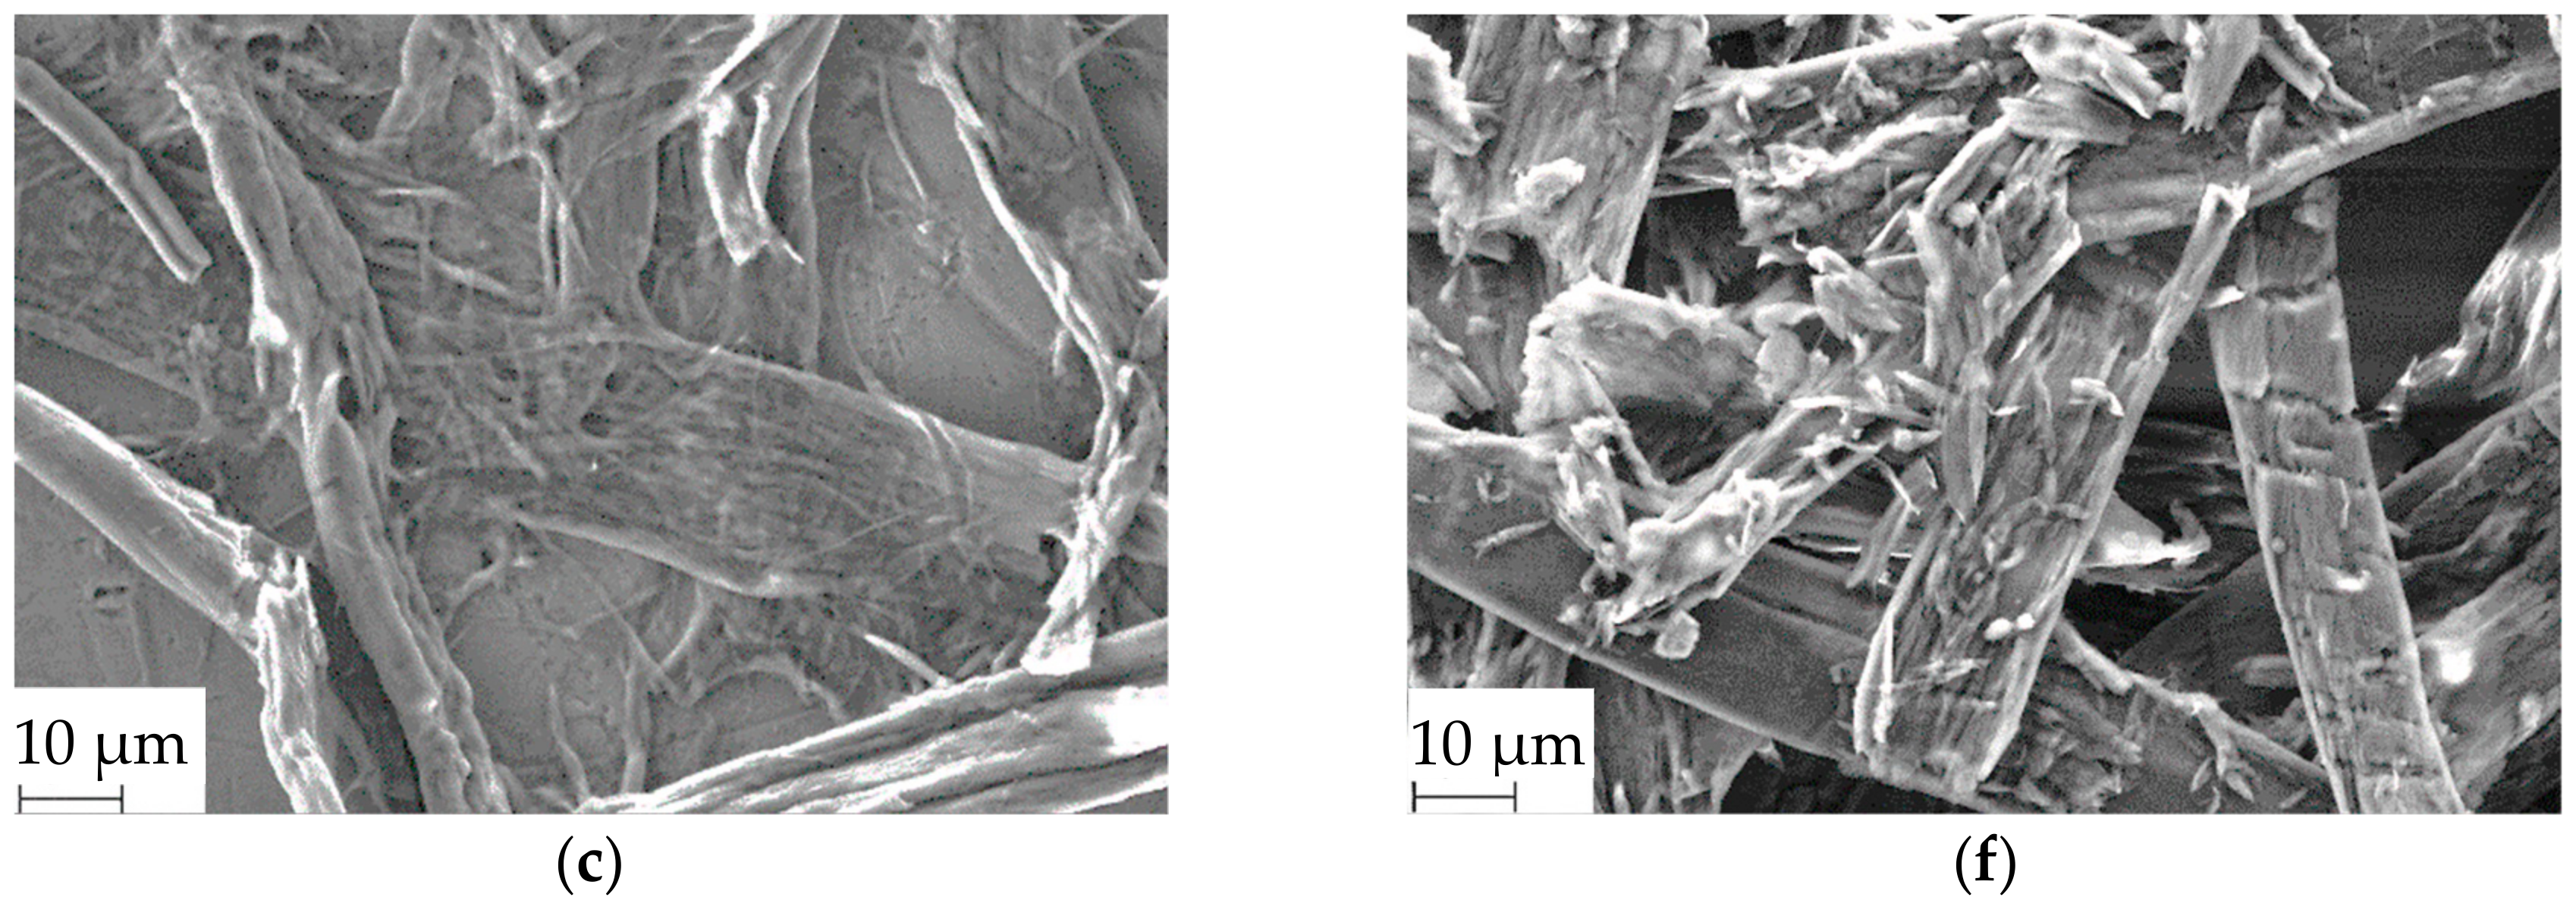
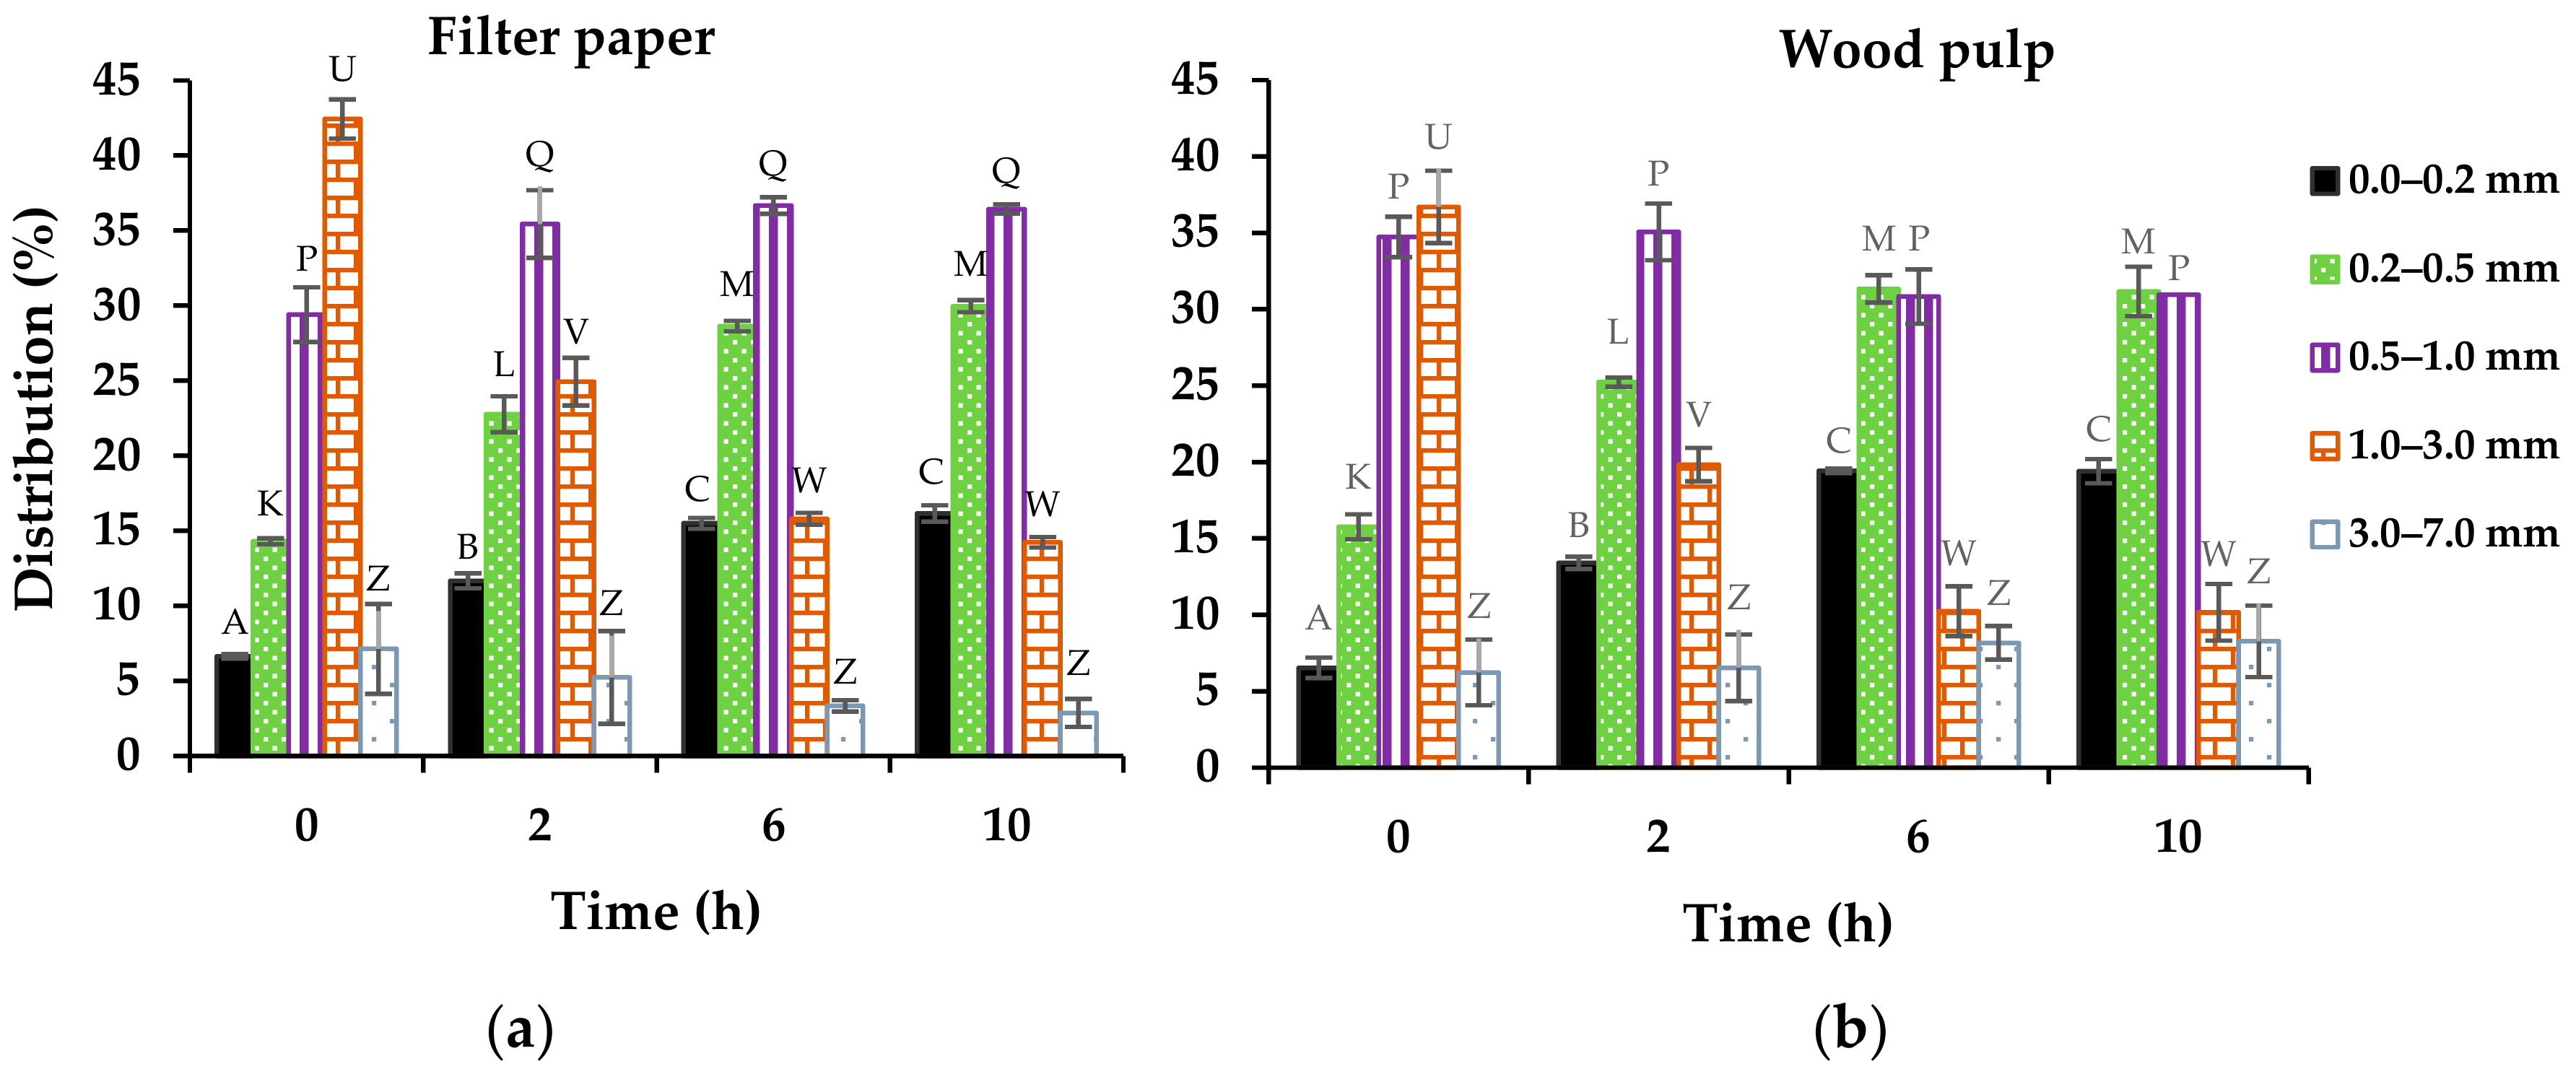
3.1.1. Fiber Structure and Dimension
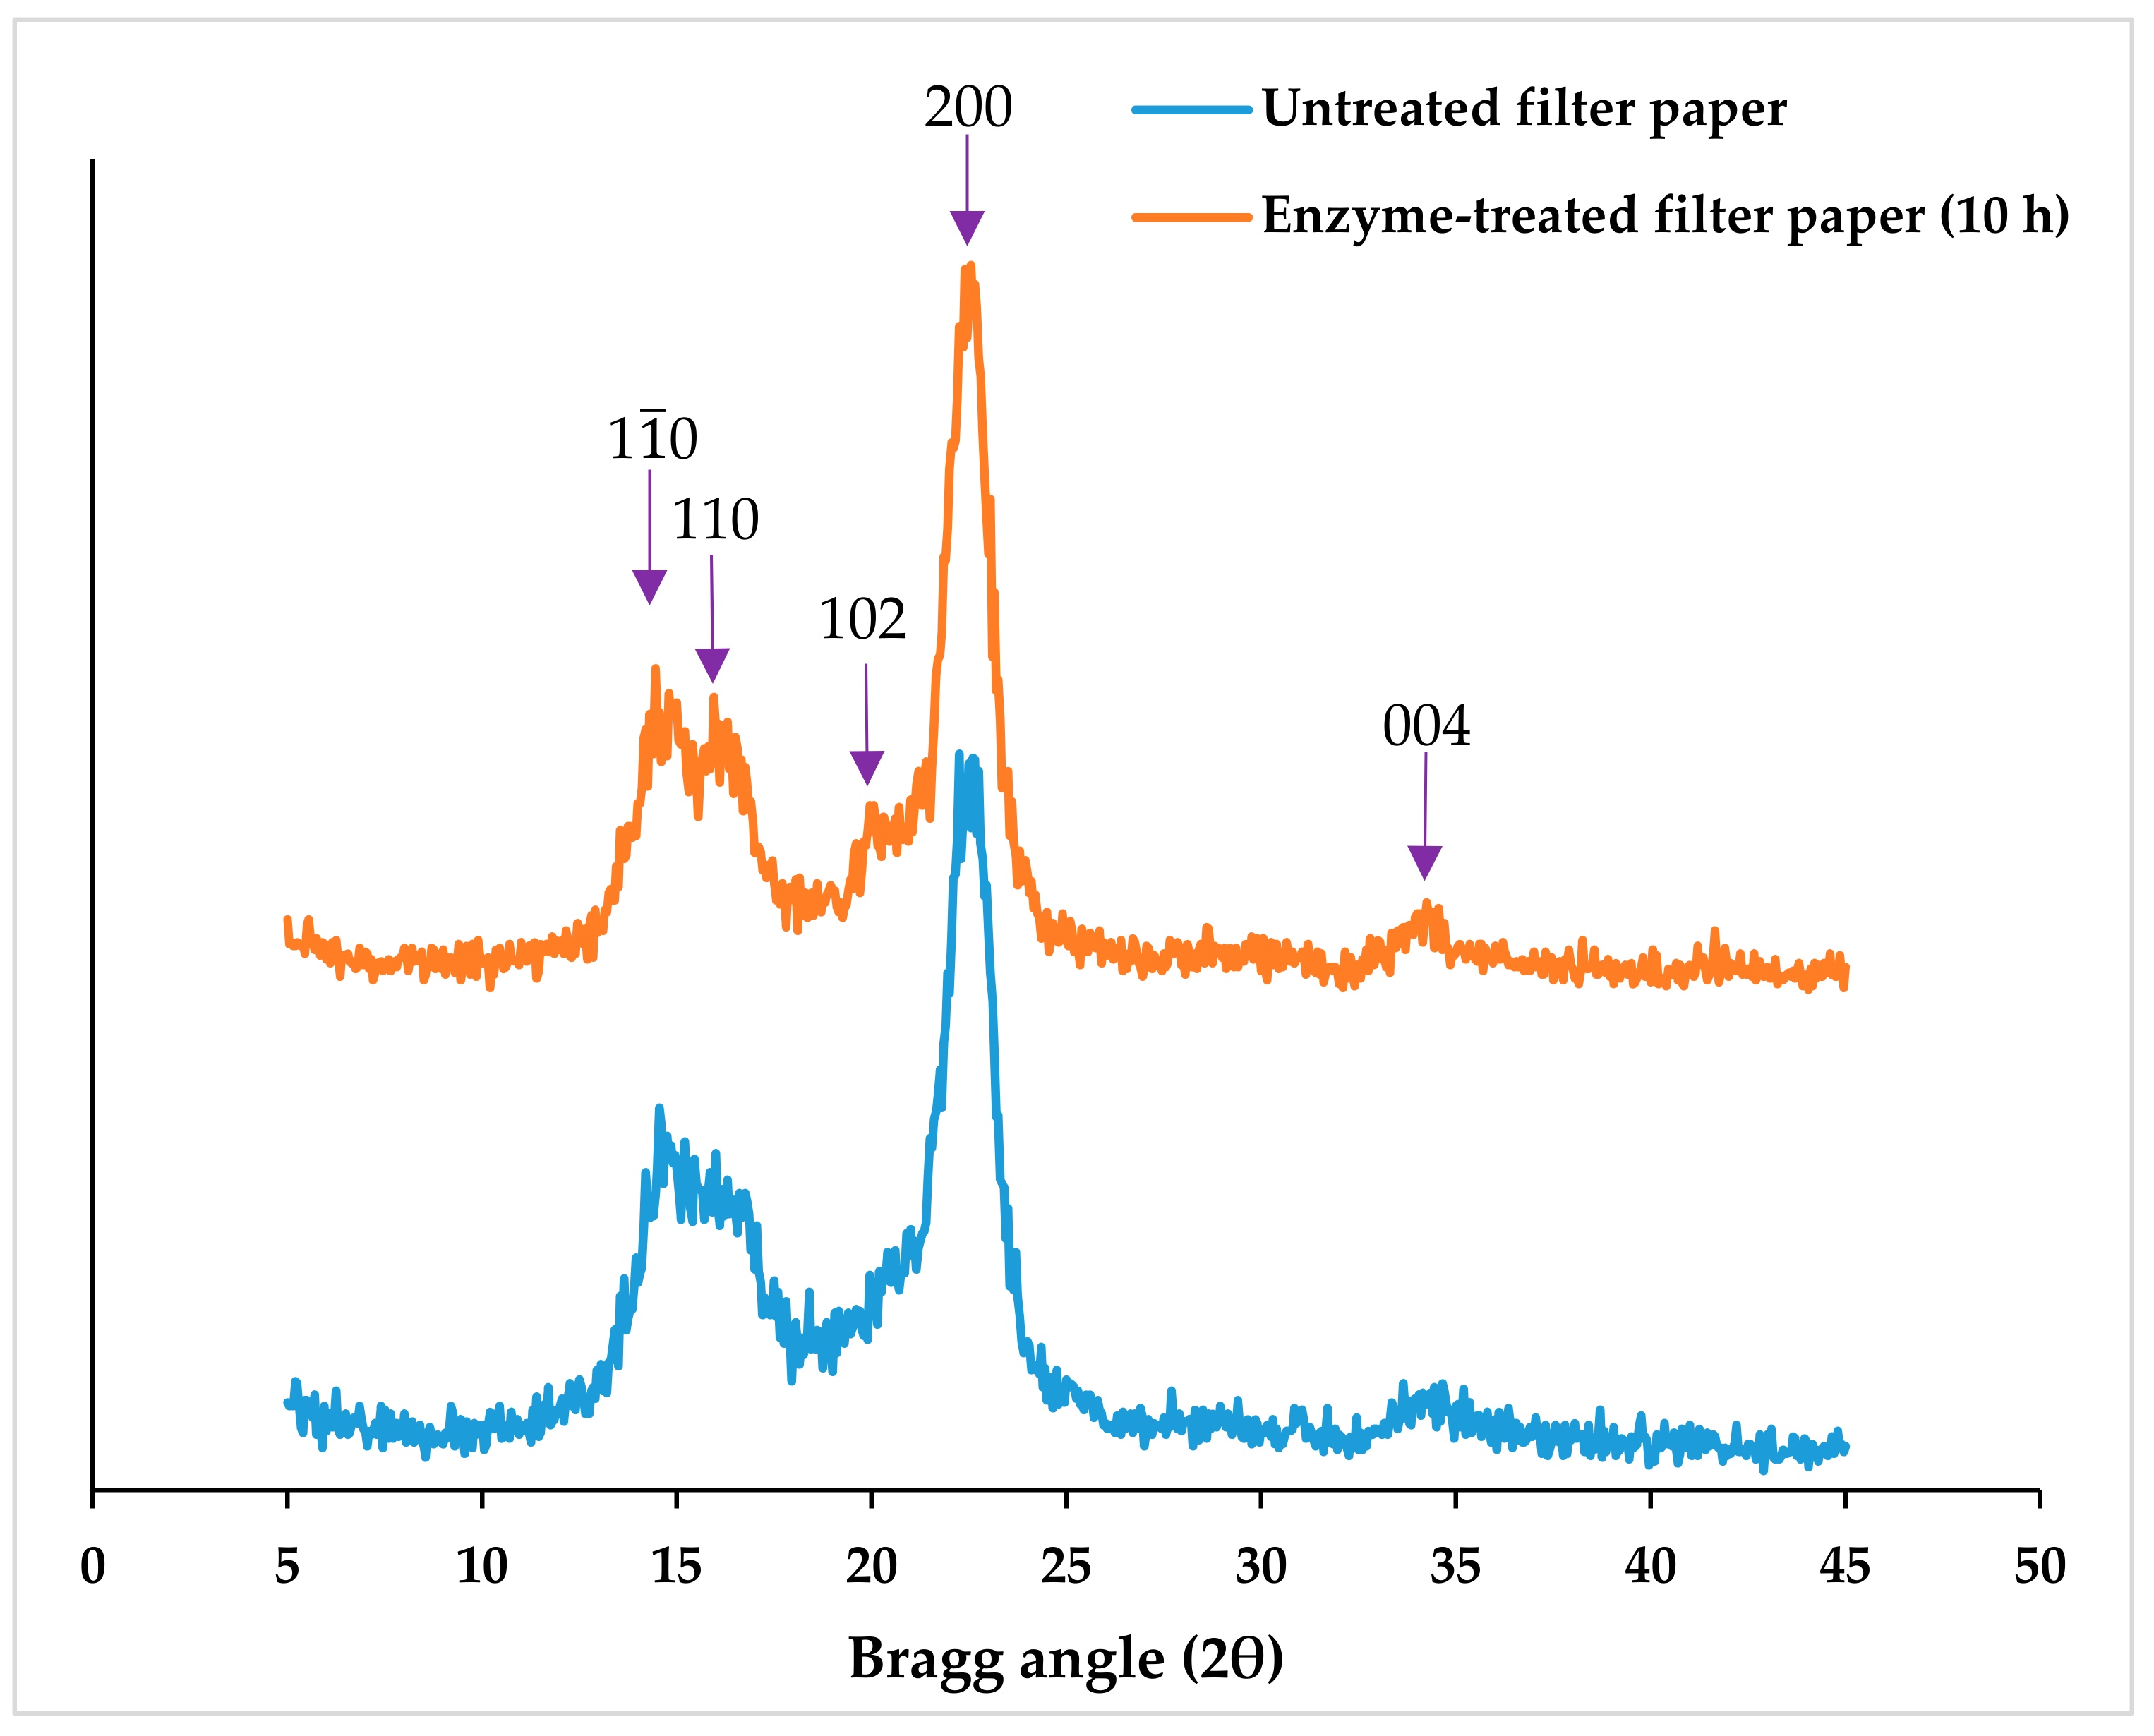
3.1.2. Degree of Crystallinity of Enzyme-treated Fibers
3.2. Characteristics of CNCs Isolated from Enzyme-treated Fibers via Acid Hydrolysis
3.2.1. Particle Size
Dynamic Light Scattering Analysis
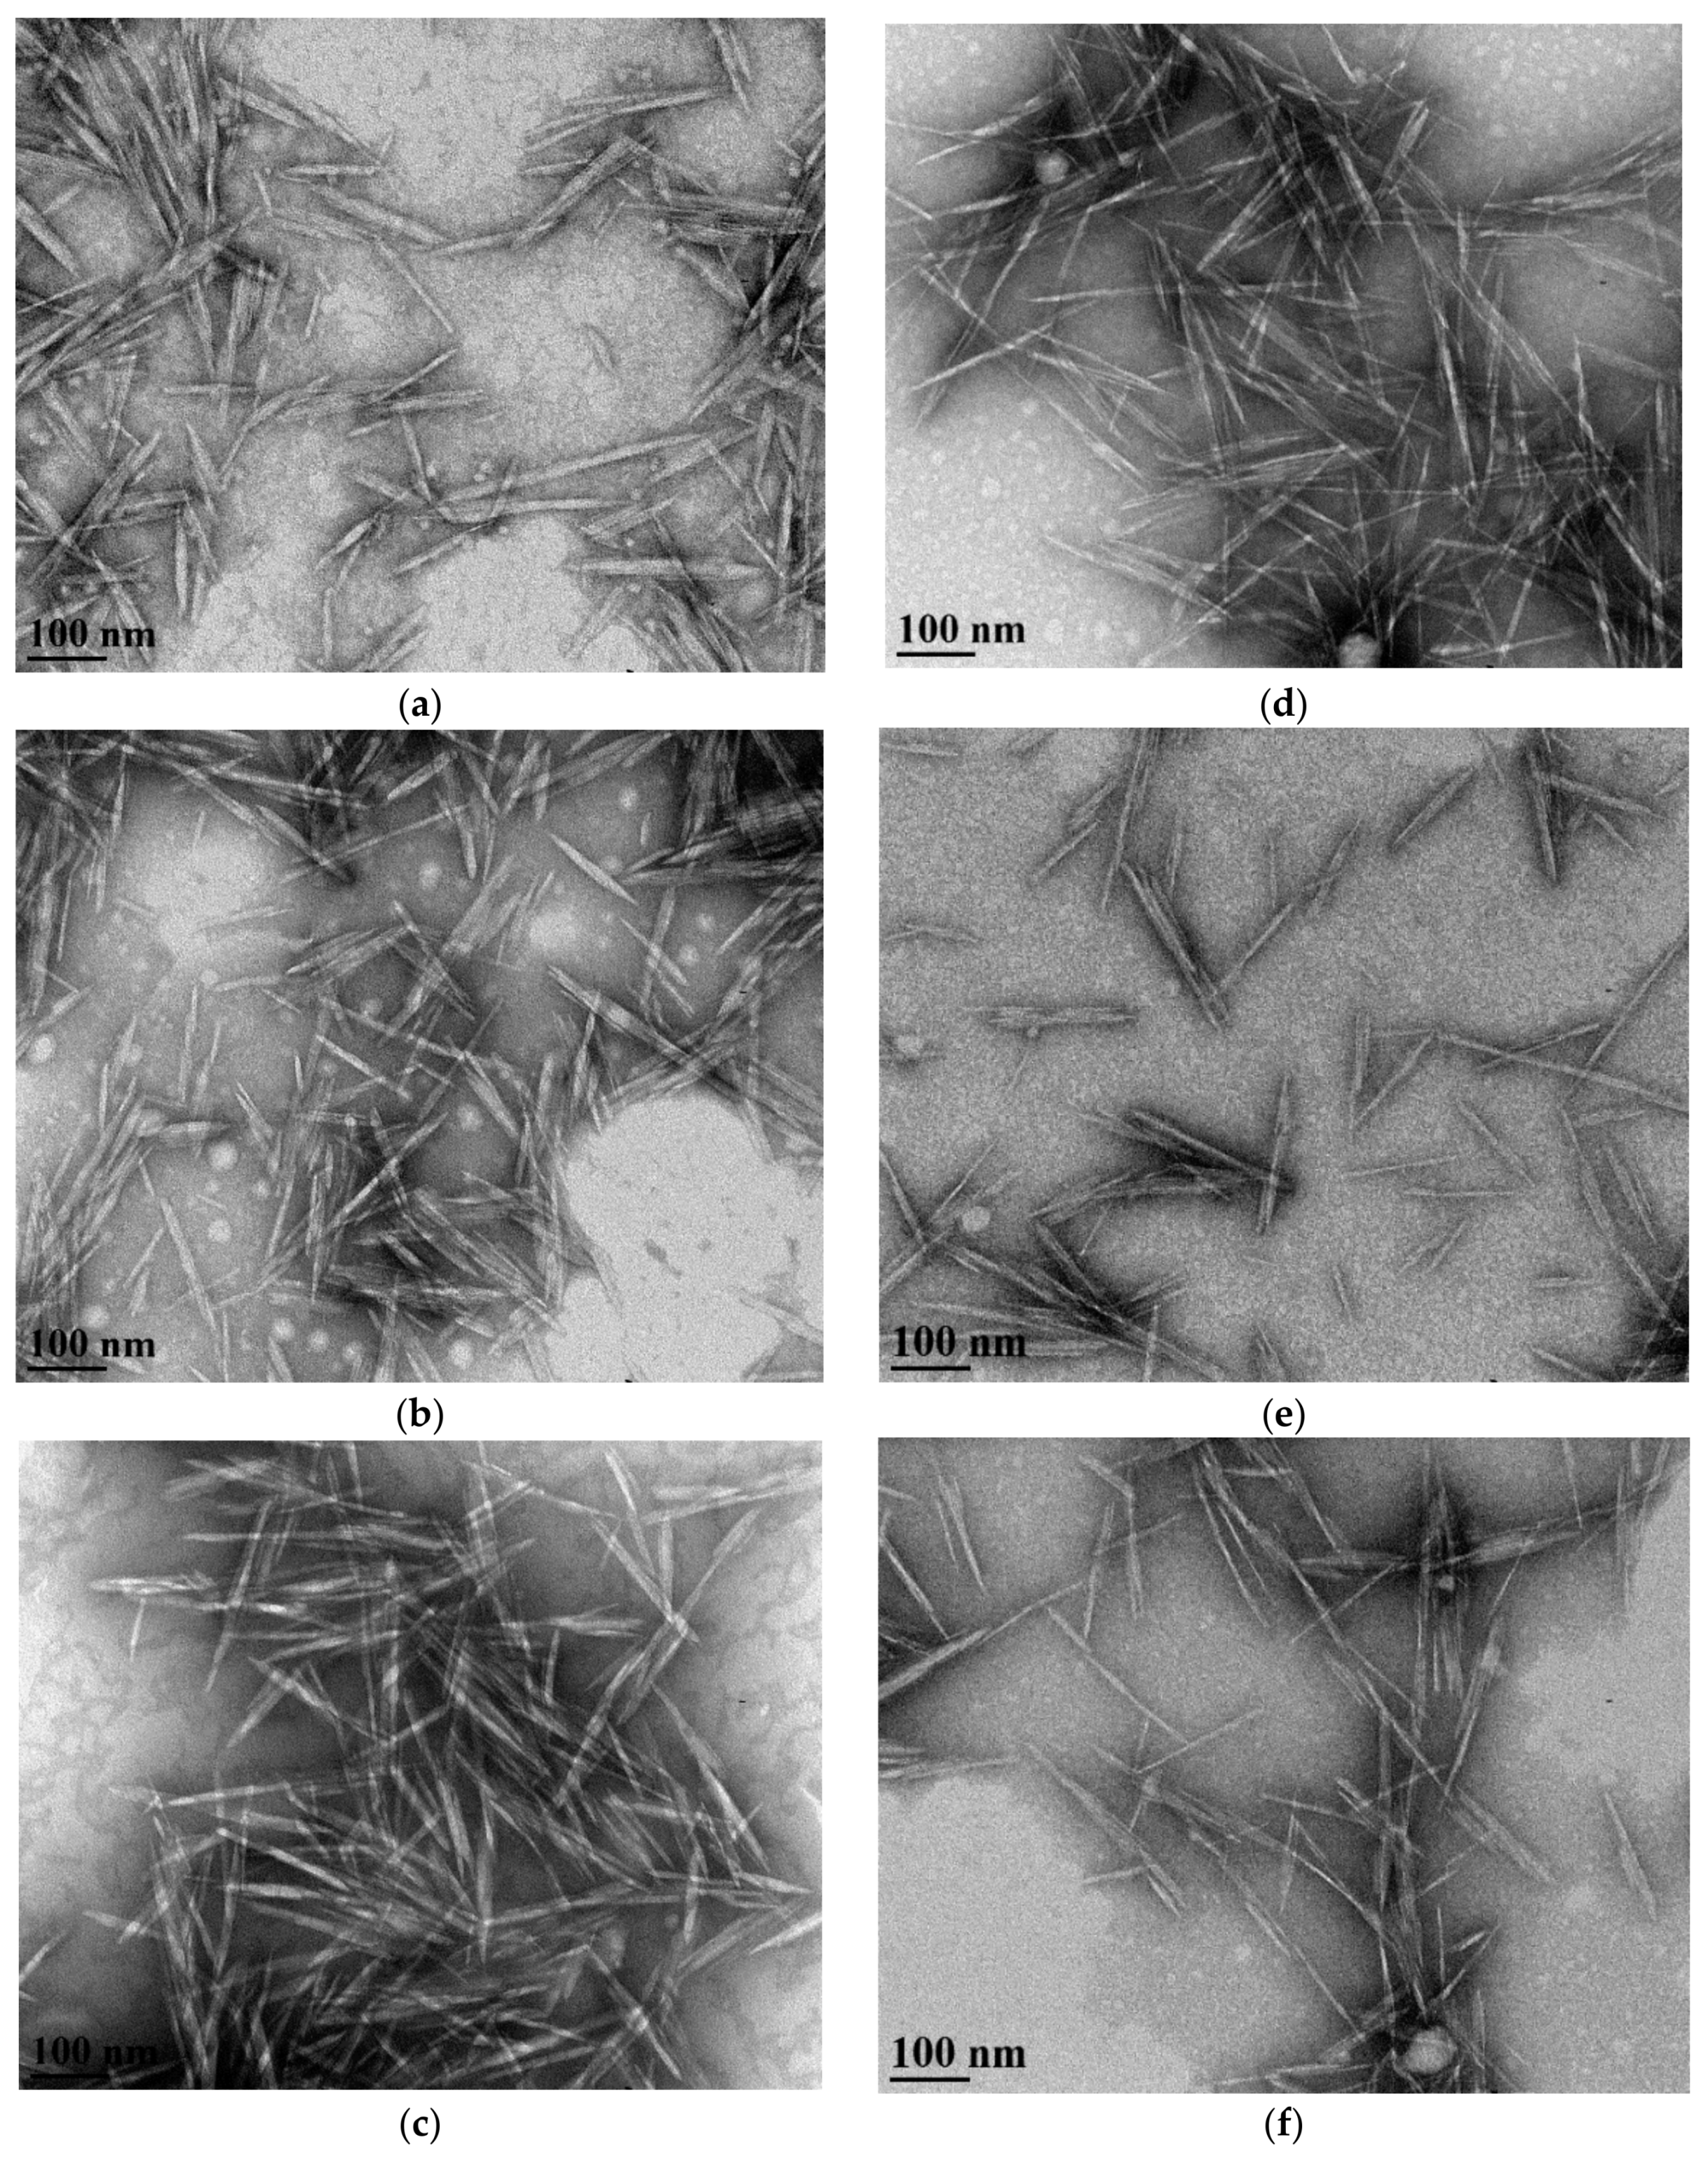
TEM Image Analysis
3.2.2. Zeta Potential Analysis
3.2.3. CNC Degree of Crystallinity
3.2.4. Thermal Stability
4. Conclusions
Author Contributions
Funding
Acknowledgments
Conflicts of Interest
References
- Trache, D.; Hussin, M.H.; Haafiz, M.K.M.; Thakur, V.K. Recent progress in cellulose nanocrystals: Sources and production. Nanoscale 2017, 9, 1763–1786. [Google Scholar] [CrossRef] [PubMed]
- Rusli, R.; Eichhorn, S.J. Determination of the stiffness of cellulose nanowhiskers and the fiber-matrix interface in a nanocomposite using raman spectroscopy. Appl. Phys. Lett. 2008, 93, 033111. [Google Scholar] [CrossRef]
- Mariano, M.; El Kissi, N.; Dufresne, A. Cellulose nanocrystals and related nanocomposites: review of some properties and challenges. J. Polym. Sci. Part B Polym. Phys. 2014, 52, 791–806. [Google Scholar] [CrossRef]
- Wegner, T.H.; Ireland, S.; Jones, J.P. Cellulosic nanomaterials: Sustainable materials of choice for the 21st century. In Production and Applications of Cellulose Nanomaterials; Postek, M.T., Rudie, A.W., Bilodeau, M.A., Eds.; TAPPI Press: Peachtree Corners, GA, USA, 2013; pp. 3–7. ISBN 978-1-59510-224-9. [Google Scholar]
- Boluk, Y.; Zhao, L. Aircraft Anti-Icing Fluids Formulated with Nanocrystalline Cellulose. U.S. Patent US8,105,430 B2, 30 June 2009. Available online: https://patents.google.com/patent/US8105430 (accessed on 4 April 2018).
- Hu, Z.; Patten, T.; Pelton, R.; Cranston, E.D. Synergistic stabilization of emulsions and emulsion gels with water-soluble polymers and cellulose nanocrystals. ACS Sustain. Chem. Eng. 2015, 3, 1023–1031. [Google Scholar] [CrossRef]
- Li, M.C.; Wu, Q.; Song, K.; De Hoop, C.F.; Lee, S.; Qing, Y.; Wu, Y. Cellulose nanocrystals and polyanionic cellulose as additives in bentonite water-based drilling fluids: Rheological modeling and filtration mechanisms. Ind. Eng. Chem. Res. 2016, 55, 133–143. [Google Scholar] [CrossRef]
- Beck-Candanedo, S.; Roman, M.; Gray, D.G. Effect of reaction conditions on the properties and behavior of wood cellulose nanocrystal suspensions. Biomacromolecules 2005, 6, 1048–1054. [Google Scholar] [CrossRef] [PubMed]
- De Morais Teixeira, E.; Corrêa, A.C.; Manzoli, A.; de Lima Leite, F.; de Oliveira, C.R.; Mattoso, L.H.C. Cellulose nanofibers from white and naturally colored cotton fibers. Cellulose 2010, 17, 595–606. [Google Scholar] [CrossRef]
- Rosa, M.F.; Medeiros, E.S.; Malmonge, J.A.; Gregorski, K.S.; Wood, D.F.; Mattoso, L.H.C.; Glenn, G.; Orts, W.J.; Imam, S.H. Cellulose nanowhiskers from coconut husk fibers: effect of preparation conditions on their thermal and morphological behavior. Carbohydr. Polym. 2010, 81, 83–92. [Google Scholar] [CrossRef]
- Lu, P.; Hsieh, Y.-L. Preparation and characterization of cellulose nanocrystals from rice straw. Carbohydr. Polym. 2012, 87, 564–573. [Google Scholar] [CrossRef]
- Kumar, A.; Negi, Y.S.; Choudhary, V.; Bhardwaj, N.K. Characterization of cellulose nanocrystals produced by acid-hydrolysis from sugarcane bagasse as agro-waste. J. Mater. Phys. Chem. 2014, 2, 1–8. [Google Scholar] [CrossRef]
- Sacui, I.A.; Nieuwendaal, R.C.; Burnett, D.J.; Stranick, S.J.; Jorfi, M.; Weder, C.; Foster, E.J.; Olsson, R.T.; Gilman, J.W. Comparison of the properties of cellulose nanocrystals and cellulose nanofibrils isolated from bacteria, tunicate, and wood processed using acid, enzymatic, mechanical, and oxidative methods. ACS Appl. Mater. Interfaces 2014, 6, 6127–6138. [Google Scholar] [CrossRef] [PubMed]
- Rånby, B.G. Aqueous colloidal solutions of cellulose micelles. Acta Chem. Scand. 1949, 3, 649–650. [Google Scholar] [CrossRef]
- Dong, X.M.; Revol, J.-F. Effect of Microcrystallite Preparation Conditions on the Formation of Colloid Crystals of Cellulose. Cellulose 1998, 5, 19–32. [Google Scholar] [CrossRef]
- Bondeson, D.; Mathew, A.; Oksman, K. Optimization of the isolation of nanocrystals from microcrystalline cellulose by acid hydrolysis. Cellulose 2006, 13, 171–180. [Google Scholar] [CrossRef]
- Araki, J.; Wada, M.; Kuga, S.; Okano, T. Flow properties of microcrystalline cellulose suspension prepared by acid treatment of native cellulose. Colloids Surf. A Physicochem. Eng. Asp. 1998, 142, 75–82. [Google Scholar] [CrossRef]
- Lorenz, M.; Sattler, S.; Reza, M.; Bismarck, A.; Kontturi, E. Cellulose nanocrystals by acid vapour: Towards more effortless isolation of cellulose nanocrystals. Faraday Discuss. 2017, 202, 315–330. [Google Scholar] [CrossRef] [PubMed]
- Chen, L.; Wang, Q.; Hirth, K.; Baez, C.; Agarwal, U.P.; Zhu, J.Y. Tailoring the yield and characteristics of wood cellulose nanocrystals (CNC) using concentrated acid hydrolysis. Cellulose 2015, 22, 1753–1762. [Google Scholar] [CrossRef]
- Sinitsyn, A.P.; Gusakov, A.V.; Vlasenko, E.Y. Effect of structural and physico-chemical features of cellulosic substrates on the efficiency of enzymatic hydrolysis. Appl. Biochem. Biotechnol. 1991, 30, 43–59. [Google Scholar] [CrossRef]
- Habibi, Y.; Lucia, L.A.; Rojas, O.J. Cellulose nanocrystals: Chemistry, self-assembly, and applications. Chem. Rev. 2010, 110, 3479–3500. [Google Scholar] [CrossRef] [PubMed]
- Lu, P.; Hsieh, Y.-L. Preparation and properties of cellulose nanocrystals: Rods, spheres, and network. Carbohydr. Polym. 2010, 82, 329–336. [Google Scholar] [CrossRef]
- Revol, J.-F.; Godbout, L.; Gray, D.G. Solid self-assembled films of cellulose with chiral nematic order and optically variable properties. J. Pulp Pap. Sci. 1998, 146–149. [Google Scholar]
- Beltramino, F.; Roncero, M.B.; Vidal, T.; Torres, A.L.; Valls, C. Increasing yield of nanocrystalline cellulose preparation process by a cellulase pretreatment. Bioresour. Technol. 2015, 192, 574–581. [Google Scholar] [CrossRef] [PubMed]
- Paakko, M.; Ankerfors, M.; Kosonen, H.; Nykanen, A.; Ahola, S.; Osterberg, M.; Ruokolainen, J.; Laine, J.; Larsson, P.T.; Ikkala, O.; et al. Enzymatic hydrolysis combined with mechanical shearing and high-pressure homogenization for nanoscale cellulose fibrils and strong gels. Biomacromolecules 2007, 8, 1934–1941. [Google Scholar] [CrossRef] [PubMed]
- Henriksson, M.; Henriksson, G.; Berglund, L.A.; Lindström, T. An environmentally friendly method for enzyme-assisted preparation of microfibrillated cellulose (MFC) nanofibers. Eur. Polym. J. 2007, 43, 3434–3441. [Google Scholar] [CrossRef]
- De Campos, A.; Correa, A.C.; Cannella, D.; de Morais Teixeira, E.; Marconcini, J.M.; Dufresne, A.; Mattoso, L.H.C.; Cassland, P.; Sanadi, A.R. Obtaining nanofibers from curauá and sugarcane bagasse fibers using enzymatic hydrolysis followed by sonication. Cellulose 2013, 20, 1491–1500. [Google Scholar] [CrossRef]
- Lynd, L.R.; Weimer, P.J.; van Zyl, W.H.; Pretorius, I.S. Microbial Cellulose Utilization: Fundamentals and Biotechnology. Microbiol. Mol. Biol. Rev. 2002, 66, 506–577. [Google Scholar] [CrossRef] [PubMed]
- Zhu, J.Y.; Sabo, R.; Luo, X. Integrated production of nano-fibrillated cellulose and cellulosic biofuel (Ethanol) by enzymatic fractionation of wood fibers. Green Chem. 2011, 13, 1339. [Google Scholar] [CrossRef]
- Song, Q.; Winter, W.T.; Bujanovic, B.M.; Amidon, T.E. Nanofibrillated cellulose (NFC): A high-value co-product that improves the economics of cellulosic ethanol production. Energies 2014, 7, 607–618. [Google Scholar] [CrossRef]
- Beyene, D.; Chae, M.; Dai, J.; Danumah, C.; Tosto, F.; Demesa, A.G.; Bressler, D.C. Enzymatically-mediated Co-production of cellulose nanocrystals and fermentable sugars. Catalysts 2017, 7, 322. [Google Scholar] [CrossRef]
- Nordin, J.; Jackson, M.; Skold, H.; Larose, J.-P. Continuous on-line measurement of pulp quality. Pulp Pap. Can. 1993, 94, 100–107. [Google Scholar]
- Finsy, R. Particle sizing by quasi-elastic light scattering. Adv. Colloid Interfacial Sci. 1994, 52, 79–143. [Google Scholar] [CrossRef]
- Bhattacharjee, S. DLS and zeta potential—What they are and what they are not? J. Control. Release 2016, 235, 337–351. [Google Scholar] [CrossRef] [PubMed]
- Boluk, Y.; Danumah, C. Analysis of cellulose nanocrystal rod lengths by dynamic light scattering and electron microscopy. J. Nanopart. Res. 2014, 16, 2174. [Google Scholar] [CrossRef]
- Malvern Instruments. Zetasizer Nano Series User Manual; Malvern Instruments Ltd.: Worcestershire, UK, 2004; Available online: http://www.biophysics.bioc.cam.ac.uk/files/Zetasizer_Nano_user_manual_Man0317-1.1.pdf (accessed on 3 December 2014).
- Segal, L.; Creely, J.J.; Martin, A.E.; Conrad, C.M. An empirical method for estimating the degree of crystallinity of native cellulose using the X-Ray diffractometer. Text. Res. J. 1959, 29, 786–794. [Google Scholar] [CrossRef]
- Wang, Y.; Zhao, Y.; Deng, Y. Effect of enzymatic treatment on cotton fiber dissolution in NaOH/urea solution at cold temperature. Carbohydr. Polym. 2008, 72, 178–184. [Google Scholar] [CrossRef]
- Arantes, V.; Saddler, J.N. Access to cellulose limits the efficiency of enzymatic hydrolysis: The role of amorphogenesis. Biotechnol. Biofuels 2010, 3, 1–11. [Google Scholar] [CrossRef] [PubMed]
- Arantes, V.; Gourlay, K.; Saddler, J.N. The enzymatic hydrolysis of pretreated pulp fibers predominantly involves “peeling/erosion” modes of action. Biotechnol. Biofuels 2014, 7, 87. [Google Scholar] [CrossRef] [PubMed]
- Fan, L.T.; Lee, Y.-H.; David, H. Mechanism of the enzymatic hydrolysis of cellulose—effects of major structural features of cellulose on enzymatic hydrolysis. Biotechnol. Bioeng. 1980, 22, 177–199. [Google Scholar] [CrossRef]
- Lee, S.B.; Kim, I.H.; Ryu, D.D.; Taguchi, H. Structural properties of cellulose and cellulase reaction mechanism. Biotechnol. Bioeng. 1983, 25, 33–51. [Google Scholar] [CrossRef] [PubMed]
- Hall, M.; Bansal, P.; Lee, J.H.; Realff, M.J.; Bommarius, A.S. Cellulose crystallinity—A key predictor of the enzymatic hydrolysis rate. FEBS J. 2010, 277, 1571–1582. [Google Scholar] [CrossRef] [PubMed]
- Ramos, L.P.; Nazhadt, M.M.; Saddler, J.N. Effect of enzymatic hydrolysis on the morphology and fine structure of pretreated cellulosic residues. Enzym. Microb. Technol. 1993, 15, 821–831. [Google Scholar] [CrossRef]
- Park, S.; Baker, J.O.; Himmel, M.E.; Parilla, P.A.; Johnson, D.K. Cellulose crystallinity index: Measurement techniques and their impact on interpreting cellulase performance. Biotechnol. Biofuels 2010, 3, 10. [Google Scholar] [CrossRef] [PubMed]
- Chen, Y.; Stipanovic, A.J.; Winter, W.T.; Wilson, D.B.; Kim, Y.J. Effect of digestion by pure cellulases on crystallinity and average chain length for bacterial and microcrystalline celluloses. Cellulose 2007, 14, 283–293. [Google Scholar] [CrossRef]
- Mansfield, S.D.; de Jong, E.; Stephens, R.S.; Saddler, J.N. Physical characterization of enzymatically modified kraft pulp fibers. J. Biotechnol. 1997, 57, 205–216. [Google Scholar] [CrossRef]
- Shaw, R. Dynamic light scattering training achieving reliable nano particle sizing. Available online: http://149.171.168.221/partcat/wp-content/uploads/Malvern-Zetasizer-LS.pdf (accessed on 16 December 2014).
- Dong, X.M.; Kimura, T.; Gray, D.G. Effects of ionic strength on the isotropic—Chiral nematic phase transition of suspensions of cellulose crystallites. Langmuir 1996, 12, 2076–2082. [Google Scholar] [CrossRef]
- Heux, L.; Chauve, G.; Bonini, C. Nonflocculating and chiral-nematic self-ordering of cellulose microcrystals suspensions in nonpolar solvents. Langmuir 2000, 16, 8210–8212. [Google Scholar] [CrossRef]
- Kvien, I.; Tanem, B.S.; Oksman, K. Characterization of cellulose whiskers and their nanocomposites by atomic force and electron microscopy. Biomacromolecules 2005, 6, 3160–3165. [Google Scholar] [CrossRef] [PubMed]
- Oksman, K.; Etang, J.A.; Mathew, A.P.; Jonoobi, M. Cellulose nanowhiskers separated from a bio-residue from wood bioethanol production. Biomass Bioenergy 2011, 35, 146–152. [Google Scholar] [CrossRef]
- Siqueira, G.; Tapin-Lingua, S.; Bras, J.; da Silva Perez, D.; Dufresne, A. Morphological investigation of nanoparticles obtained from combined mechanical shearing, and enzymatic and acid hydrolysis of sisal fibers. Cellulose 2010, 17, 1147–1158. [Google Scholar] [CrossRef]
- Jacobs, C.; Müller, R.H. Production and characterization of a budesonide nanosuspension for pulmonary administration. Pharm. Res. 2002, 19, 189–194. [Google Scholar] [CrossRef] [PubMed]
- Satyamurthy, P.; Jain, P.; Balasubramanya, R.H.; Vigneshwaran, N. Preparation and characterization of cellulose nanowhiskers from cotton fibres by controlled microbial hydrolysis. Carbohydr. Polym. 2011, 83, 122–129. [Google Scholar] [CrossRef]
- Filson, P.B.; Dawson-Andoh, B.E.; Schwegler-Berry, D. Enzymatic-mediated production of cellulose nanocrystals from recycled pulp. Green Chem. 2009, 11, 1808–1814. [Google Scholar] [CrossRef]
- Hamad, W.Y.; Hu, T.Q. Structure-process-yield interrelations in nanocrystalline cellulose extraction. Can. J. Chem. Eng. 2010, 88, 392–402. [Google Scholar] [CrossRef]
- Yildirim, N.; Shaler, S. A study on thermal and nanomechanical performance of cellulose nanomaterials (CNs). Materials 2017, 10, 718. [Google Scholar] [CrossRef] [PubMed]


| Feedstock | Length (nm) | Width (nm) | Aspect Ratio | Reference |
|---|---|---|---|---|
| Wood | 105–147 | 4.5–5 | 23–31 | [8] |
| Cotton | 130–180 | 10–14 | NR | [9] |
| Coconut fiber | 177–218 | 5–7 | 35–44 | [10] |
| Rice straw | 117–270 | 11–30 | 9–11 | [11] |
| Bagasse | 250–480 | 20–60 | NR | [12] |
| Bacteria | 1103 | 14 | 94 | [13] |
| Tunicate | 1187 | 9 | 148 | [13] |
| Enzymatic Treatment (h) | Filter Paper | Wood Pulp | ||
|---|---|---|---|---|
| Length (mm) | Width (μm) | Length (mm) | Width (μm) | |
| 0 | 1.21 ± 0.10 A | 29 ± 1 a | 1.10 ± 0.01 P | 32 ± 0 p |
| 2 | 0.90 ± 0.11 B | 33 ± 1 b | 0.88 ± 0.07 Q | 37 ± 1 q |
| 6 | 0.71 ± 0.01 B,C | 36 ± 1 b | 0.75 ± 0.07 Q | 42 ± 1 r |
| 10 | 0.68 ± 0.03 C | 35 ± 2 b | 0.75 ± 0.06 Q,* | 41 ± 1 r |
| Enzymatic Treatment (hrs) | Crystallinity Index (%) | |||
|---|---|---|---|---|
| Enzyme-Treated Fiber | CNC Isolated via Acid Hydrolysis | |||
| Filter Paper | Wood Pulp | Filter Paper | Wood Pulp | |
| 0 | 85.9 ± 0.7 A | 76.6 ± 0.8 P | 88.2 ± 0.5 A | 80.2 ± 0.9 P |
| 2 | 87.3 ± 1.0 A,B | 75.9 ± 1.8 P | 87.6 ± 0.9 A,B | 80.7 ± 3.5 P |
| 6 | 88.6 ± 0.6 B | 76.0 ± 1.4 P | 86.0 ± 0.6 B | 78.5 ± 2.2 P |
| 10 | 88.4 ± 0.4 B,* | 78.0 ± 1.8 P | 88.9 ± 0.3 A,* | 80.9 ± 0.8 P |
| Enzymatic Treatment (h) | Filter Paper | Wood Pulp | ||||
|---|---|---|---|---|---|---|
| Average Hydrodynamic Diameter (nm) † | Intensity Abundance (%) | Zeta Potential (mV) | Average Hydrodynamic Diameter (nm) | Intensity Abundance (%) | Zeta Potential (mV) | |
| 0 | 294 ± 51 A | 81 ± 12 | –40.5 ± 2.5 a | 245 ± 63 P | 80 ± 8 | –39.8 ± 3.6 p |
| 2 | 229 ± 53 B | 87 ± 11 | –41.9 ± 1.5 a,b | 225 ± 12 P | 96 ± 4 | –42.6 ± 1.4 p |
| 6 | 213 ± 9 B | 94 ± 4 | –43.8 ± 0.8 b | 243 ± 45 P | 83 ± 12 | –42.6 ± 3.5 p |
| 10 | 209 ± 14 B,* | 99 ± 2* | –43.8 ± 0.6 b,* | 205 ± 16 P | 90 ± 5 | –38.9 ± 2.7 p |
| Enzymatic Treatment (h) | Filter Paper | Wood Pulp | ||||
|---|---|---|---|---|---|---|
| Length (nm) | Width (nm) | Aspect Ratio * | Length (nm) | Width (nm) | Aspect Ratio | |
| 0 | 116 ± 30 A | 8.8 ± 2.5 a | 13.2 ± 3.6 E,F | 113 ± 30 P,Q | 9.2 ± 3.3 p | 13.4 ± 5.1 W |
| 2 | 138 ± 44 B | 10.2 ± 3.0 b | 13.5 ± 3.8 E,F | 126 ± 42 P | 6.8 ± 2.1 r | 18.8 ± 5.4 X |
| 6 | 123 ± 45 A,B | 9.8 ± 3.0 a,b | 12.0 ± 3.7 E | 109 ± 33 Q | 7.9 ± 1.9 q | 14.0 ± 4.4 W |
| 10 | 134 ± 40 A,B,* | 9.5 ± 3.1 a,b,* | 15.1 ± 7.0 F,* | 123 ± 32 P | 7.6 ± 2.3 q,r | 17.5 ± 7.3 X |
| Enzymatic Treatment (h) | Temperature for Maximum Rate of Weight Loss %/°C | |
|---|---|---|
| Filter Paper (°C) | Wood Pulp (°C) | |
| 0 | 290 ± 32 A | 301 ± 2 P |
| 2 | 310 ± 1 A | 303 ± 0 P,Q |
| 6 | 311 ± 1 A | 302 ± 1 P,Q |
| 10 | 310 ± 2 A | 305 ± 1 Q |
© 2018 by the authors. Licensee MDPI, Basel, Switzerland. This article is an open access article distributed under the terms and conditions of the Creative Commons Attribution (CC BY) license (http://creativecommons.org/licenses/by/4.0/).
Share and Cite
Beyene, D.; Chae, M.; Dai, J.; Danumah, C.; Tosto, F.; Demesa, A.G.; Bressler, D.C. Characterization of Cellulase-Treated Fibers and Resulting Cellulose Nanocrystals Generated through Acid Hydrolysis. Materials 2018, 11, 1272. https://doi.org/10.3390/ma11081272
Beyene D, Chae M, Dai J, Danumah C, Tosto F, Demesa AG, Bressler DC. Characterization of Cellulase-Treated Fibers and Resulting Cellulose Nanocrystals Generated through Acid Hydrolysis. Materials. 2018; 11(8):1272. https://doi.org/10.3390/ma11081272
Chicago/Turabian StyleBeyene, Dawit, Michael Chae, Jing Dai, Christophe Danumah, Frank Tosto, Abayneh Getachew Demesa, and David C. Bressler. 2018. "Characterization of Cellulase-Treated Fibers and Resulting Cellulose Nanocrystals Generated through Acid Hydrolysis" Materials 11, no. 8: 1272. https://doi.org/10.3390/ma11081272
APA StyleBeyene, D., Chae, M., Dai, J., Danumah, C., Tosto, F., Demesa, A. G., & Bressler, D. C. (2018). Characterization of Cellulase-Treated Fibers and Resulting Cellulose Nanocrystals Generated through Acid Hydrolysis. Materials, 11(8), 1272. https://doi.org/10.3390/ma11081272